

Summary
Intestinal intraepithelial lymphocytes (IELs) are located at the critical interface between the intestinal lumen, which is chronically exposed to food and microbes, and the core of the body. Using high-resolution microscopy techniques and intersectional genetic tools, we investigated the nature of IEL responses to luminal microbes. We observe that TCRγδ IELs exhibit unique location and movement patterns in the epithelial compartment that are microbiota-dependent. This behavioral pattern quickly changes upon exposure to different enteric pathogens, resulting in increased inter-epithelial cell (EC) scanning, expression of anti-microbial gene expression and glycolysis. Both γδ IEL dynamic and metabolic changes depend on pathogen sensing by ECs. Direct modulation of glycolysis is sufficient to change γδ IEL behavior and susceptibility to early pathogen invasion. Our results uncover a coordinated EC–IEL response to enteric infections that modulates lymphocyte energy utilization and dynamics and supports maintenance of the intestinal epithelial barrier.
eTOC
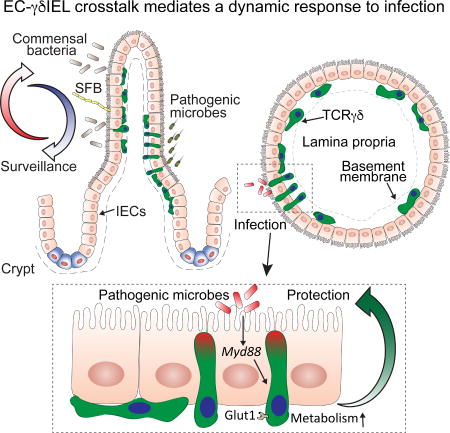
Communication between epithelial cells and intraepithelial lymphocytes guides lymphocyte energy utilization and dynamic behavior, helping to support maintenance of the intestinal epithelial barrier during infections.
Introduction
In order to function properly, the immune system depends on the capacity of its cells to surveil compartments of the body and respond to particular environmental cues. Intestinal intraepithelial lymphocytes (IELs) comprise one of the most abundant T cell populations and potentially provide a first line of immune defense against pathogens via their location at the critical interface between the intestinal lumen and the core of the body (Jabri and Abadie, 2015). IELs constitute a heterogeneous group of “activated yet resting” T lymphocytes characterized by high expression levels of activation markers, gut-homing integrins, NK-like receptors, cytotoxic T lymphocyte (CTL)-related genes and anti-inflammatory or inhibitory receptors (Cheroutre et al., 2011). The main populations of “natural” IELs are TCRγδ+CD8αα+ and TCRαβ+CD8αα+ cells. Additionally, peripheral, mature TCRαβ CD4+ and CD8+ T cells can acquire IEL markers upon migration to the intestine (“peripheral” IELs) (Cheroutre et al., 2011).
Irrespective of subtype, tightly regulated control of IEL function is crucial for the maintenance of the epithelial cell barrier and gut physiological inflammation (Tang et al., 2009). Inappropriate activation of the CTL capacity of IELs can induce chronic inflammatory disorders such as celiac disease and IBD (Meresse et al., 2006; Tang et al., 2009), while a lack of IELs leads to impaired protection against bacterial infection (Ismail et al., 2011). Although marker-based studies underscore several features related to the phenotype, development and migration of IELs (Meresse et al., 2004; Meresse et al., 2006; Reis et al., 2014; Sujino et al., 2016), dissecting the role played by these cells under homeostatic and pathophysiological conditions has been hampered by their poor survival in culture and difficulty assessing IEL function in vivo (Cheroutre et al., 2011; Edelblum et al., 2012; Edelblum et al., 2015; Vantourout and Hayday, 2013).
To investigate how IELs respond to enteric microbes, we established intravital and 3D deep-tissue imaging tools in mouse models of infection or microbiota manipulation. We found that γδ IELs are predominantly located in the middle and upper region of intestinal villi, are highly motile, and display a structured migration pattern, suggesting an epithelial surveillance program. Pathogenic bacterial or protozoan infections induced a dynamic response by γδ IELs, rapidly changing their motility and pattern of movement between intestinal epithelial cells (ECs). This swift γδ IEL response was associated with enhanced anti-microbial gene expression and a metabolic switch towards glycolysis, even in the absence of active proliferation. Pharmacological and genetic manipulation of energy utilization pathways recapitulated infection-induced changes and resulted in altered susceptibility to early pathogen invasion. Using inducible, EC-specific Myd88 conditional knockout mice, we demonstrated that the γδ IEL metabolic switch, movement behavior and immune response required pathogen sensing by surrounding ECs. Our results uncover a coordinated EC–IEL response to luminal microbes that modulates lymphocyte energy utilization and cell dynamics within the epithelium, thus supporting the maintenance of epithelial barrier defense.
Results
γδ IELs display microbe-dependent motility patterns
The gut epithelial compartment represents a spectrum of increasingly differentiated intestinal epithelial cells (ECs) from crypt to villus tip, which corresponds to increasing levels of microbe exposure (Ismail et al., 2011). Likewise, microbial content and diversity increases from proximal (duodenum) to distal (ileum) small intestine and to large intestine. Additionally, the number and distribution of IEL subpopulations also significantly changes along the intestine. While germ-free (GF) mice show drastic reductions in “peripheral” IEL numbers and frequency along the intestine when compared to their conventionally-housed, specific pathogen-free (SPF) counterparts (Bandeira et al., 1990; Sujino et al., 2016), overall numbers of “natural IELs” remain mostly intact, particularly γδ IELs (Fig. S1A). To define γδ IEL localization within the intact epithelial compartment, we performed tissue clearing using iDISCO (stronger fixation leading to loss of endogenous fluorescence) or FocusClear™ (milder fixation protocol, endogenous fluorescence is maintained) and subsequent deep-tissue 3D imaging of intact small intestine segments from TCRγδGFP reporter mice using light-sheet, confocal and multi-photon microscopy (Gabanyi et al., 2016). Resulting images and automated quantification revealed that the majority of γδ IELs accumulate in the middle of the villus with fewer cells in the tip or bottom of the villus, including the crypts (Movie S1A, B; Figure S1B, C; Figure 1A, B). Both iDISCO and FocusClear™ identified similar IEL localization in the tissue, and this localization was also seen by conventional immunofluorescence analysis (Fig. S1D). To address how luminal microbes influence γδ IEL localization, we re-derived TCRγδGFP reporter mice into germ-free (GF) conditions. A significant shift towards the crypts was observed for γδ IELs in the duodenum, jejunum and ileum of GF animals. In contrast to SPF mice, we did not observe γδ IEL accumulation in one region of the villus (Figure S1B, C; Figure 1A, B). Conventionalization of GF TCRγδGFP mice with microbiota from SPF TCRγδGFP mice rescued IEL positioning in the ileum, while broad-spectrum antibiotic treatment of SPF TCRγδGFP mice mirrored GF IEL positioning (Figure 1B, Figure S1E). A microbe-dependent IEL repositioning in the tissue was also observed in GF mice mono-associated with segmented filamentous bacteria (SFB), a commensal bacterium that primarily associates with ileal ECs (Sano et al., 2015) (Figure S1F; Figure 1C). To a lesser extent (not significant), IEL repositioning was also observed in the ileum of GF mice bi-associated with Bacteroides vulgatus and Enterococcus faecalis, commensal bacterial species that primarily colonize distal small intestine and large intestine – or in GF and ABX-treated SPF mice exposed to LPS in their drinking water (Figure S1E–G; Figure 1C). These results suggest that a microbiota-sensing mechanism operates in the intestine to determine γδ IEL intra-tissue distribution.
Figure 1. Steady-state behavior of intestinal IELs.

(A) Representative image of cleared (FocusClear™) duodenum villi of SPF and GF TCRγδGFP mice (see Movies S1A, 1B). In green (GFP), TCRγδ+ cells and in blue (Hoechst), EC nuclei. (B) Frequency of TCRγδ+ cell distribution along the villi of SPF, GF or GF mice re-conventionalized for 7 days with SPF microbiota (GFreconv). Dashed line indicates mean of median positions for 4 mice/group. (C) Frequency of TCRγδ+ cell distribution along the ileum villi of GF mice, mono-colonized for 5 days with SFB (GFSFB), bi-colonized for 5 days with Bacteroides vulgatus + Enterococcus faecalis (GFB.v. + E.f.) or treated for 7 days with LPS (GFLPS). Dashed line indicates mean of median positions for 3 – 4 mice/group. Grey shading shows GF data as found in 1A. (D–H) Intravital microscopy (IVM) analyses of TCRγδGFP SPF, GF, GFreconv, GFSFB, GFB.v. + E.f. or GFLPS mice (see Movies S2A–D). (D, E) 4D tracking of TCRγδGFP cells (colorful lines, left panels) was performed. (D, E) 3D reconstruction (grey cylinders, right panels) of the area in a villus covered by TCRγδGFP cells in 30 mins. (F) Quantification of unique area covered/IEL/hour. Means and SEM shown, each dot = 1 movie, n = at least 4 mice/group in 3 independent experiments. (G, H) Visualization (G) and quantification (H) of TCRγδ vertical (Z) displacement. Pooled imaging data from SPF, GF, GFreconv, GFSFB, GFB.v. + E.f. and GFLPS mice is shown. Panels show starting position and mean vertical displacement over time for each individual cell within each movie. Color density and size indicate degree of Z displacement down- (blue) or upwards (red). Graph shows mean and SEM of Z displacement per anatomical villus region as indicated. * = p<0.05, ** = p<0.01, *** = p<0.001 with ANOVA and post-hoc Bonferroni multiple comparison test (B, C, F, H). See also Figure S1.
We next used deep (+/− 80 µm) multi-photon intra-vital microscopy (IVM) to gain insight into the cell dynamics associated with γδ IEL distribution. Previous reports using time-lapse live imaging of superficial 15 µm villus sections revealed that γδ IELs are highly dynamic and able to respond to directly applied pathogenic bacteria (Edelblum et al., 2012; Edelblum et al., 2015). Our live 4D imaging and supervised quantification showed that under homeostatic conditions γδ IELs migrate almost exclusively in the space between the epithelial layer and the basement membrane, rapidly covering the entirety of the villous epithelium (Movie S2A). Both 3D and live 4D analyses failed to detect a substantial presence of γδ IELs in the center axis of the villus or lamina propria compartment, contrasting previous analyses that utilized 15 µm tissue-sections (Edelblum et al., 2012; Edelblum et al., 2015). We found that in naïve SPF mice, a single γδ IEL covered about 950 µm2 of unique basolateral epithelial surface area (or ~2.2% of a villus) per hour. In contrast, each γδ IEL from GF or SPF mice treated with broad-spectrum antibiotics covered only roughly 650 µm2 of unique area (or 1.5% of the villus epithelium) per hour (Movie S2B, C; Figure 1D–F), despite the overall maintenance of a cell speed of ~6 µm/min (Figure S1H). Furthermore, at one-week post conventionalization of GF mice we observed a partial recovery of γδ IEL area coverage (Movie S2D; Figure 1F). Similar to their tissue distribution, IEL dynamics required specific microbial cues. SFB mono-associated, but neither B.v. + E.f. bi-associated, nor LPS-treated GF mice or LPS-exposed ABX pre-treated SPF mice showed recovery of IEL area coverage, suggesting that attachment to ECs may be a determinant (Figure S1I; Figure 1F). Because our cleared tissue analyses indicated that γδ IEL positioning within the villi is influenced by the microbiota, we also quantified their vertical displacement using IVM. IELs occupying the tips of villi or the regions closer to the crypt showed a strong vertical migration pattern (Figure 1G, H). Nevertheless, the γδ IEL downward displacement exceeded the upward, with net displacement for γδ IELs around 4–6 µm/hour towards the crypts. GF mice showed a significantly altered γδ IEL vertical displacement and reduced total net displacement to roughly 0.5 µm/hour (Figure 1G, H). Conventionalization of GF mice with total SPF microbiota or with SFB rescued γδ IEL vertical displacement, while four-week treatment of SPF mice with broad-spectrum antibiotics mirrored GF γδ IEL dynamics (Figure S1J; Figure 1G, H). These results suggest that population migration dynamics of non-renewing γδ IELs may represent an active mechanism for their retention in the rapidly renewing epithelial layer that is modulated by microbe exposure. Together, the above data indicate that the motility of γδ IELs along the epithelial layer is directed by commensal bacteria, resulting in an organized surveillance behavior able to cover the entire epithelial surface within hours.
Infection induces rapid behavioral changes in TCRγδ+ IELs
The observation of a microbiota-dependent IEL epithelial motility pattern in the steady state led us to speculate about a possible role for this behavior in responses to enteric infections, previously suggested by studies using TCRγδ-deficient mice (Ismail et al., 2011; Li et al., 2012) and time-lapse imaging of intestinal tissue bathed in medium containing Salmonella (Edelblum et al., 2015). We first analyzed γδ IEL behavior after oral infection with either wild-type Salmonella enterica Typhimurium or a mutant invA strain with reduced pathogenicity due to its impaired invasion capacity. While γδ T cells in both naïve and infected mice maintained their presence almost exclusively in the epithelial compartment, the motility pattern of these cells changed sharply upon infection. As early as two hours post-infection with Salmonella, γδ IELs covered a reduced area, and their movement became serpentine with significantly increased movement between ECs and into the lateral intercellular spaces, a behavior we denominated “flossing”. This flossing movement doubled upon infection despite the overall maintenance of a cell speed of ~6 µm/min (Movie S3A; Figure S2A, Figure 2A–D). This pattern persisted for at least 18 hours in mice infected with wild-type Salmonella, but was significantly reduced in mice infected with the invA mutant, suggesting that invasion or persistence of the pathogen is required to sustain this behavior (Movie S3B; Figure 2A–D). While flossing occurred sporadically and at a lower frequency (around 35 flosses/100 cells) in naïve mice, regions with a high frequency of flossing (“hotspots”) were observed in Salmonella-infected animals, particularly at lower regions of the villi (Figure S2B; Figure 2E). To address whether these flossing hotspots correlated with areas with high pathogen burden, we infected TCRγδGFP mice with SalmonellamCherry and performed IVM. We observed flossing hotspots nearby Salmonella-rich areas, although both hotspots and Salmonella appeared evenly distributed (Movie S3C; Figure 2F). While SalmonellamCherry were found only in the ileum at this time point (towards the crypt region), Salmonella infection triggered general changes in IEL distribution, including in the proximal small intestine (Figure S2C, D; Figure 2G). γδ IELs from wild-type Salmonella-infected mice showed reduced vertical displacement with an increased shift of γδ IEL distribution towards the bottom parts of villi (Figure S2C, D; Figure 2H). These analyses indicate that Salmonella infection swiftly induces a set of motility changes in γδ IELs that is distinct from the one observed in response to commensal microbes.
Figure 2. Influence of enteric infections on IEL.

(A–F) IVM analyses of TCRγδGFP mice post S. Typhimurium (or invA mutant) infection. (A) Zoom of 1 villus showing a flossing (arrow) movement. (B) 4D tracking of TCRγδGFP cells (colorful lines) was performed. Line delineates the intraepithelial (IE) compartment. Arrow shows tracked flossing movements. LP = Lamina Propria, Lu = lumen. (C) Unbiased computational quantification (mean and SEM) of flossing (see Movies S3A, B). Each dot = 1 movie, n = at least 4 mice/group in 3 independent experiments. (D) Means and SEM of TCRγδGFP cell speed are shown for indicated infections and timepoints, each dot = 1 movie. (E) Representative visualization of frequency of overlapping flossing events (“hotspots”) at unique coordinates, ranging from 0 (grey) to 3 or more (maroon). Luminal to crypt orientation of a 3D plot is shown. (F) Representative visualization of hotspots, ranging from 0 (grey) to 3 or more (cyan), as in 2E. Plot is overlaid on the corresponding still image of IVM imaging of TCRγδGFP mice post S. TyphimuriummCherry (magenta, arrows) infection. (See Movie S2C) (G) Frequency of TCRγδGFP cell distribution along cleared villi of 2h or 18h S. Typhimurium-infected and naïve TCRγδGFP mice. Dashed line indicates mean of median positions for 4 mice/group. (H) IVM visualization and quantification of TCRγδ vertical (Z) displacement, as in 1G and 1H. Dashed line indicates SPF naïve values (Fig. 1). N = at least 4 mice/group in min. 3 independent experiments. (I) Unbiased computational quantification of flossing movements 6 and 72 h after infection with 25 cysts of Toxoplasma gondii visualized by IVM (see Movie S3C). Dashed line indicates SPF naïve values (Fig. 1). Each dot = 1 mouse. (J) Representative visualization of frequency of hotspots as in 2E. (K) Representative visualization of hotspots as in 2F. Plot is overlaid on the corresponding still image of IVM imaging of TCRγδGFP mice post infection with ToxoplasmaRFP (magenta, arrow). (See Movie S3E) (L) Visualization and quantification of TCRγδ vertical (Z) displacement. Pooled imaging data (as in H) from mice at indicated time points after Toxoplasma infection with indicated number of cysts is shown. Dashed line indicates SPF naïve values (Fig. 1). N = at least 4 mice/group from 3 independent experiments. * = p<0.05, ** = p<0.01, *** = p<0.001 with ANOVA and post-hoc Bonferroni multiple comparison test (C), Student’s t test (G–I, L: all vs. SPF naïve). See also Figure S2.
To evaluate whether this γδ IEL behavioral response to Salmonella could be extended to additional small intestine pathogens, we also investigated IEL movement following Toxoplasma gondii infection, another pathogen to which IEL function has been previously linked (Dalton et al., 2006; Edelblum et al., 2015; Li et al., 2012). We found that infection with as few as 25 Toxoplasma cysts drastically altered γδ IEL behavior in a manner similar to that observed during wild-type Salmonella infection, inducing roughly 100 flosses/100 cells per hour, preferentially at hotpots (Movie S3D; Figure S2B, E; Figure 2I, J). However, hotspots after Toxoplasma infection were observed both in the lower regions and upper regions closer to tips of the villi (Figure S2B). Additionally, IVM analysis of hotspots in TCRγδGFP mice orally infected with cysts of ToxoplasmaRFP suggested a close association with the presence of the protozoan (Movie S3E; Figure S2D; Figure 2K). Toxoplasma infection also induced dose-dependent changes in γδ IEL vertical displacement and positioning, leading to a significant increase in IELs that remained at the same height in the villi (Figure S2F; Figure 2L). γδ IEL movement patterns returned to normal by 72 h post-Toxoplasma infection, a time-point at which the initial invasion by tachyzoites through the epithelial layer has been completed (Figure 2I). These rapid but temporary changes in IEL behavior, also observed after Salmonella invA infection, along with the proximity between IEL flossing hotpots and the pathogen, suggest that γδ IELs are exquisitely responsive to the nature and continued presence of invading microbes. Together, the above imaging analyses suggest γδ IEL programs for steady state surveillance and a swift reaction to luminal pathogens, characterized by specific cell dynamics and positioning in the tissue.
Coordinated EC-IEL responses to enteric pathogens
To gain insights into the mechanisms responsible for γδ IEL behavioral responses to luminal microbes and the role of surrounding ECs in this process, we performed parallel transcriptome analyses on sorted γδ IELs and ECs from wild-type Salmonella-infected and naïve control mice. Salmonella infection resulted in increased γδ T cell expression of genes associated with bacterial defense responses, particularly activating and inhibitory cytotoxic (NK-like) receptors, as well as adhesion molecule pathways and cytoskeletal rearrangement-associated genes. Infection also induced changes in immune response-related pathways in sorted ECs, including TLR sensing and downstream Myd88 signaling (Figure S3A, B and Figure 3A, B). Moreover, in both γδ T cells and ECs we observed an upregulation of the Wnt/β-Catenin pathway upon infection, a pathway usually associated with changes in the epithelial cell turnover rate and tissue regeneration and cellular metabolism (Karin and Clevers, 2016). The activation of microbe-sensing pathways by ECs, associated with similar gene expression changes in both ECs and IELs in immune response-related and metabolic pathways, pointed to ECs as potential primary microbe-responding cells that could prompt neighboring IELs.
Figure 3. Myd88 expression by ECs is required for a coordinated epithelial transcriptional response to microbes.

Sorted TCRγδ IELs (CD45+EpCAM−TCRαβ−TCRγδ+CD8α+) and ECs (CD45−EpCAM+) were isolated from S. Typhimurium-infected or naïve wild-type mice (A, B) or from tamoxifen-treated S. Typhimurium-infected iVilΔMyd88 and Cre− littermate control mice (C, D). RNA-sequencing was performed and Gene Set Enrichment Analysis (GSEA PreRanked, Broad Institute) used to identify GO Biological Processes enriched in TCRγδ IELs (A, C) or ECs (B, D). Expression of individual genes is shown in Figure S3. FDR-q value used for cutoff (dashed line) is p<0.05. (E) Genes meeting the following criteria are shown: i) upregulated in response to S. Typhimurium in the EC or IEL (defined in A and B); ii) not upregulated in response to S. Typhimurium in the iVilΔMyd88 animals (defined in C and D); iii) In the EC: gene (product), categorized by Gene Ontology as “Membrane” or “Extracellular”. In the IEL: gene (product) categorized by Gene Ontology as “Receptor” or “Receptor Binding” or “Signal Transduction”. iv) Of genes meeting criteria i, ii and iii, those that appear in identical functional GO pathways in both ECs and IELs are shown in Figure 3E. Genes from similar pathways are clustered functionally. N = 3 animals per group for wildtype and TCRγδ and EC as well as iVilΔMyd88 and control EC. N = 2 animals per group for iVilΔMyd88 and control TCRγδ. See also Figure S3.
To investigate whether EC microbe sensing played a role in the coordinated EC-IEL response to infection, we analyzed VillinCreERMyd88f/f (iVilΔMyd88) mice, which feature tamoxifen-inducible ablation of the adaptor protein Myd88 specifically in ECs. Similar to analyses performed in wild-type mice, we evaluated the transcriptomes of sorted ECs and γδ IELs in tamoxifen-treated iVilΔMyd88 mice after infection (Figure S3A, B; Figure 3C, 3D). As expected, upregulation of Myd88-dependent immune response genes was abrogated in ECs isolated from iVilΔMyd88 mice post-infection. A similar impairment was observed for the mTOR and β-Catenin/Wnt signaling pathways (Figure 3D). Although a TLR-independent, IL1Rα-inflammasome role for Myd88 signaling has been described (Brown et al., 2013), we were unable to detect significant upregulation of genes associated with this pathway or of IL-1β protein in sorted ECs from iVilΔMyd88 or littermate control mice after Salmonella infection (Figure S3C). These data indicate that microbe sensing via TLRs and downstream signaling through Myd88 is the main driver for these effects in ECs 18 h post-infection. Correspondingly, γδ IELs isolated from Salmonella-infected tamoxifen-treated iVilΔMyd88 mice displayed complete or partial abrogation of the transcriptional changes observed upon Salmonella infection in wild type mice or tamoxifen-treated Cre− control mice (Figure 3C). Further analysis of the top genes upregulated in γδ IELs upon Salmonella infection in an EC-specific Myd88-dependent manner identified genes associated with T-cell metabolism, motility and migration (Figure S3D). Possible pathways involved in Myd88-dependent EC-IEL crosstalk during infection also included neurotransmitters, growth factors and Wnt-Cadherin signaling (Figure 3E). These results suggest that key gene pathways induced in γδ IELs early after infection, particularly metabolic and motility pathways, depend on microbe sensing by neighboring ECs via Myd88.
To investigate whether EC-specific Myd88 expression could directly regulate γδ IEL movement behavior in the steady state, we crossed iVilΔMyd88 with TCRγδGFP mice (iVilΔMyd88-TCRγδGFP). At one or two weeks after tamoxifen treatment, sufficient time for replacement of entire villi with Myd88-deficient ECs, we did not observe altered γδ IEL positioning or behavior between iVilΔMyd88-TCRγδGFP and littermate control mice (Movie S4A, Figure 4A–C). However, four weeks after tamoxifen treatment, γδ IEL dynamics acquired a “GF-like” profile, with similar vertical distribution (Figure 4A), vertical movement dynamics (Figure 4B) and unique area coverage (Movie S4B, Figure 4C), suggesting that EC sensing of the microbiota impacts IEL behavior in the steady state.
Figure 4. Myd88 expression by ECs modulates IEL dynamic response to intestinal microbes.

(A) Frequency of TCRγδ cell distribution along the cleared ileum villi of iVilΔMyd88-TCRγδGFP mice 1 wk, 2wks or 4 wks after tamoxifen treatment. Dashed line indicates mean of median positions for 4 mice/group. (B) IVM visualization and quantification of TCRγδ vertical (Z) displacement, as in 1G and H. Pooled imaging data from iVilΔMyd88-TCRγδGFP mice 1, 2 or 4 weeks after tamoxifen treatment is shown. Graph shows mean and SEM of Z displacement per anatomical villus region as indicated. N = at least 4 mice/group in 3 independent experiments. (C) Quantification of unique area covered/IEL/h. Means and SEM shown, each dot = 1 mouse. Light grey shading = SPF value, dark grey shading = GF value (Fig. 1). (see Movies S4A, B). (D) Tamoxifen-treated (1 wk) iVilΔMyd88-TCRγδGFP and Cre− littermate control mice were infected with S. Typhimurium 18h or Toxoplasma gondii (25 cysts) 6h prior to IVM. Unbiased computational quantification (mean and SEM) of flossing movements. Light grey shading = SPF naïve value (Fig. 1) (see Movies S4C–F). (E) S. Typhimurium CFU/g of liver tissue (left axis) and absolute # of tamoxifen-treated iVilΔMyd88-TCRγδGFP and Cre− littermate control mice with liver invasion (right axis) 24h after S. Typhimurium infection. For CFU, medians and interquartile range shown, each dot = 1 mouse. * = p<0.05, ** = p<0.01, *** = p<0.001 with ANOVA and posthoc Bonferroni multiple comparison test (A–C), Student’s t test (D), Fisher’s Exact test (E, right axis), Mann-Whitney u test (E, left axis). See also Figure S4.
Next, we examined whether γδ IEL behavioral responses to enteric pathogens also require EC-specific Myd88 expression, as suggested by the transcriptional analyses. In contrast to γδ IELs from tamoxifen-treated Cre−TCRγδGFP littermate control mice, upon infection with Salmonella or Toxoplasma IELs from iVilΔMyd88-TCRγδGFP mice showed flossing behavior similar to that of naïve animals (Movie S4C, D; Figure 4D). A recent study demonstrated a role for butyrophilin-like molecules (Btnl) expressed by epithelial cells in shaping steady state distribution of tissue γδ T cells, including Btnl1 that induces a TCR-dependent response of Vγ7+ gut IELs (Di Marco Barros et al., 2016). While modulation of γδ IEL behavior was dependent on EC Myd88 expression, we did not detect a role for TCRγδ-ligand interactions during their initial response to infections. First, we observed similar levels of Nur77GFP in γδ IELs isolated from ABX-treated, naïve or Salmonella-infected mice (Figure S4A). Additionally, treatment of TCRγδGFP mice with anti-TCRγδ blocking antibodies or with a Syk-Zap70 kinase inhibitor did not prevent infection-induced flossing, vertical displacement, tissue distribution or result in increased pathogen invasion (Figure S4B–G). Furthermore, we were unable to detect changes in Btnl1 expression between ECs isolated from naïve or infected SPF mice (Figure S4H). Hence, while TCR-dependent signals influence γδ IEL tissue seeding and homeostasis in the steady state (Di Marco Barros et al., 2016), EC-specific Myd88 responses may supersede these signals during the γδ IEL acute response to invading pathogens. Finally, in a similar fashion to that previously described for total TCRγδ-deficient mice (Ismail et al., 2011), we observed an increased incidence of early invasion of Salmonella in tamoxifen-treated iVilΔMyd88, but not in littermate control mice (Figure 4E). The above data demonstrate that ECs are responsible for regulating γδ IEL behavior in both the steady state and during infection in a Myd88-dependent and TCR-independent manner.
Metabolic regulation of γδ IEL behavior
Metabolic re-programming is essential for T cell clonal expansion and effector function (Buck et al., 2015), although its role in terminally-differentiated (and non-proliferative) tissue-resident T cells is less understood. Because the above transcriptome analyses suggested metabolic changes in γδ IELs in response to infection, we analyzed their energy utilization pathways using extracellular flux analysis (EFA) of primary cells. We observed a rapid increase in both extracellular acidification rate (ECAR) and oxygen-consumption rate (OCR) in sorted γδ IELs from Salmonella-infected mice when compared to γδ IELs isolated from naïve control mice, indicating enhanced anaerobic glycolysis and oxidative phosphorylation (or aerobic glycolysis), respectively, in these cells (Figure 5A, B). In addition to its role in modulating IEL behavior, the transcriptome analyses suggested that Myd88 expression by ECs could also influence IEL metabolic programs following infection. To investigate this possibility, we performed EFA on γδ IELs isolated from naïve iVilΔMyd88 mice and iVilΔMyd88 mice after Salmonella infection. Deletion of Myd88 in ECs completely abrogated the γδ IEL metabolic response (ECAR and OCR upregulation) to Salmonella infection, indicating that microbial sensing by ECs is required to regulate IEL energy utilization as well as their dynamic behavior (Figure 5C).
Figure 5. Myd88 expression by ECs modulates IEL metabolic response to intestinal microbes.

(A–C) Mitochondrial Stress Test (Seahorse) on sorted TCRγδ IELs isolated from S. Typhimurium-infected (18h) or naïve wild-type (A, B) or tamoxifen-treated iVilΔMyd88 mice (C). Oxygen Consumption Rate (OCR) and Extracellular Acidification Rate (ECAR), measured over time (A, mean and SD) or directly ex vivo (B, C, mean and SEM), independently from each sample for each condition are shown. N = at least 5 mice/group from 3 independent experiments. (D) MtorF2108L/F2108L (rapamycin insensitive) mice were lethally irradiated and subsequently reconstituted with bone marrow from TCRγδGFP mice (MtorF2108L). 10 weeks after bone marrow transfer, MtorF2108L and wildtype (WT) control mice were infected with S. Typhimurium (18h), treated with rapamycin and compared to untreated infected controls. Unbiased computational quantification of flossing movements visualized by IVM is shown. (see Movie S5A–B). Means and SEM shown, each dot = 1 movie, N = 3–5 mice/group. (E) Unbiased computational quantification of flossing movements visualized by IVM 18 h after S. Typhimurium infection (red) or in the absence of infection (naïve, purple), and treatment with indicated drugs (see Movie 5C, D). Means and SEM shown, each dot = 1 movie, N = 4–5 mice/group in 3 independent experiments. (F) S. Typhimurium CFU/g of liver tissue (left axis) and absolute # of animals with liver invasion (right axis) 24h after infection in 2-DG treated or control wild-type mice. For CFU, medians and interquartile range shown, each dot = 1 mouse. (G) Mean and SEM of OCR and ECAR (measured as in 5B and C) of sorted TCRγδ IELs isolated from S. Typhimurium-infected (18h) tamoxifen-treated TcrdCreERSlc2a1f/+ and control TcrdCreERSlc2a1+/+ mice is shown. N = at least 5 mice/group from 3 independent experiments. (H) S. Typhimurium CFU/g of liver tissue (left axis) and absolute # of animals with liver invasion (right axis) 24h after infection in tamoxifen-treated TcrdCreERSlc2a1f/+ and TcrdCreERSlc2a1+/+ mice. For CFU, medians and interquartile range shown, each dot = 1 mouse. * = p<0.05, ** = p<0.01, *** = p<0.001 with ANOVA and post-hoc Bonferroni multiple comparison test (D), Student’s t test (B, C, E, G), Fisher’s Exact test (F, H, right axis), Mann-Whitney u test (F, H, left axis). See also Figure S5.
The gene set enrichment analyses shown in Figure 3 suggest that the mTOR pathway may be involved in the increased metabolic response observed in γδ IELs post-infection, and this is similar to what has been described for activated effector T cells (Chang et al., 2013). To address whether γδ IEL metabolic changes were coupled with changes in movement dynamics, we administered rapamycin, an inhibitor of mTOR to TCRγδGFP mice prior to Salmonella infection. Inhibition of mTOR-dependent metabolic responses significantly suppressed IEL flossing behavior post-infection, although speed and vertical displacement patterns along the villi were maintained (Movie S5A, B; Figure S5A, B; Figure 5D). Furthermore, inhibition of mTOR prevented infection-induced flossing hotspots at lower villi regions while it induced hotspots at tip regions (Figure S5C). While upstream molecules involved in activation of mTOR in IELs remain to be defined, we were unable to observe changes in IL-15 – a major regulator of IEL homeostasis – mRNA levels in ECs post infection (Figure S5D). Additionally, blocking IL-15R signals by administration of anti-IL2Rβ (CD122) antibodies in vivo did not affect IEL re-positioning or dynamics post infection (Figure S5E–G). To address whether modulation of mTOR in hematopoietic cells, rather than in the non-hematopoietic or epithelial compartment, was sufficient to induce changes in IELs post infection, we used irradiated wild type or rapamycin-insensitive MtorF2108L mice (Ersching et al., 2017) as hosts for TCRγδGFP bone marrow. Rapamycin treatment suppressed infection-induced IEL flossing in both wild type and MtorF2108L hosts, suggesting that mTOR inhibition in T cells is sufficient to prevent changes in IEL dynamics upon infection (Figure S5H; Figure 5D). To more specifically study glucose uptake by IELs after infection, we used 2-NBDG labeling. We observed increased 2-NBDG uptake by γδ IELs cells during Salmonella infection, both by overall mean fluorescence intensity and especially by a small subpopulation of γδ IELs that already expressed higher 2-NBDG levels before infection (Figure S5I, J). Directly blocking glycolysis through the administration of 2-deoxy-glucose (2-DG), a non-metabolizable glucose analog that competes with glucose for hexokinase, also prevented infection-induced IEL flossing and hotspot localization in villi vertical axis (Movie S5C; Figure S5A–C; Figure 5E). Conversely, in vivo administration of metformin, an mTOR-independent activator of glycolysis, to naïve mice was sufficient to recapitulate γδ IEL dynamic changes observed in response to infection (Movie S5D; Figure S4A–C; Figure 5E). These data suggest that changes in γδ IEL displacement depend on the rapid generation of cytosolic ATP that is achieved by (aerobic and anaerobic) glycolysis. Metformin administration induced increased overall flossing hotspots, although they accumulated throughout the villi, contrasting with the behavior observed after enteric infection (Figure S5C). These data reinforce the possibility that this behavior might be infection site- or epithelial-damage specific. We also determined whether these glycolysis-dependent γδ IEL behavioral changes were linked to early pathogen invasion. While metformin administration did not rescue the increased susceptibility to early Salmonella invasion observed in tamoxifen-treated iVilΔMyd88 mice, 2-DG treatment of wild-type animals resulted in enhanced bacterial invasion (Figure S5K, Figure 5F). The above results point to a role for pathogen-induced IEL inter-epithelial hotspots in response to luminal insults. Additionally, this data suggests that increased glycolytic activity by γδ IELs and their corresponding behavioral response is required but not sufficient for early resistance to infections. Nevertheless, because some of the effects observed after 2-DG treatment could be mediated by other cells than γδ IELs involved in the response to enteric infection (Chieppa et al., 2006), we decided to directly address the role of infection-induced glycolysis in γδ IELs. To that end, we interbred tamoxifen-inducible TcrdCreER (Zhang et al., 2015) with mice carrying loxp-flanked alleles of the Slc2a1 gene encoding one of the main glucose transporters in T cells, Glut1 (Buck et al., 2015). EFA analysis on γδ IELs isolated from tamoxifen-treated, Salmonella-infected iTCRγδ × Slc2a1f/+ (iTCRγδ ΔGlut1) mice demonstrated that removal of one Slc2a1 allele was sufficient to prevent infection-induced metabolic responses in γδ IELs, both in terms of ECAR and OCR upregulation (Figure 5B, G). Similar to effects of systemic 2-DG administration, infection of tamoxifen-treated iTCRγδ ΔGlut1 mice resulted in increased early Salmonella invasion (Figure 5H). Overall, these results identify a coordinated tissue response to microbial cues in which ECs modulate T cell function in the intestine by directing a metabolic switch coupled with altered cell dynamics and immune function to orchestrate immune surveillance of the epithelium.
Discussion
A large fraction of T cells resides in the intestinal epithelium, thus in close contact with an abundance of diverse microbes, dietary antigens and metabolites; yet how these IELs respond to luminal perturbations is not well understood (Cheroutre et al., 2011; Vantourout and Hayday, 2013). Furthermore, despite the advances in high-resolution in situ imaging tools in the past 15 years (Germain et al., 2012), very little understanding of how immune cells dynamically adapt to tissue-specific cues in mucosal tissues has been gained (Edelblum et al., 2012; Edelblum et al., 2015; Farache et al., 2013; Sujino et al., 2016; Wang et al., 2014). The studies presented here uncover a new layer of tissue regulation of hematopoietic cells. We defined an essential role for microbial sensing by ECs in the regulation of T cell movement dynamics and energy utilization. First, using live imaging and high-resolution microscopy, we provide several lines of evidence that a major IEL population, γδ T cells, dynamically responds to microbial cues. Although previous studies have demonstrated that “natural” IELs do not require commensal bacteria to populate the intestinal epithelium (Bandeira et al., 1990), we observed that γδ IEL distribution along the small intestine, positioning in the villi, motility above the basement membrane and villus-crypt bidirectional displacement are largely dependent on stimulation by the microbiota and enteric pathogens. It is possible that IELs physiologically sense EC proliferation, since our estimated IEL vertical downward displacement nearly offsets the EC growth rate described in SPF mice (approximately 6 µm/hour) (Park et al., 2016). Likewise, this coordination seems to be directed by gut microbiota, since both γδ IEL vertical displacement and epithelial cell turnover are reduced in mice devoid of microbiota (Park et al., 2016). The microbiota-dependent preferential localization of γδ IELs in the upper third of villi also corresponds to the increased microbial concentration reported in that region, which has lower concentrations of anti-microbial peptides (AMPs) produced by Paneth cells in the crypts (Hooper and Macpherson, 2010). Additionally, the effects of commensal bacteria colonization of the small intestine were mostly noted in the ileum, the region with the highest microbial density. Therefore, our data suggest that microbial density, not only along the gastrointestinal tract but also around individual villi, may serve as a major driver of γδ IEL localization and surveillance of the epithelium. Rather than direct interaction between γδ IELs and luminal bacteria, the observed microbial effects on γδ IELs were dependent on sensing and instruction by tissue cells.
Several pro- and anti-inflammatory mechanisms depend on bidirectional interactions between hematopoietic and non-hematopoietic tissue cells. For instance, tissue-resident memory T cell precursors are constantly recruited to the intestinal epithelium in the absence of infection and to additional mucosal sites and the skin during infection or inflammatory responses (Mackay et al., 2016; Masopust et al., 2001; Shin and Iwasaki, 2013). Additionally, γδ IELs have been linked to wound repair and maintenance of the gut and skin epithelial barrier (Boismenu and Havran, 1994; Yang et al., 2004). We found that in conditions of depleted microbiota, reduced γδ IEL vertical villus-crypt displacement was directly correlated with reduced EC proliferation raising the possibility that physiological signals associated with EC growth serve to fine-tune T cell dynamics in the tissue. For instance, it is possible that gradients of epithelial-derived Btnl molecules modulate γδ IEL positioning in the steady state in a TCR-dependent manner (Di Marco Barros et al., 2016). The fact that γδ IELs located at the tips of the villi showed a strong downward movement trend (and vice-versa) suggests the existence of repulsive signals at the extremities and/or attraction signals at the middle of the villus. Based on our parallel EC-IEL transcriptome analyses, we speculate that one of those signals may involve the β-Catenin/Wnt pathway, which maintains the self-renewal capacity of epithelial stem cells (Karin and Clevers, 2016).
We observed that enteric infections resulted in fast and well-defined behavioral changes in γδ IELs, including reduced vertical displacement, altered villus positioning and heightened inter-epithelial flossing movement. This infection-induced flossing movement preferentially occurred in specific hotspot areas after either Toxoplasma or Salmonella infection. Data obtained using the Salmonella mutant invA, as well as in mice 3 days after Toxoplasma infection, suggest that these behavioral changes require continued presence of the pathogen. Based on our in vivo analyses of IEL flossing upon infection with fluorescent pathogens, we speculate that flossing hotspots and altered γδ IEL vertical displacement could be related to a specific response to tissue damage or high concentrations of enteric pathogens in particular regions of villi. While an earlier report using live imaging of intestinal tissue bathed in Salmonella-containing medium observed large numbers of TCRγδ cells in the center axis of villi that moved into inter-epithelial spaces post infection (Edelblum et al., 2015), in the present study and our previous work, we find that only a small fraction of TCRγδ cells (< 10%) is present in the LP (Sujino et al., 2016). Flossing movements hence mostly represent an epithelial re-positioning from the basement membrane towards the lumen, apparently driven by microbial cues. Supporting an active role intestinal epithelial barrier function, previous studies have demonstrated that TCRγδ-deficient mice are highly susceptible to both of these pathogens, and these mice show early pathogen invasion to peripheral organs and systemic sites (Dalton et al., 2006; Ismail et al., 2011). γδ IELs have also previously been shown to play a role in stress-surveillance (Hayday, 2009). Imaging studies of γδ IELs in the murine skin supported this concept, however skin IELs largely display a dendritic cell-type morphology with limited migration (Chodaczek et al., 2012), which contrasts with the intestinal IEL lymphoid morphology and mobile phenotype (Edelblum et al., 2012; Sujino et al., 2016).
Although the exact functional relevance of T cell inter-epithelial movement triggered by infection remains unknown, studies using TCRγδ-deficient mice in models of infection point to a role for γδ IELs in the maintenance of intestinal epithelial tight junctions during acute phases of infection (Dalton et al., 2006; Edelblum et al., 2015; Ismail et al., 2011). The concomitant changes in expression of genes in pathways related to cell adhesion in ECs and γδ IELs post-infection reinforces this possibility. Additionally, while we could not detect a role for IL-15 in regulating IEL dynamics, production of cytokines by ECs, including IL-15, has been shown to contribute to IEL cytotoxic activity during intracellular infections, and exaggerated IL-15 production during inflammation can trigger IEL-mediated destruction of the epithelial barrier and disorders such as coeliac disease (DePaolo et al., 2011; Jabri and Abadie, 2015; Meresse et al., 2004; Meresse et al., 2006; Tang et al., 2009). Of note, flossing behavior would provide γδ IELs enhanced access and proximity to pathogens during infection. Our observed transcriptional changes in genes associated with NK and cytotoxic activity in γδ IELs upon infection, supported by previous accounts showing that these cells are able to upregulate anti-microbial molecules (Ismail et al., 2011), raise the possibility of direct anti-bacterial or -protozoan activity by γδ IELs.
Previous studies have demonstrated several roles for EC pattern recognition receptor signaling in the maintenance of the host-microbiota equilibrium at mucosal interfaces, including in pathogen-defense, epithelial cell growth and repair, and conditioning of innate immune cells including antigen presenting cells (Chieppa et al., 2006; Dessein et al., 2009; Hammad et al., 2009; Rakoff-Nahoum et al., 2004; Slack et al., 2009; Staton et al., 2006; Vaishnava et al., 2008; Zaph et al., 2007). We described that specific ablation of the gene encoding the adapter protein Myd88 on ECs was sufficient to recapitulate the γδ IEL behavioral phenotype and tissue distribution observed in mice devoid of microbiota. γδ IEL responses to enteric pathogens, including flossing movements, were also impaired in mice lacking Myd88 on ECs. Furthermore, EC microbial pattern-sensing was found to be required for a γδ IEL metabolic switch in response to pathogens. A requirement for increased glycolysis has been demonstrated in T cells transitioning from naïve and memory states into an effector state (Chang et al., 2013; Macintyre et al., 2014; Vander Heiden et al., 2009). However, an increased glycolytic rate in effector T cells is normally linked with TCR activation and cell proliferation (Buck et al., 2015), neither of which were observed in γδ IELs in response to infection, resembling what has been proposed for innate immune cells (Krawczyk et al., 2010). In the absence of infection, induction of glycolysis was sufficient to trigger an array of γδ IEL behavioral changes normally only observed after enteric infections, while pharmacological or genetic inhibition of glycolysis prevented these infection-induced γδ IEL dynamic changes. While the significance of this concomitant EC-dependent modulation of γδ IEL metabolism and behavior to gut physiology remains to be determined, pharmacological or cell-specific genetic targeting in either EC pathogen sensing or γδ T cell glycolysis led to increased susceptibility to Salmonella invasion, closely mirroring the phenotype of mice deficient in γδ T cells (Ismail et al., 2011). Therefore, ECs appear to synchronize γδ IEL surveillance to control enteric pathogen translocation through the epithelial layer. The potential role for glucose utilization in T cell surveillance of the gut epithelium contrasts to the beneficial effects of fasting metabolism in preventing neuronal dysfunction during sepsis (Wang et al., 2016), raising the possibility that tissue-specific physiology and infection routes, in addition to particular pathogen characteristics, influence specific metabolic requirements for pathogen resistance and tissue tolerance.
In conclusion, we have described an intricate and dynamic relationship between intestinal epithelial cells and intra-epithelial lymphocytes, where EC sensing of microbes determines γδ IEL tissue distribution, migration and scanning patterns as well as energy utilization. This study thus provides support for an EC-dependent, coordinated tissue–immune cell response to environmental insults.
STAR Methods
Contact for Reagent and Resource Sharing
Further information and requests for resources and reagents should be directed to and will be fulfilled by the Lead Contact, Daniel Mucida (mucida@rockefeller.edu).
Experimental Model
Mice
C57BL/6 (000664), Nur77GFP (016617) and TCRγδGFP (016941), mice were purchased from the Jackson Laboratories and maintained in our facilities. VillinCre-ERT2 mice were generated by Sylvie Robine (Institut Curie) and provided by David Artis (Cornell Univ.); Myd88f/f mice were provided by Michel Nussenzweig (Rockefeller Univ.); Slc2a1f/f mice were provided by E. Dale Abel (Univ. of Iowa); TcrdCre-ER mice were provided by Yuan Zhuang (Duke Medical Center); MtorF2108L (rapamycin insensitive) mice were provided by Gabriel Victora (Rockefeller Univ.). These lines were interbred in our facilities to obtain the final strains described in the text. Mice were maintained at The Rockefeller University animal facilities under specific pathogen-free (SPF) or germ-free (GF) conditions. C57BL/6 GF mice were originally obtained from Sarkis Mazmanian (Caltech) and maintained in our facility. TCRγδGFP GF mice were rederived, bred and maintained in our GF facilities. GF status was confirmed by plating feces as well as by qPCR analysis (16S rRNA). Mice were used at 7–12 weeks of age for all experiments except when otherwise indicated. Littermates of the same sex were randomly assigned to experimental groups. Both female and male mice were used for experiments, no notable sex-dependent differences were found for the reported experiments. Additionally, we infected and analyzed mice at the same time of day, maintaining a similar time of analysis between experiments. For bone marrow chimera (BMC) experiments, MtorF2108L/F2108L animals were irradiated with 2 doses of 500 rad, 3 hours apart and subsequently i.v. injected with 5×10⁶ bone marrow cells harvested from TCRγδGFP animals. BMC animals were analyzed at week +10. Animal care and experimentation were consistent with the NIH guidelines and were approved by the Institutional Animal Care and Use Committee at The Rockefeller University.
Microorganisms
Salmonella enterica serovar Typhimurium (SL1344) and its mutant invA were used for infection experiments and cultured prior to infection as described below. A Salmonella enterica serovar Typhimurium (SL1344) strain expressing mCherry was used for co-imaging experiments and cultured identically. Toxoplasma gondii me49 were generously provided by Ricardo T. Gazzinelli (U. Mass.); Toxoplasma gondiiRFP me49 were generously provided by Yasmin Belkaid (N.I.H). Toxoplasma was maintained in our lab by periodically infecting C57BL/6 mice with 5 cysts administrated intraperitoneally (i.p.)- cysts were removed from their brain 30 days after i.p. infection.
Method Details
Antibodies and flow cytometry analysis
Fluorescent-dye-conjugated antibodies were purchased from BD-Pharmingen (anti-CD4, 550954; 557495; anti-CD45R, 557683;) or eBioscience (anti-CD8α 56-0081; anti-TCR-αβ 47-5961; anti-TCRγδ, 46-5711; anti-CD8β, 46-0083; anti–phospho-S6, 12-9007-42). Flow cytometry data were acquired on an LSR-II flow cytometer (Becton Dickinson) and analyzed using FlowJo software (Tree Star). For TCR blocking of TCRγδ cells 400 µg of anti-TCRγδ monoclonal antibody (UC7-13D5, ATCC CRL-1989) was administrated i.p. at −1 and 0 days prior to infection or at days −2 and −1 prior to steady state analysis. For blocking of CD122 (IL-2/IL-15Rβ) 200 µg of anti-CD122 monoclonal antibody (TM-β1, LEAF™ purified, BioLegend #123204) was administrated i.p. at −1 and 0 days prior to infection or at days −2 and −1 prior to steady state analysis. Total cell count was performed using CountBright absolute counting beads (Invitrogen) as instructed by the manufacturer. FACS sorting was performed using ARIA III machines (Beckton Dickinson). TCRγδ+ IELs were sorted as EpCAM−CD45+TCRβ−TCRγδ+CD8α+CD8β−.
RNA-sequencing
RNA was isolated from samples using the RNAeasy kit (Qiagen, USA) according to the instructions provided by the manufacturer. RNA libraries from biological replicates were prepared using the SMART-Seq™ v4 Ultra™ Low Input RNA (ClonTech Labs) and/or TruSeq® Stranded mRNA Sample Preparation and sequenced using 75 base pair single end high-output reading on a NextSeq 500 instrument (Illumina). The reads were aligned using the STAR version 2.3.0 software that permits unique alignments to Mouse Ensembl genes. Differential expression was determined by use of the Cufflinks software with default settings. Gene Set Enrichment Analysis (GSEA PreRanked, Broad Institute) of differentially expressed genes was performed with default settings to identify enrichment of curated gene sets derived from the Gene Ontology Biological Processes pathway database (www.geneontology.org). Gene ontology analysis of individual genes and pre-selected groups of genes (as in Figure 3E, F) was performed using the PANTHER classification system (www.pantherdb.org) (Mi et al., 2013) and the Gene Ontology consortium (www.geneontology.org). False Discovery correction was applied as detailed in the figure legends.
Real-time relative quantification PCR
RNA was isolated using TRIzol™ (ThermoFisher) according to the manufacturer’s instructions. qPCR was performed as previously described (Mucida et al., 2007). Gapdh and Hprt housekeeping genes were used to normalize samples. Primers used were:
Il15 – forward 5‘-CTGCCATCCATCCAGAACTC-3‘
Il15 – reverse 5‘-AGCACTGCCTCTTCATGGTC-3‘
Btnl1 – forward 5‘-TGACCAGGAGAAATCGAAGG-3‘
Btnl1 – reverse 5‘-CACCGAGCAGGACCAATAGT-3‘
Gapdh – forward 5‘-TTGTGATGGGTGTGAACCACGAGA-3‘
Gapdh – reverse 5‘-GAGCCCTTCCACAATGCCAAAGTT-3‘
Hprt – forward 5‘-GCGTCGTGATTAGCGATGATG-3‘
Hprt – reverse 5‘-CGAGCAAGTCTTTCAGTCCTGTCC-3‘
Preparation of intraepithelial lymphocytes and epithelial cells
Intraepithelial were isolated as previously described (Mucida et al., 2007). Briefly, small intestines were removed and placed in chilled HBSS media (Gibco) containing 2% FCS. The intestines were carefully cleaned from the mesentery and flushed of fecal content. Intestines were opened longitudinally and then cut into 1 cm pieces. The intestinal tissue was transferred to a 50 ml Falcon tubes containing 25 ml of cold HBSS complemented with 2% FCS and 5 mM EDTA and shaken (2×) at 230 rpm for 20 min at 37°C. The tissue suspension was passed through a stainless steel sieve into 50-ml conical tubes and the cells were pelleted by centrifugation at 1200 rpm for 10 min at 4°C. The cell pellet was resuspended in complete HBSS, layered over a discontinuous 40/70% Percoll gradient, and centrifuged at 2000 rpm for 30 min. Cells from the 40/70% interface were collected, washed and resuspended in complete RPMI media. These purified cells constituted the intraepithelial lymphocyte (IEL) population. Cells from the layer on top of the 40% Percoll interface were collected, washed, and resuspended in complete RPMI media. These purified cells constituted the epithelial cell fraction.
Multiphoton microscopy
TCRγδGFP reporter mice were anesthetized with i.p. injection of 20 µL/g of 2.5% Avertin before surgery for intravital imaging. Anesthesia was maintained by continuous administration 1% of isofluorane and 1L per minute of oxygen mixture while imaging was performed. Mice were injected with Hoechst dye (blue) for visualization of epithelial cell nuclei. 10 min following induction of anesthesia, mice were placed on a custom platform heated to 37°C. Upon loss of recoil to paw compression, a small incision was made in the abdomen. The ileum entrance to the caecum was located and a loop of ileum was exposed and placed onto a raised block of thermal paste covered with a wetted wipe. A coverslip was placed on top of the loop to immobilize the intestine. The platform was then transferred to the FV1000MPE Twin upright multiphoton system (Olympus) heated stage. Time-lapse was +/− 30sec with a total acquisition time of 30 min. A complete Z-stack (80 µm) of several ileum villi was made during each acquisition. Imaris (Bitplane AG) software was used for cell identification and tracking, using the “Spots” auto-regressive tracking algorithm as described by the manufacturer. The scoring of IEL behavior (flossing, speed, z-movement, location) was entirely computational and unbiased, using Python (Enthought Canopy) integrated with Microsoft Excel and with the application of standard scientific algorithm packages. “Flossing” movements are identified using extensively verified parameters, based on their unique properties (e.g. sequence of specific sharply angled movements). See below for additional detail on quantification and statistical analysis of imaging data.
Metabolism assays
Extracellular acidification (ECAR) and oxygen consumption rate (OCR) were measured for sorted ex vivo TCRγδ cells using a 96-well Seahorse XFe96 Analyzer (Agilent / Seahorse Bioscience) in the Cell Metabolism Laboratory of the Donald B. and Catherine C. Marron Cancer Metabolism Center at Memorial Sloan Kettering Cancer Center (MSKCC) using the Seahorse XF Mito Stress Kit (Agilent) according to the manufacturer’s instructions with titrated concentrations of mitochondrial inhibitors and measures for lymphocyte adhesion. Briefly, sorted T cells were adhered to assay plates coated with 25 µg/mL Cell-Tak (Corning) in 0.1 M NaHCO3 at pH 8.0 and incubated in the absence of CO2 in assay medium (non-buffered DMEM containing 10 mM glucose, 2 mM L-glutamine, and 1 mM sodium pyruvate) for 45 min before the assay. ECAR and OCR were measured under basal conditions and in response to sequential addition of 2 µM oligomycin, 2 µM carbonyl cyanide-4 (trifluoromethoxy) phenylhydrazone (FCCP) and 0.5 µM rotenone + 0.5 µM antimycin A at indicated time-points.
In vivo glucose uptake analysis was performed by i.v. administration of 500 µg 2-NBDG (ThermoFisher, #N13195) 45 minutes prior to cell harvesting and subsequent analysis by flow cytometry.
Whole mount (iDISCO and FocusClear™) and cryosection immunofluorescence
The iDISCO protocol was followed as detailed on the continuously updated website htpp://idisco.info. Briefly, mice were sacrificed by cervical dislocation and the small intestine was removed and placed in HBSS Mg2+Ca2+(Gibco) + 5% FCS. The intestine was cut open longitudinally and the luminal contents washed away in complete media with 1 mM DTT (Sigma-Aldrich). The tissue was pinned down in a plate coated with Sylgard and then fixed for O/N with 4% PFA at gentle agitation. After washing and methanol dehydration steps, whole mount samples were then permeabilized first in 0.2% Triton X-100 for 2 hours followed by 0.2% Triton X-100/20%DMSO/0.3MGlycine for 1–2 days at 37°C with gentle agitation. After washing in 1× DPBS with 0.2% Tween-20 and Heparin (100 µg/ml), the samples were blocked for 1–2 days in 1× DPBS with 0.2% Triton X-100/10%DMSO/6%Donkey Serum for 1–2 days at 37°C with gentle agitation. Antibodies were added to the blocking buffer at appropriate concentrations and incubated 1–2 days at 37°C. After primary incubatio n the tissue was washed 5–10 × in 1× DPBS with 0.2%Tween-20 and Heparin (100 µg/ml), and then incubated in blocking buffer with secondary antibody at concentrations within the primary antibody range. Samples were again washed 5–10 × in 1× DPBS with 0.2%Tween-20 and Heparin (100 µg/ml), mounted in agarose and cleared using dichloromethane followed by benzyl ether. Images were taken on an Ultramicroscope (LaVision BioTec) with light sheet illumination and adjusted post-hoc in Imaris. The following unconjugated primary antibodies were used to stain the intestine: Aves Labs (anti-GFP chicken polyclonal), Invitrogen (anti-ZO-1 / TJP1 rabbit polyclonal).
FocusClear™ tissue clearing was performed according to manufacturer’s (Celexplorer Labs. Co.) instructions. Briefly, TCRγδGFP reporter mice were injected with Hoechst dye (blue) for visualization of epithelial cell nuclei. After 15–30 minutes, mice were sacrificed by cervical dislocation and segments of the small intestine were removed, washed (intact) and fixed in 4% PFA at gentle agitation for 2 h at RT. After fixation, samples were washed in 1× DPBS and placed in FocusClear™ solution for approximately 15 min. at room temperature. Once visual confirmation of clearance was obtained, samples were mounted in 3D printed slides with MountClear™, sealed and imaged using an inverted LSM 880 NLO laser scanning confocal and multiphoton microscope (Zeiss). As this protocol maintains native GFP and introduced Hoechst fluorescence, no antibody staining was necessary. Multiple technical replicates per sample (segment) were obtained.
For immunofluorescence of thin tissue sections (without clearing), TCRγδGFP reporter mice were sacrificed by cervical dislocation and segments of the small intestine were removed, washed (intact) and fixed in 4% PFA at gentle agitation for 2 h at RT. After fixation, samples were washed in 1× DPBS and subsequently submerged in Optimal Cutting Temperature (O.C.T.) compound (Fisher, Cat# 4585) and frozen at –80 C. After freezing, 20 µm sections were mounted with DAPI-containing mounting medium and imaged on an inverted LSM 880 NLO laser scanning confocal and multiphoton microscope (Zeiss). As this protocol maintains native GFP fluorescence, no antibody staining was necessary.
Infections and gnotobiotics
Mice were orally inoculated with 108 CFU of Salmonella Typhimurium (SL1344) or mutant invA. Imaging and or gene expression analysis was performed 2–18 hours after inoculation as indicated. Briefly, a single aliquot of Salmonella was grown in 3 ml of LB overnight at 37°C with agitation, and then the bacteria were sub-cultured (1:30) into 3 ml of LB for 3.5h at 37°C with agitation. The bacteria were next diluted to final concentration in 1 ml of DPBS. Bacteria were inoculated by gavage into recipient mice in a total volume of 100µl.
For imaging experiments with Toxoplasma gondii infection, mice were infected by oral gavage with the amount of cysts as indicated. Mice were imaged 6–72 hours after inoculation as indicated.
For experiments with SFB mono-colonization, GF TCRγδGFP mice were co-housed with SFB mono-colonized mice (originally obtained from D. Littman, NYU) in a separate isolator. SFB mono-colonization was confirmed using specific 16S RNA qPCR in fecal DNA, as well as in luminal contents from each individual small and large intestinal segment upon sacrifice. For experiments with Bacteroides vulgatus (B.v.) + Enterococcus faecalis (E.f.) bi-colonization, B.v. and E.f. were grown anaerobically in Schaedler’s Broth and Brain Heart Infusion respectively. Nutrients broths were reduced of oxygen for at least 24 hours in an anaerobic chamber (Bactron) prior to inoculation. Glycerol stocks of B.v. and E.f. were used to inoculate 5 mL broth cultures in the anaerobic chamber and incubated for 24 hours. These cultures were then sub-cultured for an additional 24 hours. The 2 cultures were then mixed 1:1 and subsequently GF TCRγδGFP mice were orally gavaged. Bi-colonization was confirmed using specific 16S RNA qPCR in fecal DNA, as well as in luminal contents from each individual small and large intestinal segment upon sacrifice. Mice were mono- or bi-colonized for at least 5 days before analysis. For full reconventionalization, GF TCRγδGFP mice were orally gavaged with feces from SPF mice (homogenized in sterile DPBS) and subsequently co-housed with SPF mice until analysis at day +6.
Salmonella invasion of peripheral organs
Whole livers were removed post mortem (without the gall bladder) and homogenized in PBS with 0.1% Triton X-100 to release intracellular bacteria. Colony-forming units (CFU) in the liver were determined by plating 3 serial dilutions of the tissue suspension on selective agar, Salmonella-Shigella Agar (BD 211597), and resulting quantities were normalized to organ weight prior to homogenization.
Antibiotic Treatment
Mice were given ampicillin (1 mg/ml), vancomycin (0.5 mg/ml), neomycin sulfate (1 mg/ml), and metronidazole (0.5 mg/ml) in drinking water for 4 weeks. Sucralose-based artificial sweetener (Splenda®) was added at 5 g/l to both antibiotic-treated and control mice drinking water. All antibiotics were purchased from Sigma. Microbiota depletion was verified by aerobic and anaerobic culture of intestinal contents.
Drug treatments
For TCR signaling inhibition, the Syk-Zap70 kinase inhibitor piceatannol (Sigma Cat# P0453) was used. Mice were treated with daily i.p. injections of 500 µg resuspended in sterile corn oil on days −1 and 0 prior to infection. For mTOR inhibition, mice were treated with daily i.p. injections of rapamycin (Sigma Cat# R0395). Rapamycin was dissolved in ethanol to a concentration of 2mM and further diluted in sterile PBS for i.p. injection at a dose of 1.5mg/kg per day in 100 µL PBS on day −1, 0 and +1 of Salmonella infection. For glycolysis inhibition, animals were treated with i.p. injections of 400 mg/kg of 2-DG (Sigma Cat# D6134) on day −1, day 0 and day +1 of Salmonella infection. For glycolysis pathway activation, animals were injected with 250 mg/kg Metformin (USP Cat#136309) in 100 µL PBS daily for 3 days and cells analyzed 2–3 hours after last injection. For tamoxifen treatment in inducible Cre-recombinase systems, mice were i.p. injected with 0.8 mg of tamoxifen resuspended in corn oil at time points as specified in figure legends. For LPS exposure experiments, GF or ABX-treated mice were exposed to 100 µg/ml of lipopolysaccharide (LPS) from Salmonella enterica serotype Typhimurium (Sigma Cat# L6511) in drinking water, filtered (0.22µm), for 7 days prior to analysis.
Quantification and Statistical Analysis
Statistical approach and sample size calculation
Statistical analysis was performed in GraphPad Prism software. For large datasets preliminary or additional statistics were performed using Python (Enthought Canopy) integrated with Microsoft Excel and with the application of standard scientific algorithm packages (see below for additional details) obtained from SciPy (www.scipy.org) and Enthought. For specific statistical tests used in each experiment as well as definition of center, and dispersion and precision measures please refer to figure legends. Our general approach is described below.
For IVM experiments evaluating IEL behavioral patterns we analyzed the difference between two independent means (two groups) using a two-tailed Student’s t test. For comparisons of multiple groups, ANOVA was performed with post-hoc Bonferroni test. A level of α=0.05 was used to define significance. Power calculations for IVM behavioral experiments using G*POWER software, based on the minimal effect size of d = 2.336 (preliminary data) showed a requirement of minimum n = 5 per group. For tissue clearing experiments, we analyzed the difference between two independent means (reflecting mean of medians for position of IELs per sample) per group using a two-tailed students t test. Power calculations performed as above showed a sample requirement of n = 9 per group (3 independent experiments with 3 mice/condition). For RNA-seq, n = 3/group were compared for initial analyses, as suggested based on extensive review of statistical power for RNA-seq analysis (Conesa et al., 2016), showing a power level of > 85% with our sequencing approach. Subsequent RNA-seq analyses of iVilΔMyd88 and Cre− littermate control mice utilized n = 2/group. False Discovery Rate correction or Bonferroni multiple comparison correction was applied for all analyses, as detailed in the figure legends. For metabolic analyses we analyzed the difference between two independent means using a two-tailed Student’s t test. Analysis of our preliminary data showed an effect size of d = 1.31 for mean ex vivo ECAR, leading to a power calculation (as above) requiring n = 14 per group (3 independent experiments with 5 mice/condition). Tissue invasion by pathogens was compared at different time points with a two-tailed Mann-Whitney u test as well as the incidence of invasion (as a categorical variable) per group with Fisher’s Exact test. Power calculations suggested a sample size of n = 11 (3 independent experiments with 3–4 mice/group).
Computational analysis of multiphoton microscopy
For each individual movie, time-lapse was +/− 30sec with a total acquisition time of 30 min. A complete Z-stack (80 µm) of several ileum villi was made during each acquisition. Raw data as imported from the microscope was used for all tracking and subsequent analyses. Some post-analysis pseudo-color adjustment was performed for individual images and movies to account for differences in auto-fluorescence and Hoechst labeling. Hoechst labeling (for ECs) was performed for ease of viewing, but all algorithms operate independently of Hoechst staining or EC identification and instead focus on TCRγδGFP tracking data. Imaris (Bitplane AG) software was used for cell identification and tracking, using the “Spots” auto-regressive tracking algorithm as described by the manufacturer. Tracking of cells and identification of IELs was done using the same algorithm for all samples included and manual verification of correct lymphocyte identification was performed. After this step, all coordinates are inserted into custom-made, standardized algorithms, which analyze lymphocyte coordinates over time to establish IEL localization as well as movement dynamics. The scoring of IEL behavior (flossing, speed, z-movement, location) was entirely computational and unbiased, using Python (Enthought Canopy) integrated with Microsoft Excel and with the application of standard scientific algorithm packages obtained from SciPy (www.scipy.org) and Enthought. Specifically, the following packages were used: NumPy, IPython, Matplotlib and Pandas. FFmpeg (www.ffmpeg.org) was used for producing animations of 3D plots. “Flossing” movements are identified using extensively verified parameters, based on their unique properties (e.g. sequence of specific sharply angled movements), the following algorithm is used:
This algorithm defines a flossing movement as a sharply angled movement (< 20 degrees) in 1 dimension, within a defined 3-dimensional space (< 40 degrees in all other dimensions) and with a length of movement between 1 and 15 µm. The accuracy of this analysis was confirmed by visual comparisons and virtual test coordinate sets containing flossing movements.
For analysis of flossing hotspots (ie. overlapping flossing events), the individual coordinates of each flossing experiment in a movie are compared to others, and multiple events per 125 µm3 (5 by 5 by 5 µm) volume (the minimum volume an IEL would occupy) scored.
For analysis of vertical (Z) movement patterns, mean location in Z of each cell per movie was compared to the starting location. Next, the raw starting location with Z migration information was plotted in 3 dimensions using matplotlib with 3D packages for Python. To analyze differences in Z migration patterns between conditions, the net Z migration (in µm) was compared for each region of 20 µm (from close to the villus tip to above the crypt, as shown in the graphical representation for each figure). For statistical comparisons, the mean of net Z migration per region of several individual animals from independent experiments was compared per condition.
Data and Software Availability
Data generated with RNA sequencing was deposited in the NIH GEO database under accession # GSE97184. All software used is available on-line, either freely or from a commercial supplier and is summarized in the Key Resources table. Algorithms described above are purely mathematical calculations and can be performed using any software allowing calculations with data matrices. No new software was written for this project.
Key Resources Table
Please see the separate document included with this manuscript containing the Key Resources Table.
Supplementary Material
(Part A) TCRγδGFP reporter mice were anesthetized and subsequently perfused with PBS 1× followed by 4% paraformaldehyde (PFA). A small section of the ileum was prepared following the iDISCO protocol as detailed in the STAR methods section. Samples were stained with anti-ZO-1 (red) and anti-GFP (green) antibodies after which imaging was acquired using an Ultramicroscope (LaVision BioTec) with light sheet illumination and adjusted post-hoc in Imaris. The complete Z-stack (200 – 300 µm) of several ileum villi is visible within the field of vision. Imaris (Bitplane AG) software was used for data processing using the standard Spots algorithm to identify cells compared to background. (Part B) TCRγδGFP reporter mice were anesthetized and subsequently perfused with PBS 1× followed by 4% paraformaldehyde (PFA). A small section of the ileum was prepared for an additional 2 hours of fixation in 4% PFA. Tissue clearing was performed using FocusClear™ (CelExplorer Labs Co.), preserving the native GFP, after which imaging was acquired using an inverted LSM 880 NLO laser scanning confocal and multiphoton microscope (Zeiss). The complete Z-stack (200–300 µm) of several ileum villi is visible within the field of vision, with the TCRγδ cells in green (GFP). Imaris (Bitplane AG) software was used for data processing using the standard Spots algorithm to identify cells compared to background.
(A) TCRγδ+ IELs of naïve, 4-week broad-spectrum antibiotic-treated (ABX) and S. Typhimuriu-minfected (18h) Nur77GFP mice were analyzed for Nur77 (GFP) expression by flow cytometry. Mean Fluorescence Intensity (MFI) and SEM is shown. (B) Nur77GFP mice were i.p. injected with 500 µg of piceatannol at days −1 and 0 before cell harvest. IELs were in vitro stimulated with 5 µg/mL of plate-bound α-CD3 for 3 h at 37°C and stained for flow cytometry analysis. Mean Fluorescence Intensity (MFI) and SEM is shown. (C). Nur77GFP mice were i.p. injected with 400 µg of anti-murine TCRγδ antibody (clone UC7-13D5) or isotype control in 100 µl PBS at days −1 and 0 before cell harvest. IELs were in vitro stimulated with 5 µg/mL of plate-bound α-CD3 and α-TCRγδ (clone GL-3) for 3 h at 37°C and stained for flow cytometry analysis. Mean Fluorescence Intensity (MFI) and SEM is shown. (D) Frequency of TCRγδ+ cell distribution along the duodenum, jejunum and ileum villi of piceatannol-treated mice (as in B) after infection with S. Typhimurium (2h). Red line = untreated S. Typhimurium (2h) infected mice as in Fig. 2. Grey shading indicates SPF naïve values (Fig. 1). (E) Quantification of TCRγδ vertical (Z) displacement via IVM analysis. Pooled imaging data from piceatannol-treated or anti-TCRγδ-treated, S. Typhimurium-infected mice are shown. Graph shows mean and SEM of Z displacement per anatomical villus region as indicated. Dashed line shows SPF S. Typhimurium (2h) infected mice values as in Fig. 2. (F) Unbiased computational quantification (mean and SEM) of inter-epithelial cell movements (flossing) in wild-type TCRγδGFP mice after S. Typhimurium infection (18h). Anti-TCRγδ blocking antibody, isotype control antibody or piceatannol was administrated intraperitoneally at −1 and 0 days prior to infection (as in B and C). Each dot = 1 mouse. (G) S. Typhimurium CFU/g of liver tissue (left axis) and absolute # of anti-TCRγδ monoclonal antibody-treated and isotype-treated control mice (as in C) with liver invasion (right axis) 24h after S. Typhimurium infection. For CFU, medians and interquartile range shown, each dot = 1 mouse. n.s. = not significant, Fisher’s Exact test (right axis), Mann-Whitney u test (left axis). (H) Relative mRNA expression (qPCR) (mean and SEM) of Btnl1 is shown for SPF naïve and S. Typhimurium-infected (18h) mice.
(A) Means and SEM of TCRγδGFP cell speed are shown (measured with IVM) after S. Typhimurium infection (18h, red) or in the absence of infection (naïve, purple), and treatment with indicated drugs. Each dot = 1 movie. N = at least 4 mice/group in 3 independent experiments. Grey shaded area = SPF naïve value (Fig. 1). *** = p<0.001 (vs. SPF naïve) with two-tailed Students t test. (B) Graph shows mean and SEM of Z displacement per anatomical villus region (measured with IVM) as indicated after S. Typhimurium infection (18h) or naïve, and treatment with indicated drugs. Dashed line indicates naïve wild-type level of movement as measured in Fig. 1. N = at least 4 mice/group in 3 independent experiments. * = p<0.05, with two-tailed Students t test. (C) Unbiased computational quantification of flossing movements in naïve mice or after infection with S. Typhimurium (18h) and treatment with indicated drugs visualized by IVM (see Movies S5A–E). Frequency of flossing movements occurring in a “hotspot” area is shown for each villus region. N = 4–5 mice/group in 3 independent experiments. (D) Relative mRNA expression (mean and SEM, qPCR) of Il15 is shown for SPF naïve and S. Typhimurium-infected (18h) mice. (E) Anti-CD122 (IL-2/IL-15Rβ) monoclonal antibody was administrated intraperitoneally at −1 and 0 days prior to infection. Frequency of TCRγδ+ cell distribution along the duodenum, jejunum and ileum villi of anti-CD122 monoclonal antibody-treated mice after infection with S. Typhimurium (18h). Grey line indicates untreated S. Typhimurium (18h) infected values as in Fig. 2., black line indicates SPF naïve values as in Fig. 1. (F) Quantification of TCRγδ vertical (Z) displacement via IVM analysis. Pooled imaging data from anti-CD122-treated, S. Typhimurium (18h) infected mice is shown. Graph shows mean and SEM of Z displacement per anatomical villus region as indicated. Dashed line shows untreated S. Typhimurium (18h) infected mice values as in Fig. 2. (G) Unbiased computational quantification (mean and SEM) of inter-epithelial cell movements (flossing) in anti-CD122-treated (as in F) wild-type TCRγδGFP mice after S. Typhimurium infection (18h). Each dot = 1 movie, at least 3 mice/group in 2 independent experiments. Dashed line indicates SPF naïve values as in Fig. 1. (H) Naïve wild-type and MtorF2108L/F2108L mice were treated with rapamycin as in Fig. 5D and compared to untreated controls. Histogram of direct ex vivo pS6 staining of epithelial cells is shown. (I) Naïve or S. Typhimurium-infected (18h) WT mice were i.p. injected with 500 µg of 2-NBDG 45 min. before cell harvest and analysis via flow cytometry. Histogram of 2-NBDG expression of TCRγδ+ IELs is shown. (J) Mean Fluorescence Intensity (MFI) for 2-NBDG of TCRγδ+ IELs (as in I) is shown. (K) S. Typhimurium CFU/g of liver tissue (left axis) and absolute # of animals with liver invasion (right axis) 24h after infection in tamoxifen-treated iVilΔMyd88 mice with or without metformin treatment. For CFU, medians and interquartile range shown, each dot = 1 mouse. n.s. = not significant, Fisher’s Exact test (right axis), Mann-Whitney u test (left axis).
SPF (wild type, Part A, broad-spectrum antibiotics-treated, Part C) and Germ Free (wild type Part B, 1 week after re-conventionalization, Part D) TCRγδGFP reporter mice were anesthetized and a small section of the ileum was prepared for in vivo imaging, leaving the rest of the bowel intact. Mice were injected with Hoechst dye (blue) for visualization of epithelial cell nuclei. Imaging was acquired using a FV1000MPE Twin upright multiphoton system (Olympus). Time-lapse was +/− 30sec with a total acquisition time of 30min. The complete Z-stack (80 µm) of several ileum villi is visible within the field of vision, with the TCRγδ cells in green. A dot indicates a cell is being tracked, with the tracks shown in a time color-coded manner. Tracking was filtered for auto fluorescence. Imaris (Bitplane AG) software was used for data processing, with an adapted tracking algorithm. Part B, C and D contain insets of the SPF naïve (Part A) and GF naïve (Part B) movies as indicated for comparison.
IVM, using the identical image acquisition protocol from Movie S2, is shown for TCRγδGFP reporter mice after infection with S. Typhimurium for 2 hours (Part A) or 18 hours (Part B), with S. TyphimuriummCherry for 2 hours (zoomed in) (Part C), with Toxoplasma gondii (25 cysts for 6 hours, Part D) or Toxoplasma gondiiRFP (25 cysts for 6 hours, slow motion, Part E). Parts A, B and D contain insets of Movie S2A (SPF naïve) for comparison.
IVM, using the identical image acquisition protocol from Movie S2, is shown for steady state iVilΔMyd88-TCRγδGFP mice 1 wk. (Part A) or 4 wks. (Part B) after tamoxifen treatment (with Part A as inset for comparison). (Part C) Tamoxifen-treated iVilΔMyd88-TCRγδGFP were infected with S. Typhimurium 18h or (Part D) Toxoplasma gondii (25 cysts) 6h prior to imaging as above. Part C and D contain insets of infected Cre-control imaging as indicated for comparison.
IVM, using the identical image acquisition protocol from Movie S2, is shown for TCRγδGFP reporter mice after S. Typhimurium infection (18h, Part A–C) or naïve (Part D), and treatment with indicated drugs. Parts B and C contain inset of Part A for comparison. Part D contains inset of Movie S2A (SPF naïve) for comparison.
(A) Flow cytometry analysis of frequency and total cell count of IEL populations in the duodenum, jejunum and ileum of wildtype specific pathogen-free (SPF) and germ-free (GF) mice. Cell number was adjusted by the size of each region in centimeters. Means and SEM shown. IEL populations were gated as: TCRγδ+CD8α+; TCRαβ+CD8αα+; TCRαβ+CD8αβ+; TCRαβ+CD4+CD8β−; TCRαβ+CD4+CD8β−CD8α+ (all among CD45+ cells). (B, C) Representative images of cleared (FocusClear™) jejunum and ileum villi of SPF and GF TCRγδGFP mice. In green (GFP), TCRγδ+ cells and in blue (Hoechst), EC nuclei. (D) Representative images of non-cleared cryosections of jejunum and ileum villi of SPF and GF TCRγδGFP mice. In green (GFP), TCRγδ+ cells and in blue (Hoechst), EC nuclei. (E) Frequency of TCRγδ+ cell distribution along the duodenum, jejunum and ileum villi of 4-week broad-spectrum antibiotic-treated SPF mice (SPFABX) or SPFABX mice treated with LPS for 7 days after ABX treatment, prior to imaging analysis (SPFABX+LPS). Dashed line indicates mean of median positions for 4 mice/group. (F) Frequency of TCRγδ+ cell distribution along the duodenum and jejunum villi of GF mice, mono-colonized for 5 days with SFB (GFSFB), bi-colonized for 5 days with Bacteroides vulgatus + Enterococcus faecalis (GFB.v. + E.f.) or treated for 7 days with LPS (GFLPS). Dashed line indicates mean of median positions for 4 mice/group. Grey shading shows GF data as found in Fig. 1A. (G) Relative abundance of microbial 16S RNA in each intestinal segment shown using a universal (left panel) or bacteria specific (right panel) qPCR primer. Means and SEM shown. (H) Means and SEM of TCRγδGFP cell speed are shown, each dot = 1 movie, N = 4–5 mice/group in 3 independent experiments. ANOVA and post-hoc Bonferroni multiple comparison test showed no significant differences for SPF vs. any group or GF vs. any group. (I) Intravital microscopy (IVM) analyses of TCRγδGFP SPF mice treated for 4 weeks with broad-spectrum antibiotics (SPFABX) prior to analysis or SPFABX mice treated with LPS for 7 days after ABX treatment, prior to imaging analysis (SPFABX+LPS). Quantification of unique area covered/IEL/hour, means and SEM shown, each dot = 1 movie, n = at least 4 mice/group in 3 independent experiments. (J) Visualization and quantification of TCRγδ vertical (Z) displacement. Pooled imaging data from SPFABX and SPFABX+LPS mice is shown. Grey shading shows SPF naïve data as in Fig. 1. Panels show starting position and mean vertical displacement over time for each individual cell within each movie. Color density and size indicate degree of Z displacement down- (blue) or upwards (red). Graph shows mean and SEM of Z displacement per anatomical villus region as indicated. * = p<0.05, ** = p<0.01, *** = p<0.001 with ANOVA and post-hoc Bonferroni multiple comparison test (E, I, J), Student’s t test (A).
(A) Quantification (means and SEM) of unique area covered/IEL/hour (measured with IVM) after infection with Salmonella and Toxoplasma at indicated time points. *** = p<0.001 with ANOVA and post-hoc Bonferroni multiple comparison test. (B) Unbiased computational quantification of flossing movements after infection with Salmonella or Toxoplasma at indicated time points and visualized by IVM (see Movies S3A–C). Frequency of flossing movements occurring in a “hotspot” area is shown for each villus region, N = 4–5 mice/group in 3 independent experiments. (C) Representative images of cleared (FocusClear™) duodenum, jejunum and ileum villi of S. Typhimurium-infected TCRγδGFP mice after 2h or 18h of infection. In green (GFP), TCRγδ+ cells and in blue (Hoechst), EC nuclei. (D) Representative images of cleared (FocusClear™) duodenum, jejunum and ileum villi of S. TyphimuriummCherry-infected (2h) and ToxoplasmaRFP infected (25 cysts, 6h) TCRγδGFP mice. In green (GFP), TCRγδ+ cells and in blue (Hoechst), EC nuclei, in red (mCherry or RFP) Salmonella and Toxoplasma respectively. (E) Mean and SEM of TCRγδGFP cell speed are shown after 6h infection with Toxoplasma (25 cysts), each dot= 1 movie, N = 4–5 mice/group in 3 independent experiments. (F) Frequency of TCRγδGFP cell distribution along cleared duodenum, jejunum and ileum villi after 6h infection with Toxoplasma (25 or 100 cysts) or in naïve TCRγδGFP mice (grey shading). Dashed line indicates mean of median positions for 2 mice/group.
Sorted ECs (CD45−EpCAM+) (A) and TCRγδ IELs (CD45+EpCAM−TCRαβ−TCRγδ+CD8α+) (B) were isolated from naïve wild-type mice or from tamoxifen-treated S. Typhimurium-infected iVilΔMyd88 and Cre− littermate control mice. Individual gene expression (row normalized) is shown for genes involved in indicated GO Biological Processes. Only genes with minimal expression exceeding 0.5 RPKM (top 30 %) are shown. (C) ELISA for IL-1β was performed in intestinal tissue samples from naïve and S. Typhimurium-infected (18h) wild-type animals. Mean and SEM shown. (D) For all TCRγδ IEL genes meeting criteria i and ii described in the Fig. 3E legend, GO/PANTHER pathway overrepresentation testing was performed. Bonferroni adjusted p value used for cutoff (dashed line) is p<0.05.
Highlights.
-
-
γδ IELs display microbe-dependent localization and motility patterns
-
-
Infection induces rapid behavioral changes in γδ IELs
-
-
Coordinated epithelial cell-IEL responses to pathogens are EC-Myd88 dependent
-
-
EC-IEL responses to microbial cues trigger a protective IEL metabolic switch
Acknowledgments
We are indebted to N. Thomas and K. Gordon for sorting cells, to T. K. Oliveira for assistance with RNA sequencing analysis and other members of the Nussenzweig lab and The Rockefeller University employees for continuous assistance. We thank S. Robine (Institut Curie) for VilCreER mice, Y. Zhang (Duke) for TcrdCreER mice, E. D. Abel (University of Iowa) for Scl2a1f/f mice, Y. Belkaid (N.I.H.) for Toxoplasma gondiiRFP and J. Cross (M.S.K.C.C.) for support with the metabolic studies. We thank G. Shakhar (Weizmann Institute) for discussions regarding initial imaging experiments. We especially thank A. Rogoz for outstanding technical support. We thank members of our laboratory, particularly A. Lockhart, and D. Esterhazy, for discussions and critical reading and editing of the manuscript. This work was supported by Leona M. and Harry B. Helmsley Charitable Trust (B.R., D.HvK., V.P., D.M.), Alexandre Suerman Stipend, Royal Netherlands Academy of Sciences Ter Meulen Award and the Prince Bernhard Cultural Foundation (D.HvK.), the Crohn’s & Colitis Foundation of America (B.R., D.M.), the Burroughs Wellcome PATH award and National Institutes of Health NIH R01 DK093674 and R01 DK113375 grants (D.M.). The Rockefeller University Bio-Imaging Resource Center is supported by the Empire State Stem Cell Fund through NYSDOH C023046.
Footnotes
Publisher's Disclaimer: This is a PDF file of an unedited manuscript that has been accepted for publication. As a service to our customers we are providing this early version of the manuscript. The manuscript will undergo copyediting, typesetting, and review of the resulting proof before it is published in its final citable form. Please note that during the production process errors may be discovered which could affect the content, and all legal disclaimers that apply to the journal pertain.
Author Contributions
D.M. conceived; D.M and B.S.R. supervised this study; D.vK, B.S.R., V.A.P. and D.M. designed experiments; D.vK., B.S.R. and V.A.P. performed and analyzed experiments; J.F. and G.V. helped setting up and performed initial IVM experiments. D.vK., B.S.R., V.A.P., J.F. and G.V. prepared figures and helped with manuscript preparation; D.M. wrote the paper.
References
- Bandeira A, Mota-Santos T, Itohara S, Degermann S, Heusser C, Tonegawa S, Coutinho A. Localization of gamma/delta T cells to the intestinal epithelium is independent of normal microbial colonization. J. Exp. Med. 1990;172:239–244. doi: 10.1084/jem.172.1.239. [DOI] [PMC free article] [PubMed] [Google Scholar]
- Boismenu R, Havran WL. Modulation of epithelial cell growth by intraepithelial gamma delta T cells. Science. 1994;266:1253–1255. doi: 10.1126/science.7973709. [DOI] [PubMed] [Google Scholar]
- Brown EM, Sadarangani M, Finlay BB. The role of the immune system in governing host-microbe interactions in the intestine. Nat. Immunol. 2013;14:660–667. doi: 10.1038/ni.2611. [DOI] [PubMed] [Google Scholar]
- Buck MD, O'Sullivan D, Pearce EL. T cell metabolism drives immunity. J. Exp. Med. 2015;212:1345–1360. doi: 10.1084/jem.20151159. [DOI] [PMC free article] [PubMed] [Google Scholar]
- Chang CH, Curtis JD, Maggi LB, Jr, Faubert B, Villarino AV, O'Sullivan D, Huang SC, van der Windt GJ, Blagih J, Qiu J, et al. Posttranscriptional control of T cell effector function by aerobic glycolysis. Cell. 2013;153:1239–1251. doi: 10.1016/j.cell.2013.05.016. [DOI] [PMC free article] [PubMed] [Google Scholar]
- Cheroutre H, Lambolez F, Mucida D. The light and dark sides of intestinal intraepithelial lymphocytes. Nat. Rev. Immunol. 2011;11:445–456. doi: 10.1038/nri3007. [DOI] [PMC free article] [PubMed] [Google Scholar]
- Chieppa M, Rescigno M, Huang AY, Germain RN. Dynamic imaging of dendritic cell extension into the small bowel lumen in response to epithelial cell TLR engagement. J. Exp. Med. 2006;203:2841–2852. doi: 10.1084/jem.20061884. [DOI] [PMC free article] [PubMed] [Google Scholar]
- Chodaczek G, Papanna V, Zal MA, Zal T. Body-barrier surveillance by epidermal gammadelta TCRs. Nat. Immunol. 2012;13:272–282. doi: 10.1038/ni.2240. [DOI] [PMC free article] [PubMed] [Google Scholar]
- Conesa A, Madrigal P, Tarazona S, Gomez-Cabrero D, Cervera A, McPherson A, Szczesniak MW, Gaffney DJ, Elo LL, Zhang X, et al. A survey of best practices for RNA-seq data analysis. Genome Biol. 2016;17:13. doi: 10.1186/s13059-016-0881-8. [DOI] [PMC free article] [PubMed] [Google Scholar]
- Dalton JE, Cruickshank SM, Egan CE, Mears R, Newton DJ, Andrew EM, Lawrence B, Howell G, Else KJ, Gubbels MJ, et al. Intraepithelial gammadelta+ lymphocytes maintain the integrity of intestinal epithelial tight junctions in response to infection. Gastroenterology. 2006;131:818–829. doi: 10.1053/j.gastro.2006.06.003. [DOI] [PubMed] [Google Scholar]
- DePaolo RW, Abadie V, Tang F, Fehlner-Peach H, Hall JA, Wang W, Marietta EV, Kasarda DD, Waldmann TA, Murray JA, et al. Co-adjuvant effects of retinoic acid and IL-15 induce inflammatory immunity to dietary antigens. Nature. 2011;471:220–224. doi: 10.1038/nature09849. [DOI] [PMC free article] [PubMed] [Google Scholar]
- Dessein R, Gironella M, Vignal C, Peyrin-Biroulet L, Sokol H, Secher T, Lacas-Gervais S, Gratadoux JJ, Lafont F, Dagorn JC, et al. Toll-like receptor 2 is critical for induction of Reg3 beta expression and intestinal clearance of Yersinia pseudotuberculosis. Gut. 2009;58:771–776. doi: 10.1136/gut.2008.168443. [DOI] [PubMed] [Google Scholar]
- Di Marco Barros R, Roberts NA, Dart RJ, Vantourout P, Jandke A, Nussbaumer O, Deban L, Cipolat S, Hart R, Iannitto ML, et al. Epithelia Use Butyrophilin-like Molecules to Shape Organ-Specific gammadelta T Cell Compartments. Cell. 2016;167:203–218. e217. doi: 10.1016/j.cell.2016.08.030. [DOI] [PMC free article] [PubMed] [Google Scholar]
- Edelblum KL, Shen L, Weber CR, Marchiando AM, Clay BS, Wang Y, Prinz I, Malissen B, Sperling AI, Turner JR. Dynamic migration of gammadelta intraepithelial lymphocytes requires occludin. Proc. Natl. Acad. Sci. USA. 2012;109:7097–7102. doi: 10.1073/pnas.1112519109. [DOI] [PMC free article] [PubMed] [Google Scholar]
- Edelblum KL, Singh G, Odenwald MA, Lingaraju A, El Bissati K, McLeod R, Sperling AI, Turner JR. gammadelta Intraepithelial Lymphocyte Migration Limits Transepithelial Pathogen Invasion and Systemic Disease in Mice. Gastroenterology. 2015;148:1417–1426. doi: 10.1053/j.gastro.2015.02.053. [DOI] [PMC free article] [PubMed] [Google Scholar]
- Ersching J, Efeyan A, Mesin L, Jacobsen JT, Pasqual G, Grabiner BC, Dominguez-Sola D, Sabatini DM, Victora GD. Germinal Center Selection and Affinity Maturation Require Dynamic Regulation of mTORC1 Kinase. Immunity. 2017;46:1045–1058. e1046. doi: 10.1016/j.immuni.2017.06.005. [DOI] [PMC free article] [PubMed] [Google Scholar]
- Farache J, Koren I, Milo I, Gurevich I, Kim KW, Zigmond E, Furtado GC, Lira SA, Shakhar G. Luminal bacteria recruit CD103+ dendritic cells into the intestinal epithelium to sample bacterial antigens for presentation. Immunity. 2013;38:581–595. doi: 10.1016/j.immuni.2013.01.009. [DOI] [PMC free article] [PubMed] [Google Scholar]
- Gabanyi I, Muller PA, Feighery L, Oliveira TY, Costa-Pinto FA, Mucida D. Neuro-immune Interactions Drive Tissue Programming in Intestinal Macrophages. Cell. 2016;164:378–391. doi: 10.1016/j.cell.2015.12.023. [DOI] [PMC free article] [PubMed] [Google Scholar]
- Germain RN, Robey EA, Cahalan MD. A decade of imaging cellular motility and interaction dynamics in the immune system. Science. 2012;336:1676–1681. doi: 10.1126/science.1221063. [DOI] [PMC free article] [PubMed] [Google Scholar]
- Hammad H, Chieppa M, Perros F, Willart MA, Germain RN, Lambrecht BN. House dust mite allergen induces asthma via Toll-like receptor 4 triggering of airway structural cells. Nat. Med. 2009;15:410–416. doi: 10.1038/nm.1946. [DOI] [PMC free article] [PubMed] [Google Scholar]
- Hayday AC. Gammadelta T cells and the lymphoid stress-surveillance response. Immunity. 2009;31:184–196. doi: 10.1016/j.immuni.2009.08.006. [DOI] [PubMed] [Google Scholar]
- Hooper LV, Macpherson AJ. Immune adaptations that maintain homeostasis with the intestinal microbiota. Nat. Rev. Immunol. 2010;10:159–169. doi: 10.1038/nri2710. [DOI] [PubMed] [Google Scholar]
- Ismail AS, Severson KM, Vaishnava S, Behrendt CL, Yu X, Benjamin JL, Ruhn KA, Hou B, DeFranco AL, Yarovinsky F, et al. Gammadelta intraepithelial lymphocytes are essential mediators of host-microbial homeostasis at the intestinal mucosal surface. Proc. Natl. Acad. Sci. USA. 2011;108:8743–8748. doi: 10.1073/pnas.1019574108. [DOI] [PMC free article] [PubMed] [Google Scholar]
- Jabri B, Abadie V. IL-15 functions as a danger signal to regulate tissue-resident T cells and tissue destruction. Nat. Rev. Immunol. 2015;15:771–783. doi: 10.1038/nri3919. [DOI] [PMC free article] [PubMed] [Google Scholar]
- Karin M, Clevers H. Reparative inflammation takes charge of tissue regeneration. Nature. 2016;529:307–315. doi: 10.1038/nature17039. [DOI] [PMC free article] [PubMed] [Google Scholar]
- Krawczyk CM, Holowka T, Sun J, Blagih J, Amiel E, DeBerardinis RJ, Cross JR, Jung E, Thompson CB, Jones RG, et al. Toll-like receptor-induced changes in glycolytic metabolism regulate dendritic cell activation. Blood. 2010;115:4742–4749. doi: 10.1182/blood-2009-10-249540. [DOI] [PMC free article] [PubMed] [Google Scholar]
- Li Z, Zhang C, Zhou Z, Zhang J, Zhang J, Tian Z. Small intestinal intraepithelial lymphocytes expressing CD8 and T cell receptor gammadelta are involved in bacterial clearance during Salmonella enterica serovar Typhimurium infection. Infect. Immun. 2012;80:565–574. doi: 10.1128/IAI.05078-11. [DOI] [PMC free article] [PubMed] [Google Scholar]
- Macintyre AN, Gerriets VA, Nichols AG, Michalek RD, Rudolph MC, Deoliveira D, Anderson SM, Abel ED, Chen BJ, Hale LP, et al. The glucose transporter Glut1 is selectively essential for CD4 T cell activation and effector function. Cell Metab. 2014;20:61–72. doi: 10.1016/j.cmet.2014.05.004. [DOI] [PMC free article] [PubMed] [Google Scholar]
- Mackay LK, Minnich M, Kragten NA, Liao Y, Nota B, Seillet C, Zaid A, Man K, Preston S, Freestone D, et al. Hobit and Blimp1 instruct a universal transcriptional program of tissue residency in lymphocytes. Science. 2016;352:459–463. doi: 10.1126/science.aad2035. [DOI] [PubMed] [Google Scholar]
- Masopust D, Vezys V, Marzo AL, Lefrancois L. Preferential localization of effector memory cells in nonlymphoid tissue. Science. 2001;291:2413–2417. doi: 10.1126/science.1058867. [DOI] [PubMed] [Google Scholar]
- Meresse B, Chen Z, Ciszewski C, Tretiakova M, Bhagat G, Krausz TN, Raulet DH, Lanier LL, Groh V, Spies T, et al. Coordinated induction by IL15 of a TCR-independent NKG2D signaling pathway converts CTL into lymphokine-activated killer cells in celiac disease. Immunity. 2004;21:357–366. doi: 10.1016/j.immuni.2004.06.020. [DOI] [PubMed] [Google Scholar]
- Meresse B, Curran SA, Ciszewski C, Orbelyan G, Setty M, Bhagat G, Lee L, Tretiakova M, Semrad C, Kistner E, et al. Reprogramming of CTLs into natural killer-like cells in celiac disease. J. Exp. Med. 2006;203:1343–1355. doi: 10.1084/jem.20060028. [DOI] [PMC free article] [PubMed] [Google Scholar]
- Mi H, Muruganujan A, Casagrande JT, Thomas PD. Large-scale gene function analysis with the PANTHER classification system. Nat. Protoc. 2013;8:1551–1566. doi: 10.1038/nprot.2013.092. [DOI] [PMC free article] [PubMed] [Google Scholar]
- Mucida D, Park Y, Kim G, Turovskaya O, Scott I, Kronenberg M, Cheroutre H. Reciprocal TH17 and regulatory T cell differentiation mediated by retinoic acid. Science. 2007;317:256–260. doi: 10.1126/science.1145697. [DOI] [PubMed] [Google Scholar]
- Park JH, Kotani T, Konno T, Setiawan J, Kitamura Y, Imada S, Usui Y, Hatano N, Shinohara M, Saito Y, et al. Promotion of Intestinal Epithelial Cell Turnover by Commensal Bacteria: Role of Short-Chain Fatty Acids. PLoS One. 2016;11:e0156334. doi: 10.1371/journal.pone.0156334. [DOI] [PMC free article] [PubMed] [Google Scholar]
- Rakoff-Nahoum S, Paglino J, Eslami-Varzaneh F, Edberg S, Medzhitov R. Recognition of commensal microflora by toll-like receptors is required for intestinal homeostasis. Cell. 2004;118:229–241. doi: 10.1016/j.cell.2004.07.002. [DOI] [PubMed] [Google Scholar]
- Reis BS, Hoytema van Konijnenburg DP, Grivennikov SI, Mucida D. Transcription Factor T-bet Regulates Intraepithelial Lymphocyte Functional Maturation. Immunity. 2014;41:244–256. doi: 10.1016/j.immuni.2014.06.017. [DOI] [PMC free article] [PubMed] [Google Scholar]
- Sano T, Huang W, Hall JA, Yang Y, Chen A, Gavzy SJ, Lee JY, Ziel JW, Miraldi ER, Domingos AI, et al. An IL-23R/IL-22 Circuit Regulates Epithelial Serum Amyloid A to Promote Local Effector Th17 Responses. Cell. 2015;163:381–393. doi: 10.1016/j.cell.2015.08.061. [DOI] [PMC free article] [PubMed] [Google Scholar]
- Shin H, Iwasaki A. Tissue-resident memory T cells. Immunol. Rev. 2013;255:165–181. doi: 10.1111/imr.12087. [DOI] [PMC free article] [PubMed] [Google Scholar]
- Slack E, Hapfelmeier S, Stecher B, Velykoredko Y, Stoel M, Lawson MA, Geuking MB, Beutler B, Tedder TF, Hardt WD, et al. Innate and adaptive immunity cooperate flexibly to maintain host-microbiota mutualism. Science. 2009;325:617–620. doi: 10.1126/science.1172747. [DOI] [PMC free article] [PubMed] [Google Scholar]
- Staton TL, Habtezion A, Winslow MM, Sato T, Love PE, Butcher EC. CD8+ recent thymic emigrants home to and efficiently repopulate the small intestine epithelium. Nat. Immunol. 2006;7:482–488. doi: 10.1038/ni1319. [DOI] [PubMed] [Google Scholar]
- Sujino T, London M, Hoytema van Konijnenburg DP, Rendon T, Buch T, Silva HM, Lafaille JJ, Reis BS, Mucida D. Tissue adaptation of regulatory and intraepithelial CD4(+) T cells controls gut inflammation. Science. 2016;352:1581–1586. doi: 10.1126/science.aaf3892. [DOI] [PMC free article] [PubMed] [Google Scholar]
- Tang F, Chen Z, Ciszewski C, Setty M, Solus J, Tretiakova M, Ebert E, Han J, Lin A, Guandalini S, et al. Cytosolic PLA2 is required for CTL-mediated immunopathology of celiac disease via NKG2D and IL-15. J. Exp. Med. 2009;206:707–719. doi: 10.1084/jem.20071887. [DOI] [PMC free article] [PubMed] [Google Scholar]
- Vaishnava S, Behrendt CL, Ismail AS, Eckmann L, Hooper LV. Paneth cells directly sense gut commensals and maintain homeostasis at the intestinal host-microbial interface. Proc. Natl. Acad. Sci. USA. 2008;105:20858–20863. doi: 10.1073/pnas.0808723105. [DOI] [PMC free article] [PubMed] [Google Scholar]
- Vander Heiden MG, Cantley LC, Thompson CB. Understanding the Warburg effect: the metabolic requirements of cell proliferation. Science. 2009;324:1029–1033. doi: 10.1126/science.1160809. [DOI] [PMC free article] [PubMed] [Google Scholar]
- Vantourout P, Hayday A. Six-of-the-best: unique contributions of gammadelta T cells to immunology. Nat. Rev. Immunol. 2013;13:88–100. doi: 10.1038/nri3384. [DOI] [PMC free article] [PubMed] [Google Scholar]
- Wang A, Huen SC, Luan HH, Yu S, Zhang C, Gallezot JD, Booth CJ, Medzhitov R. Opposing Effects of Fasting Metabolism on Tissue Tolerance in Bacterial and Viral Inflammation. Cell. 2016;166:1512–1525. e1512. doi: 10.1016/j.cell.2016.07.026. [DOI] [PMC free article] [PubMed] [Google Scholar]
- Wang X, Sumida H, Cyster JG. GPR18 is required for a normal CD8alphaalpha intestinal intraepithelial lymphocyte compartment. J. Exp. Med. 2014;211:2351–2359. doi: 10.1084/jem.20140646. [DOI] [PMC free article] [PubMed] [Google Scholar]
- Yang H, Antony PA, Wildhaber BE, Teitelbaum DH. Intestinal intraepithelial lymphocyte gamma delta-T cell-derived keratinocyte growth factor modulates epithelial growth in the mouse. J. Immunol. 2004;172:4151–4158. doi: 10.4049/jimmunol.172.7.4151. [DOI] [PubMed] [Google Scholar]
- Zaph C, Troy AE, Taylor BC, Berman-Booty LD, Guild KJ, Du Y, Yost EA, Gruber AD, May MJ, Greten FR, et al. Epithelial-cell-intrinsic IKK-beta expression regulates intestinal immune homeostasis. Nature. 2007;446:552–556. doi: 10.1038/nature05590. [DOI] [PubMed] [Google Scholar]
- Zhang B, Wu J, Jiao Y, Bock C, Dai M, Chen B, Chao N, Zhang W, Zhuang Y. Differential Requirements of TCR Signaling in Homeostatic Maintenance and Function of Dendritic Epidermal T Cells. J. Immunol. 2015;195:4282–4291. doi: 10.4049/jimmunol.1501220. [DOI] [PMC free article] [PubMed] [Google Scholar]
Associated Data
This section collects any data citations, data availability statements, or supplementary materials included in this article.
Supplementary Materials
(Part A) TCRγδGFP reporter mice were anesthetized and subsequently perfused with PBS 1× followed by 4% paraformaldehyde (PFA). A small section of the ileum was prepared following the iDISCO protocol as detailed in the STAR methods section. Samples were stained with anti-ZO-1 (red) and anti-GFP (green) antibodies after which imaging was acquired using an Ultramicroscope (LaVision BioTec) with light sheet illumination and adjusted post-hoc in Imaris. The complete Z-stack (200 – 300 µm) of several ileum villi is visible within the field of vision. Imaris (Bitplane AG) software was used for data processing using the standard Spots algorithm to identify cells compared to background. (Part B) TCRγδGFP reporter mice were anesthetized and subsequently perfused with PBS 1× followed by 4% paraformaldehyde (PFA). A small section of the ileum was prepared for an additional 2 hours of fixation in 4% PFA. Tissue clearing was performed using FocusClear™ (CelExplorer Labs Co.), preserving the native GFP, after which imaging was acquired using an inverted LSM 880 NLO laser scanning confocal and multiphoton microscope (Zeiss). The complete Z-stack (200–300 µm) of several ileum villi is visible within the field of vision, with the TCRγδ cells in green (GFP). Imaris (Bitplane AG) software was used for data processing using the standard Spots algorithm to identify cells compared to background.
(A) TCRγδ+ IELs of naïve, 4-week broad-spectrum antibiotic-treated (ABX) and S. Typhimuriu-minfected (18h) Nur77GFP mice were analyzed for Nur77 (GFP) expression by flow cytometry. Mean Fluorescence Intensity (MFI) and SEM is shown. (B) Nur77GFP mice were i.p. injected with 500 µg of piceatannol at days −1 and 0 before cell harvest. IELs were in vitro stimulated with 5 µg/mL of plate-bound α-CD3 for 3 h at 37°C and stained for flow cytometry analysis. Mean Fluorescence Intensity (MFI) and SEM is shown. (C). Nur77GFP mice were i.p. injected with 400 µg of anti-murine TCRγδ antibody (clone UC7-13D5) or isotype control in 100 µl PBS at days −1 and 0 before cell harvest. IELs were in vitro stimulated with 5 µg/mL of plate-bound α-CD3 and α-TCRγδ (clone GL-3) for 3 h at 37°C and stained for flow cytometry analysis. Mean Fluorescence Intensity (MFI) and SEM is shown. (D) Frequency of TCRγδ+ cell distribution along the duodenum, jejunum and ileum villi of piceatannol-treated mice (as in B) after infection with S. Typhimurium (2h). Red line = untreated S. Typhimurium (2h) infected mice as in Fig. 2. Grey shading indicates SPF naïve values (Fig. 1). (E) Quantification of TCRγδ vertical (Z) displacement via IVM analysis. Pooled imaging data from piceatannol-treated or anti-TCRγδ-treated, S. Typhimurium-infected mice are shown. Graph shows mean and SEM of Z displacement per anatomical villus region as indicated. Dashed line shows SPF S. Typhimurium (2h) infected mice values as in Fig. 2. (F) Unbiased computational quantification (mean and SEM) of inter-epithelial cell movements (flossing) in wild-type TCRγδGFP mice after S. Typhimurium infection (18h). Anti-TCRγδ blocking antibody, isotype control antibody or piceatannol was administrated intraperitoneally at −1 and 0 days prior to infection (as in B and C). Each dot = 1 mouse. (G) S. Typhimurium CFU/g of liver tissue (left axis) and absolute # of anti-TCRγδ monoclonal antibody-treated and isotype-treated control mice (as in C) with liver invasion (right axis) 24h after S. Typhimurium infection. For CFU, medians and interquartile range shown, each dot = 1 mouse. n.s. = not significant, Fisher’s Exact test (right axis), Mann-Whitney u test (left axis). (H) Relative mRNA expression (qPCR) (mean and SEM) of Btnl1 is shown for SPF naïve and S. Typhimurium-infected (18h) mice.
(A) Means and SEM of TCRγδGFP cell speed are shown (measured with IVM) after S. Typhimurium infection (18h, red) or in the absence of infection (naïve, purple), and treatment with indicated drugs. Each dot = 1 movie. N = at least 4 mice/group in 3 independent experiments. Grey shaded area = SPF naïve value (Fig. 1). *** = p<0.001 (vs. SPF naïve) with two-tailed Students t test. (B) Graph shows mean and SEM of Z displacement per anatomical villus region (measured with IVM) as indicated after S. Typhimurium infection (18h) or naïve, and treatment with indicated drugs. Dashed line indicates naïve wild-type level of movement as measured in Fig. 1. N = at least 4 mice/group in 3 independent experiments. * = p<0.05, with two-tailed Students t test. (C) Unbiased computational quantification of flossing movements in naïve mice or after infection with S. Typhimurium (18h) and treatment with indicated drugs visualized by IVM (see Movies S5A–E). Frequency of flossing movements occurring in a “hotspot” area is shown for each villus region. N = 4–5 mice/group in 3 independent experiments. (D) Relative mRNA expression (mean and SEM, qPCR) of Il15 is shown for SPF naïve and S. Typhimurium-infected (18h) mice. (E) Anti-CD122 (IL-2/IL-15Rβ) monoclonal antibody was administrated intraperitoneally at −1 and 0 days prior to infection. Frequency of TCRγδ+ cell distribution along the duodenum, jejunum and ileum villi of anti-CD122 monoclonal antibody-treated mice after infection with S. Typhimurium (18h). Grey line indicates untreated S. Typhimurium (18h) infected values as in Fig. 2., black line indicates SPF naïve values as in Fig. 1. (F) Quantification of TCRγδ vertical (Z) displacement via IVM analysis. Pooled imaging data from anti-CD122-treated, S. Typhimurium (18h) infected mice is shown. Graph shows mean and SEM of Z displacement per anatomical villus region as indicated. Dashed line shows untreated S. Typhimurium (18h) infected mice values as in Fig. 2. (G) Unbiased computational quantification (mean and SEM) of inter-epithelial cell movements (flossing) in anti-CD122-treated (as in F) wild-type TCRγδGFP mice after S. Typhimurium infection (18h). Each dot = 1 movie, at least 3 mice/group in 2 independent experiments. Dashed line indicates SPF naïve values as in Fig. 1. (H) Naïve wild-type and MtorF2108L/F2108L mice were treated with rapamycin as in Fig. 5D and compared to untreated controls. Histogram of direct ex vivo pS6 staining of epithelial cells is shown. (I) Naïve or S. Typhimurium-infected (18h) WT mice were i.p. injected with 500 µg of 2-NBDG 45 min. before cell harvest and analysis via flow cytometry. Histogram of 2-NBDG expression of TCRγδ+ IELs is shown. (J) Mean Fluorescence Intensity (MFI) for 2-NBDG of TCRγδ+ IELs (as in I) is shown. (K) S. Typhimurium CFU/g of liver tissue (left axis) and absolute # of animals with liver invasion (right axis) 24h after infection in tamoxifen-treated iVilΔMyd88 mice with or without metformin treatment. For CFU, medians and interquartile range shown, each dot = 1 mouse. n.s. = not significant, Fisher’s Exact test (right axis), Mann-Whitney u test (left axis).
SPF (wild type, Part A, broad-spectrum antibiotics-treated, Part C) and Germ Free (wild type Part B, 1 week after re-conventionalization, Part D) TCRγδGFP reporter mice were anesthetized and a small section of the ileum was prepared for in vivo imaging, leaving the rest of the bowel intact. Mice were injected with Hoechst dye (blue) for visualization of epithelial cell nuclei. Imaging was acquired using a FV1000MPE Twin upright multiphoton system (Olympus). Time-lapse was +/− 30sec with a total acquisition time of 30min. The complete Z-stack (80 µm) of several ileum villi is visible within the field of vision, with the TCRγδ cells in green. A dot indicates a cell is being tracked, with the tracks shown in a time color-coded manner. Tracking was filtered for auto fluorescence. Imaris (Bitplane AG) software was used for data processing, with an adapted tracking algorithm. Part B, C and D contain insets of the SPF naïve (Part A) and GF naïve (Part B) movies as indicated for comparison.
IVM, using the identical image acquisition protocol from Movie S2, is shown for TCRγδGFP reporter mice after infection with S. Typhimurium for 2 hours (Part A) or 18 hours (Part B), with S. TyphimuriummCherry for 2 hours (zoomed in) (Part C), with Toxoplasma gondii (25 cysts for 6 hours, Part D) or Toxoplasma gondiiRFP (25 cysts for 6 hours, slow motion, Part E). Parts A, B and D contain insets of Movie S2A (SPF naïve) for comparison.
IVM, using the identical image acquisition protocol from Movie S2, is shown for steady state iVilΔMyd88-TCRγδGFP mice 1 wk. (Part A) or 4 wks. (Part B) after tamoxifen treatment (with Part A as inset for comparison). (Part C) Tamoxifen-treated iVilΔMyd88-TCRγδGFP were infected with S. Typhimurium 18h or (Part D) Toxoplasma gondii (25 cysts) 6h prior to imaging as above. Part C and D contain insets of infected Cre-control imaging as indicated for comparison.
IVM, using the identical image acquisition protocol from Movie S2, is shown for TCRγδGFP reporter mice after S. Typhimurium infection (18h, Part A–C) or naïve (Part D), and treatment with indicated drugs. Parts B and C contain inset of Part A for comparison. Part D contains inset of Movie S2A (SPF naïve) for comparison.
(A) Flow cytometry analysis of frequency and total cell count of IEL populations in the duodenum, jejunum and ileum of wildtype specific pathogen-free (SPF) and germ-free (GF) mice. Cell number was adjusted by the size of each region in centimeters. Means and SEM shown. IEL populations were gated as: TCRγδ+CD8α+; TCRαβ+CD8αα+; TCRαβ+CD8αβ+; TCRαβ+CD4+CD8β−; TCRαβ+CD4+CD8β−CD8α+ (all among CD45+ cells). (B, C) Representative images of cleared (FocusClear™) jejunum and ileum villi of SPF and GF TCRγδGFP mice. In green (GFP), TCRγδ+ cells and in blue (Hoechst), EC nuclei. (D) Representative images of non-cleared cryosections of jejunum and ileum villi of SPF and GF TCRγδGFP mice. In green (GFP), TCRγδ+ cells and in blue (Hoechst), EC nuclei. (E) Frequency of TCRγδ+ cell distribution along the duodenum, jejunum and ileum villi of 4-week broad-spectrum antibiotic-treated SPF mice (SPFABX) or SPFABX mice treated with LPS for 7 days after ABX treatment, prior to imaging analysis (SPFABX+LPS). Dashed line indicates mean of median positions for 4 mice/group. (F) Frequency of TCRγδ+ cell distribution along the duodenum and jejunum villi of GF mice, mono-colonized for 5 days with SFB (GFSFB), bi-colonized for 5 days with Bacteroides vulgatus + Enterococcus faecalis (GFB.v. + E.f.) or treated for 7 days with LPS (GFLPS). Dashed line indicates mean of median positions for 4 mice/group. Grey shading shows GF data as found in Fig. 1A. (G) Relative abundance of microbial 16S RNA in each intestinal segment shown using a universal (left panel) or bacteria specific (right panel) qPCR primer. Means and SEM shown. (H) Means and SEM of TCRγδGFP cell speed are shown, each dot = 1 movie, N = 4–5 mice/group in 3 independent experiments. ANOVA and post-hoc Bonferroni multiple comparison test showed no significant differences for SPF vs. any group or GF vs. any group. (I) Intravital microscopy (IVM) analyses of TCRγδGFP SPF mice treated for 4 weeks with broad-spectrum antibiotics (SPFABX) prior to analysis or SPFABX mice treated with LPS for 7 days after ABX treatment, prior to imaging analysis (SPFABX+LPS). Quantification of unique area covered/IEL/hour, means and SEM shown, each dot = 1 movie, n = at least 4 mice/group in 3 independent experiments. (J) Visualization and quantification of TCRγδ vertical (Z) displacement. Pooled imaging data from SPFABX and SPFABX+LPS mice is shown. Grey shading shows SPF naïve data as in Fig. 1. Panels show starting position and mean vertical displacement over time for each individual cell within each movie. Color density and size indicate degree of Z displacement down- (blue) or upwards (red). Graph shows mean and SEM of Z displacement per anatomical villus region as indicated. * = p<0.05, ** = p<0.01, *** = p<0.001 with ANOVA and post-hoc Bonferroni multiple comparison test (E, I, J), Student’s t test (A).
(A) Quantification (means and SEM) of unique area covered/IEL/hour (measured with IVM) after infection with Salmonella and Toxoplasma at indicated time points. *** = p<0.001 with ANOVA and post-hoc Bonferroni multiple comparison test. (B) Unbiased computational quantification of flossing movements after infection with Salmonella or Toxoplasma at indicated time points and visualized by IVM (see Movies S3A–C). Frequency of flossing movements occurring in a “hotspot” area is shown for each villus region, N = 4–5 mice/group in 3 independent experiments. (C) Representative images of cleared (FocusClear™) duodenum, jejunum and ileum villi of S. Typhimurium-infected TCRγδGFP mice after 2h or 18h of infection. In green (GFP), TCRγδ+ cells and in blue (Hoechst), EC nuclei. (D) Representative images of cleared (FocusClear™) duodenum, jejunum and ileum villi of S. TyphimuriummCherry-infected (2h) and ToxoplasmaRFP infected (25 cysts, 6h) TCRγδGFP mice. In green (GFP), TCRγδ+ cells and in blue (Hoechst), EC nuclei, in red (mCherry or RFP) Salmonella and Toxoplasma respectively. (E) Mean and SEM of TCRγδGFP cell speed are shown after 6h infection with Toxoplasma (25 cysts), each dot= 1 movie, N = 4–5 mice/group in 3 independent experiments. (F) Frequency of TCRγδGFP cell distribution along cleared duodenum, jejunum and ileum villi after 6h infection with Toxoplasma (25 or 100 cysts) or in naïve TCRγδGFP mice (grey shading). Dashed line indicates mean of median positions for 2 mice/group.
Sorted ECs (CD45−EpCAM+) (A) and TCRγδ IELs (CD45+EpCAM−TCRαβ−TCRγδ+CD8α+) (B) were isolated from naïve wild-type mice or from tamoxifen-treated S. Typhimurium-infected iVilΔMyd88 and Cre− littermate control mice. Individual gene expression (row normalized) is shown for genes involved in indicated GO Biological Processes. Only genes with minimal expression exceeding 0.5 RPKM (top 30 %) are shown. (C) ELISA for IL-1β was performed in intestinal tissue samples from naïve and S. Typhimurium-infected (18h) wild-type animals. Mean and SEM shown. (D) For all TCRγδ IEL genes meeting criteria i and ii described in the Fig. 3E legend, GO/PANTHER pathway overrepresentation testing was performed. Bonferroni adjusted p value used for cutoff (dashed line) is p<0.05.