

Abstract
Podocyte depletion is a common mechanism driving progression in glomerular diseases. Alport Syndrome glomerulopathy, caused by defective α3α4α5 (IV) collagen heterotrimer production by podocytes, is associated with an increased rate of podocyte detachment detectable in urine and reduced glomerular podocyte number suggesting that defective podocyte adherence to the glomerular basement membrane might play a role in driving progression. Here a genetically phenotyped Alport Syndrome cohort of 95 individuals [urine study] and 41 archived biopsies [biopsy study] were used to test this hypothesis. Podocyte detachment rate (measured by podocin mRNA in urine pellets expressed either per creatinine or 24 hour excretion) was significantly increased 11-fold above control, and prior to a detectably increased proteinuria or microalbuminuria. In parallel, Alport Syndrome glomeruli lose an average 26 podocytes per year versus control glomeruli that lose 2.3 podocytes per year, an 11-fold difference corresponding to the increased urine podocyte detachment rate. Podocyte number per glomerulus in Alport Syndrome biopsies is projected to be normal at birth (558/glomerulus) but accelerated podocyte loss was projected to cause end stage kidney disease by about 22 years. Biopsy data from two independent cohorts showed a similar estimated glomerular podocyte loss rate comparable to the measured 11-fold increase in podocyte detachment rate. Reduction in podocyte number and density in biopsies correlated with proteinuria, glomerulosclerosis and reduced renal function. Thus, the podocyte detachment rate appears to be increased from birth in Alport Syndrome, drives the progression process, and could potentially help predict time to end stage kidney disease and response to treatment.
Keywords: Alport Syndrome, progression, podocyte, podometrics
Introduction
Based on a combination of animal modelling, genetic studies in man, and observational data from human kidney biopsies, there is now substantial data supporting the “Podocyte Depletion Hypothesis” as a major driver of progressive glomerulosclerosis and kidney failure in glomerular diseases (1-15). “Podometric” methodologies for measuring podocyte parameters in archival biopsy tissue and the rate of podocyte detachment non-invasively in the urine pellet have been developed to understand the progression mechanism and test potential utility for clinical decision-making (16). Cohorts with Alport Syndrome (AS) were noted to have both an increased rate of podocyte detachment measured in the urine pellet (17), and reduced podocyte number per glomerulus in renal biopsies in relation to clinical parameters (18). This suggested that accelerated podocyte detachment and depletion could be an unrecognized mechanism driving kidney failure in AS, and if so, might be a mechanism by which AS risk for progression could be identified, monitored and perhaps treated.
During early life the glomerulus enlarges in parallel with body growth although podocyte number per glomerulus does not change, thereby requiring that podocytes undergo extensive hypertrophy to maintain foot process coverage of the filtration surface (19). During late development the major glomerular basement membrane (GBM) collagen IV α1α1α2 heterotrimer is replaced by collagen IV α3α4α5 heterotrimers produced by podocytes (20). Variants in COL4A3, COL4A4 or COL4A5 genes cause incorrect assembly and insertion of the α3α4α5 (IV) collagen heterotrimer into the GBM (21). By time of clinical presentation genetic variants cause characteristic thinning, thickening and splitting of the tri-laminate GBM (22-24). Alport Syndrome, the clinical phenotype associated with these variants, is recognized to transition through a sequence of events beginning with persistent microscopic hematuria and progressing through increasing proteinuria, progressive glomerulosclerosis and decreasing renal function. Classic Alport Syndrome reaches end stage kidney disease (ESKD) by 20-30 years of age (25), although milder forms are increasingly recognized as contributing to loss of kidney function and premature end stage kidney disease in all phases of adult life. In addition to the characteristic ultrastructural changes in the GBM, AS glomeruli commonly exhibit a focal and segmental pattern off glomerulosclerosis well-recognized to be associated with podocyte dysfunction, injury and depletion [26-31].
An “AS Podocyte Depletion Hypothesis” posits that absent or dysfunctional α3α4α5 (IV) collagen heterotrimer insertion into the GBM by podocytes is associated with their defective adherence and accelerated detachment that in turn causes progressive podocyte depletion leading to proteinuria, an FSGS phenotype, and loss of kidney function. If this hypothesis is correct it would be expected that accelerated podocyte loss would begin at birth and lead to progressive reduction in podocyte number per glomerulus with time (age). In this report we evaluate genetically defined AS cohorts to determine whether or not this hypothesis can be disproven.
Results
Characteristics of AS Patient and Control Groups for urine assay
Table 1 shows demographics and clinical characteristics of AS patients and controls. The diagnosis of AS was confirmed by genetic analysis in 88/95 patients (92.6%) and in the remaining 7 by skin and kidney biopsy. 71.6% of AS patients were on treatment with angiotensin II blockade. Controls (n=38) were from the same China region and were comparable.
Table 1.
Characteristics of the Control and AS groups and subgroups included in the urine podocin mRNA assay.
| Isolated hematuria | Micro-albuminuria | 24 hour UP 0.2-3g | 24 hour UP >0.3g | |||
|---|---|---|---|---|---|---|
| Controls | All AS patients | AS group 1 | AS group 2 | AS group 3 | AS group 4 | |
| Number of patients/controls | 38 | 95 | 12 | 21 | 45 | 17 |
| Median age (range) (years) | 9(2-16) | 9(2-17) | 7.5(2-11) | 5.0(2-11) | 10(3-17) | 10(8-16) |
| Male (%) | 21(55.3%) | 75(78.9%) | 5(41.7%) | 13(61.9%) | 40(88.9%) | 17(100%) |
| Mean height ± SD (cm) | 113.3±18.6 | 131.7±21.4 | 121.1±17.5 | 113.4±18.6 | 136.1±17.1 | 148.5±18.7 |
| Mean weight ± SD (kg) | 20.5±6.4 | 31.7±14.9 | 26.2±9.6 | 20.5±6.4 | 34.4±14.5 | 42.5±16.7 |
| Mean BMI ± SD (kg/m2) | 15.6±1.4 | 17.4±3.5 | 17.4±2.4 | 15.7±1.4 | 17.7±4.0 | 18.6±3.9 |
| X-chromosome inheritance | NA | 68 | 9 | 19 | 31 | 9 |
| Autosomal-recessive inheritance | NA | 20 | 1 | 2 | 11 | 6 |
| ACEI/ARB treatment (%) | NA | 68(71.6%) | 1(8.3%) | 11(52.4%) | 41(91.1%) | 15(88.2%) |
| Mean Microalbuminuria ± SD (mg/l) | NA | 791±1,436 | 9.3±5.9 | 49±23 | 670±1,383 | 2,799±1,345 |
| Mean MA:creatinine ratio ± SD (mg/g) | NA | 1,323±2,248 | 46±48 | 98±45 | 974±1343 | 4,623±3179 |
| Mean 24 hour UP (g/24) ± SD | NA | 1.61±2.30 | 0.09±0.05 | 0.11±0.03 | 1.04±0.76 | 5.68±2.39 |
| Mean urine prot:creat ratio ± SD (g/g) | 0.02±0.02 | 3.04±4.45 | 0.08±0.07 | 0.29±0.22 | 2.53±2.11 | 9.74±6.21 |
| Mean eGFR ± SD (ml/min per 1.73cm2) | NA | 120.5±54.9 | 163.7±53.1 | 130.1±52.5 | 120.6±53.1 | 92.8±52.1 |
NA= not available; ACEI= angiotensin converting enzyme inhibitors; ARB= angiotensin II type I receptor blockers, MA=microalbumin; UP=urine protein, 88/95 AS patients were genotyped, the remainder were assigned on the basis of skin biopsy and kidney biopsy.
Rate of podocyte detachment rate in AS versus control
Podocyte detachment rate was estimated using podocyte-specific podocin mRNA measured in the urine cell pellet. No signal was detected for one patient who was not included in further analysis. Data were expressed as the urine podocin mRNA:creatinine ratio (analogous to the urine protein:creatinine ratio) to compensate for variation in urine volume. However, because AS occurs during phases of rapid growth and therefore with changing muscle mass that would change urine creatinine excretion rates we also express data as the 24hr urine podocin mRNA excretion (see methods). As shown in Figure 1 no differences were observed between the two methods of expressing podocyte detachment rate. Figure 1A and B show that the urine podocyte detachment rate was, on average, about 11-fold increased in AS patients compared to control (P<0.001).
Figure 1. Increased urine podocyte detachment rate in AS.
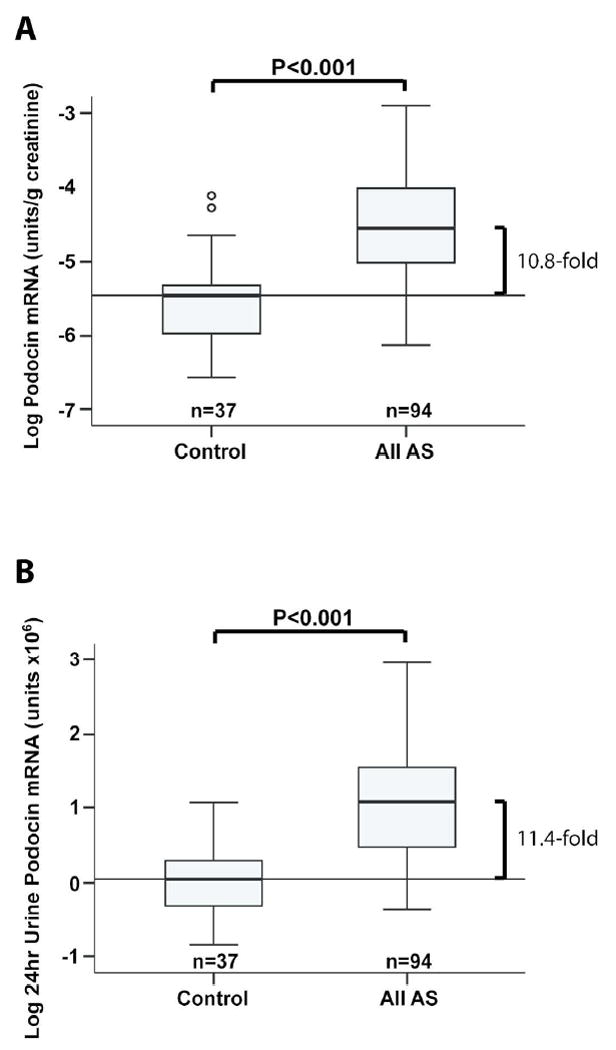
Measurements of the rate of podocyte detachment measured in the urine pellet were expressed either as the urine podocin mRNA: creatinine ratio (analogous to the urine protein:creatinine ratio) (A) or as the Estimated 24hr excretion of podocin mRNA (B). Urine from normal (n=37) and AS patients (n=94) were compared. AS patients had 10.8-fold (95% confidence limits 7.5-15.3) and 11.4-fold (95% confidence limits 8.0-16.4) increased podocin mRNA in the urine pellet as measured by the two methods (P<0.001).
Rate of podocyte detachment in relation to level of proteinuria
The AS cohort were divided into 4 subgroups according to their level of proteinuria as shown in Table 1. Figures 2A and 2B show that even in Group 1 AS patients with normal proteinuria as measured by both 24hr urine protein and microalbuminuria the rate of podocyte detachment was significantly increased above control (P=0.02 and 0.04 respectively). Podocyte detachment rate was increased in all four groups with no statistical difference between any of the AS groups. We conclude that increased podocyte detachment occurs prior to a measurable increase in either proteinuria or microalbuminuria.
Figure 2. AS patients without proteinuria have increased podocin mRNA in the urine pellet.
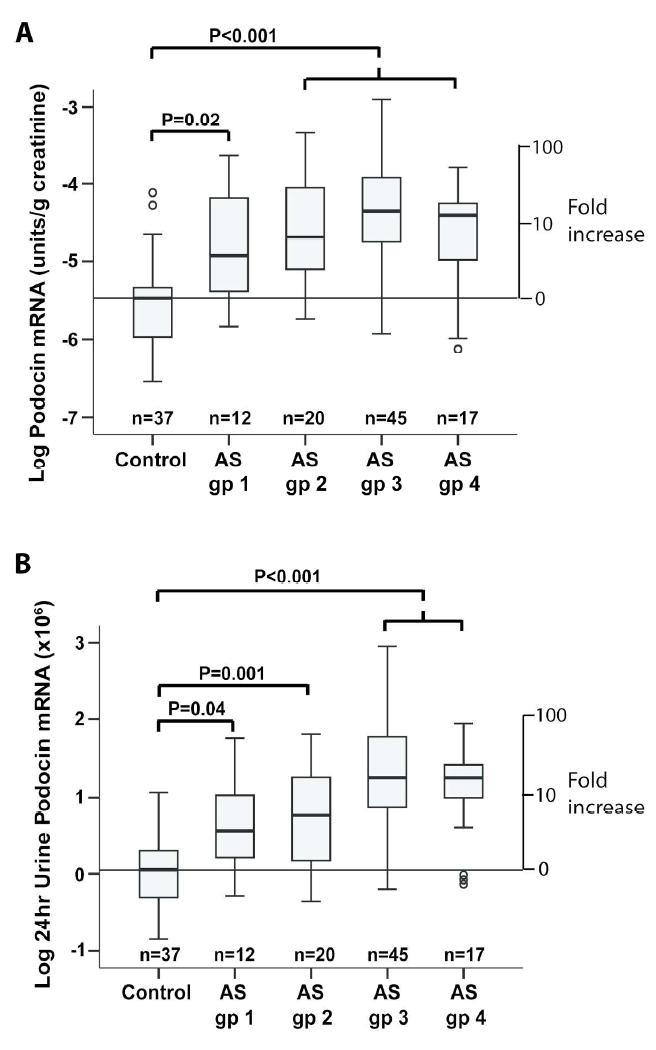
The 94 AS patients shown in Figure 1 were divided into 4 groups based on the 24hr urine protein excretion and microalbuminuria assay as shown in Table 1. AS group 1 had 24hr urine protein <0.2g and microalbuminuria at <30ug/ml (n=12), AS group 2 had 24hr urine protein <0.2g with microalbuminuria >100mg (n=20), AS group 3 had 24hr urine protein 0.2-3g (n=45), and AS group 4 had 24hr urine protein >3g (n=17). All four groups had statistically increased urine podocin mRNA excretion in the urine pellet with no statistical difference between any of the AS groups.
Podocyte detachment rate in relation to the AS genotype
The podocyte detachment rate was measured by urine pellet podocin mRNA per 24hr for X-linked AS (XLAS) (1.09±0.70, n=68) and autosomal recessive AS (1.02±0.72, n=19) (ARAS) were not statistically different. In addition, since males with X-linked AS (XLAS-M) and ARAS have a more severe clinical phenotype than females with X-linked AS (XLAS-F) (25), the AS cohort was divided into XLAS-M (n=52), XLAS-F (n=16), and ARAS (n=19). The podocin mRNA per 24hr for XLAS-M was statistically higher than for XLAS-F (1.26±0.11 vs 0.77±0.16 respectively, P=0.03). Podocin mRNA per 24hr between XLAS-M (1.26±0.11) and ARAS (0.88±0.19) (P=0.07) and between XLAS-F and ARAS (0.77±0.16 vs 0.88±0.19, P=0.69) did not reach statistical significance. In addition, there was no statistical difference comparing all groups with severe mutations (nonsense, splicing, deletion, insertion) (n=38) versus those with missense (n=29) mutations (1.18±0.13 vs 1.06±0.14, P=0.54).
Characteristics of AS Patient and Control Groups for renal biopsy analysis
Forty-one biopsies were evaluated. One biopsy had glomerulomegaly with glomerular volumes >2SDs above both the AS and normal range and was therefore excluded from further analysis. Nine of the remaining original 40 biopsies had <8 tuft profiles present, leaving 31 biopsy samples with adequate glomerular profiles for analysis shown in Table 2.
Table 2.
Characteristics of Control and AS patients included in biopsy analysis.
| Characteristics Controls | Mean ± 1SD | |
|---|---|---|
| Number | 20 | |
| Age years at biopsy (range) | 12.6 ± 4.9 (4-18) | |
| Male female | 7 and 13 | |
| AS Patients | All AS biopsies | AS biopsies >7 tufts |
| Number | 41 | 31 |
| Age years at biopsy (range) | 9.2 ± 4.6 (2-21) | 8.2 ± 4.5 (2-21) |
| Male/Female | 31/10 | 22/9 |
| Height (cm) | 132.2 ± 21.0 | 127.9 ± 20.1 |
| Weight (kg) | 31.1 ± 12.7 | 28.1 ± 11.5 |
| X-chromosome inheritance | 19 | 14 |
| Autosomal-recessive inheritance | 13 | 11 |
| 24 hour urine protein (g/24h) | 1.7 ± 1.8 (0.01-6.3) | 1.1 ± 1.4 (0.01-4.7) |
| eGFR (ml/min.1.73cm2) | 112.0 ± 51.7 | 120.1 ± 50.1 |
Only biopsies with >7 tufts available was used for podocyte number per tuft data analysis shown in Figure 4. All AS biopsies were used for data shown in Figure 5. X-chromosome inheritance and Autosomal recessive inheritance indicates genetic analysis showing variants on the α5 and α3/α4 collagen IV genes respectively.
Comparison of biopsy podocyte parameters in AS and Control
Figure 3 and Table 3 show biopsy podometric data for the Peking University First Hospital (PUFH) AS cohort compared to a previously reported Ann Arbor AS and control cohorts (18). No differences were observed between the Beijing and Ann Arbor AS cohorts except that the PUFH cohort biopsies contained significantly fewer glomerular tuft profiles (P=0.01). There were no differences in glomerular volume between control and either group. However, in both the PUFH and Ann Arbor AS groups the podocyte nuclear density, the podocyte nuclear number per glomerulus and the Glepp1 area density were all significantly decreased compared to control.
Figure 3. Biopsy podometrics.
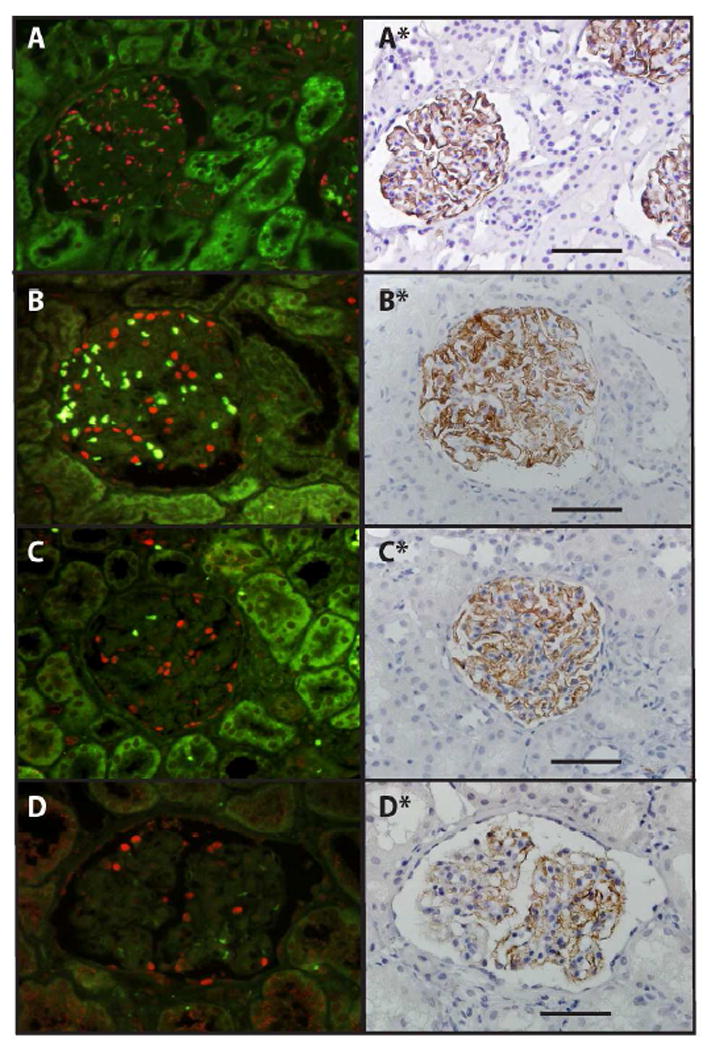
Panels show examples of a control glomerulus (A), an AS glomerulus with relatively normal number of podocytes (B), an AS glomerulus with an intermediate number of podocytes (C) and an AS glomerulus with reduced podocyte number (D). Left panels show TLE4 immunofluorescence delineating podocyte nuclei (red) with background green fluorescence showing erythrocytes as light green. Right panels show the same glomeruli from the same section in which the coverslip has been removed and the section stained by Glepp1 immunoperoxidase (brown) and counterstained with hematoxylin (33,34). The bar represents 100um.
Table 3.
Comparison of AS groups with >7 tufts per glomerular profile and used for analysis shown in Figure 4.
| Tufts | GV | Pod Density | Pod Number | GLP1 area | MPV | ||
|---|---|---|---|---|---|---|---|
| n/section | ×106 um3 | per 106 um3 | n per Glom | % tuft area | um3 | ||
| Control (n=20) | 21.5±8.9 | 2.03±1.14 | 318±127 | 544±164 | 44.0±5.0 | 1,598±596 | |
| PUFH AS patients (n=31) | 17.3±6.3 | 2.15±0.91 | 182±87 | 346±126 | 30.8±10.8 | 2,016±1,172 | |
|
| |||||||
| Beijing AS vs control | P value | 0.83 | >0.99 | <0.001 | <0.001 | <0.001 | >0.99 |
|
| |||||||
| Ann Arbor AS patients (n=26) | 23.4±8.7 | 2.08±1.11 | 180±129 | 291±140 | 29.4±12.6 | 2,176±1,150 | |
|
| |||||||
| Ann Arbor AS vs control | P value | >0.99 | >0.99 | <0.001 | <0.001 | <0.001 | >0.99 |
| Beijing AS vs Ann Arbor AS | P value | 0.05 | >0.99 | >0.99 | >0.99 | >0.99 | >0.99 |
|
| |||||||
| PUFH AS subgroup analysis | |||||||
| AS group A (n=11) | |||||||
| Urine protein <0.2g/24hrs | 17.5±6.5 | 2.12±0.62 | 191±33 | 393±95 | 38.2±7.5 | 2,112±776 | |
|
| |||||||
| Group A vs control | P value | >0.99 | >0.99 | 0.03 | 0.05 | >0.99 | >0.99 |
|
| |||||||
| AS group B (n=15) | |||||||
| Urine protein 0.21-3g/24hrs | 17.8±6.9 | 1.94±0.93 | 203±110 | 343±135 | 29.5±9.4 | 1,848±1,123 | |
|
| |||||||
| Group B vs control | P value | >0.99 | >0.99 | 0.03 | 0.001 | <0.001 | >0.99 |
|
| |||||||
| AS group C (n=5) | |||||||
| Urine protein >3g/24hrs | 15.0±4.0 | 2.82±1.23 | 95±44 | 253±126 | 18.0±7.8 | 2,310±2,037 | |
|
| |||||||
| Group C vs control | P value | >0.99 | >0.99 | 0.001 | 0.001 | <0.001 | >0.99 |
Statistical comparisons between groups are by ANOVA using the Bonferroni correction. PUFH = Peking University First Hospital.
Comparison of AS biopsy subgroups on the basis of 24hour urine protein measured at the time of biopsy
PUFH AS biopsies were grouped according to 24hour urine protein at time of biopsy as shown in Table 3 (lower). In AS group A with proteinuria levels close to the normal range the podocyte density and podocyte number per glomerulus were decreased compared to control (P=0.04 and 0.05 respectively). In AS group B (24hr urine protein 0.2-3g) podocyte density, podocyte number per glomerulus and podocyte area density (Glepp1 area % of tuft) were all highly significantly decreased compared with control (P<0.002). In AS group C (24hr urine protein >3g) had the lowest podocyte density, number per tuft and area density compared to the other AS groups (P<0.001). These data show that increasing level of proteinuria was associated with decreasing podocyte number per glomerulus and density measured by two different methods.
Podocyte loss from glomeruli in relation to age
If podocyte detachment rate is increased in AS from birth then one would expect that with increasing age the average podocyte number per glomerulus would decrease. Table 4 shows demographic characteristics of the biopsy AS groups A, B and C showing that higher level proteinuria was associated with higher age, weight and more glomerulosclerosis. Figure 4A shows that there is a linear relationship between age and podocyte number per tuft for AS groups A, B and C defined by proteinuria level. Also shown in Figure 4A is the normal range for podocyte number per glomerulus in relation to age derived from prior studies (19,31). The normal slope is -2.3 (i.e. average 2.3 podocytes lost per glomerulus per year) while the projected average normal number of podocytes at birth is 580. In contrast the AS biopsy slope is -26 (i.e. 26 podocytes lost per glomerulus per year). Projecting the data (dashed line) indicates that AS glomeruli at birth would have a normal number of podocytes (average 558). Projecting the dashed line to intersect with the X axis shows that a critically low podocyte number per glomerulus (i.e. ESKD) will be reached by average about 22 years of age. Comparison of the normal glomerular podocyte loss rate (-2.3 podocytes per year) to the AS podocyte loss rate (-26 podocyte per year) represents an 11.3-fold higher than the normal rate in AS glomeruli corresponding to the 11-fold increased podocyte detachment rate found in AS urine (Figure 1).
Table 4.
Demographics of AS with >7 tufts grouped by 24 hr urine protein as shown in Figure 4.
| Age (years) | Height (cm) | Weight (kg) | Urine protein (g/24hr) | CrCl (ml/min/1.73m2) | GS score (% glom) | |
|---|---|---|---|---|---|---|
| AS group A. 24 hr urine protein ≤0.2g/24hr (n=11) | ||||||
| Mean | 6.5±3.1 | 120.2±17.7 | 23.3±8.2 | 0.13±0.07 | 135±53 | 0.0±0.0 |
|
| ||||||
| P value vs Group B | ns | ns | ns | <0.01 | ns | |
|
| ||||||
| AS group B. 24 hr urine protein 0.21-3g/24hrs (n=15) | ||||||
| Mean | 8.0±5.0 | 128.1±19.9 | 28.1±11.8 | 0.92v0.78 | 124v41 | 4.8±10.1 |
|
| ||||||
| P value vs group C | ns | ns | ns | <0.001 | ns | |
|
| ||||||
| AS group C. 24hr urine protein >3g (n=5) | ||||||
| Mean | 12.6±2.8 | 147.2±18.9 | 39.1±9.6 | 4.3±1.0 | 83±48 | 34.3±29.3 |
|
| ||||||
| P value vs group A | 0.04 | ns | 0.03 | <0.001 | ns | 0.003 |
Group C has significantly higher age and weight and glomerulosclerosis score than Group A. Group B is intermediate between groups A and C. Groups were compared using the Bonferroni adjustment except for the GS score where the distribution was skewed so a non-parametric test (Kruskal Wallis) was used and the mean ranks compared (p=0.003).
Figure 4. Podocyte number per glomerulus in relation to age.
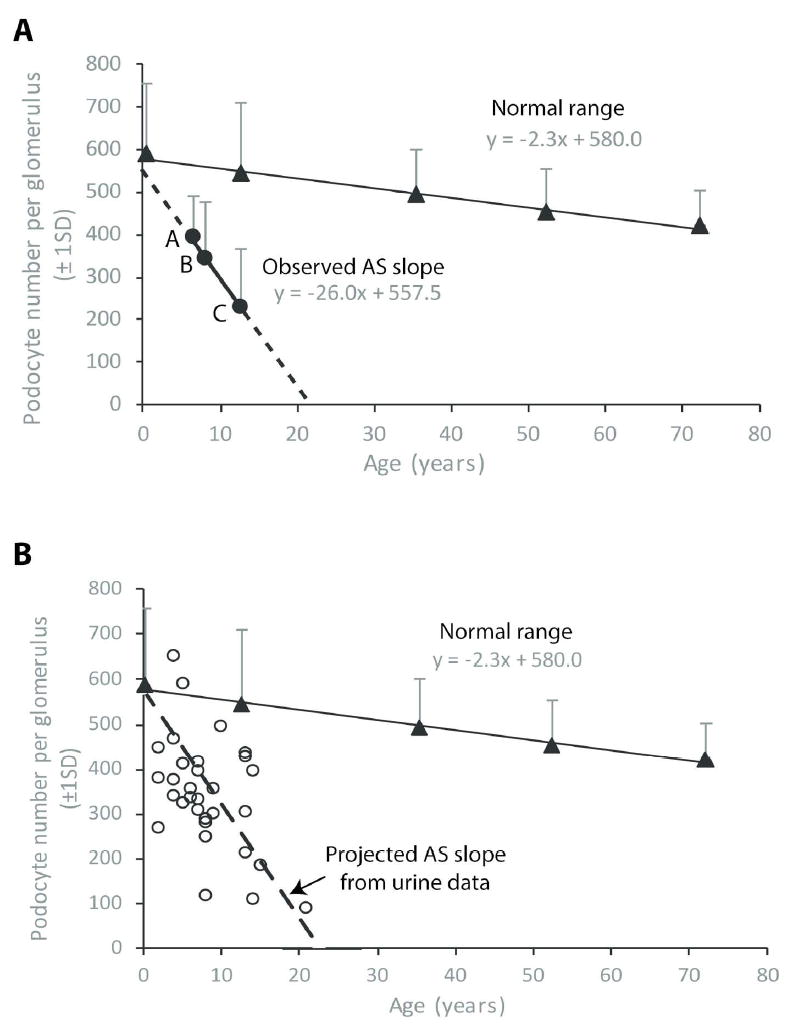
(A) Observed relationship of podocyte number per glomerulus to age. The normal podocyte number per glomerulus with age is shown with coordinates y = -2.3x + 580 derived from prior reports (19,31). This data shows that glomeruli normally start life with about 580 podocytes and lose 2.3 podocytes per glomerulus per year throughout life. From Table 4 AS groups A, B and C comprise biopsy podocyte number per glomerulus data from AS patients with 24hr urine protein <0.2g, 0.2-3g and >3g respectively are plotted against age. This resultant line has coordinates y = -26x + 557.5 indicating that at time 0 (birth) AS patients are projected to have 558 podocytes per glomerulus (within the normal range). The slope of this line at -26x is 26/2.3 = 11.3-fold steeper than the normal value, thereby indicating that AS podocytes are lost from glomeruli about 11-fold faster than normal. Projection of this line to intersect with the x axis shows that AS patients in this cohort would be expected to reach low levels of podocyte per glomerulus (i.e. ESKD) by about 20 years of age. (B) Projected decrease in podocyte number per glomerulus with age based on the urine pellet podocin assay. The normal decrease in podocyte number per glomerulus with age is shown derived from prior studies (19,31). From Figure 1A and B the average rate of podocyte detachment in AS patients was measured at 10.8-11.4-fold (average about 11-fold) above the normal rate. The dashed line was generated by assuming that AS patients start with a normal podocyte number per glomerulus (580) and lose podocytes 11-fold faster than normal. This line intersects with the x axis at about 20 years as the projected time at which ESKD will occur. AS biopsy data (open circles) is shown for podocyte number per glomerulus in relation to the age at time of biopsy demonstrating reasonable correspondence between the average projected podocyte number based on the urine assay and the observed values.
Using urine podocyte detachment rate data to predict podocyte number per glomerulus in AS biopsies
Figure 4B shows normal values for podocyte number per glomerulus with age with the average glomerulus starting life with 580 podocytes and losing podocytes at a rate of 2.3 per glomerulus per year. Using the measured 11-fold increase in podocyte detachment rate measured in the urine pellet the expected number of podocytes left in a glomerulus can be estimated for any age (podocytes left = 580 – (2.3*11*age). The projected dashed line based on this calculation is shown in Figure 4B. Individual data points from the AS biopsy cohort are shown by open circles that reasonably correspond to the predicted data.
Using individual biopsy data to estimate the average rate of podocyte detachment in AS biopsies
From the open circles in Figure 4B it can be seen that AS biopsies are quite heterogeneous with respect to rate of podocyte loss in relation to age. Table 5 shows that the estimated rate of podocyte detachment per year in two independent AS cohorts are similar. The fold-increased podocyte loss rate from glomeruli in AS in the two cohorts is not statistically different from the fold-increased podocyte detachment rate as measured in the urine pellet (Figure 1).
Table 5.
Estimation of podocytes loss per glomerulus per year in two AS cohorts.
| n | Age at biopsy | Average podocyte loss per glomerulus | Podocyte loss per glomerulus per year | Fold-increase in pod loss rate | |
|---|---|---|---|---|---|
| PUFH cohort | 31 | 8.2±4.5 | 234±126 | 36.2±30.7 | 15.7±13.4 |
| Ann Arbor cohort | 26 | 9.2±4.9 | 289±140 | 31.4±28.4 | 13.6±12.4 |
Reduction in podocyte number per glomerulus below a designated normal value (580 podocyte per glomerulus as (see Figure 3) divided by age at time of biopsy gives the average rate of podocyte loss per glomerulus per year. From Figure 3 the average normal rate of podocyte loss from glomeruli is 2.3 podocyte per glomerulus per year. The fold-increase in podocyte loss per glomerulus is therefore given by the podocyte loss per glomerulus per year divided by 2.3. The fold-increase in podocyte loss values obtained in two independent cohorts are not different from the measured fold increase in podocyte detachment rate measured in the urine pellet (see Figure 1).
Relation of podocyte depletion to clinical parameters
Figure 5 shows combined data from the two biopsy AS cohorts illustrating the relationship of podocyte depletion to renal structure/function as previously reported (18). Figure 5A and B show that degree of proteinuria correlates with decreasing podocyte density as measured by two independent methods (podocyte nuclear density or Glepp1 area density). Figure 5C and D show the relationship of podocyte depletion to glomerulosclerosis, emphasizing that after an average threshold value of 30% podocyte depletion is reached the proportion of glomeruli with sclerosis increases linearly in relation to further reduction in podocyte number per glomerulus. Figure 5E and F show that reduced eGFR is a late marker of podocyte depletion
Figure 5. Relationship of podocyte depletion to clinical parameters in AS.
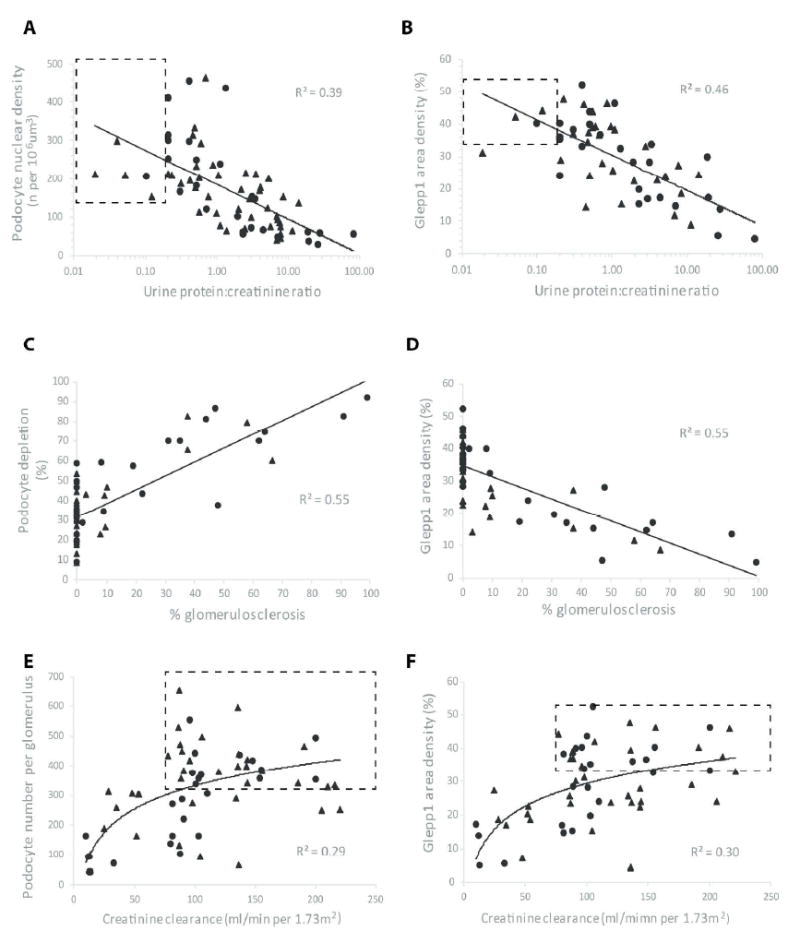
Data were used from all PUFH AS patients (n=41) shown in Table 2 (closed triangles) including those with <8 glomerular profiles per biopsy as well as data previously reported for an Ann Arbor AS cohort (n=21) (closed circles) (18). Panels A and B. Urine protein:creatinine ratio (UPCR). UPCR is related to podocyte density measured by two independent methods either as Podocyte nuclear density (A) or Glepp1 area density (B). The ranges for normal for urine PCR and the density range (mean+1SD) are shown in the dashed line box. Decreasing poodcyte density is associated with an increasing level of proteinuria. Panel C and D. Glomerulosclerosis. Glomerulosclerosis was measured as the sum of all abnormal glomeruli containing adhesions, FSGS lesions or globally sclerotic glomeruli as a percentage of all tufts in biopsies containing at least 10 tufts. Podocyte depletion as measured by two independent methods was linearly related to proportion of scarred glomeruli. Panel C shows that decreased podocyte number (shown as % nuclear depletion below the normal mean value for the control group) at <30% of normal was not associated with increased glomerulosclerosis. In contrast after >30% of podocytes are lost there is a linear increase in proportion of glomeruli with glomerulosclerosis. Panels E and F. Estimated GFR (eGFR). eGFR was measured as creatinine clearance per 1.73m2. The dashed line box shows the normal ranges with the lower limit of normal eGFR for the pediatric population shown as 75 ml/min/1.73m2. Reduced eGFR was associated with podocyte depletion measured by two independent methods either as Podocyte number per glomerulus (Panel E) or Glepp1 Area density (Panel F). Reduced eGFR was associated with podocyte depletion.
Discussion
An important strength of this report is that the PUFH AS cohort was well-characterized by ultrastructure, genetic analysis and skin biopsy in contrast to the prior report where AS was characterized by ultrastructure alone (18). As a group the PUFH AS patients had a highly statistically significant average 11-fold increased rate of podocyte detachment compared to control (P<0.001). Furthermore, when these patients were sub-grouped based on level of proteinuria, even the subgroup with no increase in microalbuminuria had a significantly increased rate of podocyte detachment. There was no statistical difference in rate of podocyte detachment between any subgroup based on level of proteinuria. This result is therefore consistent with the concept that an increased rate of podocyte detachment occurs from an early stage of AS prior to the development of detectable proteinuria and glomerulosclerosis, and that accelerated podocyte detachment persists over time.
If podocytes are being lost at an increased rate from birth in AS then, even although there may be variation in rate of podocyte detachment between individuals with different genetic phenotypes, it should be possible to see age-related decreases in podocyte number per glomerulus represented in AS kidney biopsies. This hypothesis was evaluated using biopsy podometric data compared to normal age ranges (19,32). We observed that podocyte number per glomerulus decreased in relation to age (average -26 podocytes per glomerulus per year) at a rate that was approximately 11-fold faster than occurs in normal kidneys (-2.3 podocytes per glomerulus per year), comparable to the 11-fold increased rate of podocyte detachment found in the urine pellet. Furthermore, although AS patients were projected to start with a normal podocyte number per glomerulus at birth, by losing an average 26 podocytes per glomerulus per year they were projected to reach ESKD by about 22 years of age corresponding to the reported average age at ESKD in AS of 23-25 years (25). Conversely, if the measured 11-fold increased rate of podocyte detachment from the urine pellet was used to project the expected slope of podocyte loss from glomeruli over time, the slope corresponded to observed data of podocyte number per glomerulus in relation to age. Finally, using data from two independent AS cohorts and the observed podocyte number per glomerulus in each AS biopsy as a starting point, and knowing the age when the biopsy was performed, we could estimate the rate at which podocytes would have been lost from glomeruli assuming this begun at birth and continued at a steady state level. The two AS cohorts gave very similar data representing an average increased rate of podocyte loss from glomeruli at 15.7±13.4-fold and 13.6±12.4-fold above normal, and comparable to the 11-fold-increase in podocyte detachment rate measured non-invasively in the urine pellet of an independent cohort.
The AS data provided are correlative and therefore cannot themselves prove a causative relationship between podocyte loss and progression. However, the strong correlations between podocyte depletion in AS and development of proteinuria, glomerulosclerosis and decrease in eGFR closely resemble those previously found in an animal model of specific podocyte depletion as the primary event and human glomerular diseases (1-15), and are consistent with the hypothesis that podocyte loss itself significantly drives the progression process in AS. The requirement for loss of about 30% of podocytes before onset of linearly increasing glomerulosclerosis with further podocyte loss is as previously reported for other systems (3,15,32,33). The podocyte detachment rate in XLAS males was significantly higher than in XLAS females (heterozygotes) as would be expected, although no difference between ARAS and XLAS females was detected in these smaller cohorts.
A limitation of the study relates to the biopsy podometric methodology. Firstly, a renal biopsy containing about 20 glomerular profiles of an average approximately 2 million glomeruli in two kidneys represents a small sampling size (0.001%). This is less of a problem when normal homogeneous glomeruli are sampled, but becomes less representative when glomerular heterogeneity is present. Estimation of glomerular volume requires at least 8 tuft profiles and even at this number there is substantial inter-assay variation (34). Therefore, all estimates that depend on glomerular volume, particularly estimation of podocyte number per glomerulus prominently used in this report, are liable to sampling errors. In this study 10/41 (24%) of biopsies had <8 tuft profiles on the available histologic section analyzed. Furthermore, those that were used for analysis had on average 17.3±6.3 profiles compared to a prior study where the average tuft number per biopsy available for analysis at 23.4±8.7 which would be expected to cause greater sampling variability. Never-the-less, even when biopsy data containing <8 glomerular profiles are used as shown for combined data (Figure 5), useful information can be obtained.
Both the biopsy and urine data emphasize that there is substantial individual variation that presumably reflects different genetic variants that impact the rate of podocyte detachment. The AS cohorts examined presented during early life to a pediatric nephrology clinic, and consequently represent the more severe end of the disease spectrum. The mechanistic relationship between abnormal GBM structure (thinning, thickening and lamellation) and accelerated podocyte detachment remains to be molecularly defined, and thereby potentially targeted for intervention. However, it appears that podocytes themselves are responsible for making the specific tool (the α3α4α5 heterotrimer) necessary for them to remain attached to the GBM through the stresses and strains experienced by the glomerulus during normal life (19). The Alport phenotype may therefore represent the consequences of suboptimal adhesion of podocytes to the GBM.
The simplest interpretation of the observation that the podometric biopsy and urine data are quantitatively related (i.e. podocytes lost from the glomerulus = podocyte detachment rate measured in urine x time) is that podocyte biology can, at least in the case of AS, be treated as a “zero sum game” (16). According to this hypothesis and for practical purposes: (i) Glomeruli can be considered to have a fixed number of podocytes by time of birth (average about 580 per glomerulus) that have to last for a life-time. (ii) The baseline normal level of podocyte detachment measured in urine can be equated to a “normal” podocyte loss rate (about -2.3 podocytes per glomerulus per year). (iii) If podocytes are lost at an increased rate for any reason, then at some predictable point in time (= podocyte detachment rate x time) a critical amount of podocyte depletion will have occurred that will in turn drive progressively increasing proteinuria, glomerulosclerosis and eventually, reduced renal function. If not disproven by future studies, this simple paradigm offers a quantitative approach upon which logical glomerular disease management could be based. By measuring the podocyte detachment rate non-invasively in the urine pellet (to obtain a steady state value perhaps requiring several measurements) it may be possible to predict “time to ESKD” for any individual with AS (or potentially other glomerular disease) prior to development of proteinuria, and furthermore, to monitor efficacy of interventions from very early stages when they are likely to be most effective. In these human AS studies and in similar studies in kidney allografts (33,35) podometric analysis did not quantitatively identify a contribution of podocytes produced de novo as has been reported from lineage tracing studies in acute toxicity murine models (36-40). This does not necessarily mean that podocyte generation from de novo sources did not occur, just that its contributions were below the threshold of detection of the methods used. Longitudinal studies will be required to determine the degree to which angiotensin II blockade reduces the rate of podocyte detachment in AS (41,42).
In AS, as in all other primary glomerular diseases, the degree of renal function impairment correlates more closely with the degree of tubule-interstitial fibrosis than it does with observable glomerulosclerosis in a histologic section (43). This general observation, described 50 years ago by Risdon et al (44) and validated by Bohle et al (45), is compatible with the Podocyte Depletion Hypothesis for progression of glomerular diseases according to the following scenario. As demonstrated in this report, as podocytes become depleted the glomerular barrier becomes increasingly leaky for protein resulting in a tubular cell cytokine response that drives peritubular interstitial inflammation and scarring (46-48). At the same time progressive loss of podocytes drives progressive glomerulosclerosis associated with both decreased glomerular blood perfusion to post-glomerular peritubular capillaries and reduced/absent glomerular filtrate that together promote ischemic and inflammatory tubular cell injury, death and peritubular inflammation and scarring. Sclerotic glomeruli involute and become difficult or impossible to visualize histologically, while the tubule and its peritubular interstitial scarring process derived from any single glomerulus is >20-fold larger than an intact glomerular cross-section in the renal cortex, thereby appearing in many more histologic fields. Tubule-interstitial scarring is therefore more easily observed and quantitated as a reflection of the extent of glomerular disease affecting the kidney. In this sense the degree of tubule-interstitial fibrosis in primary glomerular diseases is expected to be a robust marker of the degree of impairment of renal function, as is in fact observed.
Proteinuria has traditionally served as the key clinical marker for glomerular disease management. However, proteinuria is a non-specific marker of diverse kidney injuries, physiologic processes and diet whose aggregate signal may or may not be related to progression. In this study increased rate of podocyte detachment occurred before proteinuria or microalbuminuria were detectably increased. Podocyte loss rate is a specific quantitative marker directly tied to the progression process that could, in principle, complement proteinuria as a practical guide to managing progressive glomerular diseases.
Materials and Methods
This study was approved by the Peking University Institutional Review Board (IRB00001052-15070), Peking University First Hospital Institutional Review Board (2015(941)) and the University of Michigan Institutional Review Board (HUM00107164). AS patients from Peking University First Hospital (PUFH) comprised two cohorts that included the urine cohort (n=95) and the biopsy archival tissue cohort (n=41) with 5 patients overlapping between these two cohorts. The urine controls (n=38) were collected in Beijing. The biopsy controls were derived from protocol biopsies obtained prior to transplantation from deceased kidney donors at the University of Michigan, Ann Arbor, MI, USA as previously reported and previously used for comparison with an Ann Arbor cohort of AS patients (18).
Diagnosis of AS
AS diagnosis used the following methods: (i) Examination of renal biopsy specimens by electron microscopy (EM); (ii) Immunofluorescent staining of basement membrane type IV collagen alpha chain expression in skin and/or renal biopsy specimens; (iii) Genetic analysis of the type IV collagen genes COL4A3, COL4A4, and COL4A5. XLAS was diagnosed by EM, collagen IV staining in skin biopsy specimen and/or genetic analysis. ARAS was diagnosed by EM, type IV collagen staining in renal biopsy specimen and/or genetic analysis. (41).
Urine samples
The urine samples of AS patients were collected from the Pediatric clinics at PUFH. The age-matched control urine samples were collected from unidentified individual children aged 2-18 who had no known kidney disease or hypertension. Acute infection and menstruation at time of collection were exclusion criteria. Control urine samples were tested by dip stick and urine protein:creatinine ratio and all abnormal samples excluded. Demographic and clinical information of AS patients were collected including age, gender, genetic variant, degree of micro-albumin, and degree of proteinuria (g/24 h), serum creatinine and creatinine clearance. Patients were categorized depending on urine micro-albumin, urine protein and renal function at the time of urine collection.
Urine processing for podocin mRNA and expression
This was as previously reported (17) and detailed in Supplemental Methods. The coefficient of assay variation is 31% in present study and was very similar with previous reported 35% (17). Serial determinations of urinary podocin mRNA were measured once per month for three months. The coefficients of variation were 33% and 14%, respectively (n=2).
Renal biopsy source material
The renal biopsies used in the present study were archival renal biopsies obtained from PUFH archival renal bio-specimen bank. These archival kidney biopsies were used for routine clinical diagnostic purposes and for making a diagnosis of AS. In addition, the diagnosis of AS was also confirmed by skin biopsy, and/or mutation analysis. The age-matched control group was derived from deceased kidney donors at time of transplantation performed at the University of Michigan, Ann Arbor MI, USA. An Ann Arbor cohort of AS biopsies was used for comparison with the PUFH cohort. Characteristics for this cohort were as previously described (18,19,31).
Podometric methodology
The methods used were as reported (33,34) and are detailed in Supplementary Methods. Data shown for the normal range in relation to age in Figure 4 was derived from two sources (19,21). Values for podocyte number per glomerulus were as follows for age 0.3yrs 589±166; 12.6yrs (range 4-18) 544±164; 35.5yrs (range 19-45) 494±107; 52.4yrs (range 46-60) 454±99; 72.2yrs (range 60-85) 472±82. As shown in Figure 4 the coordinates for podocyte number per glomerulus in relation to age were y = (-2.3 x age) + 580. For purposes of calculation we therefore assumed that at birth the average podocyte number per glomerulus in is 580, and that on average 2.3 podocytes are lost per glomerulus per year. To estimate the accelerated rate of podocyte loss in AS we subtracted the measured value for average podocyte number per tuft in each biopsy from 580 to give the average number of podocytes lost for each AS patient. Therefore, the fold-increased rate of podocyte loss compared to normal = (580-observed number per glomerular tuft)/(2.3 x age) was calculated as shown in Table 5.
Blood pressure control
Blood pressure was maintained in the normal range in association with ACE inhibition/ARB use in some cases as shown in Table 1. Blood pressure was not measured in controls.
Statistical analysis
For descriptive purposes, the mean and standard deviation (SD) was used for normally distributed variables. Skewed variables underwent log transformation. Student t-test was applied to compare normally distributed variables between 2 groups. Analysis of variance was used to compare mean of normally distributed variables in more than 2 groups, followed by Bonferroni post-hoc analysis for multiple comparisons. To compare categorical variables in multiple independent groups Kruskal-Wallis test was used.
Supplementary Material
Acknowledgments
RW and JI acknowledge support from the University of Michigan Health System (UMHS) and Peking University Health Science Center (PUHSC) Joint Institute (JI). We also acknowledge support from the National Institutes of Health (grants R01 DK46073 and R01 DK102643, the National Nature Science Foundation of China (30830105, 81170657 and 81570640) and Wei Li for data archival work, and Dr Huijie Xiao, Yong Yao for Alport patients care.
Footnotes
Disclosure
The authors have no conflicts or financial interests to disclose.
Publisher's Disclaimer: This is a PDF file of an unedited manuscript that has been accepted for publication. As a service to our customers we are providing this early version of the manuscript. The manuscript will undergo copyediting, typesetting, and review of the resulting proof before it is published in its final citable form. Please note that during the production process errors may be discovered which could affect the content, and all legal disclaimers that apply to the journal pertain.
References
- 1.Kriz W, LeHir M. Pathways to nephron loss starting from glomerular diseases: Insights from animal models. Kidney Int. 2005;67:404–419. doi: 10.1111/j.1523-1755.2005.67097.x. [DOI] [PubMed] [Google Scholar]
- 2.Kim YH, Goyal M, Kurnit D, et al. Podocyte depletion and glomerulosclerosis have a direct relationship in the PAN-treated rat. Kidney Int. 2001;60(3):957–68. doi: 10.1046/j.1523-1755.2001.060003957.x. [DOI] [PubMed] [Google Scholar]
- 3.Wharram BL, Goyal M, Wiggins JE, et al. Podocyte depletion causes glomerulosclerosis: diphtheria toxin-induced podocyte depletion in rats expressing human diphtheria toxin receptor transgene. J Am Soc Nephrol. 2005;16(10):2941–52. doi: 10.1681/ASN.2005010055. [DOI] [PubMed] [Google Scholar]
- 4.Matsusaka T, Xin J, Niwa S, et al. Genetic engineering of glomerular sclerosis in the mouse via control of onset and severity of podocyte-specific injury. J Am Soc Nephrol. 2005;16:1013–23. doi: 10.1681/ASN.2004080720. [DOI] [PubMed] [Google Scholar]
- 5.Wiggins RC. The spectrum of podocytopathies: a unifying view of glomerular diseases. Kidney Int. 2007;71:1205–14. doi: 10.1038/sj.ki.5002222. [DOI] [PubMed] [Google Scholar]
- 6.Sadowski CE, Lovric S, Ashraf S, et al. A single-gene cause in 29.5% of cases of steroid-resistant nephrotic syndrome. J Am Soc Nephrol. 2015;26:1279–89. doi: 10.1681/ASN.2014050489. [DOI] [PMC free article] [PubMed] [Google Scholar]
- 7.Pagtalunan ME, Miller PL, Jumping-Eagle S, et al. Podocyte loss and progressive glomerular injury in type II diabetes. J Clin Invest. 1997;99:342–8. doi: 10.1172/JCI119163. [DOI] [PMC free article] [PubMed] [Google Scholar]
- 8.Steffes MW, Schmidt D, McCrery R, et al. Glomerular cell number in normal subjects and in type 1 diabetic patients. Kidney Int. 2001;59:2104–13. doi: 10.1046/j.1523-1755.2001.00725.x. [DOI] [PubMed] [Google Scholar]
- 9.White KE, Bilous RW, Marshall SM, et al. Podocyte number in normotensive type 1 diabetic patients with albuminuria. Diabetes. 2002;51:3083–9. doi: 10.2337/diabetes.51.10.3083. [DOI] [PubMed] [Google Scholar]
- 10.Meyer TW, Bennett PH, Nelson RG. Podocyte number predicts long-term urinary albumin excretion in Pima Indians with type II diabetes and microalbuminuria. Daibetologia. 1999;42:1341–1344. doi: 10.1007/s001250051447. [DOI] [PubMed] [Google Scholar]
- 11.Lemley KV, Lafayette RA, Safai M, et al. Podocytopenia and disease severity in IgA nephropathy. Kidney Int. 2002;61:1475–1485. doi: 10.1046/j.1523-1755.2002.00269.x. [DOI] [PubMed] [Google Scholar]
- 12.Della Vestra M, Masiero A, Roiter AM, et al. Is podocyte injury relevant in diabetic nephropathy? Studies in patients with type 2 diabetes. Diabetes. 2003;52:1031–1035. doi: 10.2337/diabetes.52.4.1031. [DOI] [PubMed] [Google Scholar]
- 13.Wang G, Lai FM, Kwan BC, et al. Podocyte loss in human hypertensive nephrosclerosis. Am J Hypertens. 2009;22:300–306. doi: 10.1038/ajh.2008.360. [DOI] [PubMed] [Google Scholar]
- 14.Fukuda A, Sato Y, Iwakiri T, et al. Urine podocyte mRNAs mark disease activity in IgA nephropathy. Nephrol Dial Transplant. 2015;30:1140–50. doi: 10.1093/ndt/gfv104. [DOI] [PMC free article] [PubMed] [Google Scholar]
- 15.Fukuda A, Minakawa A, Sato Y, et al. Urinary podocyte and TGFb1 mRNA as markers for disease activity and progression in anti-GBM nephritis. Nephrol Dial Transplant. 2017 doi: 10.1093/ndt/gfx047. In press. [DOI] [PMC free article] [PubMed] [Google Scholar]
- 16.Kikuchi M, Wickman L, Hodgin J, et al. Podometrics as a Potential Clinical Tool for Glomerular Disease Management. Seminars in Nephrology. Semin Nephrol. 2015;35:245–255. doi: 10.1016/j.semnephrol.2015.04.004. [DOI] [PMC free article] [PubMed] [Google Scholar]
- 17.Wickman L, Afshinnia F, Wang SQ, et al. Urine podocyte mRNAs, proteinuria, and progression in human glomerular diseases. J Am Soc Nephrol. 2013;24:2081–95. doi: 10.1681/ASN.2013020173. [DOI] [PMC free article] [PubMed] [Google Scholar]
- 18.Wickman L, Hodgin JB, Wang SQ, et al. Podocyte Depletion in Thin GBM and Alport Syndrome. PLoS One. 2016;11:e0155255. doi: 10.1371/journal.pone.0155255. [DOI] [PMC free article] [PubMed] [Google Scholar]
- 19.Kikuchi M, Wickman L, Rabah R, et al. Podocyte number and density changes during early human life. Pediatr Nephrol. 2016 doi: 10.1007/s00467-016-3564-5. [DOI] [PMC free article] [PubMed] [Google Scholar]
- 20.Abrahamson DR. Role of the podocyte (and glomerular endothelium) in building the GBM. Semin Nephrol. 2012;32:342–349. doi: 10.1016/j.semnephrol.2012.06.005. [DOI] [PMC free article] [PubMed] [Google Scholar]
- 21.Hudson BG. The molecular basis of Goodpasture and Alport syndromes: beacons for the discovery of the collagen IV family. J Am Soc Nephrol. 2004;15:2514–27. doi: 10.1097/01.ASN.0000141462.00630.76. [DOI] [PubMed] [Google Scholar]
- 22.Barker DF, Hostikka SL, Zhou J, et al. Identification of mutations in the COL4A5 collagen gene in Alport syndrome. Science. 1990;248:1224–7. doi: 10.1126/science.2349482. [DOI] [PubMed] [Google Scholar]
- 23.Mochizuki T, Lemmink HH, Mariyama M, et al. Identification of mutations in the alpha 3(IV) and alpha 4(IV) collagen genes in autosomal recessive Alport syndrome. Nat Genet. 1994;8:77–81. doi: 10.1038/ng0994-77. [DOI] [PubMed] [Google Scholar]
- 24.Nagel M, Nagorka S, Gross O. Novel COL4A5, COL4A4, and COL4A3 mutations in Alport syndrome. Hum Mutat. 2005;26:60. doi: 10.1002/humu.9349. [DOI] [PubMed] [Google Scholar]
- 25.Savige J, Storey H, Cheong H, et al. X-linked and autosomal recessive Alport Syndrome: Pathogenic variant features and further genotype-phenotype correlations. PLOS One. 2016;11:e0161802. doi: 10.1371/journal.pone.0161802. [DOI] [PMC free article] [PubMed] [Google Scholar]
- 26.Pierides A, Voskarides K, Athanasiou Y, et al. Clinico-pathological correlations in 127 patients in 11 large pedigrees, segregating one of three heterozygous mutations in the COL4A3/ COL4A4 genes associated with familial haematuria and significant late progression to proteinuria and chronic kidney disease from focal segmental glomerulosclerosis. Nephrol Dial Transplant. 2009;24:2721–2729. doi: 10.1093/ndt/gfp158. [DOI] [PubMed] [Google Scholar]
- 27.Voskarides K, Damianou L, Neocleous V, et al. COL4A3/COL4A4 mutations producing focal segmental glomerulosclerosis and renal failure in thin basement membrane nephropathy. J Am Soc Nephrol. 2007;18:3004–3016. doi: 10.1681/ASN.2007040444. [DOI] [PubMed] [Google Scholar]
- 28.Malone A, Phelan P, Hall G, et al. Rare hereditary COL4A3/ COL4A4 variants may be mistaken for familial focal segmental glomerulosclerosis. Kidney Int. 2014;86:1253–9. doi: 10.1038/ki.2014.305. [DOI] [PMC free article] [PubMed] [Google Scholar]
- 29.Gast C, Pengelly R, Lyon M, et al. Collagen (COL4A) mutations are the most frequent mutations underlying adult focal segmental glomerulosclerosis. Nephrol Dial Transplant. 2016;31:961–70. doi: 10.1093/ndt/gfv325. [DOI] [PubMed] [Google Scholar]
- 30.Deltas C, Savva I, Voskarides K, et al. Carriers of autosomal recessive Alport Syndrome with thin GBM nephropathy presenting as focal segmental glomerulosclerosis in later life. Nephron. 2015;130:271–280. doi: 10.1159/000435789. [DOI] [PubMed] [Google Scholar]
- 31.Hodgin J, Bitzer M, Wickman L, Afshinnia F, Wang S, Yang Y, Meadowbrooke C, Chowdhury M, Kikuchi M, Wiggins J, Wiggins RC. Kidney aging and Focal Global Glomerulosclerosis. A podometric perspective. J Am Soc Nephrol. 2015;26:3162–78. doi: 10.1681/ASN.2014080752. [DOI] [PMC free article] [PubMed] [Google Scholar]
- 32.Fukuda A, Wickman LT, Venkatareddy MP, et al. Angiotensin II-dependent persistent podocyte loss from destabilized glomeruli causes progression of end stage kidney disease. Kidney Int. 2012;81:40–55. doi: 10.1038/ki.2011.306. [DOI] [PMC free article] [PubMed] [Google Scholar]
- 33.Yang Y, Hodgin J, Afshinnia F, et al. The Two Kidney to One Kidney Transition and Transplant Glomerulopathy. A Podocyte Perspective. J Am Soc Neph. 2014;26:1450–1465. doi: 10.1681/ASN.2014030287. [DOI] [PMC free article] [PubMed] [Google Scholar]
- 34.Venkatareddy M, Wang S, Yang Y, et al. Estimating podocyte number and density using a single histologic section. J Am Soc Nephrol. 2014;25(5):1118–29. doi: 10.1681/ASN.2013080859. [DOI] [PMC free article] [PubMed] [Google Scholar]
- 35.Naik AS, Afshinnia F, Cibrik D, et al. Quantitative podocyte parameters predict human native kidney and allograft half-lives. JCI Insight. 2016;1(7) doi: 10.1172/jci.insight.86943. Epub 2016 May 19. [DOI] [PMC free article] [PubMed] [Google Scholar]
- 36.Appel D, Kershaw DB, Smeets B, Yuan G, Fuss A, Frye B, Elger M, Kriz W, Floege J, Moeller MJ. Recruitment of Podocytes from Glomerular Parietal Epithelial Cells. J Am Soc Nephrol. 2009;20:333–43. doi: 10.1681/ASN.2008070795. [DOI] [PMC free article] [PubMed] [Google Scholar]
- 37.Lasagni L, Angelotti ML, Ronconi E, Lombardi D, Nardi S, Peired A, Becherucci F, Mazzinghi B, Sisti A, Romoli S, Burger A, Schaefer B, Buccoliero A, Lazzeri E, Romagnani P. Podocyte Regeneration Driven by Renal Progenitors Determines Glomerular Disease Remission and Can Be Pharmacologically Enhanced. Stem Cell Reports. 2015;5:248–63. doi: 10.1016/j.stemcr.2015.07.003. [DOI] [PMC free article] [PubMed] [Google Scholar]
- 38.Eng DG, Sunseri MW, Kaverina NV, Roeder SS, Pippin JW, Shankland SJ. Glomerular parietal epithelial cells contribute to adult podocyte regeneration in experimental focal segmental glomerulosclerosis. Kidney Int. 2015;88:999–1012. doi: 10.1038/ki.2015.152. [DOI] [PMC free article] [PubMed] [Google Scholar]
- 39.Kaverina NV, Eng DG, Schneider RR, Pippin JW, Shankland SJ. Partial Podocyte Replenishment in Experimental FSGS Derives from Non-Podocyte Sources. Am J Physiol Renal Physiol. 2016 doi: 10.1152/ajprenal.00369.2015. [Epub ahead of print] [DOI] [PMC free article] [PubMed] [Google Scholar]
- 40.Wanner N, Hartleben B, Herbach N, Goedel M, Stickel N, Zeiser R, Walz G, Moeller MJ, Grahammer F, Huber TB. Unraveling the role of podocyte turnover in glomerular aging and injury. J Am Soc Nephrol. 2014;25:707–16. doi: 10.1681/ASN.2013050452. [DOI] [PMC free article] [PubMed] [Google Scholar]
- 41.Gross O, Licht C, Anders HJ, et al. Early angiotensin-converting enzyme inhibition in Alport syndrome delays renal failure and improves life expectancy. Kidney Int. 2012;81:494–501. doi: 10.1038/ki.2011.407. [DOI] [PubMed] [Google Scholar]
- 42.Zhang Y, Wang F, Ding J, et al. Long-term treatment by ACE inhibitors and angiotensin receptor blockers in children with Alport syndrome. Pediatr Nephrol. 2016;31:67–72. doi: 10.1007/s00467-015-3184-5. [DOI] [PubMed] [Google Scholar]
- 43.Rubel D, Stock J, Ciner A, et al. Antifibrotic, nephroprotective effects of paricalcitol versus calcitriol on top of ACE-inhibitor therapy in the COL4A3 knockout mouse model for progressive renal fibrosis. Nephrol Dial Transplant. 2014;29:1012–1019. doi: 10.1093/ndt/gft434. [DOI] [PubMed] [Google Scholar]
- 44.Risdon R, Sloper J, De Wardener H. Relationship between renal function and histological changes found in renal biopsy specimens from patients with persistent glomerular nephritis. Lancet. 1968;17:363–365. doi: 10.1016/s0140-6736(68)90589-8. [DOI] [PubMed] [Google Scholar]
- 45.Bohle A, Mackensen-Haen S, von Gise H. Significance of tubulointerstitial changes in the renal cortex for the excretory function and concentration ability of the kidney: a morphometric contribution. Am J Nephrol. 1987;7:421–33. doi: 10.1159/000167514. [DOI] [PubMed] [Google Scholar]
- 46.Eddy AA, Giachelli CM. Renal expression of genes that promote interstitial inflammation and fibrosis in rats with protein-overload proteinuria. Kidney Int. 1995;47:1546–57. doi: 10.1038/ki.1995.218. [DOI] [PubMed] [Google Scholar]
- 47.Jedlicka J, Soleiman A, Draganovici D, Mandelbaum J, Ziegler U, Regele H, Wüthrich RP, Gross O, Anders HJ, Segerer S. Interstitial inflammation in Alport syndrome. Hum Pathol. 2010;41:582–93. doi: 10.1016/j.humpath.2009.08.024. [DOI] [PubMed] [Google Scholar]
- 48.Jarad G, Knutsen RH, Mecham RP, Miner JH. Albumin contributes to kidney disease progression in Alport syndrome. Am J Physiol Renal Physiol. 2016;311:F120–30. doi: 10.1152/ajprenal.00456.2015. [DOI] [PMC free article] [PubMed] [Google Scholar]
Associated Data
This section collects any data citations, data availability statements, or supplementary materials included in this article.