

Abstract
Ebola and Marburg viruses are filoviruses: filamentous, enveloped viruses that cause hemorrhagic fever1. Filoviruses are within the order Mononegavirales2 which also includes rabies virus, measles virus, and respiratory syncytial virus. Mononegaviruses have non-segmented, single-stranded negative-sense RNA genomes that are encapsidated by nucleoprotein (NP) and other viral proteins to form a helical nucleocapsid (NC). NC acts as a scaffold for virus assembly and as a template for genome transcription and replication. Insights into NP-NP interactions have been derived from structural studies of oligomerized, RNA-encapsidating NP3–6 and cryo-electron microscopy (cryo-EM) of NC7–12 or NC-like structures11–13. There have been no high-resolution reconstructions of complete mononegavirus NCs. Here, we have applied cryo-electron tomography and subtomogram averaging to determine the structure of Ebola virus NC within intact viruses and recombinant NC-like assemblies. These structures reveal the identity and arrangement of the NC components, and suggest that the formation of an extended alpha-helix from the disordered C-terminal region of NP-core links NP oligomerization, NC condensation, RNA encapsidation, and accessory protein recruitment.
NP 1–450 is an Ebola NP truncation mutant that encapsidates cellular RNA to form condensed helices with dimensions similar to those of the inner core of viral NCs11,14,15. This truncation removes the 289 C-terminal residues, which contain a long, disordered linker and a small C-terminal domain (CTD)16. We recombinantly expressed and purified NP 1–450 helices (Extended Data Fig. 1), and determined their structure by subtomogram averaging (Fig. 1a, Extended Data Table 1, Extended Data Fig. 1) to a resolution of 6.6 Å (Extended Data Fig. 2), allowing for clear identification of alpha-helical densities. We initially fitted available NP crystal structures17–19 as rigid bodies into the EM density. N- and C-terminal regions of NP 1–450 absent in the crystal structures were visible in the EM density (Fig. 1b). We modeled these regions and then performed flexible fitting to generate a structural model for the helical NP (Fig. 1c, Extended Data Fig. 3, 4, Supplementary Video 1).
Figure 1. Structure of Ebola NP 1–450.

a, The structure of an NP 1–450 helix, visualized by placing the structure of the subunit at the positions and orientations determined by subtomogram averaging. For ease of visualization, adjacent rungs are colored dark and light grey; a single subunit is highlighted in pink. In (b – j), structure of the NP 1-450 helix determined by subtomogram averaging (grey isosurface, putative RNA density in yellow) fitted with models of consecutive NP subunits colored in cyan and blue. b, crystal structure (4YPI) and c, our model fit into density map. Arrowhead indicates empty density corresponding to the N-terminal helix, arrow indicates empty density corresponding to the clamp-helix. All remaining panels use our NP model from c. d, wide and e, focused outer view of the RNA encapsidated into the cleft of NP. Above the RNA is the N-terminal lobe of the NP-core, below the RNA are the penultimate- (purple) and clamp-helices (brown). f, wide and g, focused view showing the stabilizing ribbon formed by the penultimate- and clamp-helices. h, wide and i, focused view showing the N-terminal helix of the blue subunit binding into a pocket in the neighboring cyan subunit. In i the N-terminal helix of the blue NP is colored green; it binds into a pocket in the cyan NP formed by helix-13 (red) and helix-15 (pink). j, colored schematic of NP subunit; N-terminal lobe in green, orange, and cyan; C-terminal lobe in blue, pink, purple, red, and brown. A key to helix numbering is provided in Extended Data Fig. 4. k, electrostatic potential maps calculated from our NP 1-450 model. Scale bars indicate 20 Å.
A putative RNA encapsidation cleft is located on the outside of the helix between N- and C-terminal lobes of NP (Fig. 1d-g, j, k). A continuous density runs along the cleft of each NP; we attribute this density to cellular RNA. This density can accommodate 6 nucleotides per NP (Extended Data Fig. 3), consistent with previous calculations11. It has been proposed that Ebola NP, like other mononegaviruses3–6, encapsidates RNA in the cleft by closing the N- and C-terminal lobes17–19. However, our NP 1-450 helices show the two lobes in the same “open” conformation of the RNA-free crystal structures17–19 (Fig. 1b, c, Extended Data Fig. 3b, 5). Rather than by closing the lobes, the RNA is encapsidated by a C-terminal alpha-helix (Fig. 1c, j). This alpha-helix is disordered in solution19, but in the assembled NP helix it forms a long, extended alpha-helix that runs up the outside of NP, clamping the RNA. The C-terminal, RNA-contacting end of the clamp-helix (residues 398 – 405), is highly positively charged (Fig. 1c, j, k, Extended Data Fig. 4, Supplementary Video 1). The clamp-helix extends along the penultimate alpha-helix in both the same and the neighbouring NP subunit (Fig. 1f, g), forming a “stabilizing ribbon” of stacked alpha-helices that run along the NP helix.
NP contains a binding pocket between helices 13 and 15 (Fig. 1i, j) that can bind different helical peptides including two from VP3517,19 and one formed by part of the penultimate helix of NP core18. In the assembled NP 1-450 helices, we find that this pocket is bound by the N-terminal alpha-helix of the adjacent NP subunit (Fig. 1h, i, Supplementary Video 1), analogous to interactions seen in other mononegaviruses20. This is consistent with the proposal that NP is maintained in a monomeric state by occupation of this pocket by VP3517,19 (or by part of the penultimate helix18), until it is displaced by an NP N-terminal helix in tandem with RNA encapsidation.
In addition to NP and RNA, assembly of a complete filovirus NC requires co-expression of VP35, the filovirus analog of the P protein, a polymerase cofactor found in other mononegaviruses, and VP24, which is unique to filoviruses11,15,21. VP35 and VP24 are interferon antagonists22–25. We produced NP-VP24-VP35-VP40 virus-like particles (VLPs) (Extended Data Fig. 1), and determined the structures of their NCs by subtomogram averaging (Fig. 2a,b, Extended Data Fig. 1). The inner NC layer had a resolution of 7.3 Å, while the flexible outer layers were resolved to lower resolutions (Extended Data Fig. 2). This structure is consistent with previous low-resolution structures of filovirus NCs10,11. The NP subunits in the inner layer of the NC have the same structure as those in the NP 1–450 helices; our model for NP 1–450 fit this layer well as a rigid body (Fig. 2c,d, Supplementary Video 1).
Figure 2. Structure of Ebola NP-VP24-VP35-VP40 VLPs.

a, The structure of an Ebola NP-VP24-VP35-VP40 VLP helix, visualized by placing the density of a subunit in positions and orientations determined by subtomogram averaging. For ease of visualization, adjacent rungs are in dark and light grey; a single subunit is highlighted in pink. b, Ebola NP-VP24-VP35-VP40 VLP subunit densities. In blue and cyan are NP subunits, in orange is the small outer protrusion and in purple is the large outer protrusion. Continuous yellow density is RNA. Densities along the same rung are in dark grey, densities from other rungs are transparent. c, Detailed view of the RNA-encapsidation region; the outer densities are sliced to reveal the NP-RNA interface. This interface is nearly identical to that shown in (Fig. 1d, e). In (d – f), panels show molecular models fitted into the EM densities. The two NP models are in blue and cyan while two VP24 models are shown in orange and purple; model colors match the density colors in panel (b). Highlighted on the EM densities in green is a VP24 surface region including the N-terminal end of helix-1, the ends and loop joining helix-5 and -6, helix-7, and the N-terminal end of helix-8. In the orange VP24 this region binds NP, in the purple VP24 this region binds VP35. d, Side view of an individual asymmetric unit; the density threshold is set to show weaker unassigned densities. e, and f, Detailed views of VP24 fits in the large and small outer protrusions, respectively (see also Extended Data Fig. 6). Density thresholds are set to show helical densities. Scale bars indicate 20 Å. See also Supplementary Video 1.
The repeating unit of the assembled NC consists of two adjacent copies of NP, one of which has a large protrusion of additional density on the outside of the helix (Fig. 2b, purple density), while the other has a smaller protrusion of additional density (Fig. 2b, orange density). We masked out the densities occupied by NP and RNA, leaving only these outer protrusions. We then performed a global fitting search using available crystal structures of VP24, the C-terminal domain of VP35, and the small, globular NP CTD (residues 641 – 739) (Extended Data Fig. 6). We identified VP24 in two positions immediately adjacent to NP, one in the small protrusion and one in the large (Fig. 2d, Extended Data Fig. 6). We did not identify a unique fit for NP CTD or VP35. The requirement of VP35 for proper NC formation, the radial position of VP35 determined by immuno-EM10, and the size of the large peripheral density, suggests that VP35 is located within this density.
Unusually, the orientation of VP24 differs in the two outer protrusions. In the small protrusion, a face of VP24 including the N-terminus of helix 1, the ends and adjoining loop of helix 5 and 6, helix 7, and the N-terminal end of helix 8, binds directly to the N-terminal lobe of the NP-core in the vicinity of NP helix 2 (Fig. 2f). In the large protrusion, this face of VP24 binds the putative VP35 density, while the base of the VP24 pyramid forms the interaction with the NP (Fig. 2e). Helix 6 of NP is poorly ordered in the NP 1-450 helices, but appears to be stabilized in the NP-VP24-VP35-VP40 VLPs (Extended Data Fig. 7).
Contacts between rungs of the helix are formed between the C-terminal helix pair of NP in one rung, and helices 3, 4, and the beta-hairpin of the N-terminal domain of NP in the adjacent rung (Extended Data Fig. 8). The NP-NP interactions differ in NP 1-450 and NP-VP24-VP35-VP40 VLPs suggesting that the inter-rung interface “slips” into a different preferred position when VP24 and VP35 are bound.
To validate the structural data obtained using virus-like particles, we purified Ebola virus and Marburg virus particles (Extended Data Fig. 1), and determined the structures of the NCs within intact virus particles by subtomogram averaging (Fig. 3a,d, Extended Data Fig. 1). We obtained a structure for the Ebola virus NC in which the NP layer was resolved at 9.1 Å (Fig. 3a-c, Extended Data Fig. 2), and a structure of the Marburg virus NC in which the NP layer was resolved at 8.6 Å (Fig. 3d-f, Extended Data Fig. 2). Comparison of the two structures with that of the NP-VP24-VP35-VP40 VLPs show that while the viral particles have more variable NC diameters, the structure and arrangements of NP and VP24 are the same in all three samples (Fig. 2b,d, 3b,c,e,f). Marburg virus showed an additional, poorly ordered density bridging the two VP24 molecules (Fig. 3e).
Figure 3. Structure of Ebola and Marburg NCs from intact viruses.

a, and d, Visualizations of Ebola and Marburg NC, respectively. Visualizations consists of subunit densities positioned using the positions and orientations determined by subtomogram averaging. b, and e, Subunit densities of Ebola and Marburg NC, respectively. In cyan and blue are NC densities. In orange and purple are the small and large outer protrusions, respectively. Green density is extra disordered density in Marburg NC. Grey densities show other subunits on the same rung; densities from adjacent rungs are transparent. RNA density is in yellow. c, and f, Molecular model fits of NP and VP24 in Ebola and Marburg NC subunits, respectively. Model colors correspond with colors in (b and e). Scale bars indicate 20 Å.
The two NP-VP24 binding modes generally alternate along the NC helix, but we observe positions in NP-VP24-VP35-VP40 VLPs, Ebola and Marburg viruses, where a single NP insertion breaks this pattern (Extended Data Fig. 9). Such single NP molecules often appear in several consecutive rungs, creating a short “seam” along the helix. This implies that VP24 binding is influenced by its neighbours on adjacent rungs. It is unclear why the virus has evolved the unusual alternating VP24 binding, but we suggest that the apparent 2:2:1 NP:VP24:VP35 stoichiometry packages the appropriate amounts of VP24 and VP35 into the virus, and may allow for their regulation of replication and antagonization of immune responses upon infection of a new cell.
In the absence of both VP24 and VP35, NP-RNA assemblies do not condense unless regions downstream of the NP clamp-helix are truncated19. This suggests that these disordered regions hinder condensation through steric, entropic, or other effects, and that binding of VP24 and VP35 to these disordered regions overcomes this hindrance. Our structure also suggests that interactions between VP24/VP35 lobes across rungs of the helix may directly promote condensation.
Here we show that in fully assembled NP, the C-terminal helix forms a long, extended alpha-helix with a positively charged end that clamps the RNA. The extended helix contributes to interactions with adjacent NP molecules both along and between helical rungs, while positioning the downstream disordered regions in the vicinity of the VP24 binding site. It was previously shown that the C-terminal helix of the NP-core is disordered in solution19 and the first few turns of the helix become ordered upon NP oligomerization in the absence of RNA19. We propose a model in which oligomerization of NP, likely by removal of a VP35 peptide19 induces partial ordering of the clamp-helix, bringing the C-terminal end of the clamp-helix into the vicinity of the RNA-encapsidation cleft, thereby forming a metastable positively charged region that promotes RNA encapsidation. RNA encapsidation results in stabilization and rigidification of the clamp-helix; the cascade of RNA encapsidation and clamp-helix rigidification induces formation of the “stabilizing ribbon” and provides a structured interface for inter-rung contacts. In Ebola NP 1–450, this process results in condensation; in full length NP, the rigidification of the clamp-helix is likely hindered by C-terminal residues of NP, producing a semi-condensed state which then recruits VP24 and VP24-VP35 to complete condensation. In this model, the transition of the clamp-helix between a short, open, solution form and a long, closed, assembled form provides the mechanistic link between oligomerization of NP-RNA, RNA encapsidation, condensation of the NP helix, and recruitment of other viral proteins to the NC.
Methods
Cell lines
HEK-293T and VeroE6 cells were obtained from the American Type Culture Collection (ATCC). HuH-7 cells were obtained from Japanese Collection of Research Bioresources (JCRB). VeroE6 and Huh-7 cell lines were tested for mycoplasma contamination. HEK-293T cells are listed in the database of commonly misidentified cell lines maintained by the ICLAC, but were used as they are well-established tools for the expression of VLPs: the cells themselves are not being studied.
Expression and purification of Ebola NP 1–450 NC-like assemblies
Expression and purification of Ebola NP 1–450 assemblies were performed as previously described11. HEK-293T cells were transfected with plasmid and lysed 3 days post-transfection in lysis buffer (10 mM Tris·HCl (pH 7.8), 0.15 M NaCl, 1 mM EDTA, 0.1% Nonidet P-40 and Protease inhibitor mixture (Roche)). Assemblies were purified by a discontinuous 25–40% (w/w) CsCl gradient centrifugation at 250,000 × g at 20° C for 1 h. The assembly band was pelleted by ultracentrifugation at 200,000 × g at 4° C for 30 min. The pellet was resuspended and fixed in 1% paraformaldehyde (PFA) before storage and transport at 4° C.
Expression and purification of Ebola NP-VP24-VP35-VP40 VLPs
HEK-293T cells were transfected with full length NP, VP24, VP35 and VP40 plasmids. Supernatant was collected 3 days post-transfection and clarified by centrifugation at 800 × g for 10 min at 4° C. Remaining steps were performed at 4° C. VLPs were pelleted through a 20% (w/v) sucrose cushion in TNE buffer (50 mm Tris–HCl pH 7.4, 100 mm NaCl, 0.1 mm EDTA) at 230,000 × g for 3 h, resuspended in TNE and separated on a Nycodenz step gradient (2.5%, 5%, 7.5%, 10%, 15%, 20%, 30% (v/v)) at 34,400 × g for 15 min. Fractions 4–6 were collected and checked by negative stain EM; fractions confirmed to contain VLPs were pooled and pelleted at 92,000 × g for 2 h. Final pellets were resuspended in TNE.
Preparation of inactivated Ebola and Marburg viruses
Virus specimens were grown, purified, and fixed as previously described10,11. Briefly, VeroE6 or Huh-7 cells were infected with EBOV Zaire (strain Mayinga) or MARV, respectively. Supernatant was collected 1 day post-infection, and centrifuged at 4° C for 2 h at ~77,000 × g through a 20% (w/w) sucrose cushion to purify virus particles. The virus pellet was resuspended in PBS (deficient in calcium and magnesium), re-pelleted, and inactivated with PFA, (final concentration 4%) in DMEM for 24 h by filling the tube completely. The viruses were pelleted and the 4% PFA solution in DMEM (w/v) was replaced with a fresh solution of 4% PFA. The sample was removed from the BSL-4 facility after an additional 24 h.
Cryo-electron tomography
Degassed C-Flat 2/2-3C grids were glow discharged for 30 s at 20 mA. Virus or VLP solution was diluted with 10 nm colloidal gold; 2.5 μl of this mixture was applied to each grid and plunge frozen into liquid ethane using a FEI Vitrobot Mark 2. Grids were stored in liquid nitrogen until imaging.
Tomographic imaging was performed as described previously26. Imaging was performed on a FEI Titan Krios at 300 keV using a Gatan Quantum 967 LS energy filter with a slit width of 20 eV and a Gatan K2xp direct detector. Tomograms were acquired from -60° to 60° with 3° steps using SerialEM27 and a dose-symmetric tilt-scheme28. Images were acquired in super-resolution mode.
Frames were aligned with either the K2Align software, which uses the MotionCorr algorithm29, or with the frame alignment algorithm built into serialEM; frames were aligned and Fourier cropped to 4K x 4K, giving a final pixel size of 1.78 Å/pixel. Defocus for each tilt was determined by CTFFIND430. Tilt images were filtered by cumulative electron dose using the exposure-dependent attenuation function and critical exposure constants described eleswhere26,31. Tilt images were CTF-corrected using ctfphaseflip32 and tomograms were reconstructed using weighted back projection in IMOD33. Tomograms with poor fiducial alignment were discarded (Extended Data Table 1). Poor fiducial alignment was defined as alignment residual above 1 pixel in 2x binned data or retaining fewer than 8 fiducial markers. CTF-corrected unbinned tomograms were binned by 2x (3.56 Å/pixel) and 4x (7.12 Å/pixel) with a Lanczos two-lobe anti-aliasing filter.
Detailed dataset parameters are given in Extended Data Table 1.
Subtomogram averaging
NC and NC-like filaments were previously shown to have multiple helical symmetries that sporadically switch along each filament10,11, hindering the use of helical reconstruction methods, which depend on data with regular helical symmetry. To address this problem, we previously used a combination of subtomogram averaging to determine local symmetries and helical-reconstruction for structure determination10,11. Such approaches yielded resolutions of 34 and 41 Å for Marburg and Ebola viruses, respectively, which were at the time better than subtomogram averaging. Subtomogram averaging makes no use of helical symmetry parameters and has recently proven capable of near-atomic resolution structure determination26. We therefore elected to apply subtomogram averaging for structure determination.
Filaments of interest were identified in 4x-binned tomograms using the Amira visualization software (FEI Visualization Sciences group). Using Amira and the electron microscopy toolbox34, points along the filament centers were selected. These were used to define the filament axes and generate an oversampled cylindrical grid for each NC or NC-like assembly; gridpoints that served as initial extraction points for subtomograms are therefore arbitrarily positioned relative to underlying NC subunits.
Initial references were generated by subtomogram averaging of single NC filaments using 4x binned data. Subtomogram averaging was performed using TOM35, AV336, and dynamo37, and scripts derived from their functions. Initial Euler angles were derived from the cylindrical grid, providing an initial average that was a section of a tube. From there a 6-dimensional search was performed to refine Euler angles and Cartesian shifts, resulting in a low-resolution structure; this reference was used to align the full dataset.
Since NC filaments are polar, relative polarities of each filament with respect to the initial reference was determined by performing subtomogram averaging on 30 subtomograms from each filament, with and without an extra 180° in-plane rotation. Constrained cross-correlation (CCC) values of rotated and unrotated subtomograms were compared to determine relative polarity.
After determination of relative polarities, 4x binned subtomograms were roughly aligned with a low pass filter of ~35 Å. After convergence of subunits, oversampled particles were removed using distance thresholding. A lower CCC threshold was set at a value to exclude subtomograms that had misaligned to positions away from the helical NC. The datasets were then split into “odd and even” sets, and aligned independently from this point on. Subtomograms were re-extracted with 2x binning and halfsets were aligned independently until the 6D search converged. Subtomograms were then extracted from 1x binned data.
Alignment of 1x binned data was performed using a modified wedge mask for the calculation of the CCC and subsequent weighted averaging38. Rather than a binary wedge mask, the modified wedge masks represents the amplitude of the determined CTF and applied exposure filters at each tilt.
The approximate helical symmetries of NCs can be estimated from the subunit positions determined by subtomogram averaging. Helical parameters were estimated from lattice maps of 10 NCs by measuring the distances between subunits along several helical rungs and counting the number of subunits within these distances. Ebola NP 1–450 had an average helical pitch of 71±1 Å, with subunits per turn ranging from 25.3 – 28.3 (with integer steps). Ebola NP-VP24-VP35-VP40 NC-like structures had an average pitch of 75±3 Å with 12.8 or 13.8 subunits per turn. Ebola virus NC had an average pitch of 74±1 Å and 11.9 or 12.9 subunits per turn while Marburg virus NC had an average pitch of 77±1 Å and 14.8 or 15.8 subunits per turn. It is important to note that helical symmetry is not applied during structure determination by subtomogram averaging. The variability of the helical symmetry parameters, and the presence of “misincorporated NP” (see below), means that these parameters cannot be directly applied for helical reconstruction methods.
Visualization of tomograms and electron density maps were performed with UCSF chimera39.
Identification of misincorporated NP
Lattice maps illustrate the positions and orientations of the subtomograms after alignment to the reference, and were used to assess the helical symmetry of the NC (Extended Data Fig. 9). For NP-VP24-VP35-VP40 VLPs and viral NCs, each subtomogram corresponds to two copies of NP and is represented by one cyan arrow. Occasionally positions were identified where neighbouring subunits were separated by 1.5 times the expected distance, a “gap”. An average inter-subunit vector describing the translation between subunits around a gap was determined by averaging 20 vectors from manually picked positions across the dataset. The average inter-subunit vector was then used to search the dataset; at each instance of a vector match, a position was defined at the midpoint of the vector and an orange arrow was placed at this position (Extended Data Fig. 9).
Since lattice maps generated from subtomogram averaging contain a fraction of false positive and false negative positions, an exact quantification of the number of misincorporated NPs cannot be performed, but based on the results of this search we estimate 1.3% of NPs are misincorporated in Ebola virus and 0.6% in Marburg virus. In Ebola virus, ~28% of misincorporated NP are part of a “seam”; i.e have a misincorporated NP in a neighbouring position on an adjacent rung. For Marburg virus this is ~22%. The probabilities for randomly distributed misincorporations to be part of a seam are only ~2.6% for Ebola virus and ~1.2% for Marburg virus. The presence of seams indicates that the binding mode of VP24 is influenced by its neighbour in the adjacent rung. The binding mode of VP24 alternates along the helix, indicating that the binding mode of any one VP24 molecule is also influenced by the binding mode of its neighbour on the same rung.
Local resolution estimation
Local resolution was determined by calculating local FSCs. Local FSCs were calculated by padding the references and calculating mask-corrected FSCs40 in moving windows of 96 pixels using spherical masks with radial Gaussian mollification of 28 pixels. Windows were calculated along a 3D grid with 4 pixel spacing. For each grid point, local FSC plots were used for local low pass filtering, figure of merit weighting, and sharpening41.
Resolution was also estimated for each protein layer using three cylindrical FSC masks made in the Dynamo software package37 (Extended data Fig. 3). The circular cross section of each masks contained a full NC subunit; i.e. two NPs, two VP24s, and the unassigned densities. The three masks had varying heights and positions, and were centered on either the NP core, VP24 layer, or outer unassigned density layer. The three masks were used on each subtomogram average, with the exception of NP 1–450, which was only measured with the NP core mask.
Structure modeling and fitting
Chain C of the 4YPI Ebola NP crystal structure was edited in Coot42. Specifically, the last two C-terminal helices were moved into the EM densities as rigid bodies. The final C-terminal helix was extended to fit the length of the tubular density in the EM map through the addition of a segment of ideal alpha-helix. The missing N-terminal helix and loop was built by first extending the loop from the N-terminal beta-hairpin following the loop density. A segment of ideal alpha-helix was then added to fit the tubular density. Models were then fit into the 6.6 Å density map of NP1-450 using molecular dynamics flexible fitting43 and NAMD44 using explicit solvent.
A 6-nucleotide RNA oligomer from measles virus NC9 (PDB: 4UFT) was fit into the NP 1–450 density. First, the N-terminal lobe of measles NP-RNA was aligned with the N-terminal lobe of our NP model using the matchmaker tool in UCSF chimera39. The measles RNA model was then split from the NP and rigid body fitted into the segmented RNA density of Ebola NP 1–450. This fitting was also performed for the two adjacent NP subunits in the subtomogram average; the distance between the terminal oxygen of one segment and the terminal phosphorous of the adjacent segment is ~2.6 Å. This is only ~1 Å longer than a standard phosphate bond, and given that this is a rigid body fit, suggests that the density corresponds to repeating 6-nucleotide segments. This is in agreement with previous estimates11.
Rigid body fitting by global search
The central subunit was segmented from a subtomogram averaging map of NP-VP24-VP35-VP40. Two copies of our refined NP model were fitted into the model as rigid bodies; densities were generated from the PDBs with the Chimera molmap tool39 and subtracted from the EM density. The remaining densities (Extended Data Fig. 6) represent the protruding outer densities. Crystal structures of VP2445 (PDB: 4M0Q), VP35 C-terminal domain24 (PDB: 3FKE), and NP CTD16 (PDB:4QB0) were randomly fitted into the remaining densities as rigid bodies, using global search mode of the Chimera fitmap tool39. PDBs were placed into the difference map as densities at 8.5 Å resolution, i.e. the local resolution of the regions directly next to NP (Extended Data Fig. 2), in 10,000 random positions and orientations and locally refined. Final positions were grouped by cross-correlation and plotted into histograms (Extended Data Fig. 6). For VP24 (Extended Data Fig. 6), the histogram showed two high-scoring outliers, indicating unique fits outside of the bulk distribution. Visual analysis of these fits showed fitting of secondary structure elements, confirming these as correct positions. No high scoring outliers were observed when fitting with VP35 or NP-CTD, the best fits were not within the regions directly next to NP, and they were not in regions with resolved secondary structural elements.
With the position of VP24 confirmed, densities corresponding to VP24 were subtracted from the maps, leaving only the unassigned peripheral densities (Extended Data Fig. 6). VP35 CTD and NP CTD were fit as before, but with resolution set to 15.2 Å, corresponding to the local resolution in this region (Extended Data Fig. 2). At this resolution, fitting is primarily driven by the overall molecular envelope of the search model, i.e. size and overall shape. While the folded domains of VP35 and NP CTD can both be accommodated in the remaining densities, they cannot be conclusively positioned at this resolution.
The smaller of the two unassigned peripheral densities is very weak in the virus NC, suggesting that this position is rarely occupied in the virus. Differences in expression level in the VLP system may lead to more frequent protein binding at this position.
Our structural data do not reveal the position of the long, disordered linker between the NP core and the NP CTD16, nor do they reveal the position of the N-terminal ~200 residues of VP35. These residues may partially contribute to the unassigned peripheral densities and/or they may have a flexible conformation relative to the NC and therefore not be resolved in the structure.
Code availability statement
Modifications were made to the TOM35 and AV336 packages to implement modified wedge masks, local FSC calculations, and local map sharpening. The modified and additional MATLAB scripts can be downloaded from http://www.embl.de/research/units/scb/briggs/services/index.php under the GPL v.3 license for academic and non-commercial use.
Data availability statement
Subtomogram averaging structures and representative tomograms for Ebola NP 1-450, Ebola NP-VP24-VP35-VP40, Ebola virus, and Marburg virus have been deposited in the Electron Microscopy Data Bank under accession numbers EMD-3869, EMD-3870, EMD-3871, EMD-3872, EMD-3873, EMD-3874, EMD-3875, and EMD-3876. Models for Ebola NP, and NP-VP24 have been deposited in the Protein Data Bank under accession numbers 6EHL and 6EHM.
Extended Data
Extended Data Figure 1. Representative orthoslices of tomograms and subtomogram averages.

Top row shows orthoslices through the middle of representative tomograms of the NC and NC-like assemblies. Bottom row shows orthoslices taken through the structures determined by subtomogram averaging. The inside of the NC helix is on the left. Scale bars indicate 20 nm.
Extended Data Figure 2. Local resolution maps and FSCs of NC and NC-like assemblies.

In each panel, the small inset shows the full subtomogram averaging structure of part of the helix with a central subunit colored. Subtomogram averaging maps are locally filtered and sharpened. The isolated central subunits are shown zoomed in. The surface is colored according to local resolution in Å, as defined by the colormap on the right. FSC curves are calculated using cylindrical masks, with a circular cross section of approximately one viral subunit (2 NPs and outer protrusions) and height centered at each protein layer; green is for NP core, yellow is for VP24 layer, and red is for outer unassigned density layer. In general, the NP-core has high, homogeneous resolutions while outer subunits have decreasing resolution with respect to their distance from NP core.
Extended Data Figure 3. Model of NP from subtomogram averaging compared to NP crystal structure and with modeled RNA.

a, different views of the subtomogram averaging derived NP model (cyan) and the NP crystal structure17 (pink, PDB: 4YPI). Left is a view from inside the NC helix, center is a cross-sectional view of the NC, and right is a view from outside the NC. b, the NP model in the EM density from our NP 1–450 subtomogram averaging structure. Left shows a cross-sectional view of NC. In the RNA density (yellow), is a rigid-body fit of the 6 nucleotide RNA segment from measles virus NP9 (PDB: 4UFT). In the center and right panels, three NP-RNA models from the left panel are fitted as rigid bodies. Center is a view from the outside of the NC, and right is a focused view of the RNA density. Scale bars indicate 20 Å.
Extended Data Figure 4. Sequence and secondary structure of NP model.

Our NP model contains NP residues 16 – 405. Secondary structure elements are highlighted and colored according to Fig. 1j. Secondary structure labels follow that of crystal structure 4YPI17.
Extended Data Figure 5. Comparison of mononegavirus NPs and encapsidated RNA.
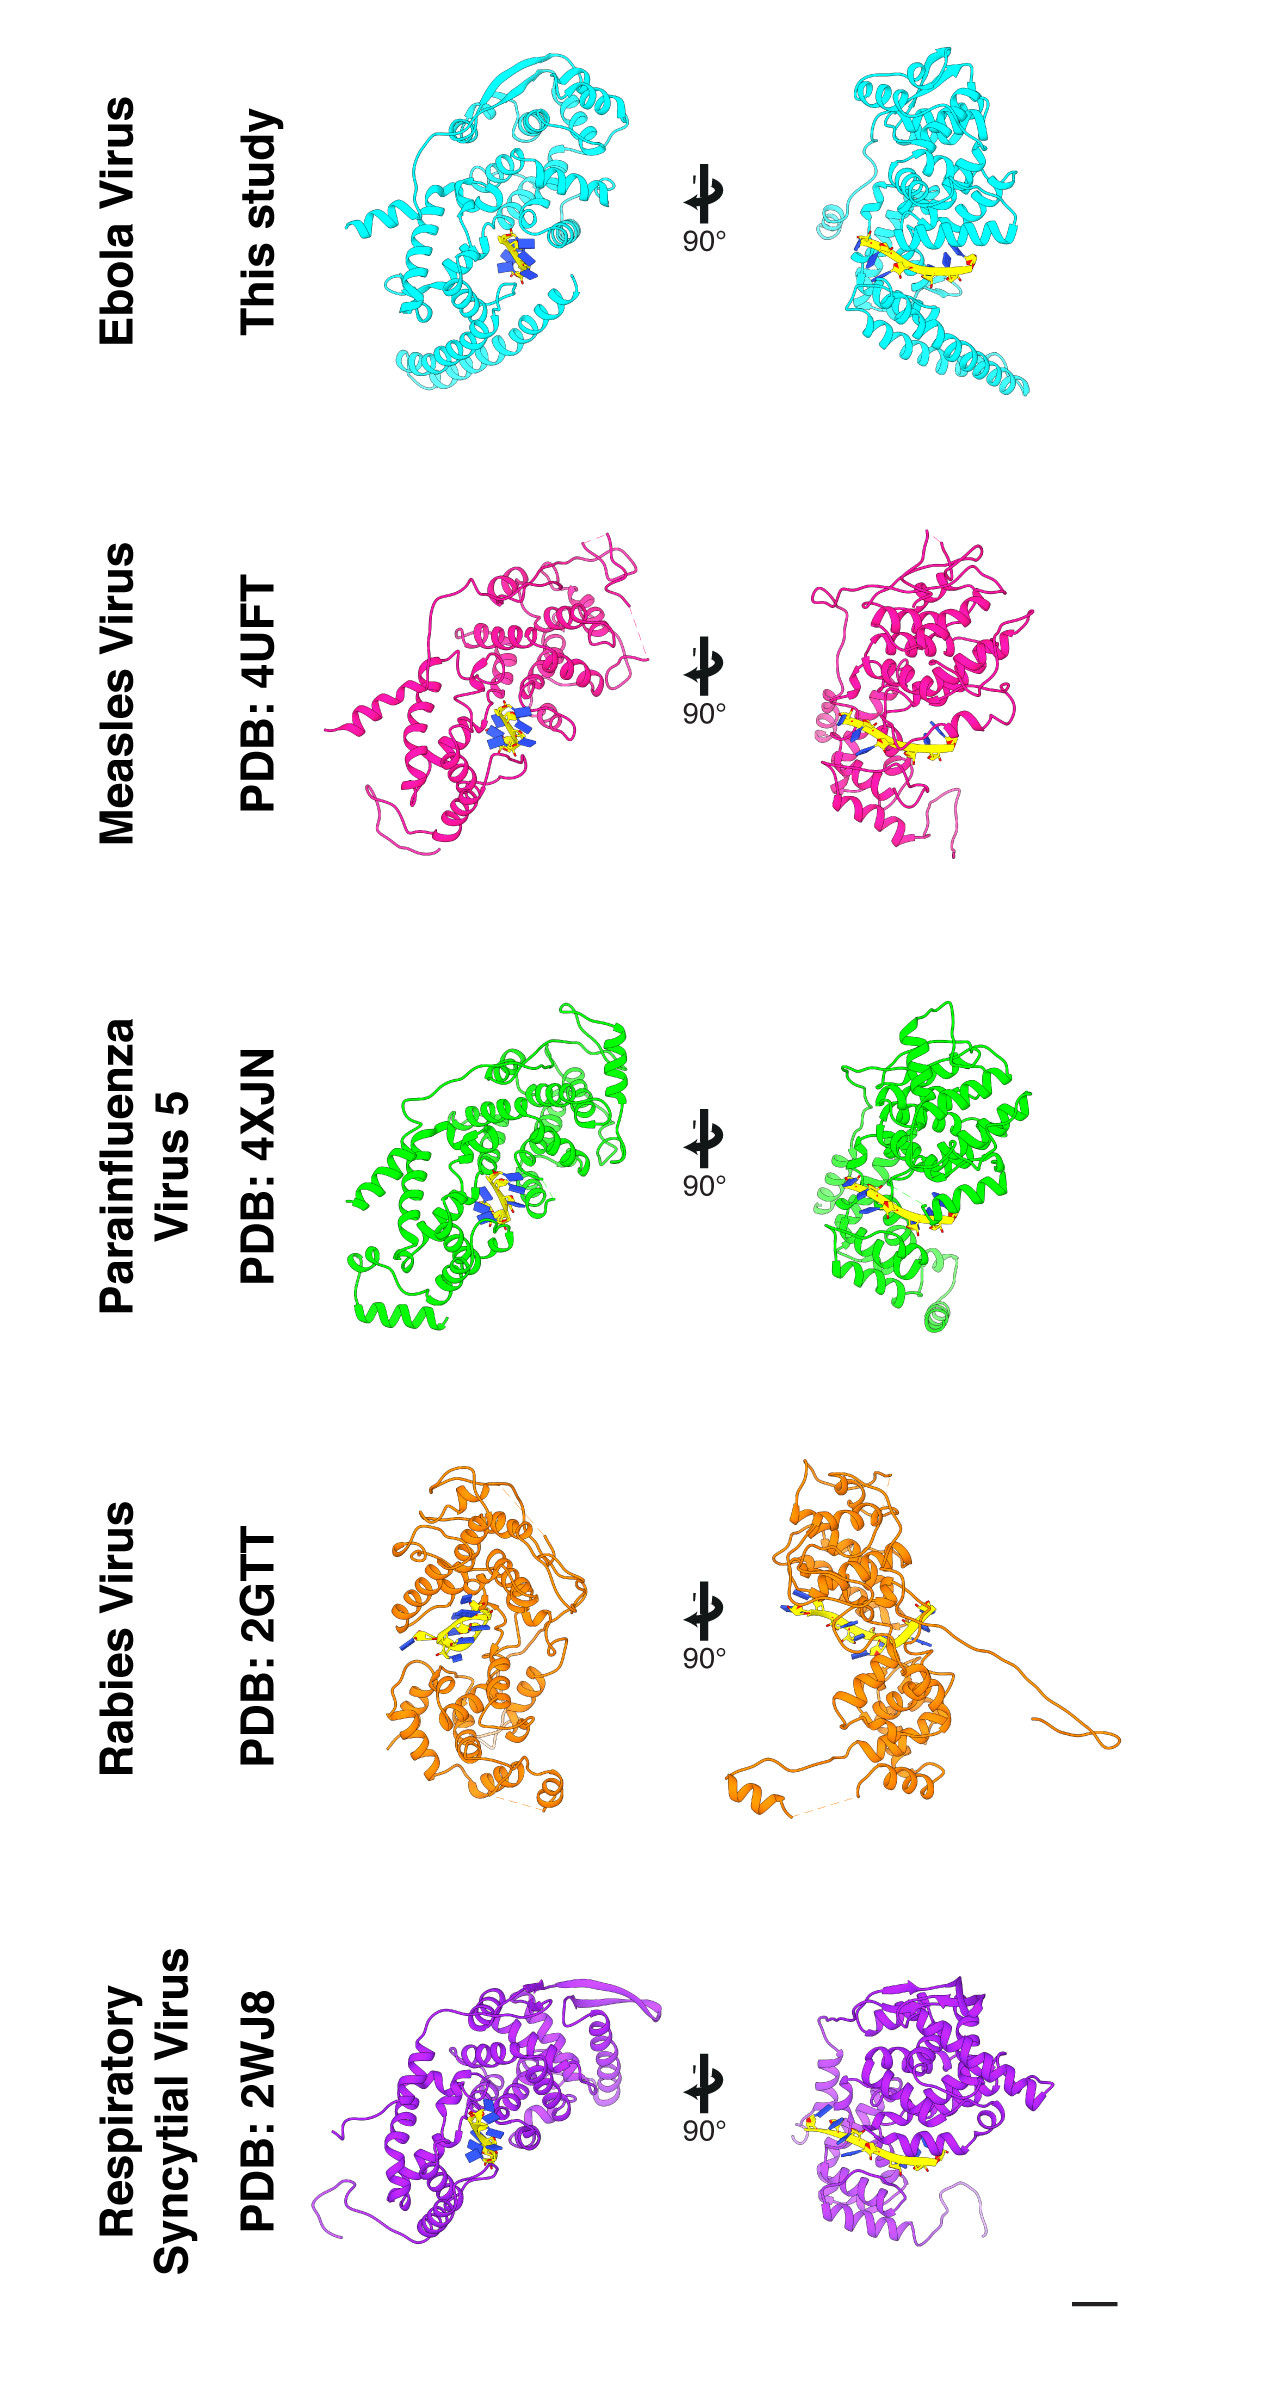
Each row shows two views of each NP: left is a cross-sectional view of the NC, with the center of the NC axis to the left, right is a view of the NP from outside the NC. Scale bar indicates 20 Å.
Extended Data Figure 6. Global fit of Ebola crystal structures into the subtomogram averaging structure of Ebola NP-VP24-VP35-VP40 NC-like assembly.

Left column shows histograms for random rigid-body fits. Coloured arrows identify the fits illustrated in the other columns. Second column shows top two scoring fits within the targeted density. Last two columns show detailed views of the highest and second highest scoring fits, respectively. a, fits into the full outer densities, densities are shown at 1.5 σ, except the detailed view of the VP24 fits which are shown at 2.5 σ. The fits of VP24 are high scoring outliers indicating correct fits, and are those shown in Fig 2. b, fits into the VP24-subtracted outer protrusion densities; densities are shown at 1.2 σ.
Extended Data Figure 7. Stabilization of NP helix 6 upon outer protein binding.

Top of each panel shows cross section of NC-like structures. In light grey are two NC subunits. Lower panel shows a detailed view of the two NC subunits with molecular models fitted. Helix 6 (arrow) in NP 1-450 shows nearly no density while in NP-VP24-VP35-VP40, binding of VP24 stabilizes this helix. Scale bars indicate 50 Å.
Extended Data Figure 8. Different inter-rung contacts between Ebola NP 1–450 and NP-VP24-VP35-VP40.

Top row shows part of the helix viewed from the inside. Subunits on adjacent rungs are highlighted in grey; these correspond to the subunits fitted by the NP models on the bottom rows. The relative positions of NP molecules across the inter-rung contact differ by 8.3 Å. Scale bars indicate 20 Å.
Extended Data Figure 9. Lattice map revealing the helical symmetry of Ebola NC.

Cyan arrows denote the positions of one asymmetric unit (two copies of NP, each of which has VP24 bound in a different orientation), as determined by subtomogram averaging. Orange arrows denote positions where a single NP subunit is present that disrupts the normal alternating arrangement of VP24 binding position. Single-NP subunits often appear on consecutive rungs along higher-order helical symmetries, forming “seams” along the NC helix. This suggests that VP24 binding is not only influenced by the neighbouring subunits along the NP helix, but also by neighbouring subunits on adjacent rungs.
Extended Data Table 1. Cryo-EM data collection, refinement and validation statistics.
| Ebola NP 1-450 (EMD-3869) (PDB 6EHL) |
Ebola NP-VP24-VP35-VP40 (EMD-3871) (PDB 6EHM) |
Ebola Virus (EMD-3873) |
Marburg Virus (EMD-3875) |
|
|---|---|---|---|---|
| Data collection and processing | ||||
| Magnification | 81,000x | 81,000x | 81,000x | 81,000x |
| Voltage (kV) | 300 | 300 | 300 | 300 |
| Electron exposure (e–/Å2) | ~80-120 | ~100 | ~140 | ~80 |
| Defocus range (μm) | -2.0 to -4.5 | -2.0 to -4.5 | -2.0 to -4.5 | -2.0 to -4.5 |
| Detector | Gatan Quantum K2 | Gatan Quantum K2 | Gatan Quantum K2 | Gatan Quantum K2 |
| Energy filter | Yes | Yes | Yes | Yes |
| Slit width (eV) | 20 | 20 | 20 | 20 |
| Tilt range (min/max, step) | -60/60°, 3° | -60/60°, 3° | -60/60°, 3° | -60/60°, 3° |
| Tilt scheme | Hagen scheme | Hagen scheme | Hagen scheme | Hagen scheme |
| Pixel size (Å) | 1.78 | 1.78 | 1.78 | 1.78 |
| Tomograms (used / acquired) | 63 / 64 | 56 / 64 | 117 / 157 | 73 / 82 |
| Filaments | 248 | 191 | 151 | 89 |
| Symmetry imposed | None | None | None | None |
| Final subtomograms (no.) | 127,346 | 35,366 | 108,630 | 65,800 |
| Map resolution (Å) | 0.143 | 0.143 | 0.143 | 0.143 |
| FSC threshold | ||||
| Map resolution range (Å) | 6.6 | 7.3 – 15.2 | 9.1 – 13.8 | 8.6 – 15.9 |
Supplementary Material
Acknowledgements
The Briggs laboratory acknowledges financial support from the European Molecular Biology Laboratory and from the European Research Council (ERC) under the European Union's Horizon 2020 research and innovation programme (ERC-CoG-648432 MEMBRANEFUSION). The Becker group was supported by the Deutsche Forschungsgemeinschaft (Sonderforschungsbereich 1021) and by the German Center for Infection Research (DZIF). This work was supported by an EMBO long-term fellowship, ALTF 748-2014, awarded to WW. We thank Y. Kawaoka (U. Wisconsin, Madison) for support during this collaborative study and W. J. H. Hagen (EMBL Heidelberg) for assistance during tomographic data collection.
Footnotes
Author Contributions
W.W., S.B., and J.A.G.B. designed and interpreted experiments. L.K., M.C., A.K., and T.N. prepared specimens. W.W. collected data and performed image processing. W.W. and J.A.G.B. analyzed data and wrote the manuscript with support from all authors.
Author Information
Reprints and permissions information is available at www.nature.com/reprints. Readers are welcome to comment on the online version of the paper.
The authors declare no competing financial interests.
References
- 1.Feldmann H, Sanchez A, Geisbert T. In: Fields virology. Knipe David M, Howley Peter M., editors. Lippincott Williams Wilkins; 2013. pp. 923–956. [Google Scholar]
- 2.Lamb RA. In: Fields Virology. Knipe David M, Howley Peter M., editors. Vol. 30. Lippincott Williams Wilkins; 2013. pp. 880–884. [Google Scholar]
- 3.Albertini AAV, et al. Crystal Structure of the Rabies Virus Nucleoprotein-RNA Complex. Science. 2006;313:360–363. doi: 10.1126/science.1125280. [DOI] [PubMed] [Google Scholar]
- 4.Green TJ, Zhang X, Wertz GW, Luo M. Structure of the Vesicular Stomatitis Virus Nucleoprotein-RNA Complex. Science. 2006;313:357–360. doi: 10.1126/science.1126953. [DOI] [PubMed] [Google Scholar]
- 5.Tawar RG et al. Crystal Structure of a Nucleocapsid-Like Nucleoprotein-RNA Complex of Respiratory Syncytial Virus. Science. 2009;326:1279–1283. doi: 10.1126/science.1177634. [DOI] [PubMed] [Google Scholar]
- 6.Alayyoubi M, Leser GP, Kors CA, Lamb RA. Structure of the paramyxovirus parainfluenza virus 5 nucleoprotein–RNA complex. Proceedings of the National Academy of Sciences. 2015;112:E1792–E1799. doi: 10.1073/pnas.1503941112. [DOI] [PMC free article] [PubMed] [Google Scholar]
- 7.Ge P, et al. Cryo-EM Model of the Bullet-Shaped Vesicular Stomatitis Virus. Science. 2010;327:689–693. doi: 10.1126/science.1181766. [DOI] [PMC free article] [PubMed] [Google Scholar]
- 8.Cox R, et al. Structural studies on the authentic mumps virus nucleocapsid showing uncoiling by the phosphoprotein. Proceedings of the National Academy of Sciences. 2014;111:15208–15213. doi: 10.1073/pnas.1413268111. [DOI] [PMC free article] [PubMed] [Google Scholar]
- 9.Gutsche I, et al. Near-atomic cryo-EM structure of the helical measles virus nucleocapsid. Science. 2015 doi: 10.1126/science.aaa5137. aaa5137. [DOI] [PubMed] [Google Scholar]
- 10.Bharat TAM, et al. Cryo-Electron Tomography of Marburg Virus Particles and Their Morphogenesis within Infected Cells. PLoS Biol. 2011;9:e1001196. doi: 10.1371/journal.pbio.1001196. [DOI] [PMC free article] [PubMed] [Google Scholar]
- 11.Bharat TAM, et al. Structural dissection of Ebola virus and its assembly determinants using cryo-electron tomography. Proceedings of the National Academy of Sciences. 2012 doi: 10.1073/pnas.1120453109. 201120453. [DOI] [PMC free article] [PubMed] [Google Scholar]
- 12.Beniac DR, et al. The Organisation of Ebola Virus Reveals a Capacity for Extensive, Modular Polyploidy. PLoS ONE. 2012;7:e29608. doi: 10.1371/journal.pone.0029608. [DOI] [PMC free article] [PubMed] [Google Scholar]
- 13.Bakker SE, et al. The respiratory syncytial virus nucleoprotein-RNA complex forms a left-handed helical nucleocapsid. The Journal of General Virology. 2013;94:1734–1738. doi: 10.1099/vir.0.053025-0. [DOI] [PMC free article] [PubMed] [Google Scholar]
- 14.Noda T, Hagiwara K, Sagara H, Kawaoka Y. Characterization of the Ebola virus nucleoprotein–RNA complex. Journal of General Virology. 2010;91:1478–1483. doi: 10.1099/vir.0.019794-0. [DOI] [PMC free article] [PubMed] [Google Scholar]
- 15.Huang Y, Xu L, Sun Y, Nabel GJ. The Assembly of Ebola Virus Nucleocapsid Requires Virion-Associated Proteins 35 and 24 and Posttranslational Modification of Nucleoprotein. Molecular Cell. 2002;10:307–316. doi: 10.1016/S1097-2765(02)005889. [DOI] [PubMed] [Google Scholar]
- 16.Dziubańska PJ, Derewenda U, Ellena JF, Engel DA, Derewenda ZS. The structure of the C-terminal domain of the Zaire ebolavirus nucleoprotein. Acta Crystallographica Section D Biological Crystallography. 2014;70:2420–2429. doi: 10.1107/S1399004714014710. [DOI] [PMC free article] [PubMed] [Google Scholar]
- 17.Leung Daisy W, et al. An Intrinsically Disordered Peptide from Ebola Virus VP35 Controls Viral RNA Synthesis by Modulating Nucleoprotein-RNA Interactions. Cell Reports. 2015;11:376–389. doi: 10.1016/j.celrep.2015.03.034. [DOI] [PMC free article] [PubMed] [Google Scholar]
- 18.Dong S, et al. Insight into the Ebola virus nucleocapsid assembly mechanism: crystal structure of Ebola virus nucleoprotein core domain at 1.8 Å resolution. Protein & Cell. 2015:1–12. doi: 10.1007/s13238-015-0163-3. [DOI] [PMC free article] [PubMed] [Google Scholar]
- 19.Kirchdoerfer RN, Abelson DM, Li S, Wood MR, Saphire EO. Assembly of the Ebola virus nucleoprotein from a chaperoned VP35 complex. Cell reports. 2015;12:140–149. doi: 10.1016/j.celrep.2015.06.003. [DOI] [PMC free article] [PubMed] [Google Scholar]
- 20.Ruigrok RW, Crépin T, Kolakofsky D. Nucleoproteins and nucleocapsids of negative-strand RNA viruses. Current Opinion in Microbiology. 2011;14:504–510. doi: 10.1016/j.mib.2011.07.011. [DOI] [PubMed] [Google Scholar]
- 21.Noda T, Aoyama K, Sagara H, Kawaoka Y. Nucleocapsid-like structures of Ebola virus reconstructed using electron tomography. Journal of veterinary medical science. 2005;67:325–328. doi: 10.1292/jvms.67.325. [DOI] [PubMed] [Google Scholar]
- 22.Zhang APP, et al. The ebolavirus VP24 interferon antagonist. Virulence. 2012;3:440–445. doi: 10.4161/viru.21302. [DOI] [PMC free article] [PubMed] [Google Scholar]
- 23.Zhang APP, et al. The Ebola Virus Interferon Antagonist VP24 Directly Binds STAT1 and Has a Novel, Pyramidal Fold. PLoS Pathog. 2012;8:e1002550. doi: 10.1371/journal.ppat.1002550. [DOI] [PMC free article] [PubMed] [Google Scholar]
- 24.Leung DW, et al. Structure of the Ebola VP35 interferon inhibitory domain. Proceedings of the National Academy of Sciences. 2009;106:411–416. doi: 10.1073/pnas.0807854106. [DOI] [Google Scholar]
- 25.Leung DW, et al. Structural basis for dsRNA recognition and interferon antagonism by Ebola VP35. Nat Struct Mol Biol. 2010;17:165–172. doi: 10.1038/nsmb.1765. [DOI] [PMC free article] [PubMed] [Google Scholar]
- 26.Schur FKM, et al. An atomic model of HIV-1 capsid-SP1 reveals structures regulating assembly and maturation. Science. 2016;353:506–508. doi: 10.1126/science.aaf9620. [DOI] [PubMed] [Google Scholar]
- 27.Mastronarde DN. Automated electron microscope tomography using robust prediction of specimen movements. Journal of Structural Biology. 2005;152:36–51. doi: 10.1016/j.jsb.2005.07.007. [DOI] [PubMed] [Google Scholar]
- 28.Hagen WJH, Wan W, Briggs JAG. Implementation of a cryo-electron tomography tilt-scheme optimized for high resolution subtomogram averaging. Journal of Structural Biology. 2017;197:191–198. doi: 10.1016/j.jsb.2016.06.007. [DOI] [PMC free article] [PubMed] [Google Scholar]
- 29.Li X, et al. Electron counting and beam-induced motion correction enable near atomic resolution single particle cryoEM. Nature methods. 2013;10:584–590. doi: 10.1038/nmeth.2472. [DOI] [PMC free article] [PubMed] [Google Scholar]
- 30.Rohou A, Grigorieff N. CTFFIND4: Fast and accurate defocus estimation from electron micrographs. Journal of Structural Biology. 2015;192:216–221. doi: 10.1016/j.jsb.2015.08.008. [DOI] [PMC free article] [PubMed] [Google Scholar]
- 31.Grant T, Grigorieff N. Measuring the optimal exposure for single particle cryo-EM using a 2.6 Å reconstruction of rotavirus VP6. eLife. 2015:e06980. doi: 10.7554/eLife.06980. [DOI] [PMC free article] [PubMed] [Google Scholar]
- 32.Xiong Q, Morphew MK, Schwartz CL, Hoenger AH, Mastronarde DN. CTF determination and correction for low dose tomographic tilt series. Journal of structural biology. 2009;168:378–387. doi: 10.1016/j.jsb.2009.08.016. [DOI] [PMC free article] [PubMed] [Google Scholar]
- 33.Kremer JR, Mastronarde DN, McIntosh JR. Computer Visualization of Three-Dimensional Image Data Using IMOD. Journal of Structural Biology. 1996;116:71–76. doi: 10.1006/jsbi.1996.0013. [DOI] [PubMed] [Google Scholar]
- 34.Pruggnaller S, Mayr M, Frangakis AS. A visualization and segmentation toolbox for electron microscopy. Journal of Structural Biology. 2008;164:161–165. doi: 10.1016/j.jsb.2008.05.003. [DOI] [PubMed] [Google Scholar]
- 35.Nickell S, et al. TOM software toolbox: acquisition and analysis for electron tomography. Journal of Structural Biology. 2005;149:227–234. doi: 10.1016/j.jsb.2004.10.006. [DOI] [PubMed] [Google Scholar]
- 36.Förster F, Medalia O, Zauberman N, Baumeister W, Fass D. Retrovirus envelope protein complex structure in situ studied by cryo-electron tomography. Proceedings of the National Academy of Sciences of the United States of America. 2005;102:4729–4734. doi: 10.1073/pnas.0409178102. [DOI] [PMC free article] [PubMed] [Google Scholar]
- 37.Castaño-Díez D, Kudryashev M, Arheit M, Stahlberg H. Dynamo: A flexible, user-friendly development tool for subtomogram averaging of cryo-EM data in high-performance computing environments. Journal of Structural Biology. 2012;178:139–151. doi: 10.1016/j.jsb.2011.12.017. [DOI] [PubMed] [Google Scholar]
- 38.Frangakis AS, et al. Identification of macromolecular complexes in cryoelectron tomograms of phantom cells. Proceedings of the National Academy of Sciences. 2002;99:14153–14158. doi: 10.1073/pnas.172520299. [DOI] [PMC free article] [PubMed] [Google Scholar]
- 39.Pettersen EF, et al. UCSF Chimera—a visualization system for exploratory research and analysis. Journal of computational chemistry. 2004;25:1605–1612. doi: 10.1002/jcc.20084. [DOI] [PubMed] [Google Scholar]
- 40.Chen S, et al. High-resolution noise substitution to measure overfitting and validate resolution in 3D structure determination by single particle electron cryomicroscopy. Ultramicroscopy. 2013;135:24–35. doi: 10.1016/j.ultramic.2013.06.004. [DOI] [PMC free article] [PubMed] [Google Scholar]
- 41.Rosenthal PB, Henderson R. Optimal Determination of Particle Orientation, Absolute Hand, and Contrast Loss in Single-particle Electron Cryomicroscopy. Journal of Molecular Biology. 2003;333:721–745. doi: 10.1016/j.jmb.2003.07.013. [DOI] [PubMed] [Google Scholar]
- 42.Emsley P, Lohkamp B, Scott WG, Cowtan K. Features and development of Coot. Acta Crystallographica Section D: Biological Crystallography. 2010;66:486–501. doi: 10.1107/S0907444910007493. [DOI] [PMC free article] [PubMed] [Google Scholar]
- 43.Trabuco LG, Villa E, Schreiner E, Harrison CB, Schulten K. Molecular dynamics flexible fitting: A practical guide to combine cryo-electron microscopy and X-ray crystallography. Methods. 2009;49:174–180. doi: 10.1016/j.ymeth.2009.04.005. [DOI] [PMC free article] [PubMed] [Google Scholar]
- 44.Phillips JC, et al. Scalable molecular dynamics with NAMD. Journal of computational chemistry. 2005;26:1781–1802. doi: 10.1002/jcc.20289. [DOI] [PMC free article] [PubMed] [Google Scholar]
- 45.Edwards MR, et al. The Marburg virus VP24 protein interacts with Keap1 to activate the cytoprotective antioxidant response pathway. Cell reports. 2014;6:1017–1025. doi: 10.1016/j.celrep.2014.01.043. [DOI] [PMC free article] [PubMed] [Google Scholar]
Associated Data
This section collects any data citations, data availability statements, or supplementary materials included in this article.
Supplementary Materials
Data Availability Statement
Subtomogram averaging structures and representative tomograms for Ebola NP 1-450, Ebola NP-VP24-VP35-VP40, Ebola virus, and Marburg virus have been deposited in the Electron Microscopy Data Bank under accession numbers EMD-3869, EMD-3870, EMD-3871, EMD-3872, EMD-3873, EMD-3874, EMD-3875, and EMD-3876. Models for Ebola NP, and NP-VP24 have been deposited in the Protein Data Bank under accession numbers 6EHL and 6EHM.