

Abstract
We explored predictive factors of pseudoprogression (PsP) and its impact on prognosis in a retrospective series of uniformly treated glioblastoma patients. Patients were classified as having PsP, early progression (eP) or neither (nP). We examined potential associations with clinical, molecular, and basal imaging characteristics and compared overall survival (OS), progression‐free survival (PFS), post‐progression survival (PPS) as well as the relationship between PFS and PPS in the three groups. Of the 256 patients studied, 56 (21.9%) were classified as PsP, 70 (27.3%) as eP, and 130 (50.8%) as nP. Only MGMT methylation status was associated to PsP. MGMT methylated patients had a 3.5‐fold greater possibility of having PsP than eP (OR: 3.48; 95% CI: 1.606–7.564; P = 0.002). OS was longer for PsP than eP patients (18.9 vs. 12.3 months; P = 0.0001) but was similar for PsP and nP patients (P = 0.91). OS was shorter–though not significantly so—for PsP than nP patients (OS: 19.5 vs. 27.9 months; P = 0.63) in methylated patients. PPS was similar for patients having PsP, eP or nP (PPS: 7.2 vs. 5.4 vs. 6.7; P = 0.43). Neurological deterioration occurred in 64.3% of cases at the time they were classified as PsP and in 72.8% of cases of eP (P = 0.14). PsP confounds the evaluation of disease and does not confer a survival advantage in glioblastoma.
Keywords: Glioblastoma, IDH1 mutation, imaging, MGMT, pseudoprogression, radionecrosis
Introduction
Standard first‐line treatment for newly diagnosed glioblastoma is surgery followed by radiotherapy with concomitant and adjuvant temozolomide 1. Pseudoprogression (PsP) is a transient magnetic resonance imaging (MRI) pattern mimicking tumor progression but not necessarily accompanied by clinical deterioration. It occurs most frequently during the first 3 months after radiation therapy and improvement will usually occur within a few weeks or months. PsP is more frequent in patients treated with concomitant temozolomide than in those receiving radiation therapy alone 2, 3 and is particularly frequent in patients with O6‐methylguanine‐DNA methyltransferase (MGMT) promoter methylation (MGMT_MET) 4, 5. In spite of new and promising advanced MRI and PET‐based techniques 6, 7, 8, 9, 10, 11, 12, 13, PsP remains indistinguishable from early progression (eP). Since a final diagnosis can only be reached through histopathological verification or subsequent MRIs, PsP can confound treatment monitoring, with direct consequences in clinical practice, as it can lead to prematurely withholding adjuvant temozolomide or to overestimating the efficacy of a second‐line therapy. It is thus recommended to continue with adjuvant temozolomide for at least 3 months after concomitant therapy regardless of findings on the first post‐radiation evaluation. However, some patients experience neurological decline that precludes maintaining adjuvant temozolomide, while patients with true eP need to wait until the following evaluation instead of being switched immediately to another, potentially effective, treatment 2, 14.
There is thus a clear need for imaging, clinical or molecular markers to discriminate PsP from eP. In this study, we retrospectively examined pre‐treatment predictive factors of PsP among glioblastoma patients. In addition, we examined the potential impact of PsP on outcome and compared progression‐free survival (PFS), post‐progression survival (PPS) and overall survival (OS) in patients with PsP, eP, or neither (nP).
Methods
Patients
Figure 1 shows the flow of patients through the study. Between July 2004 and April 2015, the GLIOCAT project recruited 432 consecutive patients with glioblastoma from six institutions, all of whom had received the standard first‐line treatment. All patients were reviewed histologically to confirm the presence of astrocytic tumor with microvascular proliferation and/or necrosis. The 256 patients who had completed the concurrent treatment with radiotherapy and temozolomide and who had had their first MRI evaluation within 2 months after the completion of radiotherapy were selected for this retrospective substudy. This study was approved by the Ethics Committees of all the participating institutions. The investigators obtained informed consent of each participant or each participant's guardian to be included in the project.
Figure 1.
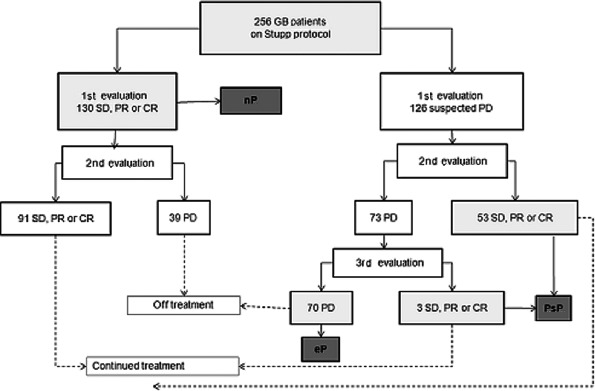
Consort diagram showing flow of patients through the study. SD, stable disease; PR, partial response; CR, complete response; PD, progressive disease; PsP, pseudoprogression; eP, early progression; nP, neither pseudoprogression nor early progression.
Disease progression was defined as MRI progression and/or clinical deterioration that led to stopping the planned first‐line therapy and changing to either best supportive care or second‐line therapy. Patients were classified in three groups: PsP, eP, or nP. Those who were diagnosed as having suspected progressive disease at their first evaluation but whose subsequent MRI evaluations (performed after the third and sixth cycle of adjuvant temozolomide) showed stable disease or partial or complete response were classified as PsP. Those whose first MRI evaluation showed a pattern indicating suspected progressive disease that was confirmed at subsequent evaluations were classified as eP. Those with progressive disease at the first evaluation, even if based only on neurological deterioration, but who stopped adjuvant temozolomide were also classified as eP. Finally, those whose first evaluation showed stable disease or partial or complete response and who continued treatment with adjuvant temozolomide with no worsening of disease at subsequent evaluations while on this treatment were classified as nP. After the first MRI evaluation, subsequent MRIs were performed after the third and sixth cycle of temozolomide.
The date of progression was the date of the first progression if subsequent MRI evaluations showed no improvement.
Baseline clinical, molecular, and imaging data
MGMT_MET was assessed by methylation‐specific PCR and isocitrate dehydrogenase 1 (IDH1) mutations by immunohistochemistry. Information was obtained on the date of progression, treatment after progression, and date of death or last control. Tumor imaging characteristics (size, location and eloquence)15 were evaluated on axial sections on pre‐surgical MRIs that were available to all radiologists through a shared platform. (See Table 1 for explanation.)
Table 1.
Characteristics of patients according to clinical factors and subgroup (PsP vs. eP vs. nP)
| Characteristic | All patients N = 256 N (%) | PsP N = 56 N (%) | eP N = 70 N (%) | nP N = 130 N (%) | P a |
|---|---|---|---|---|---|
| Age, years | 0.59 | ||||
| Median (range) | 61 (23–80) | 59 (28–77) | 62 (40–79) | 61 (23–80) | |
| <50 | 51 (19.9) | 12 (21.4) | 11 (17.5) | 28 (21.5) | |
| ≥50 | 205 (80.1) | 44 (78.6) | 59 (84.3) | 102 (78.5) | |
| Gender | 0.37 | ||||
| Male | 157 (61.3) | 33 (58.9) | 39 (55.7) | 85 (65.4) | |
| Female | 99 (38.7) | 23 (41.4) | 31 (44.3) | 45 (34.6) | |
| KPS | 0.52 | ||||
| 70–100 | 191 (74.6) | 40 (71.4) | 50 (71.4) | 101 (77.7) | |
| <70 | 65 (25.4) | 16 (28.6) | 20 (28.6) | 29 (22.3) | |
| Anticonvulsant drugs | 0.55 | ||||
| No | 136 (53.1) | 28 (50.0) | 41 (58.6) | 67 (51.5) | |
| Yes | 120 (46.9) | 28 (50.0) | 29 (41.4) | 63 (48.5) | |
| Type of surgery | 0.06 | ||||
| Complete resection | 36 (14.1) | 5 (8.9) | 5 (7.1) | 26 (20.0) | |
| Partial resection | 192 (75.0) | 46 (82.1) | 58 (82.9) | 88 (67.7) | |
| Biopsy only | 28 (10.9) | 5 (8.9) | 7 (10.0) | 16 (12.3) | |
| Post–op therapy | |||||
| Received 60 Gy | 253 (98.8) | 54 (96.4) | 69 (98.6) | 130 (100) | 0.11 |
| Completed concurrent TMZ | 243 (94.9) | 54 (96.4) | 64 (91.4) | 125 (96.2) | 0.24 |
| Median no. TMZ cycles (range) | 5 (1–20) | 6 (2–20) | 2 (1–5) | 6 (1–12) | – |
| MGMT methylationb | (N = 221) | (N = 50) | (N = 66) | (N = 105) | 0.005 |
| Methylated | 109 (49.3) | 34 (68.0) | 25 (37.9) | 50 (47.6) | |
| Unmethylated | 112 (50.7) | 16 (32.0) | 41 (62.1) | 55 (52.4) | |
| IDH1 mutationsb | (N = 162) | (N = 38) | (N = 49) | (N = 75) | 0.09 |
| Detected | 9 (5.5) | 2 (5.3) | 0 (0) | 7 (9.3) | |
| Not detected | 153 (94.5) | 36 (94.7) | 49 (100) | 68 (90.7) | |
| MMSE score | (N = 135) | (N = 32) | (N = 27) | (N = 76) | |
| <27 | 49 (19.1) | 15 (46.9) | 10 (37.0) | 24 (31.6) | |
| ≥27 | 86 (33.6) | 17 (53.1) | 17 (63.0) | 52 (68.4) | 0.32 |
| Dexamethasone dose at start of concurrent therapy | (N = 234) | (N = 53) | (N = 63) | (N = 118) | 0.01 |
| ≤2 mg | 63 (26.9) | 10 (18.9) | 11 (17.5) | 42 (35.6) | |
| >2 mg | 171 (73.1) | 43 (81.1) | 52 (82.5) | 76 (64.4) | |
| Dexamethasone stopped during concurrent therapy | 0.60 | ||||
| No | 222 (86.7) | 50 (89.3) | 62 (88.6) | 110 (84.6) | |
| Yes | 34 (13.3) | 6 (10.7) | 8 (11.4) | 20 (15.4) | |
| Tumor size T1 Gdc | (N = 194)c | (N = 41)c | (N = 49)c | (N = 104)c | 0.30 |
| ≤5 cm | 103 (53.1) | 25 (61.0) | 28 (57.1) | 50 (48.1) | |
| >5 cm | 91 (46.9) | 16 (39.0) | 21 (42.9) | 54 (51.9) | |
| Tumor size T2 Flairc | (N = 185)c | (N = 39)c | (N = 46)c | (N = 103) c | 0.91 |
| ≤5 cm | 32 (17.3) | 7 (17.9) | 7 (15.2) | 18 (18.0) | |
| >5 cm | 153 (82.7) | 32 (82.1) | 39 (84.8) | 85 (82.0) | |
| Tumor location T1 Gdc | (N = 194)c | (N = 41)c | (N = 49)c | (N = 104)c | 0.11 |
| Group A | 103 (53.1) | 18 (43.9) | 22 (44.9) | 63 (60.6) | |
| Group B | 72 (37.1) | 17 (41.5) | 24 (49.0) | 31 (29.8) | |
| Group C | 19 (9.8) | 6 (14.6) | 3 (61.1) | 10 (9.6) | |
| Tumor location T2 Flairc | (N = 184)c | (N = 40)c | (N = 56)c | (N = 98)c | 0.35 |
| Group A | 87 (47.3) | 17 (42.5) | 17 (37.0) | 53 (54.1) | |
| Group B | 65 (35.3) | 16 (40.0) | 20 (43.5) | 29 (29.6) | |
| Group C | 32 (17.4) | 7 (17.5) | 9 (19.6) | 16 (16.3) | |
| Eloquence T1 Gdc | (N = 193)c | (N = 41)c | (N = 48)c | (N = 104)c | 0.16 |
| No | 138 (71.5) | 28 (68.3) | 30 (62.5) | 80 (76.9) | |
| Yes | 55 (28.5) | 13 (31.7) | 18 (37.5) | 24 (23.1) | |
| Eloquence T2 Flairc | (N = 188)c | (N = 40)c | (N = 47)c | (N = 101)c | 0.11 |
| No | 124 (66.0) | 25 (62.5) | 26 (55.3) | 73 (72.3) | |
| Yes | 64 (34.0) | 15 (37.5) | 21 (44.7) | 28 (27.7) | |
PsP, pseudoprogression; eP, early progression; nP, neither pseudoprogression nor early progression; KPS, Karnofsky performance status; TMZ, temozolomide; MMSE, Mini Mental State Examination. Percentages are given over the number of patients with available data.
P‐values are given for comparison of the distribution of variables in the three subgroups of patients (PsP vs. eP v.s nP). The analyses comparing the distribution of variables between PsP and eP showed no significant differences between the groups except for MGMT methylation (P = 0.001).
Among the 109 patients with MGMT methylation, 34 (31.2%) were classified as PsP, 25 (22.9%) as eP, and 50 (45.9%) as nP. Of the 112 patients without MGMT methylation, 16 (14.3%) were classified as PsP, 41 (36.6%) as eP, and 55 (52.4%) as nP. Among patients with PsP, 68% had MGMT methylation. Five patients were secondary GBM and had had previous surgery for low‐grade glioma. Only two of these patients had IDH1‐mutated tumors. Seven patients had IDH1‐mutated tumors without evidence of a previous diagnosis of a lower grade glioma.
Tumor size was measured on T1 enhanced sequences and on T2 Flair images. In the case of multiple enhanced lesions, the sum of the greatest diameters was estimated as a variable. Location was evaluated in three groups: group A tumors were located in the right cerebral hemisphere or left occipital lobe; group B tumors were located in the left frontal, parietal or temporal lobe; and group C tumors were located mainly in or partly extending to the thalamus, caudate nucleus and/or internal capsule. Tumors partly extending to the structures medial to the internal capsule, even if located mainly outside the midline structures, were classified as group C, together with other deep‐seated tumors and were considered as eloquent areas. Tumors in eloquent brain areas were those located in the sensorimotor cortex, language cortex, internal capsule, thalamus, corpus callosum, fornix, hypothalamus, and brain stem.
Statistical analyses
Categorical variables were compared with the χ 2 or Fisher's exact test. PFS was defined as the time from surgery to documented disease progression or death from any cause. PPS was defined as the time from confirmed progression to the last visit or death. OS was defined as the time from surgery to death from any cause. Patients who were still progression‐free or alive at the date of last contact were censored. Median PFS, PPS and OS were calculated with the Kaplan–Meier method and compared using the log‐rank test. The Cox proportional hazards model was used to calculate hazard ratios (HRs) with their 95% confidence intervals (CIs). The non‐parametric Kruskall–Wallis test or the Mann–Whitney U test, as appropriate, was used to compare the PFS‐PPS relationship among the patient groups. All statistical tests were two‐sided and significance was set at 0.05. All analyses were performed with SPSS v24.0 (IBM).
Literature search criteria
We performed an NCBI Pubmed search for articles published in English before March 2017 to identify publications on Pseudoprogression or Radionecrosis. Using the key words “pseudoprogression AND glioblastoma’’ and “radionecrosis AND glioblastoma’’, we had 770 and 220 hits, respectively. We then selected publications reporting data on patients and reviews that focused on “imaging”, “MGMT”, “IDH mutations”, “surgery”, “clinical characteristics”, “clinical outcome”, and “differential diagnosis”. Finally, we selected 130 publications for review and cited the ones most relevant to our study in our manuscript.
Results
Patient characteristics are shown in Table 1. Fifty‐six patients (21.9%) were classified as PsP, 70 (27.3%) as eP, and 130 (50.8%) as nP (Fig. 1).
There were significant differences in MGMT_MET status among the three patient groups (P = 0.005), between PsP and eP patients (P = 0.001), and between PsP and nP patients (P = 0.02). Patients with MGMT_MET had a 3.5‐fold greater possibility of having PsP rather than eP (odds ratio [OR]: 3.48; 95% CI: 1.606–7.564; P = 0.002).
Significant differences in dexamethasone dose (P = 0.01) and a trend toward differences in type of surgery (P = 0.06) and in IDH1 mutation status (P = 0.09) were also observed among the three patient groups. There were no differences among the three patient groups of patients in tumor size, tumor location or the eloquence of adjacent brain, as measured by T1 Gd or T2 Flair sequences (details in Table 1).
Overall survival
With a median follow‐up of 17.0 months (range: 10.7–24.5), age ≤50 years, complete resection, MGMT_MET, and IDH1 mutations were associated with longer OS. Patients with eP had shorter OS (12.3 months) than those with PsP (18.9 months) or nP (19.7 months) (P < 0.001). There were no significant differences between those with PsP and those with nP (P = 0.91).
Among patients with MGMT_MET, those with nP had longer OS than those with PsP, although this difference was not significant (27.9 vs. 19.5 months). Among patients without MGMT_MET, OS was similar for patients with PsP and those with nP (17.9 vs. 17.5 months) (Table S1).
Post‐progression treatment and PPS
At the time of analysis, 245 patients had relapsed after first‐line treatment. Treatments at relapse, including hospice care, were similar across the three patient subgroups. Neurological deterioration—either alone or with MRI progression—occurred in 64.3% of cases at the time they were classified as PsP and in 72.8% of cases of eP, while imaging progression with no neurological deterioration was observed in 30.4% of patients with PsP and in 22.9% of those with eP (P = 0.02) (Table S2).
After progression, PPS was similar for all patients whatever response to first‐line therapy (P = 0.43) or methylation status were (P = 0.35) (Figure S1). Among patients with MGMT_MET, PPS was 7.9 months for those with PsP, 3.1 months for those with eP, and 7.3 months for those with nP (P = 0.17). PsP was not better than nP regarding PFS (P = 0.81) or PPS (P = 0.92) even when analyzed by MGMT status (Table 2).
Table 2.
Progression‐free survival and post‐progression survival
| N | PFS (mo) | 95% CI | P | N | PPS (mo) | 95% CI | P | |
|---|---|---|---|---|---|---|---|---|
| All patients | 256 | 8.5 | 8.1–9.0 | 245 | 6.7 | 5.4–8.1 | ||
| PsP vs. all other patients | 0.01 | 0.78 | ||||||
| PsP | 56 | 10.5 | 10.0–11.1 | 53 | 7.2 | 5.2–9.2 | ||
| eP + nP | 200 | 7.8 | 7.2–8.5 | 192 | 6.7 | 4.9–8.6 | ||
| PsP vs. nP | 0.81 | 0.92 | ||||||
| PsP | 56 | 10.5 | 10.0–11.1 | 53 | 7.2 | 5.2–9.2 | ||
| nP | 130 | 10.4 | 9.0–11.8 | 122 | 6.7 | 5.0–8.6 | ||
| PsP vs. eP vs. nP | 0.0001 | 0.43 | ||||||
| PsP | 56 | 10.5 | 10.0–11.1 | 53 | 7.2 | 5.2–9.2 | ||
| eP | 70 | 5.3 | 5.0–5.7 | 70 | 5.4 | 1.0–9.9 | ||
| nP | 130 | 10.4 | 9.0–11.8 | 122 | 6.7 | 5.0–8.6 | ||
| MGMT status | 0.0001 | 0.35 | ||||||
| Methylated | 109 | 8.8 | 7.3–10.3 | 101 | 6.7 | 5.0–8.5 | ||
| Unmethylated | 112 | 8.2 | 7.4–9.0 | 109 | 7.0 | 4.7–9.3 | ||
| Subanalysis among patients with MGMT methylation | ||||||||
| PsP vs. nP | 0.35 | 0.96 | ||||||
| PsP | 34 | 10.3 | 6.9–13.7 | 33 | 7.9 | 6.0–9.9 | ||
| nP | 50 | 13.9 | 8.8–19.0 | 43 | 7.3 | 4.4–10.2 | ||
| PsP vs. eP vs. nP | 0.0001 | 0.17 | ||||||
| PsP | 34 | 10.3 | 6.9–13.7 | 33 | 7.9 | 6.0–9.9 | ||
| eP | 25 | 5.5 | 5.0–6.1 | 25 | 3.1 | 0.8–5.6 | ||
| nP | 50 | 13.9 | 8.8–19.0 | 43 | 7.3 | 4.4–10.2 | ||
| Subanalysis among patients without MGMT methylation | ||||||||
| PsP vs. nP | 0.23 | 0.67 | ||||||
| PsP | 16 | 10.5 | 10.1–11.0 | 14 | 6.4 | 1.2–11.7 | ||
| nP | 55 | 9.7 | 7.9–11.5 | 54 | 6.8 | 3.5–10.1 | ||
| PsP vs. eP vs. nP | 0.0001 | 0.71 | ||||||
| PsP | 16 | 10.5 | 10.1–11.0 | 14 | 6.4 | 1.2–11.7 | ||
| eP | 41 | 5.5 | 4.9–6.1 | 41 | 7.8 | 4.3–11.4 | ||
| nP | 55 | 9.7 | 7.9–11.5 | 54 | 6.8 | 3.5–10.1 | ||
PPS, post‐progression survival; PsP, pseudoprogression; PFS, progression‐free survival
Some patients classified as eP had long PPS after second‐line therapy (Fig. 2A–C). Though it seemed logical to hypothesize that patients with shorter PFS would also have shorter PPS, this was not always the case. Differences in this pattern were significant when comparing PsP versus eP versus nP (P = 0.009), PsP versus eP (P = 0.01), and eP versus nP (P = 0.006), but not when comparing PsP and nP. Among patients without MGMT_MET, these differences were maintained to a certain extent for eP versus nP (P = 0.04) but not in other cases. Among patients with MGMT_MET, there were no differences between patients classified as eP and those classified as PsP or nP.
Figure 2.

Relationship between PFS and PPS in (A) all patients, (B) patients without MGMT methylation (MGMT_MET), and (C) patients with MGMT_MET. P‐values are given for the comparison of the relationship between PFS and PPS. pfs, progression‐free survival; PPS, post‐progression survival
Discussion
We have reviewed our series of patients in order to identify predictive factors for PsP and found that MGMT_MET patients had a 3.5‐fold greater possibility of having PsP than eP. In consistent with previous reports 4, 5, 16, 17, none of the IDH1‐mutated patients had eP (see Table 1)and patients undergoing gross total resection showed a trend toward a lower probability of having either PsP or eP. To the best of our knowledge, this is the first study to examine the potential association between imaging baseline tumor characteristics (size, location or eloquence) and PsP. However, none of these characteristics was associated with either PsP or eP (Table 1).
Previous studies have reported PsP in 12‐50% of patients 18, 19, 20, 21 although when applying only strict MRI imaging criteria, the incidence can be as low as 11.4% 22. Neurological decline accompanied PsP in 64.3% of our patients and was not useful for distinguishing PsP and eP. Since neurological decline takes months to stabilize and may preclude continuing with temozolomide, it is likely a major reason for the high interest in PsP 23.
Our findings on outcome confirm previous reports 4, 19, 20, 23 that patients with PsP have longer OS than those with eP but not than those with nP.
Confounding factors in the evaluation of progression are PsP, late PsP and radionecrosis. Although radionecrosis is considered a late adverse event 24, 25, it can also overlap in time with PsP. PsP has been observed later than the first 3 months post‐radiotherapy 10, 18, 22, 26 and radionecrosis has been found in surgical specimens immediately after radiotherapy 27, 28. Radionecrosis is pathologically defined 24 and a mixed pattern of viable tumor and radionecrosis can be found in PsP 29, 30. Clinically, both PsP and radionecrosis can be accompanied by cognitive and neurological decline that can stabilize or reverse 2, 4, 23, 31. The primary risk factor for radionecrosis is total radiation dose, fraction size and irradiated volume; it rarely appears at doses lower than 50 Gy and standard fractions of 1.8–2.0 Gy 30, 32. Chemotherapy increases the risk of both radionecrosis and PsP 25. The higher incidence of PsP in patients with MGMT_MET could be explained by the rationale for combining temozolomide with radiotherapy, based on preclinical data suggesting additive or synergistic activity 33.
A limitation of the study is that our findings are based on retrospective data not subjected to a pre‐specified periodicity of disease evaluations. The only prospective study published in 2008 did not compare post‐progression outcomes and did not take into account late PsP or radionecrosis as confounding factors 4. Our study brings up the current existing dilemma when evaluating the disease: some of our patients classified as eP who had relatively long PPS on second‐line therapy could well have had a PsP, and those who progressed later than 3 months post‐radiotherapy could well have had late PsP or radionecrosis 10, 22, 26 since no pathological diagnosis was obtained. All these confounding factors may explain the difference in the patterns shown in Figure 2, especially considering the limited efficacy of treatments for recurrent disease.
According to our results, PsP (and radionecrosis) should be considered confounding factors and undesired adverse events of concomitant therapy rather than indications of treatment efficacy. Consequently, we suggest they should be reported as such in clinical trials exploring alternative radiotherapy doses and fractions combined with chemotherapy 34, 35, 36. Moreover, we could speculate that it would also be of interest to investigate a reduction in total radiation dose to reduce the risk of PsP especially in patients with MGMT_MET.
Conflict of Interest
Authors state they do not have any conflict of interest.
Supporting information
Table S1. Overall survival according to clinical and molecular characteristics.
Table S2. Type of progression and second‐line therapies according to subgroup of patients (PsP vs. eP vs. nP).
Figure S1. Post‐progression survival for patients classified as PsP, eP, or nP.
Acknowledgments
This work was supported by Fundació La Marató TV3 (Project 665/C/2013) (http://www.ccma.cat/tv3/marato/projectes-financats/2012/231/). The MRI imaging platform is supported by the citizens’ initiative “Montgat en Acció”. No grant number is applicable. The funding sources had no role in the study design; in the collection, analysis and interpretation of data; in the writing of the report; or in the decision to submit the article for publication. The authors thank the biobanks of participating institutions: Fundació Institut Mar d'Investigacions Mèdiques, Institut d'Investigacions Biomèdiques August Pi i Sunyer (IDIBAPS), Institut d'Investigació en Ciències de la Salut Germans Trias i Pujol (IGTP), Fundació Institut de Recerca de l'Hospital de la Santa Creu i St. Pau (IIB Sant Pau), Institut d'Investigacio Biomèdica de Bellvitge (IDIBELL), Institut d'Investigació Biomèdica de Girona Dr. Josep Trueta (IDIBGI) and the Xarxa de Bancs de Tumors sponsored by Pla Director d'Oncologia de Catalunya (XBTC).
Cancer Medicine 2017; 6(12):2858–2866
References
- 1. Stupp, R. , Mason W. P., van den Bent M. J., Weller M., Fisher B., Taphoorn M. J., et al. 2005. Radiotherapy plus concomitant and adjuvant temozolomide for glioblastoma. N. Engl. J. Med. 352:987–996. [DOI] [PubMed] [Google Scholar]
- 2. Taal, W. , Brandsma D., de Bruin H. G., Bromberg J. E., Swaak‐Kragten A. T., Smitt P. A., et al. 2008. Incidence of early pseudo‐progression in a cohort of malignant glioma patients treated with chemoirradiation with temozolomide. Cancer 113:405–410. [DOI] [PubMed] [Google Scholar]
- 3. Brandsma, D. , Stalpers L., Taal W., Sminia P., and van den Bent M. J.. 2008. Clinical features, mechanisms, and management of pseudoprogression in malignant gliomas. Lancet Oncol. 9:453–461. [DOI] [PubMed] [Google Scholar]
- 4. Brandes, A. A. , Franceschi E., Tosoni A., Blatt V., Pession A., Tallini G., et al. 2008. MGMT promoter methylation status can predict the incidence and outcome of pseudoprogression after concomitant radiochemotherapy in newly diagnosed glioblastoma patients. J. Clin. Oncol. 26:2192–2197. [DOI] [PubMed] [Google Scholar]
- 5. Park, C. K. , Kim J., Yim S. Y., Lee A. R., Han J. H., Kim C. Y., et al. 2011. Usefulness of MS‐MLPA for detection of MGMT promoter methylation in the evaluation of pseudoprogression in glioblastoma patients. Neuro Oncol. 13:195–202. [DOI] [PMC free article] [PubMed] [Google Scholar]
- 6. Tsien, C. , Galban C. J., Chenevert T. L., Johnson T. D., Hamstra D. A., Sundgren P. C., et al. 2010. Parametric response map as an imaging biomarker to distinguish progression from pseudoprogression in high‐grade glioma. J. Clin. Oncol. 28:2293–2299. [DOI] [PMC free article] [PubMed] [Google Scholar]
- 7. Snelling, B. , Shah A. H., Buttrick S., and Benveniste R.. 2017. The Use of MR Perfusion Imaging in the Evaluation of Tumor Progression in Gliomas. J. Korean Neurosurg. Soc. 60:15–20. [DOI] [PMC free article] [PubMed] [Google Scholar]
- 8. Choi, Y. J. , Kim H. S., Jahng G. H., Kim S. J., and Suh D. C.. 2013. Pseudoprogression in patients with glioblastoma: added value of arterial spin labeling to dynamic susceptibility contrast perfusion MR imaging. Acta Radiol. 54:448–454. [DOI] [PubMed] [Google Scholar]
- 9. Suh, C. H. , Kim H. S., Choi Y. J., Kim N., and Kim S. J.. 2013. Prediction of pseudoprogression in patients with glioblastomas using the initial and final area under the curves ratio derived from dynamic contrast‐enhanced T1‐weighted perfusion MR imaging. AJNR Am. J. Neuroradiol. 34:2278–2286. [DOI] [PMC free article] [PubMed] [Google Scholar]
- 10. Nasseri, M. , Gahramanov S., Netto J. P., Fu R., Muldoon L. L., Varallyay C., et al. 2014. Evaluation of pseudoprogression in patients with glioblastoma multiforme using dynamic magnetic resonance imaging with ferumoxytol calls RANO criteria into question. Neuro. Oncol. 16:1146–1154. [DOI] [PMC free article] [PubMed] [Google Scholar]
- 11. Chen, X. , Wei X., Zhang Z., Yang R., Zhu Y., and Jiang X.. 2015. Differentiation of true‐progression from pseudoprogression in glioblastoma treated with radiation therapy and concomitant temozolomide by GLCM texture analysis of conventional MRI. Clin. Imaging 39:775–780. [DOI] [PubMed] [Google Scholar]
- 12. Galldiks, N. , Dunkl V., Stoffels G., Hutterer M., Rapp M., Sabel M., et al. 2015. Diagnosis of pseudoprogression in patients with glioblastoma using O‐(2‐[18F]fluoroethyl)‐L‐tyrosine PET. Eur. J. Nucl. Med. Mol. Imaging 42:685–695. [DOI] [PubMed] [Google Scholar]
- 13. Wang, S. , Martinez‐Lage M., Sakai Y., Chawla S., Kim S. G., Alonso‐Basanta M., et al. 2016. Differentiating Tumor Progression from Pseudoprogression in Patients with Glioblastomas Using Diffusion Tensor Imaging and Dynamic Susceptibility Contrast MRI. AJNR Am. J. Neuroradiol. 37:28–36. [DOI] [PMC free article] [PubMed] [Google Scholar]
- 14. Wen, P. Y. , Macdonald D. R., Reardon D. A., Cloughesy T. F., Sorensen A. G., Galanis E., et al. 2010. Updated response assessment criteria for high‐grade gliomas: response assessment in neuro‐oncology working group. J. Clin. Oncol. 28:1963–1972. [DOI] [PubMed] [Google Scholar]
- 15. Shinoda, J. , Sakai N., Murase S., Yano H., Matsuhisa T., and Funakoshi T.. 2001. Selection of eligible patients with supratentorial glioblastoma multiforme for gross total resection. J. Neurooncol. 52:161–171. [DOI] [PubMed] [Google Scholar]
- 16. Park, H. H. , Roh T. H., Kang S. G., Kim E. H., Hong C. K., Kim S. H., et al. 2016. Pseudoprogression in glioblastoma patients: the impact of extent of resection. J. Neurooncol. 126:559–566. [DOI] [PubMed] [Google Scholar]
- 17. Motegi, H. , Kamoshima Y., Terasaka S., Kobayashi H., Yamaguchi S., Tanino M., et al. 2013. IDH1 mutation as a potential novel biomarker for distinguishing pseudoprogression from true progression in patients with glioblastoma treated with temozolomide and radiotherapy. Brain Tumor Pathol. 30:67–72. [DOI] [PubMed] [Google Scholar]
- 18. Kruser, T. J. , Mehta M. P., and Robins H. I.. 2013. Pseudoprogression after glioma therapy: a comprehensive review. Expert Rev. Neurother. 13:389–403. [DOI] [PubMed] [Google Scholar]
- 19. Roldan, G. B. , Scott J. N., McIntyre J. B., Dharmawardene M., de Robles P. A., Magliocco A. M., et al. 2009. Population‐based study of pseudoprogression after chemoradiotherapy in GBM. Canadian J. Neurol Sci. 36:617–622. [DOI] [PubMed] [Google Scholar]
- 20. Sanghera, P. , Perry J., Sahgal A., Symons S., Aviv R., Morrison M., et al. 2010. Pseudoprogression following chemoradiotherapy for glioblastoma multiforme. Canadian J. Neurol. Sci. 37:36–42. [DOI] [PubMed] [Google Scholar]
- 21. Van Mieghem, E. , Wozniak A., Geussens Y., Menten J., De Vleeschouwer S., Van Calenbergh F., et al. 2013. Defining pseudoprogression in glioblastoma multiforme. Eur. J. Neurol. 20:1335–1341. [DOI] [PubMed] [Google Scholar]
- 22. Radbruch, A. , Fladt J., Kickingereder P., Wiestler B., Nowosielski M., Baumer P., et al. 2015. Pseudoprogression in patients with glioblastoma: clinical relevance despite low incidence. Neuro. Oncol. 17:151–159. [DOI] [PMC free article] [PubMed] [Google Scholar]
- 23. Gunjur, A. , Lau E., Taouk Y., and Ryan G.. 2011. Early post‐treatment pseudo‐progression amongst glioblastoma multiforme patients treated with radiotherapy and temozolomide: a retrospective analysis. J. Med. Imaging Radiat. Oncol. 55:603–610. [DOI] [PubMed] [Google Scholar]
- 24. Parvez, K. , Parvez A., and Zadeh G.. 2014. The diagnosis and treatment of pseudoprogression, radiation necrosis and brain tumor recurrence. Int. J. Mol. Sci. 15:11832–11846. [DOI] [PMC free article] [PubMed] [Google Scholar]
- 25. Ruben, J. D. , Dally M., Bailey M., Smith R., McLean C. A., and Fedele P.. 2006. Cerebral radiation necrosis: incidence, outcomes, and risk factors with emphasis on radiation parameters and chemotherapy. Int. J. Radiat. Oncol. Biol. Phys. 65:499–508. [DOI] [PubMed] [Google Scholar]
- 26. Kebir, S. , Fimmers R., Galldiks N., Schafer N., Mack F., Schaub C., et al. 2015. Late Pseudoprogression in Glioblastoma: Diagnostic Value of Dynamic O‐(2‐[18F]fluoroethyl)‐L‐Tyrosine PET. Clin. Cancer Res. 22:98. [DOI] [PubMed] [Google Scholar]
- 27. Chamberlain, M. C. , Glantz M. J., Chalmers L., Van Horn A., and Sloan A. E.. 2007. Early necrosis following concurrent Temodar and radiotherapy in patients with glioblastoma. J. Neurooncol. 82:81–83. [DOI] [PubMed] [Google Scholar]
- 28. Yaman, E. , Buyukberber S., Benekli M., Oner Y., Coskun U., Akmansu M., et al. 2010. Radiation induced early necrosis in patients with malignant gliomas receiving temozolomide. Clin. Neurol. Neurosurg. 112:662–667. [DOI] [PubMed] [Google Scholar]
- 29. Melguizo‐Gavilanes, I. , Bruner J. M., Guha‐Thakurta N., Hess K. R., and Puduvalli V. K.. 2015. Characterization of pseudoprogression in patients with glioblastoma: is histology the gold standard? J. Neurooncol. 123:141–150. [DOI] [PMC free article] [PubMed] [Google Scholar]
- 30. Rusthoven, K. E. , Olsen C., Franklin W., Kleinschmidt‐DeMasters B. K., Kavanagh B. D., Gaspar L. E., et al. 2011. Favorable prognosis in patients with high‐grade glioma with radiation necrosis: the University of Colorado reoperation series. Int. J. Radiat. Oncol. Biol. Phys. 81:211–217. [DOI] [PubMed] [Google Scholar]
- 31. Lawrence, Y. R. , Li X. A., el Naqa I., Hahn C. A., Marks L. B., Merchant T. E., et al. 2010. Radiation dose‐volume effects in the brain. Int. J. Radiat. Oncol. Biol. Phys. 76(3 Suppl):S20–S27. [DOI] [PMC free article] [PubMed] [Google Scholar]
- 32. Blonigen, B. J. , Steinmetz R. D., Levin L., Lamba M. A., Warnick R. E., and Breneman J. C.. 2010. Irradiated Volume as a Predictor of Brain Radionecrosis After Linear Accelerator Stereotactic Radiosurgery. Int. J. Radiat. Oncol. Biol. Phys. 77:996–1001. [DOI] [PubMed] [Google Scholar]
- 33. Wedge, S. R. , Porteous J. K., Glaser M. G., Marcus K., and Newlands E. S.. 1997. In vitro evaluation of temozolomide combined with X‐irradiation. Anticancer Drugs 8:92–97. [DOI] [PubMed] [Google Scholar]
- 34. Azoulay, M. , Santos F., Souhami L., Panet‐Raymond V., Petrecca K., Owen S., et al. 2015. Comparison of radiation regimens in the treatment of Glioblastoma multiforme: results from a single institution. Radiat. Oncol. 10:106. [DOI] [PMC free article] [PubMed] [Google Scholar]
- 35. Tsien, C. I. , Brown D., Normolle D., Schipper M., Piert M., Junck L., et al. 2012. Concurrent temozolomide and dose‐escalated intensity‐modulated radiation therapy in newly diagnosed glioblastoma. Clin. Can. Res. 18:273–279. [DOI] [PMC free article] [PubMed] [Google Scholar]
- 36. Guedes de Castro, D. , Matiello J., Roa W., Ghosh S., Kepka L., Kumar N., et al. 2017. Survival Outcomes With Short‐Course Radiation Therapy in Elderly Patients With Glioblastoma: Data From a Randomized Phase 3 Trial. Int. J. Radiat. Oncol. Biol. Phys. 98:931–938. [DOI] [PubMed] [Google Scholar]
Associated Data
This section collects any data citations, data availability statements, or supplementary materials included in this article.
Supplementary Materials
Table S1. Overall survival according to clinical and molecular characteristics.
Table S2. Type of progression and second‐line therapies according to subgroup of patients (PsP vs. eP vs. nP).
Figure S1. Post‐progression survival for patients classified as PsP, eP, or nP.