

Abstract
An Airbus A340 aircraft flew over Northern Australia with the In‐Flight Lightning Damage Assessment System (ILDAS) installed onboard. A long‐duration gamma ray emission was detected. The most intense emission was observed at 12 km altitude and lasted for 20 s. Its intensity was 20 times the background counts, and it was abruptly terminated by a distant lightning flash. In this work we reconstruct the aircraft path and event timeline. The glow‐terminating flash triggered a discharge from the aircraft wing that was recorded by a video camera operating onboard. Another count rate increase was observed 6 min later and lasted for 30 s. The lightning activity as reported by ground networks in this region was analyzed. The measured spectra characteristics of the emission were estimated.
Keywords: gamma ray, glow, lightning, ILDAS, aircraft
Key Points
Two gamma ray glows were observed at 12 km altitude over Northern Australia
The observation was conducted by the In‐flight Lightning Damage Assessment System (ILDAS)
Gamma ray glow was terminated by a distant lightning flash
1. Introduction
A gamma ray glow is a long‐lasting X‐ray and gamma radiation generated in thunderclouds. They last from seconds to several minutes and are usually explained by continuous relativistic runaway electron avalanche (RREA) process (Gurevich et al., 1992). They have been detected from airplanes, balloons, and ground. However, the experimental evidence is scarce due to difficulties in performing in situ measurements; ground observations require extreme caution due to radon and its daughters. While some investigators reported spectra consistent with RREA, others documented background‐like energies.
The first airborne observations of such glows were presented by Parks and McCarthy in (Parks et al., 1981; McCarthy & Parks, 1985). The NaI scintillating detectors were flown on a NASA F‐106 jet in a thunderstorm environment. Up to fortyfold increases in gamma ray flux were reported, lasting for several seconds in 5 to 110 keV photon energy range. The glows were detected at 3 and 9 km altitudes. It was shown for the first time that glows can be terminated by lightning possibly due to a rapid discharging of the thundercloud electric field.
Later, Eack et al. conducted balloon campaigns where they also detected long‐lasting gamma ray enhancements at altitudes of 4 and 15 km (Eack et al., 1996a, 1996b). A greater than threefold increase in the gamma ray flux was reported at 14 km altitude in the 60–300 keV energy range (Eack et al., 2000). They showed a positive correlation between this glow and a strong electric field region in the cloud.
The Airborne Detector for Energetic Lightning Emissions (ADELE) recorded 12 gamma ray glows (Kelley et al., 2015). They lasted from 4 to 112 s. For 11 glows their duration was consistent with the motion of the aircraft through the active thundercloud but not the brightest one. The brightest glow was 20 times brighter than the others and had similar features to the glow reported in McCarthy and Parks (1985), that is, double‐peak structure, abrupt termination, and a small “second bump” before the termination. Its first peak was explained as positron annihilation and “the plane discharging itself” without further explanation. The glow lasted for 4 s and was terminated simultaneously with a lightning flash. Evidence of positron annihilation in thunderclouds was also presented in Dwyer et al. (2015).
Besides the glows, only one Terrestrial Gamma Ray Flash (TGF) was detected during the ADELE's nine flights (Smith et al., 2011a), suggesting that they are a rarer phenomenon than the gamma ray glows (Smith et al., 2011b). Most of the weak glows reported in Figures 4.3 and 4.4 in Kelley (2014) are questionable without precise compensation for altitude background variations. The altitude correction was done by linear fit from 10 km to 14.5 km aircraft cruise altitude. But the altitude variation inside active thunderstorm cell can be significant. See, for example, measurements inside thunderclouds in Kochkin et al. (2015) (Figure 6). However, most of the glows reported by ADELE were not detected inside thunderclouds but close by.
Long gamma ray glows are routinely observed from ground (Brunetti et al., 2000; Chubenko et al., 2000; Torii et al., 2002, 2009; Tsuchiya et al., 2007), often accompanied by neutrons (Chilingarian, Bostanjyan, et al., 2012; Chilingarian et al., 2010; Gurevich et al., 2012; Kuroda et al., 2016; Tsuchiya et al., 2012). When observed with enhanced fluxes of electrons and/or neutrons, they are called Thunderstorm Ground Enhancements (TGEs). The assumed primary source of TGEs is Extensive Air Showers caused by Cosmic Rays which are modified and enhanced by the thundercloud electric field. The mechanism of the modification is the above mentioned RREA. But Chilingarian introduces yet another explanation to TGE origin: “RRE avalanches responsible for very rare huge particle multiplication in the thunderclouds (up to 1000%) and Modification Of the energy Spectra (MOS) process—responsible for much often but small and modest (less than 10%) TGEs” (Chilingarian, Mailyan, et al., 2012).
The measured glow spectra are often consistent with RREA mechanism (Babich et al., 2010; Tsuchiya et al., 2007). The same mechanism is generally accepted for TGFs, when developing more rapidly on submillisecond time scale. A remarkable observation is published in Chilingarian et al. (2013), namely, the more intense the TGE, the softer its spectrum (see Table 1 and Figure 15). Authors conclude that this proves the existence of MOS mechanism. MOS mechanism does not accelerate electrons and hence different from RREA. High‐energy electrons with energies above few tens of MeV cannot run away and accelerate due to catastrophic energy losses via Bremsstrahlung. However, they can obtain additional energy from the ambient electric field. Their energy spectrum modifies, thus enlarging their life time. Accordingly, the probability of emitting Bremsstrahlung gamma rays is increasing.
In this manuscript we report gamma ray glows detected from an A340 aircraft at 12 km altitude over Northern Australia. Data from ground‐based lightning location networks were synchronized with the data obtained on board with the measured 15 ms precision. It is shown how a distant lightning discharge terminates the glow and triggers another discharge from the aircraft. We mapped the aircraft path on a cloud temperature map and reconstructed the events timeline using onboard video camera. At the end we present the measured spectrum and discuss the possible physical mechanisms behind the glows.
2. Instrument and Data
In January 2016 an Airbus A340 factory test aircraft conducted intentional thunderstorm‐penetrating flights. The starting base was at Darwin Airport in Australia. The aircraft was equipped with a dedicated In‐Flight Lightning Damage Assessment System called ILDAS. The system was developed by The Netherlands Aerospace Centre (NLR, www.ildas.nlr.nl) in cooperation with 12 partners, including Eindhoven University of Technology. Its main goals are to measure lightning strike parameters, to determine entry and exit points on the aircraft structure, and to assess the possible structural damage. It was comprehensively described in a series of publications (de Boer et al., 2011; Hervé et al., 2014; Stelmashuk et al., 2008, 2007; van Deursen, 2011; van Deursen & Stelmashuk, 2011; Zwemmer et al., 2009). The ILDAS system was extended with two LaBr3 40 × 40 mm2 cylindrical scintillation detectors. The first results of in‐flight measurements of energetic radiation from lightning and thunderclouds were published in Kochkin et al. (2015) based on flights conducted over Mediterranean region at 4 km altitude. Many X‐ray bursts were detected in association with lightning recoil strokes, but no long‐lasting radiation enhancements over the background were observed.
The ILDAS system contains one electric field sensor (E field) and eight magnetic field window sensors (H field). Photographs of the system and operational details can be found in Kochkin et al. (2015) and van Deursen (2011). Both sensors are differentiating, and subsequent analog integration provides a flat response over the frequency band from 100 Hz to 10 MHz for H field and 10 Hz to 500 kHz for E field. The sampling rate for both sensors is 83.3 MS s−1, which corresponds to 12 ns time resolution. The E field sensors is a capacitive probe attached to a window. It measures the local electric field and mostly serves as a trigger source for the system. The chosen polarity of the sensor is such that it generates positive signal when electric field lines are pointed toward it. The absolute value of the signal is of less interest and should not be confused with the ambient electric field in a cloud.
Modifications were made to the so‐called continuous data file (CDF) algorithm that was used during trials in Europe. Instead of counting the number of samples below certain voltage level as described in Kochkin et al. (2015), the new CDF algorithm is now operating as a spectrometer. It counts and stores the number of X‐ray pulses per 15 ms in six individual energy channels for each detector. The channels are shown in section 3.3. The X‐ray detectors were calibrated after the campaign during on‐ground data processing using the internal LaBr3 radioactivity.
In the present campaign, in addition to ILDAS, a video camera was installed on board in the frame of another research project. The camera was monitoring the right wing at a rate of 25 frames per second.
To locate the observed events, we used data from two ground‐based lightning location networks. One is the global World Wide Lightning Location Network (WWLLN); another is a local Australian network LIAS (acronym for the Lighting Incident Archive Search) operated by The Global Position and Tracking Systems Pty. Ltd. WWLLN location accuracy is taken as 5 km radius over Australia (Rodger et al., 2004). The LIAS network claims 250–500 m accuracy for their data, usually reports more flashes, and provides additional data regarding their class, polarity, and peak current. The data from these networks presented in this manuscript should not be in any sense used for comparison between the networks.
The thundercloud top height (CTH) was obtained by comparing the cloud top temperature given by the 11 μm infrared data from the Himawari‐8 satellite (HIMAWARI, 2017) with the reconstructed troposphere vertical profile, as predicted by the European Centre for Medium‐Range Weather Forecasts. For the region and the time of interest, a thermal gradient with slope −6.6°/km and soil temperature of 32°C was obtained, corresponding to an altitude > 15 km for cloud top temperatures below −70°C.
3. Results
On 15 January 2016 the aircraft performed a 4 h test flight. On two occasions the radiation level inside the cabin exceeded the expected background level. At these moments the aircraft was penetrating into two thundercloud regions at 12 km cruise altitude. Figure 1 shows a part of the actual aircraft path mapped on top of the infrared HIMAWARI satellite image. The image had been taken 5 min before the first glow was detected. This corresponds to 60 km traveled distance for the aircraft. The image color bar is indicated on the right side in degrees Celsius. The red regions with temperature below −70° correspond to the CTH > 15 km. Two clearly separated cloud regions are visible on the map. The aircraft path was reconstructed with a few hundred meters accuracy. It was inside the clouds when both glows were registered.
Figure 1.

The infrared HIMAWARI satellite map taken 5 min before the first glow. Temperature bar is indicated on the right side in degrees Celsius. The red regions with t≤−70° correspond to the Cloud Top Height CTH≥15 km. Two cloud regions are clearly separated. The WWLLN sferics (squares) are shown from 5 min before the first glow to 5 min after the second. Regions where the glows were detected are indicated.
The WWLLN sferics from 5 min before the first glow (synchronous with the HIMAWARI temperature map) to 5 min after the second glow are also mapped. The glows were detected near the most active lightning regions. The lightning activity, as reported by WWLLN, before and after the glows in the corresponding regions did not change dramatically. The lightning rate per minute in the associated cloud before and after the first glow was 17.4 and 16.4, respectively. The second glow was not terminated by lightning, so the lightning activity is expect to be similar before and after. The lightning rate was 14.8 flashes per minute before and 16.4 after the second glow detection. Neither number of flashes nor lightning spatial distribution was significantly different before and after the glows.
The flight duration between the two glows is 6:20 min that corresponds to 88 km traveled distance at 233 m/s cruise speed. The linear distance between the two glows is 70 km. The aircraft traveled 4.6 km inside the first glow and 7 km inside the second.
Figure 2 shows the electric field profile and the total X‐ray counts recorded by ILDAS continuous data file (CDF) algorithm. All X‐ray pulses with energy higher than 60 keV for X14 and 100 keV for X15 are counted. The data are binned in 15 ms intervals. The E field data are stored as E max and E min, the maximum and minimum values during this interval. It can be seen that the aircraft was near intensive electrical activity before 07:37:00, then flew into electrically silent region between two clouds from 07:37:00 to 07:40:30, and finally approached and penetrated into the second cloud at 07:40:30.
Figure 2.

The (top) electric field profile and (bottom) total X‐ray counts as recorded by CDF algorithm (spectrometer). The first glow was detected at 7:36 UTC and lasted for 20 s. The second glow was detected at 7:42 UTC and lasted for 30 s. The low electrical activity between 7:37 and 7:41 UTC corresponds to the aircraft transfer from one cloud to another.
The first gamma ray glow was stronger than the second. The mean background number of counts before the first glow was 3.2 ± 1.9 per 15 ms for X14 and 2.6 ± 1.6 for X15. The difference is due to the different energy channels as will be discussed in section 4. During the first glow, the total counts increased to 63.5 ± 8.6 (32σ) for X14 and 40.3 ± 6.3 (24σ) for X15. The second glow shows nearly 3σ increase for both detectors. The statistics is shown in Table 1.
Table 1.
X‐ray Counts per 15 ms Before and During the Gamma Ray Glows
| Before glow 1 | Glow 1 peak | Before glow 2 | Glow 2 peak | |
|---|---|---|---|---|
| X14 | 3.2 ± 1.9 | 63.5 ± 8.6 | 2.9 ± 1.7 | 8.5 ± 3.4 |
| X15 | 2.6 ± 1.6 | 40.3 ± 6.3 | 2.3 ± 1.6 | 6.6 ± 2.6 |
3.1. First Gamma Ray Glow
Figure 3 shows the first gamma ray glow. It was detected at 07:35:35 UTC. The aircraft speed was 233 m/s at 12.1 km cruise altitude. It traveled 4.6 km distance while being exposed to the glow radiation for 20 s. The aircraft already passed the glow peak intensity when the glow was abruptly terminated by a lightning flash. Gaussian fit to the glow intensity indicates that it would have lasted for another 10 s if not interrupted. Since the glow was not terminated at its maximum detected intensity, its profile is likely to have been determined by the aircraft movement rather than glow's intrinsic dynamics.
Figure 3.

The same as Figure 2 but zoomed on the first glow. The glow starts at 07:35:35 and lasts for 20 s. It is abruptly terminated by a lightning flash at 07:35:56 UTC. About 10 WWLLN and 15 LIAS sferics were reported during the glow. The ILDAS was triggered twice and recorded two 1 s long intervals in high‐resolution mode. They are indicated as 805D0DA4 and 005D11F5. Their precise timing is also shown.
The ILDAS system was triggered twice during the plotted period. The original ILDAS trigger codes 805D0DA4 and 005D11F5 are informative for data processing. Each of these triggers contains 1 s recordings of all sensors sampled with 10 and 12 ns intervals. Their precise moments are indicated in the figure.
The WWLLN and LIAS sferics are indicated in Figure 3 (top) as vertical dashed lines. The WWLLN sferic #3 is coincident with the glow termination moment within a 15 ms time bin. At the same moment LIAS reported three flashes #4,5,6 nearly simultaneously. They were identified as negative strokes with −29.1, −49, and 0 kA peak current, respectively. Zero current means cloud‐to‐cloud or intercloud lightning. The lightning flash rate in nearby regions just before and during the glow was roughly 1 flash per 6 s. Hence, the probability that the lightning was coincidentally detected at the glow‐terminating moment by chance is 0.015/6 = 0.0025. Another flash was reported synchronously with one of the E field pulses. It is WWLLN #8 and LIAS #13.
In Figure 4 the WWLLN and LIAS sferics locations are mapped. The glow‐terminating flash is detected by WWLLN at 24 km distance (square #3). LIAS reported the same flash only 8 km away (circle #4). These flashes, or flash, apparently triggered a sequence of another discharges (WWLLN spherics #4‐7 and LIAS #7‐12).
Figure 4.

The WWLLN (squares) and LIAS (circles) sferics detected during the first gamma ray glow. Their time is indicated in Figure 3 (top). The WWLLN position uncertainty is shown as a dashed 5 km radius circle around flash #3. WWLLN #3 and LIAS #4,5,6 interrupted the glow and triggered ILDAS. WWLLN #8 and LIAS #13 are 45 km away but were also detected and triggered ILDAS.
The ILDAS strike with the code 805D0DA4 captured the glow‐terminating moment. Data of E00 electric field sensor, H13 magnetic field window sensor, and both X‐ray detectors are shown in Figure 5. The electromagnetic (EM) pulse at t = 0 does not match any classified triggered or intercepted lightning discharges (Kochkin et al., 2015; Mazur & Ruhnke, 1998; Moreau et al., 1992; Uman & Rakov, 2003). This means that the aircraft was not attached to the lightning leader directly. The EM pulse was induced by the distant lightning flash reported by WWLLN and LIAS. However, the induced pulse was strong enough to trigger a discharge from the right wing of the aircraft, as will be shown below. Individual X‐ray pulses were recorded with 10 ns resolution but binned here in 15 ms intervals for better visualization and comparison with CDF data. Their intensity rapidly drops to background level after the EM pulse. A small current pulse through the aircraft was also detected at t = 0.
Figure 5.

The glow‐terminating flash as detected by ILDAS in high‐resolution mode with the code 805D0DA4. X‐ray counts are binned in 15 ms intervals. The X‐ray intensity is higher before the electromagnetic (EM) pulse at t = 0 then after it.
Figure 6 zooms on the induced EM pulse. The E field profile neither corresponds to aircraft‐triggered nor to aircraft‐intercepted lightning discharges. A negative leader characteristic current signature is present synchronously with the pulse peak. The maximum surface current density through the cabin is 67 A/m, which corresponds to 1.4 kA and is a small portion of the peak current of the initial strike reported by LIAS (−29.1 and −49 kA). The current pattern obtained from all window sensors suggests a scenario when current flows to the right wing from mostly tail and also nose and left wing. This means a positive leader initiation from the right wing and negative apparently from the tail. A video recording confirms the observation.
Figure 6.
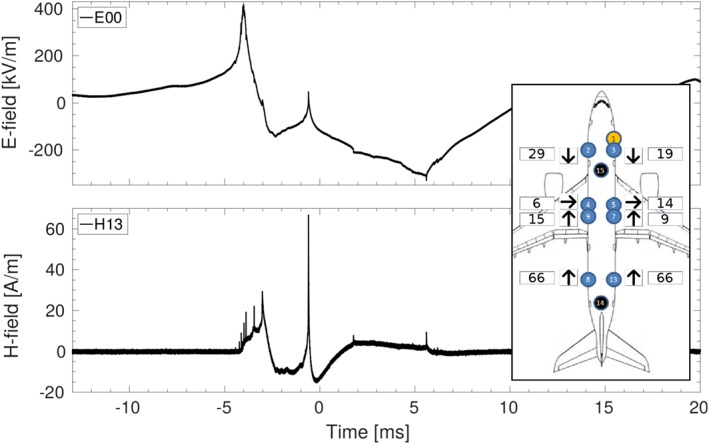
The zoomed version of the EM pulse shown in Figure 5. Characteristic negative stepped leader signature is present at t =− 4 ms. Current pattern flowing through the aircraft at t =− 0.1 ms is indicated in the inset. Numbers are in A/m. The pattern corresponds to a scenario when a positive leader initiates from the right wing.
Figure 7 shows a video frame from an onboard camera monitoring the right wing. The frame time moment is marked as 07:35:55.760 UTC which is consistent with the ILDAS and ground network reports (as shown in Figure 3). A lightning leader channel is attached to the wing edge. It is pointed toward the aircraft nose (to the left), away from the glow‐terminating flash. A faint trace behind the wing tip going to opposite direction (to the right) is also visible. In the video it only appears at the moment of the leader formation. This means that it is not only a wingtip vortex but also ionization of the vortex's channel of reduced pressure and temperature.
Figure 7.

The video frame shows a leader channel attached to the right wing. The frame is taken at t = 07:35:55.760 UTC. A lightning leader is attached to the wing and pointed toward the nose. Ionization of the wingtip vortex is visible going along the aircraft path.
The second ILDAS trigger 005D11F5 is plotted in Figure 8. It was also caused by a distant lightning flash. Its sferic (WWLLN #8, LIAS #13) is located 45 km away from the aircraft. LIAS reported it as a negative CG flash with −34.3 kA peak amplitude. Three EM pulses were recorded by ILDAS, each synchronously with a current pulse. The current pulses lasted for 20 μs each. The E field pattern does not match any classified triggered or aircraft‐intercepted lightning flash. It also differs from the glow‐terminating EM pulse shown in Figure 6. The X‐ray count rate did not exceed the background level during this trigger.
Figure 8.

The second ILDAS trigger 005D11F5 caused by a distant lightning flash. Only background X‐ray counts are registered. There is no significant current through the aircraft, only brief 20 μs pulses synchronously with the corresponding EM pulse.
3.2. Second Glow
The second gamma ray flux enhancement was detected at 07:42:00 UTC. It lasted for 30 s and was less intense than the first one. Neither was it abruptly terminated. It is likely that it kept glowing after the aircraft left the region. Figure 9 shows the ILDAS data. The X‐ray count rate has a double Gaussian profile, which may reflect the E field region structure inside the cloud or its temporal dynamics. The associated lightning sferics are mapped in Figure 10. As observed with the first glow, the aircraft was passing a region of high lightning activity. The closest reported flash is LIAS #14. The distance to it was 11 km and peak current −22.4 kA. However, ILDAS was not triggered at this time. In opposite to the first glow, the electrical activity as recorded by E field sensor was much lower.
Figure 9.

The second gamma ray glow. It starts at 07:42:00 and lasts for 30 s till 07:42:30 UTC. The vertical dashed lines are WWLLN and LIAS sferics. Some of them are numbered. Their locations are indicated in Figure 10. ILDAS was not triggered during this glow.
Figure 10.

The WWLLN (squares) and LIAS (circles) spherics detected during second gamma ray glow. The WWLLN location uncertainty is shown as dashed oval around flash #2.
3.3. Spectrum
The ILDAS continuously counts X‐ray pulses in six energy channels for each detector. The channels are listed in Table 2. X‐ray pulses are binned in 15 ms intervals and stored in so‐called continuous data files (CDFs). This provides spectral information over the entire flight, in addition to individual X‐ray pulses that are recorded in triggered mode with 10 ns resolution.
Table 2.
X‐ray Energy Channels in MeV
| CH1 | CH2 | CH3 | CH4 | CH5 | CH6 | |
|---|---|---|---|---|---|---|
| X14 | 0.06–0.17 | 0.17–0.29 | 0.29–0.40 | 0.40–5.70 | 5.70–17.10 | >17.10 |
| X15 | 0.10–0.21 | 0.21–0.31 | 0.31–0.42 | 0.42–10.40 | 10.40–20.80 | >20.80 |
Figure 11 shows a spectrogram of the glow period. The spectra of the two X‐ray detectors are plotted together. Their energy channels are overlapping and are indicated on the left axes. Time is arbitrary and binned in 1 s intervals. Logarithmic number of particles is color coded and normalized on energy bin size. The first glow appears at t = 270 s relative time. The second glow appears 380 s later. Two more spectrum modifications can be visible after t = 800 s. Their intensity does not exceed 1σ of the background count rate.
Figure 11.

The spectrogram of the glow period binned in 1 s intervals. The first glow is visible at t = 270 s and the second at t = 650s. Two more spectra modifications can be seen after 800 s. Logarithmic number of particles is color coded. Energy channels are indicated on Y axis.
Figure 12 shows the measured spectra at the peak of the first glow and 10 s after it. Both X‐ray detectors are plotted together, since their relative distance to the glow is unclear. As will be shown below, the attenuation by air between them will not affect the count rate by more than 20%. The measured spectra are fitted to power law function dN/dE = N 0·E −λ. The spectral index λ equals to 1.8 for the first glow and 1.3 for the background.
Figure 12.

The measured spectrum of the first glow at its maximum compared to the background spectrum 10 s later. Dashed lines show power law fit dN/dE = N 0·E −λ. The spectral index λ for the glow is 1.8 and 1.3 for the background.
4. Discussion
In 1996, (Eack et al., 1996a) reported balloon observations of gamma ray glows at 4 km height. Most of the ILDAS previous campaigns were conducted in Europe at this altitude (Kochkin et al., 2015). However, statistically significant gamma ray enhancements over the background level were not observed. One of the reasons is that the glows at higher altitudes can be observed at greater distance due to less attenuation of gamma rays. So the aircraft can approach glow region to sufficient proximity without distracting it. The glows can also be more frequent or brighter at high altitudes.
It cannot be excluded that the observed radiation enhancement was created by a local discharge activity at or near the aircraft. Before detecting the first glow, the aircraft flew out of an active thundercloud where its surface was probably charged. At the exit moment the aircraft strongly polarizes, which leads to corona or long spark formation on its sharp edges. As was shown in many high‐voltage laboratories even meter‐long discharges can generate X‐rays in the observed energy range (Dwyer et al., 2005; Kochkin et al., 2012, 2014; Nguyen et al., 2008, March & Montanyá, 2010, 2011; Rahman et al., 2008). The fact that it was terminated by remote lightning strike is not surprising. The lightning triggered a discharge from the right wing, which removed the surface charges and terminated the corona and spark activity. Monitoring all sharp extremities of the aircraft during a gamma ray glow is sufficient to test these hypotheses.
The existence of long‐duration gamma ray emission from thunderclouds has been proven experimentally by different observational platforms. The glow parameters and dynamics discussed here are consistent with those previously reported. So the most plausible mechanism is the charged particles acceleration in the high electric field regions inside thunderclouds. Remarkably, as can be seen from Figure 5, the X‐ray flux started to decrease before the EM pulse. This may indicate that the glow was not terminated by lightning but rather collapsed and initiated a lightning strike.
It has been shown in Kelley (2014) that lightning activity is suppressed after a gamma ray glow. The glow is considered as a cloud discharging mechanism; hence, the amount of lightning flashes should decrease in nearby region. On the other side, it might be because the glows can only appear when lightning activity has declined. As was reported above, we cannot confirm these hypotheses, mainly because of the low lightning flash rate. The flash rate or the detection efficiency was several times higher in Kelley (2014) than in this work.
At the moment of the first glow detection the number of X‐ray counts is higher in X14 than in X15. The count ratio is approximately constant with time and equals to N X14/N X15=1.9 ± 0.3. From 80 to 90% of this value is due to the difference in energy channels. While X15 counts all photons with energies higher than 100 keV, X14 does it from 60 keV. The remaining 10–20% can be explained by attenuation in the air. According to the National Institute of Standards and Technology (NIST), it is 50% attenuation for 30 m of air at 50 keV energy and 40% attenuation at 100 keV energy. The cabin pressure and temperature were kept standard (STP) during the flight.
5. Conclusions
The observations of long‐duration gamma ray emission from thunderclouds were presented. Two glows were detected over Northern Australia region at 12 km altitude. Their durations were 20 and 30 s. In both cases the duration is determined by the aircraft movement and not by internal glow dynamics. The first glow was abruptly terminated by a distant lightning flash or collapsed and initiated a lightning strike. This is consistent with previously formulated assumption that glows are created by high E field regions inside thunderclouds. However, we cannot explicitly rule out the possibility of local discharge activity at the aircraft. A detailed particle simulation is needed to test the possible underlying mechanism and physical properties of the glows, that is, spectrum and intensity.
Supporting information
Supporting Information S1
Data Set S1
Data Set S2
Acknowledgments
This work was supported by the European Research Council under the European Union's Seventh Framework Program (FP7/2007‐2013)/ERC grant agreement 320839 and the Research Council of Norway under contracts 208028/F50 and 223252/F50 (CoE). Authors appreciate the help of Rich Mills from Airbus UK in revising the manuscript. The glow data presented in this paper were uploaded as supporting information and also available from the authors upon request (pavlo.kochkin@uib.no).
Kochkin, P. , van Deursen, A. P. J. , Marisaldi, M. , Ursi, A. , de Boer, A. I. , Bardet, M. ,… Østgaard, N. (2017). In‐flight observation of gamma ray glows by ILDAS. Journal of Geophysical Research: Atmospheres, 122, 12,801–12,811. https://doi.org/10.1002/2017JD027405
References
- Babich, L. P. , Bochkov, E. I. , Donskoi, E. N. , & Kutsyk, I. M. (2010). Source of prolonged bursts of high‐energy gamma rays detected in thunderstorm atmosphere in Japan at the coastal area of the sea of Japan and on high mountaintop. Journal of Geophysical Research, 115, A09317 https://doi.org/10.1029/2009JA015017 [Google Scholar]
- Brunetti, M. , Cecchini, S. , Galli, M. , Giovannini, G. , & Pagliarin, A. (2000). Gamma‐ray bursts of atmospheric origin in the MeV energy range. Geophysical Research Letters, 27(11), 1599–1602. [Google Scholar]
- Chilingarian, A. , Bostanjyan, N. , & Vanyan, L. (2012). Neutron bursts associated with thunderstorms. Physical Review D, 85(8), 085017. [Google Scholar]
- Chilingarian, A. , Daryan, A. , Arakelyan, K. , Hovhannisyan, A. , Mailyan, B. , Melkumyan, L. ,… Vanyan, L. (2010). Ground‐based observations of thunderstorm‐correlated fluxes of high‐energy electrons, gamma rays, and neutrons. Physical Review D, 82(4), 043009. [Google Scholar]
- Chilingarian, A. , Mailyan, B. , & Vanyan, L. (2012). Recovering of the energy spectra of electrons and gamma rays coming from the thunderclouds. Atmospheric Research, 114, 1–16. [Google Scholar]
- Chilingarian, A. , Hovsepyan, G. , & Kozliner, L. (2013). Thunderstorm ground enhancements: Gamma ray differential energy spectra. Physical Review D, 88(7), 073001. [Google Scholar]
- Chubenko, A. , Antonova, V. , Kryukov, S. Y. , Piskal, V. , Ptitsyn, M. , Shepetov, A. ,… Gurevich, A. (2000). Intensive X‐ray emission bursts during thunderstorms. Physics Letters A, 275(1), 90–100. [Google Scholar]
- de Boer, A. I. , Bardet, M. , Escure, C. , Peres, G. , Srithammavanh, V. , Abboud, K. ,… van Deursen, A. P. J. (2011). In‐flight lightning damage assessment system (ILDAS): Initial in‐flight lightning tests and improvement of the numerical methods. In ICOLSE 2011 Oxford, UK: IEEE. [Google Scholar]
- Dwyer, J. , Rassoul, H. , Saleh, Z. , Uman, M. , Jerauld, J. , & Plumer, J. (2005). X‐ray bursts produced by laboratory sparks in air. Geophysical Research Letters, 32, L20809 https://doi.org/10.1029/2005GL024027 [Google Scholar]
- Dwyer, J. R. , Smith, D. M. , Hazelton, B. J. , Grefenstette, B. W. , Kelley, N. A. , Lowell, A. W. ,… Rassoul, H. K. (2015). Positron clouds within thunderstorms. Journal of Plasma Physics, 81(4), 475810405. [Google Scholar]
- Eack, K. B. , Beasley, W. H. , Rust, W. D. , Marshall, T. C. , & Stolzenburg, M. (1996a). Initial results from simultaneous observation of X‐rays and electric fields in a thunderstorm. Journal of Geophysical Research, 101(D23), 29,637–29,640. [Google Scholar]
- Eack, K. B. , Beasley, W. H. , Rust, W. D. , Marshall, T. C. , & Stolzenburg, M. (1996b). X‐ray pulses observed above a mesoscale convective system. Geophysical Research Letters, 23(21), 2915–2918. [Google Scholar]
- Eack, K. B. , Suszcynsky, D. M. , Beasley, W. H. , Roussel‐Dupre, R. , & Symbalisty, E. (2000). Gamma‐ray emissions observed in a thunderstorm anvil. Geophysical Research Letters, 27(2), 185–188. [Google Scholar]
- Gurevich, A. , Antonova, V. , Chubenko, A. , Karashtin, A. , Mitko, G. , Ptitsyn, M. ,… Zybin, K. P. (2012). Strong flux of low‐energy neutrons produced by thunderstorms. Physical Review Letters, 108(12), 125001. [DOI] [PubMed] [Google Scholar]
- Gurevich, A. , Milikh, G. , & Roussel‐Dupre, R. (1992). Runaway electron mechanism of air breakdown and preconditioning during a thunderstorm. Physics Letters A, 165(5‐6), 463–468. [Google Scholar]
- Hervé, A. , Peres, G. , De Boer, A. , Bardet, M. , Flourens, F. , & Boissin, J.‐F. (2014). In‐flight lightning damage assessment system (ILDAS): Diagnostic performance assessment with in‐fight lightning data. In 2014 International Symposium on Electromagnetic Compatibility (pp. 589–594). IEEE. [Google Scholar]
- HIMAWARI (2017). Cooperative institute for meteorological satellite studies. Retrieved from http://tropic.ssec.wisc. edu/archive/, Accessed May 31, 2017.
- Kelley, N. (2014). Long duration gamma‐ray emission from thunderclouds (PhD thesis). Santa Cruz: University of California. [Google Scholar]
- Kelley, N. A. , Smith, D. M. , Dwyer, J. R. , Splitt, M. , Lazarus, S. , Martinez‐McKinney, F. ,… Rassoul, H. K. (2015). Relativistic electron avalanches as a thunderstorm discharge competing with lightning. Nature Communications, 6, 7845. [DOI] [PubMed] [Google Scholar]
- Kochkin, P. , van Deursen, A. , & Ebert, U. (2014). Experimental study on hard X‐rays emitted from metre‐scale negative discharges in air. Journal of Physics D: Applied Physics, 48(2), 025205. [Google Scholar]
- Kochkin, P. , van Deursen, A. P. , de Boer, A. , Bardet, M. , & Boissin, J.‐F. (2015). In‐flight measurements of energetic radiation from lightning and thunderclouds. Journal of Physics D: Applied Physics, 48(42), 425202. [Google Scholar]
- Kochkin, P. O. , Nguyen, C. V. , van Deursen, A. P. J. , & Ebert, U. (2012). Experimental study of hard X‐rays emitted from metre‐scale positive discharges in air. Journal of Physics D: Applied Physics, 45(42), 425202 https://doi.org/10.1088/0022-3727/45/42/425202 [Google Scholar]
- Kuroda, Y. , Oguri, S. , Kato, Y. , Nakata, R. , Inoue, Y. , Ito, C. , & Minowa, M. (2016). Observation of gamma ray bursts at ground level under the thunderclouds. Physics Letters B, 758, 286–291. [Google Scholar]
- March, V. , & Montanyà, J. (2010). Influence of the voltage‐time derivative in X‐ray emission from laboratory sparks. Geophysical Research Letters, 37, L19801 https://doi.org/10.1029/2010GL044543 [Google Scholar]
- March, V. , & Montanyà, J. (2011). X‐rays from laboratory sparks in air: The role of the cathode in the production of runaway electrons. Geophysical Research Letters, 38, L04803 https://doi.org/10.1029/2010GL046540 [Google Scholar]
- Mazur, V. , & Ruhnke, L. H. (1998). Model of electric charges in thunderstorms and associated lightning. Journal of Geophysical Research, 103, 23,299–23,308. [Google Scholar]
- McCarthy, M. , & Parks, G. (1985). Further observations of X‐rays inside thunderstorms. Geophysical Research Letters, 12(6), 393–396. [Google Scholar]
- Moreau, J.‐P. , Alliot, J.‐C. , & Mazur, V. (1992). Aircraft lightning initiation and interception from in situ. Journal of Geophysical Research, 97(D14), 15–903. [Google Scholar]
- Nguyen, C. , Van Deursen, A. , & Ebert, U. (2008). Multiple X‐ray bursts from long discharges in air. Journal of Physics D: Applied Physics, 41(23), 234012. [Google Scholar]
- Parks, G. , Mauk, B. , Spiger, R. , & Chin, J. (1981). X‐ray enhancements detected during thunderstorm and lightning activities. Geophysical Research Letters, 8(11), 1176–1179. [Google Scholar]
- Rahman, M. , Cooray, V. , Ahmad, N. A. , Nyberg, J. , Rakov, V. A. , & Sharma, S. (2008). X rays from 80‐cm long sparks in air. Geophysical Research Letters, 35, L06805 https://doi.org/10.1029/2007GL032678 [Google Scholar]
- Rodger, C. , Brundell, J. , Dowden, R. , & Thomson, N. (2004). Location accuracy of long distance vlf lightning location network. Annales Geophysicae, 22, 747–758. [Google Scholar]
- Smith, D. , Dwyer, J. , Hazelton, B. , Grefenstette, B. , Martinez‐McKinney, G. , Zhang, Z. ,… Heckman, S. (2011a). A terrestrial gamma ray flash observed from an aircraft. Journal of Geophysical Research, 116, D20124 https://doi.org/10.1029/2011JD016252 [Google Scholar]
- Smith, D. , Dwyer, J. , Hazelton, B. , Grefenstette, B. , Martinez‐McKinney, G. , Zhang, Z. ,… Blakeslee, R. J. (2011b). The rarity of terrestrial gamma‐ray flashes. Geophysical Research Letters, 38, L08807 https://doi.org/10.1029/2011GL046875 [Google Scholar]
- Stelmashuk, V. , van Deursen, A. , & Zwemmer, R. (2007). Sensor development for the ILDAS project. In EMC Europe Workshop Paris. [Google Scholar]
- Stelmashuk, V. , van Deursen, A. , & Webster, M. (2008). Sensors for in‐flight lightning detection on aircraft. In 2008 International Symposium on Electromagnetic Compatibility‐EMC Europe (pp. 1–5). IEEE; [Google Scholar]
- Torii, T. , Takeishi, M. , & Hosono, T. (2002). Observation of gamma‐ray dose increase associated with winter thunderstorm and lightning activity. Journal of Geophysical Research, 107(D17), 4324 https://doi.org/10.1029/2001JD000938 [Google Scholar]
- Torii, T. , Sugita, T. , Tanabe, S. , Kimura, Y. , Kamogawa, M. , Yajima, K. , & Yasuda, H. (2009). Gradual increase of energetic radiation associated with thunderstorm activity at the top of Mt. Fuji. Geophysical Research Letters, 36, L13804 https://doi.org/10.1029/2008GL037105 [Google Scholar]
- Tsuchiya, H. , Enoto, T. , Yamada, S. , Yuasa, T. , Kawaharada, M. , Kitaguchi, T. ,… Makishima, K. (2007). Detection of high‐energy gamma rays from winter thunderclouds. Physical Review Letters, 99(16), 165002. [DOI] [PubMed] [Google Scholar]
- Tsuchiya, H. , Hibino, K. , Kawata, K. , Hotta, N. , Tateyama, N. , Ohnishi, M. ,… Makishima, K. (2012). Observation of thundercloud‐related gamma rays and neutrons in Tibet. Physical Review D, 85(9), 092006. [Google Scholar]
- Uman, M. , & Rakov, V. (2003). The interaction of lightning with airborne vehicles. Progress in Aerospace Sciences, 39(1), 61–81. [Google Scholar]
- van Deursen, A. P. J. (2011). Inductive sensor for lightning current measurement, fitted in aircraft windows—Part II: Measurements on an a320 aircraft. IEEE Sensors Journal, 11(1), 205–209. [Google Scholar]
- van Deursen, A. P. J. , & Stelmashuk, V. (2011). Inductive sensor for lightning current measurement, fitted in aircraft windows—Part I: Analysis for a circular window. IEEE Sensors Journal, 11(1), 199–204. [Google Scholar]
- Zwemmer, R. , Bardet, M. , de Boer, A. , Hardwick, J. , Hawkins, K. , Morgan, D. ,… Østgaard, N. (2009). In‐flight lightning damage assessment system (ILDAS): Results of the concept prototype tests. In International Conference on Lightning & Static Electricity, ICOLSE Pittsfield, MA: Citeseer. [Google Scholar]
Associated Data
This section collects any data citations, data availability statements, or supplementary materials included in this article.
Supplementary Materials
Supporting Information S1
Data Set S1
Data Set S2