

Abstract
Eukaryotic transcription-coupled repair (TCR), or transcription-coupled nucleotide excision repair (TC-NER), is an important and well-conserved sub-pathway of nucleotide excision repair (NER) that preferentially removes DNA lesions from the template strand blocking RNA polymerase II (Pol II) translocation1,2. Cockayne syndrome group B protein in humans (CSB, or ERCC6), or its yeast orthologs (Rad26 in Saccharomyces cerevisiae and Rhp26 in Schizosaccharomyces pombe), is among the first proteins to be recruited to the lesion-arrested Pol II during initiation of eukaryotic TCR1,3–10. Mutations in CSB are associated with Cockayne syndrome, an autosomal-recessive neurologic disorder characterized by progeriod features, growth failure, and photosensitivity1. The molecular mechanism of eukaryotic TCR initiation remains elusive, with several long-standing questions unanswered: How do cells distinguish DNA lesion-arrested Pol II from other forms of arrested Pol II? How does CSB interact with the arrested Pol II complex? What is the role of CSB in TCR initiation? The lack of structures of CSB or the Pol II-CSB complex have hindered our ability to answer those questions. Here we report the first structure of S. cerevisiae Pol II-Rad26 complex solved by cryo-electron microscopy (cryo-EM). The structure reveals that Rad26 binds to the DNA upstream of Pol II where it dramatically alters its path. Our structural and functional data suggest that the conserved Swi2/Snf2-family core ATPase domain promotes forward movement of Pol II and elucidate key roles for Rad26/CSB in both TCR and transcription elongation.
Pol II arrests at bulky, helix-distorting lesions are proposed to be the initiating signal for TCR1,2,9,11–13. However, a number of non-lesion obstacles can also lead to Pol II arrest13,14. How can cells distinguish among different forms of arrested Pol II and only commit those that encountered genuine DNA lesions to TCR? Given that CSB is among the first proteins to be recruited to arrested Pol II (Fig. 1a), we tested the ability of its S. cerevisiae ortholog (Rad26) (Fig. 1b and Extended Data Fig. 1) to discriminate among Pol II stalls/arrests in three representative scenarios: a non-damaged DNA containing an intrinsic pausing/arrest sequence15, a non-covalent DNA binder14, or a bulky covalent DNA lesion, a genuine TCR substrate16,17 (Fig. 1c-e). Pol II alone stalled at all three translocation barriers. Rad26 facilitated its bypassing the A-tract and Py-Im translocation barriers, but not the CPD lesion, consistent with a previous observation with human CSB16. An ATPase-dead Rad26 mutant (K328R) failed to rescue Pol II. In contrast to Rad26, the transcription factor TFIIS failed to rescue Pol II arrested by either Py-Im or a CPD lesion.
Figure 1. Rad26 helps Pol II discriminate among different transcription obstacles.

a, Rad26 is recruited to the stalled Pol II, leading to different outcomes. TS: Template Strand; NTS: Non-Template Strand. b, CSB orthologs share a conserved SWI2/SNF2-family ATPase core composed of two RecA-like lobes with the seven canonical Super Family 2 (SF2) helicase motifs (black bars). c-e, Transcription assays probing the ability of Rad26, Rad26 mutant, and TFIIS to discriminate among three representative transcription obstacles encountered by Pol II: A pause-inducing repetitive A-tract sequence (c); A sequence-specific DNA-binding polyamide (Py-Im) (d); and a TT cyclobutane pyrimidine dimer (CPD) DNA lesion (e). The asterisk in (c) represents a Pol II pausing site upstream of the A-tract sequence. Last lane in (e): full-length transcript in the absence of the CPD lesion. Experiments in c-e were repeated independently 3 times with similar results. For gel source data, see Supplementary Fig. 1.
Using single-particle cryo-EM, we determined a 5.8 Å structure of a S. cerevisiae Pol II EC-Rad26 complex (“Pol II-Rad26” hereafter), as well as a 6.4 Å structure of a Pol II EC from the same sample, and built pseudo-atomic models using Rosetta (see Methods, Fig. 2 and Extended Data Figs. 2 and 3). The structure of Pol II-Rad26 revealed that Rad26 binds to the DNA upstream of Pol II EC (Figs. 2c, 2e, 3a, and 3c) and sits between Pol II’s clamp (Rpb2 side) and stalk (Rpb4/7) regions18, in agreement with our DNase I foot-printing assay (Fig. 3d). Most Pol II subunits adopt similar conformations in both complexes, with some local changes at the interfaces between Pol II and Rad26 (Extended Data Fig. 3b-d).
Figure 2. Cryo-electron microscopy structure of the Pol II Elongation Complex bound to Rad26.
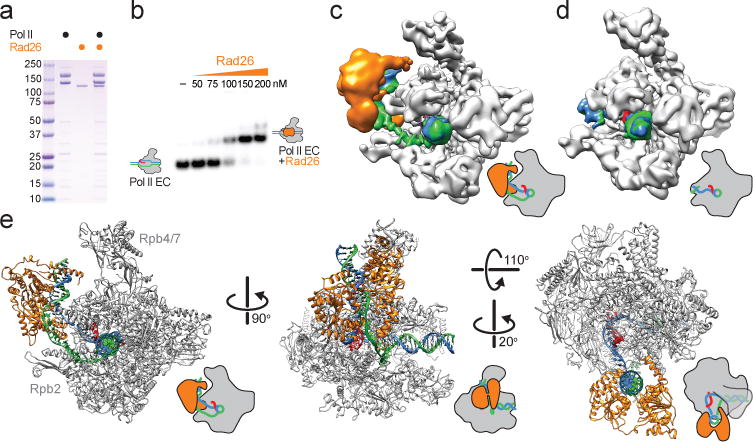
a, Coomassie blue-stained SDS gel of purified Pol II, Rad26 and Pol II EC-Rad26 complex. b, Native gel showing the formation of the Pol II EC-Rad26 complex. c, d, Cryo-EM density for the Pol II EC-Rad26 complex (c) and Pol II EC alone (d). The map was filtered according to the local resolution (see Extended Data Fig. 2). e, Atomic model for the Pol II EC-Rad26 complex. Cartoons of the structures highlight their orientations. Color coding follows the convention from Fig. 1a. For gel source data, see Supplementary Fig. 1.
Figure 3. Rad26 binds to the upstream DNA and bubble fork of Pol II EC and bends the upstream DNA.

a, Atomic model for the scaffold in the Pol II EC-Rad26 complex displayed inside the segmented cryo-EM density, obtained by subtracting Pol II and Rad26 from the Pol II EC-Rad26 map. Orange asterisk: Rad26 density not modeled. Top-right inset: scaffold density (in yellow) in the context of the full complex. b, Superposition of the scaffolds from the Pol II EC-Rad26 and Pol II EC structures, with the latter shown in darker colors. c, Close-up view of the interaction between Rad26 and the scaffold. d, DNase I footprinting assay of Pol II EC-Rad26. The experiment was repeated independently 3 times with similar results. e, Close-up of the Rad26 HD2-1 “wedge” (yellow arrow) that interacts with the upstream bubble fork. Same view as c except with Rad26 in a surface charge representation. Right inset: closer view of the interaction, looking from the transcription bubble towards the upstream DNA. g, Major interactions between Rad26 and the Wall and Protrusion regions of Pol II. The Pol II motifs that bind to Rad26 are shown as surface representations, with the corresponding residues listed. f, Effect of transcription bubble size in the affinity of Rad26 for Pol II EC. Mismatches were added to the upstream fork, downstream fork, or both. Data shown as mean and standard deviation (n = 3). P-values (two-tailed Student’s t test): not shown = not significant; * = <0.05; ** = <0.01; *** = <0.001; **** = <0.0001. Precise p-values shown in Extended Data Table 1. For gel source data, see Supplementary Fig. 1.
We observed several unique structural features in the Pol II-Rad26 complex. Most dramatic is the ~80-degree bending of the upstream DNA duplex region in the presence of Rad26 (Fig. 3b), which has not been reported for any structure involving Pol II18,19. In order to establish that the bending is a consequence of Rad26 binding and not of lesion-induced bending subsequently stabilized by Rad26, we solved the structure of a Pol II-EC with a CPD lesion in the downstream DNA (see Methods) (Extended Data Fig. 4). In this structure, lacking Rad26, the upstream DNA is not visible in the cryo-EM map, as was the case for the Pol II EC with undamaged scaffold, indicating that Rad26 is responsible for bending the upstream DNA. The Pol II-Rad26 map showed continuous density for a full transcription bubble (Fig. 3a), in contrast to Pol II EC, where a significant portion of the non-template strand (NTS) is disordered (Figs. 2c,d and 3b), as previously reported for other Pol II EC structures19,20. This suggests that binding of Rad26 to Pol II EC may restrain the bubble’s flexibility. The dramatic alteration of the potential interaction landscape of Pol II by Rad26 may facilitate the recruitment of downstream repair factors that assemble at the DNA lesion site1.
The two RecA-like lobes of Rad26, which fit well into the density (Fig. 2c,e), bind the upstream DNA duplex region and upstream fork of the transcription bubble (Fig. 3c) and adopt an active closed conformation (Figs. 2e and 3c) similar to that of Rad54 and the recently published Snf2-nucleosome complex21,22. We did not detect density for the N- and C-terminal regions of Rad26 or the Rad26-specific loop insertions (Extended Data Fig. 1), indicating that these regions are either disordered or adopt multiple conformations and were averaged out during reconstruction.
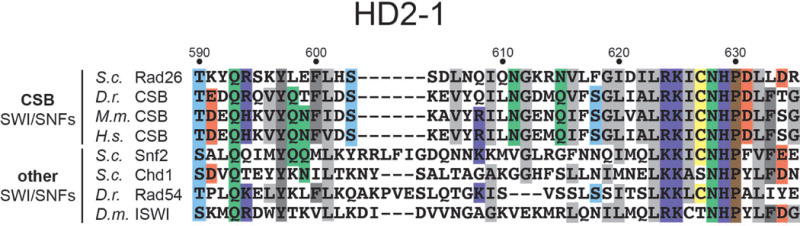
Another unique feature of our structure is the insertion of a Rad26 HD2-1 “wedge” between the DNA strands at the fork of an extended upstream transcription bubble (Fig. 3c,e). This region is highly conserved among CSB family members, but not in other members of the SWI/SNF superfamily (Extended Data Fig. 5). The affinity of Rad26 for Pol II EC increases when the upstream fork of the transcription bubble is AT-rich (Extended Data Fig. 6a-d), suggesting that weaker base pairing facilitates the interaction of Rad26 with Pol II EC and bubble opening. A prediction from these data would be that extending the upstream fork of the transcription bubble should increase the affinity of Rad26 for Pol II EC. Indeed, mismatch-driven upstream bubble opening significantly increased the binding of Rad26 to Pol II EC (Fig. 3f).
Rad26 also binds directly to Pol II (Fig. 3g), consistent with its residual binding affinity for a Pol II EC containing a mini-scaffold with no protruding dsDNA (Extended Data Fig. 6e-h). The major interaction interface between Rad26 and Pol II involves lobe 2 of Rad26 and the Rpb2 subunit in Pol II (Fig. 3g). We also observed density in our cryo-EM map extending between lobe 1 of Rad26 and both the coiled-coil domain in Rpb1 and the Rpb4/7 stalk. Although we could not build a full model within those densities due to their lower resolution, these Pol II regions are common docking sites for several transcription factors, including the initiation factor TFIIE and the elongation factor Spt4/518,23. Superposition of a eukaryotic Pol II elongation complex containing Spt4 and Spt523 on our Pol II-Rad26 structure revealed significant steric clashes between Spt4/Spt5 and both Rad26 and the upstream DNA (Extended Data Fig. 7)23. This suggests an important functional interplay between Rad26 and other transcription factors during transcription and TCR through direct competition for binding to Pol II. This explains the early observation that Rad26 antagonizes the repression of TCR by Spt5 and Spt424,25. Similarly, the overlap between the binding sites of Rad26 and TFIIE accounts for the observation that Rad26 (CSB) is only required for efficient TCR during elongation1, but not initiation, when its binding site would be occupied by TFIIE.
Rad26 belongs to the SWI2/SNF2 family of ATP-dependent 3′ to 5′ single-stranded DNA translocases. To understand which DNA strand Rad26 tracks in the Pol II-Rad26 complex, we superimposed the structure of the yeast Snf2 protein from a recent cryo-EM structure of the Snf2-nucleosome complex (PDB ID 5X0Y)22 on the Rad26 ATPase domain in our structure (Fig. 4a,b and Extended Data Fig. 8). Although our alignment was driven exclusively by the protein moieties, both the proteins and the regions of DNA to which they bind superimpose well (Fig. 4b and Extended Data Fig. 8). Snf2 tracks a single strand of the nucleosomal DNA in a 3′ to 5′ direction (Fig. 4b). Given its fixed position relative to the histone octamer, Snf2 effectively “pulls” on the DNA. Analogously, Rad26 would pull the template strand away from Pol II (Fig. 4c), promoting Pol II forward translocation and resulting in its bypassing certain translocation barriers (Fig. 1c,d)16,26. The direction of Rad26 translocation is also consistent with the reported strand annealing activity for CSB27.
Figure 4. Rad26 translocates along the template strand towards Pol II.

a, The Snf2 ATPase (PDB ID: 5X0Y) was aligned to Rad26 in the Pol II EC-Rad26 structure. Nucleic acids were excluded from the alignment. b, Blown-up view of the rectangle shown in a, with nucleosomal DNA bound by Snf2 included. Yellow arrow: direction of DNA movement superimposed on the tracking strand that would result from the 3′ to 5′ DNA translocation activity of Snf2. This strand corresponds to the Template Strand (blue) in the Pol II EC-Rad26 scaffold. c, Full view of the Pol II EC-Rad26 structure. Blue arrow: direction of DNA movement resulting from translocation by Rad26 along the Template Strand. d, e, Comparison between the Pol II EC-Rad26 complex and a Pol II EC containing a CPD DNA lesion (PDB ID: 2JA6), with the root mean square deviation (RMSD) between the Pol II backbones shown on the Pol II EC-Rad26 complex as a worm diagram. Color and thickness represent the RMSD value. f, Scaffolds from Pol II EC-Rad26 and the Pol II EC containing the CPD lesion shown as in e. Rad26 and the bridge helices, and CPD lesion are shown. Dark blue arrow: direction of DNA movement as Pol II transcribes. White bar: CPD-induced blockage of translocation. The Pol II EC scaffold containing the CPD lesion is shown in darker colors.
We tested this model directly by probing whether Rad26 could resolve Pol II backtracking in an ATP-dependent manner (Fig. 5a,b). We used TFIIS-stimulated RNA cleavage by Pol II to detect the presence of backtracking induced with a combination of a pausing sequence and nucleotide removal. We observed a significant reduction in RNA cleavage products only in the presence of wild-type Rad26 and dATP (Fig. 5c,d). Together, our data suggest that Rad26 can promote the forward motion of Pol II in an ATP-dependent manner.
Figure 5. Rad26 resolves Pol II backtracking in an ATP-dependent manner.

a, Schematic representation of experimental design. b, Experimental timeline. c, Sequencing gels showing TFIIS-stimulated RNA cleavage products for the reactions outlined in (b). Uncleaved transcript is indicated. d, Quantification of the percentage of uncleaved RNA. Data shown as mean and standard deviation (n = 4). P-values (two-tailed Student’s t test): not shown = not significant; * = <0.05; ** = <0.01; *** = <0.001; **** = <0.0001. Precise p-values shown in Extended Data Table 1. e, Model for the identification of substrates for TCR by Rad26 in conjunction with Pol II. See main text for details. For gel source data, see Supplementary Fig. 1.
Several observations from our structure support the conservation of the Pol II-Rad26/CSB complex from yeast to humans. Given the conservation in the core ATPase domain of Rad26 (Extended Data Fig. 1)3,4, we expect the structure of CSB’s core domain to be very similar. The structural conservation between mammalian and yeast Pol II EC has been established28. Finally, most of the Rad26-DNA and Rad26-Pol II interaction interfaces we identified are highly conserved between yeast and humans.
Although the differences between prokaryotic and eukaryotic TCR are well-documented1, our Pol II-Rad26 structure revealed some similarities between them: 1) Rad26 and the prokaryotic transcription-repair coupling factor Mfd bind upstream of RNA polymerase and facilitate its forward translocation to rescue transcriptional arrest. 2) Both Rad26 and Mfd interact with the structurally conserved second-largest subunit of the polymerase (Rpb2 for Pol II and beta subunit for RNAP), and essentially the same side of RNA polymerase29.
Our data suggest a unified mechanistic model for Rad26/CSB’s role in both TCR and transcription (Fig. 5e). Rad26/CSB recognizes a stalled Pol II and can reduce its dwell time by preventing backtracking, promoting Pol II forward translocation on non-damaged templates, and increasing the chances of transcriptional bypass through less bulky DNA lesions16,26, all of which stimulate transcription elongation (Fig. 5e)16. However, Rad26 fails to promote efficient transcriptional bypass of bulky DNA lesions that lead to strong blockage of translocation (such as CPD lesions)17 (Fig. 1e). A comparison of our Pol II EC-Rad26 structure and a CPD-arrested Pol II EC showed a striking structural similarity in the core 10-subunit Pol II region and the active sites (Fig. 4d-f), suggesting that a CPD lesion would likely have no effect on the interactions between Pol II and Rad26/CSB. In agreement with this, the binding affinities between Rad26 and a Pol II EC carrying either a non-damaged or a CPD lesion-containing scaffold are indistinguishable (Extended Data Fig. 6i,j). These observations suggest that only the interaction between Rad26/CSB and a Pol II persistently arrested at a bulky lesion would lead to initiation of TCR (Fig. 5e).
The structure of the Pol II-Rad26 complex also provides insights into the roles of CSB in DNA lesion recognition and verification in eukaryotic TCR initiation. TCR and global genome nucleotide excision repair (GG-NER) have been suggested to have similar tripartite lesion recognition and verification steps, with the first DNA lesion recognition step in TCR being mediated by blockage of Pol II transcription instead of XPC (Extended Data Fig. 9)30. However, the role of CSB in this lesion recognition step is not clear. We propose that CSB (Rad26) plays a central role in the first DNA lesion recognition step (Fig. 5e) and presents new protein interaction interfaces that could facilitate loading downstream repair factors1, such as UVSSA, CSA, XPG, and TFIIH in humans (Extended Data Fig. 9). TFIIH would use its XPB and XPD helicases to induce backtracking in Pol II and verify the presence of a DNA lesion on the template strand (step 2). The final step, XPA-dependent lesion verification, is expected to be the same for both GG-NER and TCR (step 3) (Extended Data Fig. 9)30. A full understanding of the mechanistic details of this model awaits further investigation.
Experimental methods
Protein expression and purification
The coding sequence of Saccharomyces cerevisiae Rad26 was cloned from Saccharomyces genomic DNA into a pGEX6p-1 based vector (GE healthcare USA). An N-terminal hexa-histidine tag and E. Coli trigger factor protein were added to the construct to facilitate protein expression and purification. A precision protease recognition sequence was inserted between the trigger factor and Rad26. Rad26 mutations were generated by PCR using the full-length Rad26 sequence as template. All Rad26 constructs were confirmed by DNA sequencing.
Recombinant Rad26 proteins were expressed in Escherichia coli strain Rosetta 2(DE3) (Novagen, USA). Cells were transformed and grown in LB at 37 °C to an OD600 of 0.6, and expression was induced by 0.1 mM IPTG for 16 h at 20 °C. The cells were lysed in buffer A (20 mM Tris-HCl (pH 7.5), 500 mM NaCl, 5% glycerol, 1 mM 2-Mercaptoethanol). After centrifugation, the supernatant lysate was applied to a HisTrap HP column (GE Healthcare, USA) equilibrated in buffer B (buffer A plus 10 mM imidazole). The column was washed with 20 column volumes of buffer B and eluted with buffer A containing 200 mM imidazole. The eluate was then applied to a Hi-Trap Heparin column (GE Healthcare, USA), equilibrated in buffer C (20 mM Tris-HCl (pH 7.5), 400 mM NaCl, 5% glycerol, 1 mM 2-Mercaptoethanol) and eluted in buffer A with a linear gradient of 400 to 1000 mM NaCl. The eluate was then applied to a Hi-Trap SP HP column (GE Healthcare, USA), equilibrated in buffer D (20 mM Tris-HCl (pH 7.5), 250 mM NaCl, 5% glycerol, 1 mM 2-Mercaptoethanol) and eluted in buffer A with a linear gradient of 250 to 1000 mM NaCl. To further improve the purity, Rad26-containing fractions from the Hi-Trap SP HP column were applied to a Superdex 200 10/300 GL size exclusion column (GE Healthcare, USA), equilibrated in buffer E (20 mM Tris-HCl (pH 7.5), 500 mM NaCl, 5% glycerol, 1 mM DTT). The Rad26-containing fractions were pooled, concentrated to 2 mg/ml and stored at −80°C.
S. cerevisiae 12-subunit Pol II was purified essentially as previously described31,32. Briefly, Pol II (with a recombinant protein A tag in the Rpb3 subunit) was purified by affinity chromatography using an IgG column (GE Healthcare, USA), followed by further purification using Hi-Trap Heparin and Mono Q anion exchange chromatography columns (GE Healthcare, USA).
In vitro transcription assay
Pol II elongation complexes were assembled essentially as previously described14,33. Radioactively-labeled 10-mer RNA was annealed to the template strand (TS) DNA by heating at 95 °C for 2 minutes followed by slow cooling to room temperature (23 °C). 10 pmol of Pol II was incubated with 4 pmol of RNA-DNA hybrid for 10 minutes at room temperature (23 °C), and then 2 minutes at 37 °C. To this, 10 pmol of biotin-labeled non-template strand (NTS) DNA was added and incubated for 5 minutes at 37 °C followed by incubated for 20 minutes at room temperature (23°C). The assembled elongation complex was incubated with 20 μl of Streptavidin magnetic beads (NEB, USA) for 30 minutes at room temperature (23 °C) and subsequently washed with elongation buffer, EB (20 mM Tris-HCl (pH 7.5), 5 mM MgCl2, 40 mM KCl, 5 mM DTT) followed by EB with 0.3 M NaCl, EB with 1 M NaCl, EB with 0.3 M NaCl and finally EB. The efficiency of EC assembly and bead association was estimated to be 20–50% based on the radioactivity of bead-associated RNA. For transcription assays with Py-Im Polyamide roadblock, 0.8 μM of Py-Im polyamides was incubated with the bead-associated elongation complexes in EB for 3 hours at room temperature. The beads were re-suspended in EB and used for transcription assays.
All in vitro transcription was initiated by adding rNTPs mixture to a final concentration of 1 mM each. Additional 3mM dATP was also included for supporting Rad26 ATPase activity. After 5 minutes, Rad26 or TFIIS (final concentration of 100 nM) was added to the reaction mix and kept at 30°C. For transcription assay from CPD-lesion containing template, Rad26 or TFIIS were added at same time with NTP mixture to visualize the early pausing sites (1/3-3 min). After adding Rad26 or TFIIS, reactions were allowed to continue for the desired time and then quenched (after 1, 3, 10, 30, or 60 min) by adding an equal volume of quench-loading buffer (90% formamide, 50 mM EDTA, 0.05% xylene cyanol and 0.05% bromophenol blue). Samples were boiled for 10 min at 95 °C in quench-loading buffer, and the product RNA transcripts were analyzed by denaturing PAGE (6 M urea). The gel was visualized by phosporimaging and quantified using Image Lab software (BioRad, USA).
For the experiments using TFIIS as a probe to investigate whether Rad26 translocation helps resolve induced backtracking in Pol II (Figure 5), 1 mM rNTPs was first added to Pol II elongation complex with an A-tract template to start transcription. After 20 min of transcription extension, the rNTPs were removed by washing the resin three times to generate backtracked Pol II. 200 nM Rad26 and 3 mM dATP were then added to the reaction mix, which was incubated at 30°C for 5 min. Finally, 100 nM TFIIS was added and the reaction incubated at 30°C for 1, 2, 5, or 10 min before being quenched by adding an equal volume of quench-loading buffer. Samples were boiled for 10 min at 95 °C in quench-loading buffer, and the product RNA transcripts were analyzed by denaturing PAGE (6 M urea). The gel was visualized by phosporimaging and quantified using Image Lab software (BioRad, USA).
DNA and RNA oligonucleotides and scaffolds used in this study
See Supplementary Tables 1 and 2.
Electrophoretic mobility shift assay (EMSA)
To examine the formation of Pol II-Rad26 complexes, an aliquot of 20 nM transcription scaffold with radiolabeled RNA was incubated with 50 nM Pol II in the binding buffer (20 mM Tris, pH 7.5, 5 mM MgCl2, 5 mM DTT, 40 mM KCl, 50 mM NaCl, 5% Glycerol, 0.1 mg/ml BSA) at 23 °C for 10 min to form the elongation complex. Rad26 was added at specified concentrations and the reactions were incubated for an additional 30 minutes at 23 °C. The reactions were then run on a 4.5% native PAGE in TBE buffer (pH 8.0) with 2 mM MgCl2 for 2.5 h at 4 °C. Labeled Pol II EC and Pol II-Rad26 complexes were visualized by phosporimaging and quantified using Image Lab software (BioRad, USA).
DNase I footprinting
An aliquot of 20 nM Pol II EC (with 5´-P32 labeled template DNA strand) was incubated with 0-150 nM Rad26 in the binding buffer (see above) at 23 °C for 30 min. Then DNase I (NEB, USA) was added to a final concentration of 0.04 units/ml and the digestion was carried out for 1 minute (50 seconds if Rad26 was absent) at 23 °C. The reactions were stopped by addition of 10 μl quench-loading buffer. DNA products were heat-denatured at 95 °C for 5 min and separated by 7% denaturing PAGE gel. Labeled DNA products were visualized by phosphorimaging and quantified using Image Lab software (BioRad, USA).
Preparation of the Pol II-Rad26 complex for electron microscopy
PAGE-purified RNA oligonucleotides were purchased from Dharmacon, template and non-template DNA oligonucleotides were obtained from IDT. HPLC-purified CPD lesion-containing template was purchased from TriLink. The RNA, template DNA (non-damaged or CPD lesion containing) and non-template DNA were annealed to form the scaffold as described above. To form the Pol II EC, Pol II and the scaffold were incubated in elongation buffer (20 mM Tris (pH 7.5), 40 mM KCl and 5 mM dithiothreitol (DTT)). To form the Pol II-Rad26 complex, Rad26 was added to Pol II EC and incubated for 30 min at 23 °C. The final buffer composition was 20 mM Tris-HCl (pH 7.5), 5 mM MgCl2, 10 mM DTT, 40 mM KCl, 100 mM NaCl and 2% glycerol and the final concentrations of the different components were 330 nM Pol II, 600 nM Rad26, 300 nM template DNA, 330 nM non-template DNA and 360 nM RNA. The same procedure was used to assemble Pol II EC containing a site-specific CPD lesion (Pol II EC (CPD)), except with the following modification: To increase the randomness of Pol II EC (CPD) particle orientations on the EM grid, the Pol II EC (CPD) complex (1.2 μM) was crosslinked with 1 mM BS3 (Thermo) for 30 min at 23 °C, then quenched with 50 mM ammonium bicarbonate. The excess BS3 was then removed by overnight dialysis. The final concentration of the Pol II EC (CPD) complex was 900 nM.
The sequences used for EC preparation are as follows: template DNA,
5´-CGCTCTGCTCCTTCTCCCATCCTCTCGATGGCTATGAGATCAACTAG-3´; CPD lesion-containing template DNA,
5´-CGCTCTGCTCCTTCTCCXXTCCTCTCGATGGCTATGAGATCAACTAG-3´(XX = CPD lesion); non-template DNA,
5´-CTAGTTGATCTCATATTTCATTCCTACTCAGGAGAAGGAGCAGAGCG-3´; RNA, 5´-AUCGAGAGGA-3´.
Electron microscopy
An aliquot of four μl of the sample were applied to glow-discharged UltraAuFoil R 1.2/1.3 holey gold grids (Quantifoil Micro Tools GmbH, Germany) coated with a thin carbon layer for Pol II EC-Rad26 and Quantifoil 1.2/1.3 holey carbon grids for Pol II EC (CPD). The grids were blotted and plunge-frozen in liquid ethane using a Vitrobot (FEI, USA). Automated data collection was performed using Leginon34 on a FEI Talos Arctica (FEI, USA) operated at 200 kV, equipped with a Gatan K2 Summit direct detector (Gatan Inc., USA). For the Pol II EC-Rad26 sample, 8,026 movies were recorded in ‘super-resolution mode’ at a dose rate of 11.2 electrons/pixel.sec with a total exposure time of 6 s sub-divided into 200 ms frames, for a total of 30 frames. The images were recorded at a nominal magnification of 36,000X resulting in an object-level pixel size of 1.2 Å/pixel (0.6 Å/super-resolution pixel). The defocus range of the data was −0.5 μm to −5 μm. The Pol II EC (CPD) sample adopted a strongly preferred orientation on the grid. To increase the number of orientations, two datasets were collected, with and without bis(sulfosuccinimidyl)suberate (BS3, ThermoFisher Scientific)23,35,36. A total of 3,690 micrographs were recorded using the above-mentioned parameters except that the total exposure was 7.5 s instead of 6 s.
Image processing
The movie frames were aligned using a pre-release version of MotionCor237 and the dose-weighted frame alignment option. The aligned micrographs were then manually inspected and unsuitable micrographs (having defects like broken carbon, thick ice, etc.) were discarded. CTF estimation was performed on the non-dose-weighted aligned micrographs using CTFFIND338 and micrographs having a 0.5 confidence resolution for the CTF fit worse than 8 Å (as determined in Appion) were excluded from further processing. For an initial reconstruction, DoG Picker39 was used to select particles from the dose-weighted micrographs in a template-independent manner. Relion 1.440,41 was used for the initial round of 3D reconstruction. One more round of particle picking was performed using FindEM42 with 2D averages from the initial processing serving as templates and the particle picks from this final round were used for further processing. CTF estimation and particle picking were performed within the framework of Appion43.
All subsequent processing was done using a pre-release version of Relion 244 installed on Amazon Web Services (Ami id: ami-9caa71fc)45. Two-dimensional classification was performed to identify “bad” particles. Only those particles that contributed to “good” 2D class averages were used for further processing. Following 2D classification, an initial 3D classification was performed using a Pol II EC model (PDB ID: 1Y77)46 as reference and only those particles corresponding to classes showing a strong additional density when compared to EC were selected. The 2D and initial 3D classifications were carried out using 4X binned data (4.8 Å/pixel). For the rest of the steps unbinned images (1.2 Å/pixel) were used. The detailed 3D classification and refinement scheme is shown in Extended Data Fig. 2d. The resolutions of the cryo-electron microscopy (cryo-EM) maps were estimated from FSC curves calculated using the gold-standard procedure and the resolutions are reported according to the 0.143 cutoff criterion47,48. FSC curves were corrected for the convolution effects of a soft mask applied to the half maps by high-resolution phase randomization49. The density maps were corrected for the modulation transfer function (MTF) of the detector and were sharpened with an automatically estimated negative B factor as implemented in the “post-process” routine of Relion.
In our initial EM map (Extended Data Fig. 2d, 4.5 Å Pol II EC-Rad26 complex structure) the density for Rad26 was more fragmented compared to the rest of the complex. In order to identify a subset of particles with strong density for Rad26, the signal for the rest of the EC was computationally removed and then focused classification was performed using a mask for Rad26 generated from the initial map50. For further processing only those classes that showed a clear upstream DNA density and the complete density for the Rad26 ATPase domain were selected. 19,231 particles (4% of the total particles retained after 2D classification and 12% of the particles assigned to Pol II EC-Rad26 after the initial 3D classification) were used for the final cryo-EM map of Pol II EC-Rad26 and the map reached an overall resolution of 5.8 Å. Local resolution of the map was estimated using the “local-resolution” routine in Relion2 and was used to locally filter the maps. A cryo-EM map of a Pol II EC was also reconstructed from the same dataset using the in silico sorting scheme outlined in Extended Data Fig. 2d. The Pol II EC was reconstructed from 24,300 particles and the map reached an overall resolution of 6.4 Å.
For the Pol II EC (CPD) datasets CTFFIND451 was used for CTF estimation and 2D averages of the Pol II EC-Rad26 complex were used as templates for particle picking using FindEM. A total of 936,200 particles were selected from the two datasets and after several rounds of 2D classifications 144,085 particles were retained for further processing. These particles were refined against the Pol II EC-Rad26 structure using the heterogeneous refinement regime in CryoSparc52. 51,119 particles contributed to the final structure. Analysis of the angular distribution of the particles revealed a strong orientation bias (Extended Data Fig. 4e) preventing further classification or refinement of the structure.
Model building
Rosetta53–55 was used to build atomic models into the cryo-EM maps of Pol II EC-Rad26 and Pol II EC. Reference models for Rad26 and different subunits of Pol II were selected based on homology detection using Hidden Markov Model as implemented in HHpred56. (Note: the model for yeast Snf2 protein from a recent cryo-EM structure of the Snf2-nucleosome complex (PDB ID 5X0Y)22, which we compare with the Rad26 structure in Figure 4 and Extended Data Figure 8, was not included in our model building.) Reference models were aligned to the EM map using Chimera. Twenty top-scoring homologous models were used as input in RosettaCM, which then rebuilt missing regions guided by density, and refined the resulting structures using the Rosetta force field augmented with fit-to-density energy54. The starting model for the transcription scaffold was generated from previous structures of the transcribing yeast (PDB ID: 5C4X)57 and mammalian (PDB ID: 5FLM) Pol II28, and was refined using PHENIX real space refinement58 with nucleic acids-specific LibG restrains. Initially the Pol II EC-Rad26 map was divided into three regions: Rad26, Pol II core and Rpb4/7 stalk and the atomic models for each of these regions were refined separately. In each case several output models were generated (2,000 for Rad26 and 320 each for Pol II core and Rpb4/7 stalk). For each region, the conformation with the best Rosetta energy (including fit-to-density energy) was used for subsequent steps. Regions poorly matching the density following RosettaCM were manually deleted from the templates, and rebuilt de novo.
Once a converged solution was arrived at for all three regions (Rad26, Pol II core and Rpb4/7 stalk), a combined atomic model was refined against the complete EM map of Pol II EC-Rad26. This was carried out using RosettaCM, where 200 models were generated. A final refinement step was performed against one of the half-maps from the 4.5 Å structure of Pol II EC-Rad26 (the “training half-map”) using Rosetta’s Relax protocol53,55 to optimize the positions and geometry of the amino acid side chains. Model geometry was verified using Molprobity59 (Extended Data Fig. 3g). To estimate over-fitting, FSCwork (FSC curve between the refined model and training half-map) and FSCfree (FSC curve between the refined model and the other half-map, the “test half-map”) were calculated. All figures and difference maps were generated using UCSF Chimera60 and the maps were segmented using Seggar61 as implemented in UCSF Chimera.
Data availability
Cryo-EM maps have been deposited in the EM Data Bank, with the following accession numbers: higher-resolution (4.5 Å) Pol II EC-Rad26 (EMDB: EMD-8736); final map for Pol II EC-Rad26 (EMDB: EMD-8735); Locally filtered version of EMDB-8735 (EMDB: EMDB-7038). Pol II EC (EMDB: EMD-8737); and Pol II EC (CPD) (EMDB: EMD-8885). The atomic models have been deposited in the Protein Data Bank, with the following accession numbers: Pol II EC-Rad26 complex (PDB ID: 5VVR); and Pol II EC complex (PDB ID: 5VVS).
Extended Data
Extended Data Figure 1. Sequence alignment of the ATPase core domains of CSB family members.

Protein sequences from the CSB ATPase core region from S. cerevisiae, S. pombe, A. thaliana, D. rerio, M. musculus and H. sapiens were aligned using Clustal Omega. Residues are numbered based on the sequence of the S.c. CSB ortholog (Rad26). Conserved residues are highlighted in red and helicase-specific motifs are boxed in black and labeled with roman numerals. The flexible disordered loop regions that were not built into the cryo-EM density are indicated, as are the SWI2/SNF2-specific domains HD1 and HD2.
Extended Data Figure 2. Cryo-EM reconstructions of the Pol II EC-Rad26 and Pol II EC complexes.

a, Representative micrograph of Pol II EC-Rad26 complexes. The scale bar represents 100 nm. b, Power spectrum of the micrograph in a showing Thon rings out to 3.4 Å. c, Representative 2D class averages of the Pol II EC-Rad26 complex. d, Schematic representation of the strategy used to sort out the data sets into Pol II EC and Pol II EC-Rad26 complex structures. Unless otherwise noted, 3D classification was performed without image alignment. Colored, segmented maps indicate those classes whose particles were used for further processing. The color scheme used in the segmented maps is as follows: grey: Pol II, orange: Rad26, green: transcription scaffold. Black lines follow the classification scheme used to extract homogeneous Pol II EC-Rad26 particles; blue lines follow the classification scheme used to extract homogeneous Pol II EC particles. The refined maps for the higher-resolution Pol II EC-Rad26 complex (with fragmented Rad26 density), final Pol II EC-Rad26 complex and Pol II EC are highlighted with green, black and blue boxes, respectively. The indicated resolution corresponds to the 0.143 FSC based on gold standard FSC curves. The number of particles contributing to each selected structure are indicated. The percentages shown are relative to the total number of particles selected after 2D classification. e, f, g, Front and back views of locally-filtered maps colored by local resolution. h, Euler angle distribution of particle images for the maps shown in e-g. i, Fourier Shell Correlation (FSC) plots for the higher-resolution Pol II EC-Rad26 complex (with fragmented Rad26 density), final Pol II EC-Rad26 complex and Pol II EC maps with the resolution at 0.143 FSC indicated. j, Representative near-atomic resolution regions in Pol II from the locally-filtered higher-resolution (4.5 Å) Pol II EC-Rad26 map. The density is shown in transparent grey with the atomic model for Pol II EC-Rad26 complex fitted in the map. The β-sheet corresponds to residues 346-356, 440-446, and 486-493 in Rpb1, and 1104-1107 in Rpb2. The portion of the bridge helix shown here corresponds to residues 810-829 in Rpb1.
Extended Data Figure 3. Three-dimensional classification of Pol II EC-Rad26 complex data and Rosetta model validation.

a, Table summarizing the main statistics from data collection, refinement and model validation. b, c, Root mean square deviation (RMSD) of the protein backbones among the top five conformations (based on Rosetta energy) of Pol II EC-Rad26 complex (b) and Pol II EC (c) generated by RosettaCM. In both cases the best Rosetta energy model is shown as a worm model, with thickness and color representing the backbone RMSD. The transcription scaffolds were not included in the RMSD calculation and were omitted for clarity. d, Backbone RMSD between the atomic models of Pol II EC-Rad26 complex and Pol II EC shown on the atomic model of Pol II EC-Rad26 complex using the same representation used in b and c. The models were globally aligned to each other in Chimera (UCSF) and only those parts of the model for which RMSD calculation could be performed are shown. e, f, FSC curves between the atomic model and cryo-EM maps for Pol II EC-Rad26 complex (e) and Pol II EC (f). In e FSCwork and FSCfree were calculated using half maps from the higher-resolution Pol II EC-Rad26 complex structure. The 0.5 FSC line is shown. g, MolProbity statistics for the Pol II EC-Rad26 complex and Pol II EC models. RSCC: Real Space Correlation Coefficient, as implemented in EMRinger62. The RSCC value shown in parentheses for Pol II EC-Rad26 complex is for the higher-resolution (4.5 Å) map with fragmented Rad26 density. h, i, Three different views of the Pol II EC-Rad26 map with models docked in (h), and close-up views of the Pol II-Rad26 interface (i).
Extended Data Figure 4. Cryo-EM reconstruction of a Pol II EC containing a CPD lesion.

a, Representative micrograph of Pol II EC (CPD). b, Power spectrum of the micrograph in (a). c, Representative 2D class averages of the Pol II EC (CPD) complex. d, Fourier Shell Correlation (FSC) plot for the final Pol II EC (CPD) map with the resolution at 0.5 FSC indicated. e, Euler angle distribution of particle images. f, Table summarizing data collection statistics. g-k, Strategy for generating difference map between Pol II EC-Rad26 and Pol II EC (CPD). We took the model for the Pol II EC-Rad26 complex (g), removed Rad26 (h), and converted the resulting model into a cryo-EM-like density (i). From this, we subtracted the Pol II EC (CPD) map (j) to obtain the difference map (k). l, Two views of the Pol II EC (CPD) map. m, Model of the Pol II EC complex after removal of Rad26 (h) docked into the Pol II EC (CPD) map. n, Same as in (m) with the difference map superimposed.
Extended Data Figure 5. Alignment of the HD2-1 region of CSB and non-CSB members of the SWI/SNF superfamily of ATPases.

The HD2-1 region corresponds to the “wedge” motif in the Pol II EC-Rad26 structure (see Fig. 3e). See Extended Data Figure 1 for the location of the HD2-1 region within the full ATPase domain. Residues are colored (according to physicochemical properties) when conserved in at least half of the sequences.
Extended Data Figure 6. EMSA assays reveal the strength of base pairing at the upstream fork of the transcription bubble, not CPD lesions at downstream fork, affects the interaction of Rad26 with Pol II EC.

a, The sequence of the scaffold used in this study. The nucleotides labeled as XXX and YYY were varied in these experiments to control the strength of the base pairing at the upstream fork of the transcription bubble. b, Electrophoretic mobility shift assay (EMSA) between Rad26 and Pol II EC with an AT-rich sequence at the upstream fork of the DNA bubble. c, EMSA between Rad26 and Pol II EC with a GC-rich sequence at the upstream fork of the DNA bubble. d, Quantitation of the assays shown in b, c. Data shown as mean and standard deviation (n = 3). P-values: not shown = not significant; * = <0.05; ** = <0.01; *** = <0.001; **** = <0.0001. Precise p-values shown in Extended Data Table 1. e, Modeled structure of Pol II in complex with the mini-scaffold. Rad26, from the Pol II EC-Rad26 complex structure, was included as a semi-transparent ribbon diagram to indicate the lack of interaction between it and the mini-scaffold. Mini-scaffolds that eliminate the upstream DNA to which Rad26 binds were used to form elongation complexes (mini-ECs) with Pol II, and the interaction between these mini-ECs and Rad26 was tested using EMSA. f, DNA/RNA scaffolds used in this experiment. In order to rule out the possibility that Rad26 may bind to dsDNA in a non-specific manner, a scaffold with only RNA and TS (Scaffold 2) was also tested. g, h, EMSA with Scaffold 1 (g) and Scaffold 2 (h) showing formation of a Pol II mini-EC-Rad26 complex. The experiment was repeated independently twice with similar results. i, Scaffolds with or without a CPD lesion (see Methods for details) were used to form elongation complexes with Pol II, and the interaction between them and Rad26 was tested using EMSA. j, Quantitation of data in (i). Data shown as mean and standard deviation (n = 3). All biochemical experiments were repeated independently 3 times with similar results, except 2 times for g and h. For gel source data, see Supplementary Fig. 1.
Extended Data Figure 7. Overlap between the binding sites of Rad26 and Spt4/Spt5 on Pol II.
a, c, Structure of the Pol II EC-Rad26 complex with Rad26 and the DNA/RNA scaffold shown in surface representation. b, d, Structure of Pol II EC bound to Spt4/Spt5 and TFIIS (PDB ID: 5XON) with Spt4 and Spt5 shown in surface representation. The different domains of Spt5 are indicated. e, Rad26 and the DNA/RNA scaffold from (a) are superimposed on Spt4/Spt5 from (b). f, Rotated view of (e). g, Rad26 and the DNA/RNA scaffold from (c) are superimposed on Spt4/Spt5 from (d). h, Rotated view of (g). The bicolor arrows indicate clashes between Rad26 or the DNA/RNA scaffold and Spt4/Spt5.
Extended Data Figure 8. Alignment between Snf2 and Rad26.

a, This panel is identical to Fig. 4b and is included here as a reference. b, Superposition between Rad26, bound to the transcription scaffold, and Snf2 from the cryo-EM structure of the Snf2-nucleosome complex (PDB ID: 5X0Y), with the nucleosome included in the image. This is the same alignment shown in Fig. 4a-c and panel a, and was driven exclusively by Snf2 and Rad26. This view is rotated by 180° about the vertical axis relative to (a). The dashed box marks the portion of the structure equivalent to that shown in (a). The back gyre of the nucleosome was faded out for clarity. c, Same view as in (b) with Snf2 and Rad26 removed to illustrate the superposition of the Rad26-bound portion of the transcription scaffold and the nucleosomal DNA. d-g, Alignment of Rad26 and Snf2. The superimposed structures are shown in two orientations (d, f), with (d) corresponding to the direction indicated by the symbol in (a). A worm model is used to represent the similarity between the two structures (e, g), with thickness and color indicating the backbone RMSD. The thin wire corresponds to regions in the Rad26 model that are not present in Snf2.
Extended Data Figure 9. Unified model for three-step DNA lesion recognition and verification for both Transcription-Coupled Nucleotide Excision Repair (TC-NER, also known as TCR) and Global Genomic Nucleotide Excision Repair (GG-NER).

Check step 1: For GG-NER, XPC/HR23B detects base-pair disruption and helix distortion and binds to the DNA strand opposite to that carrying the lesion. This constitutes the initial lesion recognition. For TCR, CSB is recruited to a stalled Pol II to discriminate genuine DNA lesion-induced transcription arrest from other forms of transcriptional arrest, as diagrammed in panel a. At this step, CSB acts in conjunction with Pol II to mediate the initial recognition of DNA lesions that block transcription translocation. Check step 2: Core TFIIH is recruited to further verify the DNA lesion. In GG-NER, the XPD and XPB helicases in core TFIIH translocate the complex towards the lesion. This is the result of XPD tracking along the damage-containing strand in a 5´ to 3´ direction and XPB tracking along the opposite strand (non-damaged) in a 3´ to 5´ direction. In TCR, TFIIH is loaded downstream of the arrested Pol II-CSB complex, with XPD and XPB tracking the template and non-template strands, respectively. The XPD/XPB helicases in core TFIIH translocate towards the lesion, as is the case for GG-NER. As a result, Pol II-CSB is pushed upstream by TFIIH to expose the DNA lesion. Check step 3: XPA is recruited for a final validation of the TFIIH-recognized lesion and to ensure that only genuine NER lesions are subjected to dual incision by endonucleases ERCC1/XPF and XPG and downstream repair synthesis.
Extended Data Table 1.
Specific p-values
| Figure 3f: Specific p-values for the affinity of Rad26 for Pol II EC | ||||
|---|---|---|---|---|
| Rad26 Concentration | ||||
|
| ||||
| Bubble Size | 25nM | 50nM | lOOnM | 200nM |
| 10 nt | Control | Control | Control | Control |
| 10nt+3nt | N.D. | N.S.(0.46) | N.S.(0.73) | N.S.(0.48) |
| 3nt+10nt | 1.5E-05 | 0.0002 | 3.5E-05 | 0.014 |
| 3nt+10nt+3nt | 5.2E-05 | 3.8E-05 | 1.2E-05 | 0.12 |
| Rad26 Concentration | ||||
|
| ||||
| Bubble Size | 25nM | 50nM | lOOnM | 200nM |
| 3nt+10nt | Control | Control | Control | Control |
| 3nt+10nt+3nt | 0.029 | N.S.(0.68) | N.S.(0.21) | 0.0051 |
| Figure 5d: Specific p-values for uncleaved RNA | ||||
| Time Points | ||||
|
| ||||
| Proteins | 1 min | 2 min | 5min | 10 min |
| -Rad26/-dATP | 2.4E-06 | 1.7E-05 | 0.0012 | 0.0067 |
| -Rad26/+dATP | 1.5E-05 | 3.1E-05 | 0.0013 | 0.0005 |
| +Rad26/-dATP | 6.5E-06 | 5.2E-05 | 0.0013 | 0.0004 |
| +Rad26/+dATP | Control | Control | Control | Control |
| +Rad26K328R/+dATP | 0.0002 | 1.6E-06 | 0.0007 | 0.0098 |
| Extended Data Figure 6d: Specific p-values for the affinity of Rad26 for Pol II EC | ||||
| Rad26 (nM) | ||||
|
| ||||
| Scaffolds | 50 | 100 | 200 | |
| GC Rich | Control | Control | Control | |
| AT Rich | N.S.(0.16) | 0.0044 | 4.8E-06 | |
Supplementary Material
Acknowledgments
We thank the Wang and Leschziner labs for helpful discussions. D.W., A.E.L. and P.B.D. were supported by National Institutes of Health grants GM102362, GM102362-S1 (D.W.), GM092895 (A.E.L.), and GM27681 (P.B.D.). M.A.C. acknowledges support from the Damon Runyon Cancer Research Foundation. We thank the UCSD cryo-EM Facility, where all data was collected. We used the Extreme Science and Engineering Discovery Environment (XSEDE) for computing allocations (MCB160121 to D.W.), supported by NSF grant ACI-1548562.
Footnotes
Author Contributions
J.X. prepared the proteins with help from W.W. and J.C. and performed the biochemical analyses. A.H. and P.D.B. provided the Py-Im chemical agent. I. L. collected the EM data with help from A.W. I. L. performed data processing and refinement with help from M.A.C. I.L. and F.D. generated the atomic models with homology models generated by J.X., W.W. and D.W. D.W. and A.E.L wrote the manuscript with help from all lab members. D.W. and A.E.L directed and supervised the research.
The authors declare no competing financial interests.
References
- 1.Hanawalt PC, Spivak G. Transcription-coupled DNA repair: two decades of progress and surprises. Nat Rev Mol Cell Biol. 2008;9:958–970. doi: 10.1038/nrm2549. [DOI] [PubMed] [Google Scholar]
- 2.Svejstrup JQ. Contending with transcriptional arrest during RNAPII transcript elongation. Trends Biochem Sci. 2007;32:165–171. doi: 10.1016/j.tibs.2007.02.005. [DOI] [PubMed] [Google Scholar]
- 3.Troelstra C, et al. ERCC6, a member of a subfamily of putative helicases, is involved in Cockayne’s syndrome and preferential repair of active genes. Cell. 1992;71:939–953. doi: 10.1016/0092-8674(92)90390-x. [DOI] [PubMed] [Google Scholar]
- 4.van Gool AJ, et al. RAD26, the functional S. cerevisiae homolog of the Cockayne syndrome B gene ERCC6. EMBO J. 1994;13:5361–5369. doi: 10.1002/j.1460-2075.1994.tb06871.x. [DOI] [PMC free article] [PubMed] [Google Scholar]
- 5.van Gool AJ, et al. The Cockayne syndrome B protein, involved in transcription-coupled DNA repair, resides in an RNA polymerase II-containing complex. EMBO J. 1997;16:5955–5965. doi: 10.1093/emboj/16.19.5955. [DOI] [PMC free article] [PubMed] [Google Scholar]
- 6.Tantin D, Kansal A, Carey M. Recruitment of the putative transcription-repair coupling factor CSB/ERCC6 to RNA polymerase II elongation complexes. Mol Cell Biol. 1997;17:6803–6814. doi: 10.1128/mcb.17.12.6803. [DOI] [PMC free article] [PubMed] [Google Scholar]
- 7.Selby CP, Sancar A. Human transcription-repair coupling factor CSB/ERCC6 is a DNA-stimulated ATPase but is not a helicase and does not disrupt the ternary transcription complex of stalled RNA polymerase II. J Biol Chem. 1997;272:1885–1890. doi: 10.1074/jbc.272.3.1885. [DOI] [PubMed] [Google Scholar]
- 8.Sarker AH, et al. Recognition of RNA polymerase II and transcription bubbles by XPG, CSB, and TFIIH: insights for transcription-coupled repair and Cockayne Syndrome. Mol Cell. 2005;20:187–198. doi: 10.1016/j.molcel.2005.09.022. [DOI] [PubMed] [Google Scholar]
- 9.Laine JP, Egly JM. Initiation of DNA repair mediated by a stalled RNA polymerase IIO. EMBO J. 2006;25:387–397. doi: 10.1038/sj.emboj.7600933. [DOI] [PMC free article] [PubMed] [Google Scholar]
- 10.Fousteri M, Vermeulen W, van Zeeland AA, Mullenders LH. Cockayne syndrome A and B proteins differentially regulate recruitment of chromatin remodeling and repair factors to stalled RNA polymerase II in vivo. Mol Cell. 2006;23:471–482. doi: 10.1016/j.molcel.2006.06.029. [DOI] [PubMed] [Google Scholar]
- 11.Lindsey-Boltz LA, Sancar A. RNA polymerase: the most specific damage recognition protein in cellular responses to DNA damage? Proc Natl Acad Sci U S A. 2007;104:13213–13214. doi: 10.1073/pnas.0706316104. [DOI] [PMC free article] [PubMed] [Google Scholar]
- 12.Saxowsky TT, Doetsch PW. RNA polymerase encounters with DNA damage: transcription-coupled repair or transcriptional mutagenesis? Chem Rev. 2006;106:474–488. doi: 10.1021/cr040466q. [DOI] [PubMed] [Google Scholar]
- 13.Belotserkovskii BP, Mirkin SM, Hanawalt PC. DNA sequences that interfere with transcription: implications for genome function and stability. Chem Rev. 2013;113:8620–8637. doi: 10.1021/cr400078y. [DOI] [PubMed] [Google Scholar]
- 14.Xu L, et al. RNA polymerase II senses obstruction in the DNA minor groove via a conserved sensor motif. Proc Natl Acad Sci U S A. 2016;113:12426–12431. doi: 10.1073/pnas.1612745113. [DOI] [PMC free article] [PubMed] [Google Scholar]
- 15.Sigurdsson S, Dirac-Svejstrup AB, Svejstrup JQ. Evidence that transcript cleavage is essential for RNA polymerase II transcription and cell viability. Mol Cell. 2010;38:202–210. doi: 10.1016/j.molcel.2010.02.026. [DOI] [PMC free article] [PubMed] [Google Scholar]
- 16.Selby CP, Sancar A. Cockayne syndrome group B protein enhances elongation by RNA polymerase II. Proc Natl Acad Sci U S A. 1997;94:11205–11209. doi: 10.1073/pnas.94.21.11205. [DOI] [PMC free article] [PubMed] [Google Scholar]
- 17.Brueckner F, Hennecke U, Carell T, Cramer P. CPD damage recognition by transcribing RNA polymerase II. Science. 2007;315:859–862. doi: 10.1126/science.1135400. [DOI] [PubMed] [Google Scholar]
- 18.Hantsche M, Cramer P. Conserved RNA polymerase II initiation complex structure. Curr Opin Struct Biol. 2017;47:17–22. doi: 10.1016/j.sbi.2017.03.013. [DOI] [PubMed] [Google Scholar]
- 19.Xu L, et al. RNA polymerase II transcriptional fidelity control and its functional interplay with DNA modifications. Crit Rev Biochem Mol Biol. 2015;50:503–519. doi: 10.3109/10409238.2015.1087960. [DOI] [PMC free article] [PubMed] [Google Scholar]
- 20.Martinez-Rucobo FW, Cramer P. Structural basis of transcription elongation. Biochim Biophys Acta. 2013;1829:9–19. doi: 10.1016/j.bbagrm.2012.09.002. [DOI] [PubMed] [Google Scholar]
- 21.Thoma NH, et al. Structure of the SWI2/SNF2 chromatin-remodeling domain of eukaryotic Rad54. Nat Struct Mol Biol. 2005;12:350–356. doi: 10.1038/nsmb919. [DOI] [PubMed] [Google Scholar]
- 22.Liu X, Li M, Xia X, Li X, Chen Z. Mechanism of chromatin remodelling revealed by the Snf2-nucleosome structure. Nature. 2017;544:440–445. doi: 10.1038/nature22036. [DOI] [PubMed] [Google Scholar]
- 23.Ehara H, et al. Structure of the complete elongation complex of RNA polymerase II with basal factors. Science. 2017;357:921–924. doi: 10.1126/science.aan8552. [DOI] [PubMed] [Google Scholar]
- 24.Li W, Giles C, Li S. Insights into how Spt5 functions in transcription elongation and repressing transcription coupled DNA repair. Nucleic Acids Res. 2014;42:7069–7083. doi: 10.1093/nar/gku333. [DOI] [PMC free article] [PubMed] [Google Scholar]
- 25.Jansen LE, et al. Spt4 modulates Rad26 requirement in transcription-coupled nucleotide excision repair. EMBO J. 2000;19:6498–6507. doi: 10.1093/emboj/19.23.6498. [DOI] [PMC free article] [PubMed] [Google Scholar]
- 26.Charlet-Berguerand N, et al. RNA polymerase II bypass of oxidative DNA damage is regulated by transcription elongation factors. EMBO J. 2006;25:5481–5491. doi: 10.1038/sj.emboj.7601403. [DOI] [PMC free article] [PubMed] [Google Scholar]
- 27.Muftuoglu M, et al. Cockayne syndrome group B protein has novel strand annealing and exchange activities. Nucleic Acids Res. 2006;34:295–304. doi: 10.1093/nar/gkj410. [DOI] [PMC free article] [PubMed] [Google Scholar]
- 28.Bernecky C, Herzog F, Baumeister W, Plitzko JM, Cramer P. Structure of transcribing mammalian RNA polymerase II. Nature. 2016;529:551–554. doi: 10.1038/nature16482. [DOI] [PubMed] [Google Scholar]
- 29.Deaconescu AM, et al. Structural basis for bacterial transcription-coupled DNA repair. Cell. 2006;124:507–520. doi: 10.1016/j.cell.2005.11.045. [DOI] [PubMed] [Google Scholar]
- 30.Li CL, et al. Tripartite DNA Lesion Recognition and Verification by XPC, TFIIH, and XPA in Nucleotide Excision Repair. Mol Cell. 2015;59:1025–1034. doi: 10.1016/j.molcel.2015.08.012. [DOI] [PMC free article] [PubMed] [Google Scholar]
- 31.Wang D, Bushnell DA, Westover KD, Kaplan CD, Kornberg RD. Structural basis of transcription: role of the trigger loop in substrate specificity and catalysis. Cell. 2006;127:941–954. doi: 10.1016/j.cell.2006.11.023. [DOI] [PMC free article] [PubMed] [Google Scholar]
- 32.Wang L, et al. Molecular basis for 5-carboxycytosine recognition by RNA polymerase II elongation complex. Nature. 2015;523:621–625. doi: 10.1038/nature14482. [DOI] [PMC free article] [PubMed] [Google Scholar]
- 33.Kireeva ML, Komissarova N, Waugh DS, Kashlev M. The 8-nucleotide-long RNA:DNA hybrid is a primary stability determinant of the RNA polymerase II elongation complex. J Biol Chem. 2000;275:6530–6536. doi: 10.1074/jbc.275.9.6530. [DOI] [PubMed] [Google Scholar]
- 34.Suloway C, et al. Automated molecular microscopy: the new Leginon system. J Struct Biol. 2005;151:41–60. doi: 10.1016/j.jsb.2005.03.010. [DOI] [PubMed] [Google Scholar]
- 35.Plaschka C, et al. Transcription initiation complex structures elucidate DNA opening. Nature. 2016;533:353–358. doi: 10.1038/nature17990. [DOI] [PubMed] [Google Scholar]
- 36.Plaschka C, et al. Architecture of the RNA polymerase II-Mediator core initiation complex. Nature. 2015;518:376–380. doi: 10.1038/nature14229. [DOI] [PubMed] [Google Scholar]
- 37.Zheng SQ, et al. MotionCor2: anisotropic correction of beam-induced motion for improved cryo-electron microscopy. Nat Methods. 2017;14:331–332. doi: 10.1038/nmeth.4193. [DOI] [PMC free article] [PubMed] [Google Scholar]
- 38.Mindell JA, Grigorieff N. Accurate determination of local defocus and specimen tilt in electron microscopy. J Struct Biol. 2003;142:334–347. doi: 10.1016/s1047-8477(03)00069-8. [DOI] [PubMed] [Google Scholar]
- 39.Voss NR, Yoshioka CK, Radermacher M, Potter CS, Carragher B. DoG Picker and TiltPicker: software tools to facilitate particle selection in single particle electron microscopy. J Struct Biol. 2009;166:205–213. doi: 10.1016/j.jsb.2009.01.004. [DOI] [PMC free article] [PubMed] [Google Scholar]
- 40.Scheres SH. RELION: implementation of a Bayesian approach to cryo-EM structure determination. J Struct Biol. 2012;180:519–530. doi: 10.1016/j.jsb.2012.09.006. [DOI] [PMC free article] [PubMed] [Google Scholar]
- 41.Bharat TA, Scheres SH. Resolving macromolecular structures from electron cryo-tomography data using subtomogram averaging in RELION. Nat Protoc. 2016;11:2054–2065. doi: 10.1038/nprot.2016.124. [DOI] [PMC free article] [PubMed] [Google Scholar]
- 42.Roseman AM. FindEM–a fast, efficient program for automatic selection of particles from electron micrographs. J Struct Biol. 2004;145:91–99. doi: 10.1016/j.jsb.2003.11.007. [DOI] [PubMed] [Google Scholar]
- 43.Lander GC, et al. Appion: an integrated, database-driven pipeline to facilitate EM image processing. J Struct Biol. 2009;166:95–102. doi: 10.1016/j.jsb.2009.01.002. [DOI] [PMC free article] [PubMed] [Google Scholar]
- 44.Kimanius D, Forsberg BO, Scheres SH, Lindahl E. Accelerated cryo-EM structure determination with parallelisation using GPUs in RELION-2. Elife. 2016;5 doi: 10.7554/eLife.18722. [DOI] [PMC free article] [PubMed] [Google Scholar]
- 45.Cianfrocco MA, Leschziner AE. Low cost, high performance processing of single particle cryo-electron microscopy data in the cloud. Elife. 2015;4 doi: 10.7554/eLife.06664. [DOI] [PMC free article] [PubMed] [Google Scholar]
- 46.Kettenberger H, Armache KJ, Cramer P. Complete RNA polymerase II elongation complex structure and its interactions with NTP and TFIIS. Mol Cell. 2004;16:955–965. doi: 10.1016/j.molcel.2004.11.040. [DOI] [PubMed] [Google Scholar]
- 47.Scheres SH, Chen S. Prevention of overfitting in cryo-EM structure determination. Nat Methods. 2012;9:853–854. doi: 10.1038/nmeth.2115. [DOI] [PMC free article] [PubMed] [Google Scholar]
- 48.Henderson R, et al. Outcome of the first electron microscopy validation task force meeting. Structure. 2012;20:205–214. doi: 10.1016/j.str.2011.12.014. [DOI] [PMC free article] [PubMed] [Google Scholar]
- 49.Chen S, et al. High-resolution noise substitution to measure overfitting and validate resolution in 3D structure determination by single particle electron cryomicroscopy. Ultramicroscopy. 2013;135:24–35. doi: 10.1016/j.ultramic.2013.06.004. [DOI] [PMC free article] [PubMed] [Google Scholar]
- 50.Bai XC, Rajendra E, Yang G, Shi Y, Scheres SH. Sampling the conformational space of the catalytic subunit of human gamma-secretase. Elife. 2015;4 doi: 10.7554/eLife.11182. [DOI] [PMC free article] [PubMed] [Google Scholar]
- 51.Rohou A, Grigorieff N. CTFFIND4: Fast and accurate defocus estimation from electron micrographs. J Struct Biol. 2015;192:216–221. doi: 10.1016/j.jsb.2015.08.008. [DOI] [PMC free article] [PubMed] [Google Scholar]
- 52.Punjani A, Rubinstein JL, Fleet DJ, Brubaker MA. cryoSPARC: algorithms for rapid unsupervised cryo-EM structure determination. Nat Methods. 2017;14:290–296. doi: 10.1038/nmeth.4169. [DOI] [PubMed] [Google Scholar]
- 53.Wang RY, et al. Automated structure refinement of macromolecular assemblies from cryo-EM maps using Rosetta. Elife. 2016;5 doi: 10.7554/eLife.17219. [DOI] [PMC free article] [PubMed] [Google Scholar]
- 54.Song Y, et al. High-resolution comparative modeling with RosettaCM. Structure. 2013;21:1735–1742. doi: 10.1016/j.str.2013.08.005. [DOI] [PMC free article] [PubMed] [Google Scholar]
- 55.DiMaio F, et al. Atomic-accuracy models from 4.5-A cryo-electron microscopy data with density-guided iterative local refinement. Nat Methods. 2015;12:361–365. doi: 10.1038/nmeth.3286. [DOI] [PMC free article] [PubMed] [Google Scholar]
- 56.Soding J, Biegert A, Lupas AN. The HHpred interactive server for protein homology detection and structure prediction. Nucleic Acids Res. 2005;33:W244–248. doi: 10.1093/nar/gki408. [DOI] [PMC free article] [PubMed] [Google Scholar]
- 57.Barnes CO, et al. Crystal Structure of a Transcribing RNA Polymerase II Complex Reveals a Complete Transcription Bubble. Mol Cell. 2015;59:258–269. doi: 10.1016/j.molcel.2015.06.034. [DOI] [PMC free article] [PubMed] [Google Scholar]
- 58.Adams PD, et al. PHENIX: a comprehensive Python-based system for macromolecular structure solution. Acta Crystallogr D Biol Crystallogr. 2010;66:213–221. doi: 10.1107/S0907444909052925. [DOI] [PMC free article] [PubMed] [Google Scholar]
- 59.Chen VB, et al. MolProbity: all-atom structure validation for macromolecular crystallography. Acta Crystallogr D Biol Crystallogr. 2010;66:12–21. doi: 10.1107/S0907444909042073. [DOI] [PMC free article] [PubMed] [Google Scholar]
- 60.Pettersen EF, et al. UCSF Chimera–a visualization system for exploratory research and analysis. J Comput Chem. 2004;25:1605–1612. doi: 10.1002/jcc.20084. [DOI] [PubMed] [Google Scholar]
- 61.Pintilie GD, Zhang J, Goddard TD, Chiu W, Gossard DC. Quantitative analysis of cryo-EM density map segmentation by watershed and scale-space filtering, and fitting of structures by alignment to regions. J Struct Biol. 2010;170:427–438. doi: 10.1016/j.jsb.2010.03.007. [DOI] [PMC free article] [PubMed] [Google Scholar]
- 62.Barad BA, et al. EMRinger: side chain-directed model and map validation for 3D cryo-electron microscopy. Nat Methods. 2015;12:943–946. doi: 10.1038/nmeth.3541. [DOI] [PMC free article] [PubMed] [Google Scholar]
Associated Data
This section collects any data citations, data availability statements, or supplementary materials included in this article.
Supplementary Materials
Data Availability Statement
Cryo-EM maps have been deposited in the EM Data Bank, with the following accession numbers: higher-resolution (4.5 Å) Pol II EC-Rad26 (EMDB: EMD-8736); final map for Pol II EC-Rad26 (EMDB: EMD-8735); Locally filtered version of EMDB-8735 (EMDB: EMDB-7038). Pol II EC (EMDB: EMD-8737); and Pol II EC (CPD) (EMDB: EMD-8885). The atomic models have been deposited in the Protein Data Bank, with the following accession numbers: Pol II EC-Rad26 complex (PDB ID: 5VVR); and Pol II EC complex (PDB ID: 5VVS).