

Summary
Diverse subsets of cortical interneurons play vital roles in higher-order brain functions. To investigate how this diversity is generated, we used single cell RNA-seq to profile the transcriptomes of murine cells collected along a developmental timecourse. Heterogeneity within mitotic progenitors in the ganglionic eminences is driven by a highly conserved maturation trajectory, alongside eminence-specific transcription factor expression that seeds the emergence of later diversity. Upon becoming postmitotic, progenitors diverge and differentiate into transcriptionally distinct states, including an interneuron precursor state. By integrating datasets across developmental timepoints, we identified shared sources of transcriptomic heterogeneity between adult interneurons and their precursors, revealing the embryonic emergence of interneuron cardinal subtypes. Our analysis revealed that the ASD-associated transcription factor Mef2c delineates early Pvalb-precursors, and is essential for their development. These findings shed new light on the molecular diversification of early inhibitory precursors, and identify gene modules that may influence the specification of human subtypes.
Introduction
Cortical interneurons are inhibitory cells that vary widely in morphology, connectivity and patterns of activity1. This diverse group of neurons is developmentally derived from progenitors residing in embryonic proliferative zones known as the medial, caudal and lateral ganglionic eminences (MGE, CGE, LGE, respectively)1. While each eminence gives rise to non-overlapping types of interneurons, the genetic programs driving interneuron fate specification and maintenance are not well understood. Diversity is first apparent in the regional expression of a limited number of transcription factors within the ganglionic eminences (GEs)2,3. For example, Nkx2.1 is a transcription factor expressed throughout the entire MGE, but is not expressed in the CGE or LGE4, whereas the transcription factor Lhx8 is expressed only within a subdomain of the MGE2. However, it remains unclear how these early sources of heterogeneity generate the vast diversity of adult interneurons, a question that is complicated by the fact that the GEs also generate numerous subcortical projection neuron types such as the cholinergic cells of the basal ganglia5,6.
Here, we combine multiple single cell RNA-sequencing approaches (scRNA-seq) with genetic fate mapping techniques to explore the emergence of cellular heterogeneity during early mouse development. Within mitotic progenitors, we found a highly conserved maturation trajectory, accompanied by eminence-specific transcription factor expression that seeds the emergence of later cell diversity. Alongside the exit from the cell cycle, we reconstructed bifurcations into three distinct precursor states, which were highly correlated across eminences, and included a cortical interneuron ground state. Lastly, guided by the genetic diversity seen in mature populations, we connected the transcriptomic heterogeneity of adult interneurons with their embryonic precursors. Our integrated longitudinal analysis reveals the emergence of interneuron subtype identity during development, and identifies genetic regulators responsible for these fate decisions.
RESULTS
Transcriptional profiling of GE cells
We manually dissected the embryonic day (E)13.5 MGE or E14.5 CGE and LGE from wild type mouse embryos, timepoints corresponding to peak neurogenesis in these structures7,8, which include both dividing mitotic progenitors as well as postmitotic precursor cells (Fig. 1A; Supplementary Table 1). After cell dissociation, we utilized Drop-seq9 to sequence the transcriptomes of 5,622 single cells from the MGE, 7,401 from the CGE, and 8,543 from the LGE, from replicate experiments, observing on average 1626 UMI/cell. We performed latent variable regression to mitigate heterogeneity resulting from cell-cycle state10,11 (Extended Data Fig. 1), preventing subsequent analysis from being dominated by mitotic phase-specific gene expression, and filtered out rare contaminating populations of excitatory neurons (Neurod6; 2.6% of cells) and endothelial cells (Igfbp7; 0.7% of cells) (Fig. 1B, C). The remaining 96.7% of cells were GE-derived neuronal progenitors and precursors (e.g., Dlx1; Fig. 1B, C). Within this population, the expression of early, intermediate, and late marker genes was strongly associated with the top diffusion map coordinates (DMC; Extended Data Fig. 1). To establish a quantitative temporal account of differentiation programs within each eminence, we fit a principal curve through the DMC, representing an ordered ‘maturation trajectory’ (MT) for single-cells based on their expression profiles12 (Fig. 1D). We obtained very similar trajectories using approaches based on PCA or reverse graph embedding (Extended Data Fig. 1)13, and observed that MT recapitulated known dynamics associated with neuronal maturation (Fig. 1E) while also segregating GE cells into ‘mitotic’ and ‘postmitotic’ phases (Fig. 1F, Extended Data Fig. 1). To independently confirm the association of MT with real time, we utilized FlashTag technology14 to fluorescently label cells in the ventricular zone (VZ)15 of the GEs, and performed scRNA-seq on cohorts of 3, 6, 12 and 24 hour-old neurons as they migrated away from the ventricle (Fig. 1G). As expected, neurons born at these sequential timepoints were distributed progressively along the MT timeline (Fig. 1H, Extended Data Fig. 1).
Figure 1. Transcriptional landscape of single cells in the ganglionic eminences.

A) Schematic of experimental workflow. Axes: Dorsal (D), Ventral (V), Posterior (P), Anterior (A), Lateral (L), Medial (M).
B) Visualization of Drop-seq of GE precursor data using t-SNE.
C) Canonical marker expression in GE precursors, excitatory neurons, and vascular endothelial cells; Colors as in (B).
D) A principal curve was fitted to the dominant diffusion map coordinates to order cells along a maturation trajectory (MT).
E) Expression (molecules/cell) of canonical regulators, as a function of the position along the MT. Curve reflects local averaging of single cell expression. Locally averaged values were multiplied by five for visualization on the same scale as the molecule counts.
F) Percentage of cycling cells as a function of the position along the MT; The dotted-blue line marks the inferred mitotic to postmitotic transition.
G) Coronal brain sections of the ganglionic eminences, as cells migrate away from the VZ (Ventricular Zone: apical VZ surface top of figures). Images were taken 3, 6, 12 and 24 hours after fluorescent labeling with FlashTag technology. Scale bars = 50 μm.
H) Maturation score distributions of FlashTag labeled cells, separated by timepoint.
The MGE and CGE are known to produce non-overlapping types of cortical interneurons16. To identify regionally expressed transcription factors2,3,17, we performed a differential expression analysis and found a small number of transcription factors enriched in mitotic progenitors within particular eminences (Fig. 2A, Extended Data Fig 2, Supplementary Table 2), many of which (e.g. Nr2f1, Nr2f2, Nkx2-1, etc.) have been previously characterized6. Next, we identified the sequential patterns of gene expression characterizing the initial stages of cell differentiation. Surprisingly, the majority of dynamically expressed genes followed robust and highly reproducible sequential waves of gene expression in all three eminences (Fig. 2B, Extended Data Fig 2D, Supplementary Table 3). In-situ hybridization (ISH) confirmed that these waves describe the sequential expression of stem-cell (e.g. Nes), proneural (e.g., Ascl1), and neurogenic genes (e.g. Dcx; Fig. 2C), roughly correlating with the spatiotemporal progression from the VZ to the mantle zone (MZ) (Extended Data Fig. 3). Developmental progression and cell cycle were the primary sources of transcriptional variance in these progenitors (Supplementary Methods), with maturation proportionally explaining six-fold more variance compared to eminence-of-origin (Fig. 2D).
Figure 2. A common developmental program of gene expression functions in mitotic progenitors of all three GEs.

A) Volcano plots depicting differential gene expression across eminences for early mitotic cells (MS < 0.3). Transcription factors are annotated.
B) Gene expression dynamics in mitotic cells, based on local averaging of single cell data, plotted along MS for all developmentally regulated genes.
C) In-situ hybridization (ISH) patterns of early, intermediate and late MT genes in the GEs that are highly expressed within anatomical boundaries of the Ventricular Zone (VZ), Subventricular Zone (SVZ), and Mantle Zone (MZ), respectively (left); ISH image for Dcx from the Allen Institute31. Scale bars = 50 μm (right).
D) The variance explained individually by a set of annotated factors, relative to the variance explained by the first principal component. Calculated independently for maturation score (MS), cell cycle score (CCS), eminence of origin (Emin), unique molecular identifiers per cell (UMIs/cell), and reads per cell (reads/cell).
To detect potential fate divergence of cells along the MT, we bootstrapped the construction of a minimum spanning tree (MST)18 (Fig. 3A; Supplementary Methods), and summarized the combined result using multi-dimensional scaling. We first observed evidence of clear fate bifurcations as cells become postmitotic, and precursors from all GEs branched into distinct precursor states (Fig. 3B; Supplementary Methods). Sequencing MGE progenitors at significantly higher depth with plate-based scRNA-seq revealed no transcriptomic evidence of similar bifurcations within mitotic cells (Extended Data Fig. 4A-C). Moreover, when we performed the unsupervised branching analysis only in mitotic progenitors, we found no evidence for the specification of distinct interneuron fates. Rather, consistent with our previous MT analysis, heterogeneity was driven primarily by maturation state or cell cycle, which may reflect the existence of mitotic progenitors undergoing direct and indirect neurogenesis within the ventricular and subventricular zones (Extended Data Fig. 4D-F)19. Nonetheless, we cannot fully exclude the possibility of earlier fate-determination in mitotic progenitors.
Figure 3. Postmitotic cells from all eminences pass through distinct precursor states.

A) Multidimensional scaling (MDS) based on the consensus MST.
B) MST traversal assigned cells to the trunk and one of three branches.
C) Quantitative contributions of cells per branch plotted for each GE.
D) Hierarchical clustering of branch gene expression. Gene expression was averaged for cells from the same GE and branch.
E) Heatmap depicting the top transcriptomic markers for each branch.
F) Co-localization of Lhx8-Cre;Ai9 with choline acetyltransferase (ChAT) in the striatum, medial septum, and nucleus basalis, and Pvalb in the globus pallidus (left to right). Scale = 300 μm.
G) Percentage of total ChAT+ cells labeled with tdTomato in Lhx8-Cre;Ai9 mice. n=15 brain sections (striatum), n= 4 (medial septum), n = 8 (nucleus basalis), 2 mice. Error bars in G and H indicate standard deviation across all quantified sections.
H) The percentage of total Pvalb+ cells labeled with tdTomato in Lhx8-Cre;Ai9 mice. n=10 brain sections (striatum), n = 5 (globus pallidus), n = 4 (cortex), 2 mice.
I) Mapping of E18.5 cortical (CX) and subcortical (ST) cells to E13.5/E14.5 branches based on marker gene expression correlations.
J) Relative variance explained individually by annotated factors for postmitotic cells at E13.5/E14.5 (branch, cell cycle score (CCS), eminence of origin (Emin), unique molecular identifiers (UMIs/cell), and reads (reads/cell)) relative to the variance explained by the first principle component. Residual cell cycle variation is due to our conservative cutoff for the mitotic/postmitotic transition.
K) Differential expression analysis between MGE and CGE postmitotic cells in the interneuron precursor state at E13.5/E14.5 (left). These genes tend to remain differentially expressed between MGE and CGE-derived populations at E18.5 (middle), which is not the case in E13.5 mitotic progenitors (right); Differentially expressed genes are depicted in blue.
We assigned cells to branches by traversing the final MST and annotating major splits (Fig. 3B, C). Strikingly, even though branched trajectories for each eminence were calculated independently, branch gene expression markers were highly correlated across eminences (Fig. 3D, E). Hence, although each GE generates different cell populations, upon becoming postmitotic, cells from all eminences pass through conserved precursor states. One group of highly correlated branches (i.e. precursor state 1) expressed known regulators of interneuron development (i.e. Arx, Maf; Fig. 3E; Supplementary Table 4), whereas a second group of branches (i.e. precursor state 2) expressed known projection neuron marker genes (i.e. Isl1, Ebf1; Fig. 3E; Supplementary Table 4). The third group of branches (i.e. precursor state 3) exhibited weaker correlation across eminences, with the transcription factor Lhx8 representing a marker gene for the MGE Branch 3 (Fig. 3E). Genetic ‘fate-mapping’ using Lhx8-Cre suggested that these neurons account for the majority, if not all of the cholinergic projection and interneuron populations within the nucleus basalis, medial septum, and striatum, respectively, as well as the majority of Pvalb-positive projection neurons in the globus pallidus5,6 (Fig. 3F-H Extended Data Fig. 4G).
Diversity emerges from a common precursor state
To confirm that cells passing through precursor state 1 give rise to cortical interneurons, we used genetic fate mapping strategies to enrich for postmitotic GE cells and to collect GE-derived cells at E18.5 for scRNA-seq (Supplementary Methods, Extended Data Fig. 4). Using a correlation-based distance metric (Supplementary Methods) we found that, as expected20, more than 80% of Dlx6a-Cre fate mapped cortical cells at E18.5 mapped to precursor state 1, based on their expression of canonical regulators of interneuron development (Fig. 3I, Extended Data Fig. 5). The remaining Dlx6a-Cre fate mapped cortical population mapped to precursor states 2 and 3 (Fig. 3I, Extended Data Fig. 5), likely including the Meis2-expressing CGE-derived GABAergic population that has been recently described21 (Extended Data Fig. 5). Comparing the expression profiles of cortical interneuron precursors (precursor state 1) from the MGE and CGE revealed differentially expressed genes whose expression patterns are largely maintained in the cortex at later timepoints (Fig. 3K). Consistently, branching trajectories represented the most significant source of variation in these cells, with an increasing contribution attributable to eminence of origin compared to mitotic progenitors (Fig. 3J). Thus, our data reveal how postmitotic pan-eminence transcriptional programs (precursor states) emerge, and in parallel, eminence-specific transcriptional programs escalate.
We next asked when subtype-specific gene expression patterns first appear during interneuron development. In the adult, utilizing a publicly available dataset22,23, we identified 14 inhibitory interneuron subpopulations that encompass known anatomically and physiologically defined subtypes24,25 (Fig. 4A, Supplementary Methods, Extended Data Fig. 6). These could be allocated into non-overlapping cardinal types of cortical interneurons (Pvalb, Sst, Vip, Id2, Th, Nos1, Igfbp6). We reasoned that if we could identify heterogeneous gene modules in developing cells that were shared with adult interneurons, we could identify early patterns of specification in precursors. We therefore applied our recently developed tool for the pairwise integration of scRNA-seq datasets26,27 (Fig. 4B-D), which “aligns” cell types across datasets based on conserved sources of variation, and therefore links the heterogeneity observed in adult cells with heterogeneity in their precursors. Based on this alignment, P10 cells exhibited strong evidence of transcriptomic separation beyond cardinal types, (Fig. 4B), including clear segregation between Sst Martinotti versus non-Martinotti (X94), Vip bipolar versus multipolar, and Id2 neurogliaform versus non-neurogliaform interneuron subtypes (Fig. 4E; Extended Data Fig. 7–9).
Figure 4. Integrating developmental scRNA-seq datasets to link embryonic heterogeneity to adult interneuron subtypes.

A) Graph-based clustering of interneurons from the adult mouse visual cortex (Data from Allen Cell Types Database (2015)22,23).
B-D) Integration of P10 (B), E18.5 (C), E13.5 (D) precursors with P56 cortical interneurons based on shared sources of variation. Upper panel: adult cells colored by subtype and precursors cells in grey. Lower panel: precursor cells colored by adult subtype to which they are assigned.
E) Differentially expressed genes between CGE and MGE derived subsets, that are conserved in both developmental and adult cells (left). Each conserved gene is placed on the heatmap when it is first observed to be differentially expressed during development. Same analysis for Pvalb vs. Sst subsets (middle), and Vip vs. Id2 subsets (right).
F) Conditional deletion of Mef2c in inhibitory neurons using Dlx6a-Cre;Mef2cloxp/loxpRCE . Immunostaining of P20-P22 somatosensory cortex using anti-GFP (green) and anti-Pvalb (red) (DAPI counterstaining shows cortical layers). Scale = 200 μm.
G) Density quantification of cIN subtypes in the P21 somatosensory cortex using antibodies for Pvalb, Sst, Vip, Npy, and calretinin (CR). Error bars reflect s.e of the mean; Two-tailed unpaired t-test, P < 0.01** n= 3 brains each for cKO and control. Error bars reflect s.e of the mean; Two-tailed unpaired t-test, P < 0.01** n= 3 brains each for cKO and control.
H) Scatter plot comparing average expression of GABAergic single nuclei from post-mortem human neurons after segregation into Pvalb and Sst types. Each dot represents the expression of a human gene. Markers of embryonic cardinal types are shown in green or blue dots, with a subset of gene names annotated.
Embryonic stages also displayed strong evidence of interneuron specification. Examining the earliest stages, we observed a separation of Pvalb- and Sst-precursor cells within the E13.5 postmitotic populations (Fig. 4D), and identified transcriptomic markers that were conserved into adulthood (Early marker genes for Pvalb neurons: Mef2c, Erbb4, Plcxd3; Early marker genes for Sst neurons: Sst, Tspan7, Satb1; Fig.4E; Extended Data Figure 7). A minority of E13.5 cells also mapped to Vip and Id2 subsets, but conserved transcriptomic markers did not pass statistical significance until E18.5 (E18.5 markers of Vip neurons: Vip, Synpr, Igf1; E18.5 markers of Id2 neurons: Reln, Mpped1, Id2). By E18, all cardinal types of interneurons could be identified, and additional subtypes appeared to be transcriptionally specified as well (Fig. 4E, Extended Data Fig. 9). Notably, segregation into subtypes became evident at different developmental stages. For example, the clear emergence of Sst, Vip and Id2 subtypes was apparent for a subset of cells at E18.5 (Extended Data Figure 8), but we were unable to clearly subdivide Pvalb neurons by P10, in accordance with their late maturation28. Importantly, the results of our integrated analyses were in agreement with independent unsupervised analysis of each developmental stage (Extended Fig. 8). Consistent with our earlier findings (Fig. 2), we did not observe common sources of variation shared between adult interneurons and mitotic progenitors.
In addition to observing the potential specification of embryonic precursors, our list of cardinal type and subtype markers that are conserved from the ganglionic eminences through adulthood suggests a set of genetic regulators that may play important roles in this process. For example, the transcription factor Mef2c was among the genes discriminating early Pvalb-precursors from other MGE-derived interneuron types (Fig. 4E). Genome-wide association studies have linked mutations in this gene to Alzheimer’s, schizophrenia, and other neurodevelopmental disorders29. Consistent with our predictions, conditional deletion of Mef2c in inhibitory neurons led to a specific loss of Pvalb-interneurons by P20 in cortical layers 2-6 (Fig. 4F-G; Extended Data Fig. 10), indicating that Mef2c is essential for the generation of this population. Intriguingly, when examining a published single nucleus RNA-seq (DroNc-seq) dataset of human post-mortem tissue30, we found that a subset of embryonic cardinal type markers from our mouse dataset (including Mef2c) was also differentially expressed in adult human interneurons, (Fig. 4H). Therefore, the genes we identified as defining embryonic cardinal types are candidates for regulating interneuron fate determination and maintenance across species.
DISCUSSION
Our work reveals how subtype specific heterogeneity progresses from the expression of cardinal genes in progenitors to the emergence of specific subtypes that populate the mature cortex. Postmitotic cells in the ganglionic eminences branch into distinct precursor states, representing populations fated to give rise to interneurons or projection neurons. It seems probable that the superimposition of precursor state genes and eminence-specific genes coordinately act to bestow both the common and unique characteristics within particular GABAergic populations, respectively.
Thus, precursor genes likely direct the developmental cascade and acquisition of general properties that are shared within a given type. This likely ensures, for instance, that interneurons migrate tangentially to the cortex or hippocampus, while projection neurons remain positioned ventrally and form long range projections. Supplementing these more general programs are the eminence-specific genes that, for example, may direct the axons of parvalbumin cortical interneurons to form perisomal baskets and the efferents of somatostatin cortical interneurons to reliably target dendrites. These distinct differentiation modules are reflective of the four major cardinal types of cortical interneuron precursors.
The identification of early precursors offers insight into how specific cell types emerge and provides genetic access to immature cortical interneuron subtypes. Broadening the implications of these results, our findings indicate that components of the transcriptional networks underlying interneuron fate specification are conserved between mouse and human, including Mef2c and other genes associated with neuropsychiatric disorders. This highlights the power of combining single cell genomics with analytical tools to identify genes that play important functional roles in the establishment and maintenance of interneuron fates. Our findings mark an initial but important step towards the goal of ultimately linking specific genes to their etiology in neurodevelopmental and neuropsychiatric disorders.
Extended Data
Extended Data Figure 1. Ordering cells along a maturation trajectory.

A) Diffusion map analysis of eminence datasets suggests a pan-eminence developmental continuum. Each eminence was analyzed independently, revealing nearly identical patterns. Cells are colored according to the expression of canonical regulators.
B) Using PCA to reconstruct developmental maturation returns nearly identical results to the diffusion map analysis in Fig. 1. PCA was calculated for all eminences independently, and cells are colored by their expression of canonical markers.
C) Eigenvalues for the two dimensionality reduction methods. We observe a significant eigenvalue drop-off after the initial components, demonstrating that the majority of the variance is captured in the first few dimensions.
D) Single-cell heat-map showing scaled expression levels of top genes that were correlated with ‘cell cycle’ score. Cells on the x-axis are sorted by cell cycle score. Negative scores correspond to cells in S-phase, positive scores correspond to cells in G2/M-phase.
E) Scatter plot illustrating the relationship between MS and cell cycle score for all cells in the dataset. Each dot corresponds to a single cell. Early progenitors span a wide range of cell cycle states, while late cells do not express G2/M or S-phase specific genes and express postmitotic genes.
F) Expression of canonical marker genes as a function of ‘pseudotime’, as calculated with Monocle213. Monocle2 pseudotime was strongly correlated with our maturation trajectory (both pearson and spearman R=0.94).
Diffusion map (G) and maturation trajectory (H) analysis of 1,099 single cells obtained from FlashTag animals, and sequenced using a custom version of the Smart-seq2 protocol (Supplementary Methods). Cells are colored by their expression of canonical markers, which exhibit dynamics that are concurrent with the maturation trajectory learned from the Drop-seq data.
(I-J) Relationship between the maturation trajectory and cell cycle scores derived from the FlashTag datasets replicates our observations from Drop-seq. Therefore, our FlashTag maturation trajectory serves as complementary validation of our Drop-seq maturation trajectory, and exhibits strong association with biological time.
Extended Data Figure 2. Enrichment of differentially expressed genes in the MGE, CGE and LGE.

A) Schematic of embryonic brain sections at E13.5/E14.5. One sagittal section shows the MGE and LGE next to one another, while the other shows the CGE. B) In Situ Hybridization (ISH) images from the Allen Brain Institute Developing Mouse Brain Atlas at E13.5 for genes that our analysis identified as being differentially expressed between the eminences31. For each gene, ISH images are shown for the MGE, CGE, and LGE. C) Temporal dynamics for DE genes in early mitotic cells. Curves represent local averaging of single cell expression, as a function of progression along the maturation trajectory, for each eminence independently. Grey area indicates 95% confidence interval. Genes are selected from the differentially expressed genes in early mitotic cells (Figure 2A). D) Gene expression dynamics in mitotic cells, based on local averaging of single cell data, plotted along MS for select developmentally regulated genes.
Extended Data Figure 3. Enrichment of dynamically expressed genes in the VZ, SVZ and MZ.

A) Schematic of an embryonic brain section at E13.5/E14.5. The location of the ventricular zone (VZ) and mantle zone (MZ) is indicated. B) Sagittal ISH images from the Allen Brain Institute Developing Mouse Brain Atlas at E13.531. Genes are ordered from lowest to highest maturation score (MS) rank. The trend overall shows that genes with peak expression at low MS tend to have higher expression in the VZ, and as MS rank increases the expression pattern shifts to the subventricular zone (SVZ) and then to the MZ; Image credit: Allen Institute.
Extended Data Figure 4. Fate divergence occurs as cells become postmitotic.

A) Supervised analysis: PCA of full dataset, run using only branch-dependent genes. Cells are grouped based on the MT bin: the first 5 bins represent mitotic progenitors, the last four bins represent postmitotic cells which are colored by branch ID. Mitotic cells fall within a homogeneous point cloud, with low variance on PC1 and PC2, showing no evidence of fate bifurcation.
B) To test if our inability to detect fate bifurcations earlier in development was due to the lower sequencing depth of Drop-seq, we sequenced 400 Dlx6a-Cre;RCEloxP negative GE cells (thereby enriching for mitotic progenitors), using a modified Smart-seq2 protocol. Diffusion map analysis of these cells returned only two significant principal components, with no evidence of further structure. These components reflect our previously defined maturation trajectory, with DMC1 separating mitotic cells (left).
C) Rare mitotic cells expressing canonical branch markers do not segregate on the diffusion plot.
D-F) Branching analysis on mitotic progenitors. We repeated the branch analysis, previously computed on postmitotic cells (Figure 3A), on mitotic progenitors from all three ganglionic eminences. While we did observe computational evidence of branching, this does not represent fate bifurcations as we observed in postmitotic cells. Instead, cells from different branches could largely be separated into ‘early’, ‘intermediate’, and ‘late’ regions of mitotic pseudotime, with one branch being largely defined by the expression of pro-neural cell cycle regulators (e.g. Ascl1). As these genes peak at intermediate stages, our branching patterns could reflect either the aberrant assignment of intermediate cells to a new branch, or reflect the potential of multiple modes of cell division (namely, direct vs. indirect neurogenesis) occurring in the VZ and SVZ.
G) Genetic fate mapping using Lhx8-Cre/cerulean demonstrates that MGE branch three precursors give rise to the entire breadth of cholinergic projection (Globus Pallidus and Nucleus Basalis) and interneuron (striatum) populations. The cumulative longitudinal use of a constitutive Cre driver also results in extensive labeling of cortical interneurons due to transient expression within this population. Scale = 500 μm; Ctx, Cortex; Str, Striatum; LS, Lateral Septum; MS, Medial Septum; NP, Nucleus Basalis; GP, Globus Pallidus.
H) Our Lhx6-GFP-negative dataset contains both mitotic and postmitotic cells from the CGE and diffusion map analysis shows our previously defined maturation trajectory.
I-J) To isolate postmitotic cells, we calculated a maturation trajectory, and used the cell cycle scores to identify the transition point between mitotic/postmitotic cells as with the eminence datasets in Figure 1.
K) To avoid the possibility of FACS false negative MGE cells contaminating our Lhx6-GFP-negative dataset, we clustered the postmitotic cells from this dataset, and filtered out three rare clusters where Lhx6 mRNA expression was detected in more than 20% of cells (Supplementary Methods).
L-M) We mapped postmitotic cells from the Lhx6-GFP-positive and Lhx6-GFP-negative datasets to the branches determined from the Drop-seq dataset (Supplementary Methods). Heatmaps show scaled single cell expression markers associated with each branch.
N) Analogous to Figure 3E, but also including the Lhx6-GFP-positive and Lhx6-GFP-negative datasets generated using 10X Genomics, as a validation of the original Drop-seq datasets that were performed on WT mice.
Extended Data Figure 5. Filtering of E18 and P10 10x datasets and mapping of E18.5 cortex and subcortex neurons to E13.5/E14.5 branches.
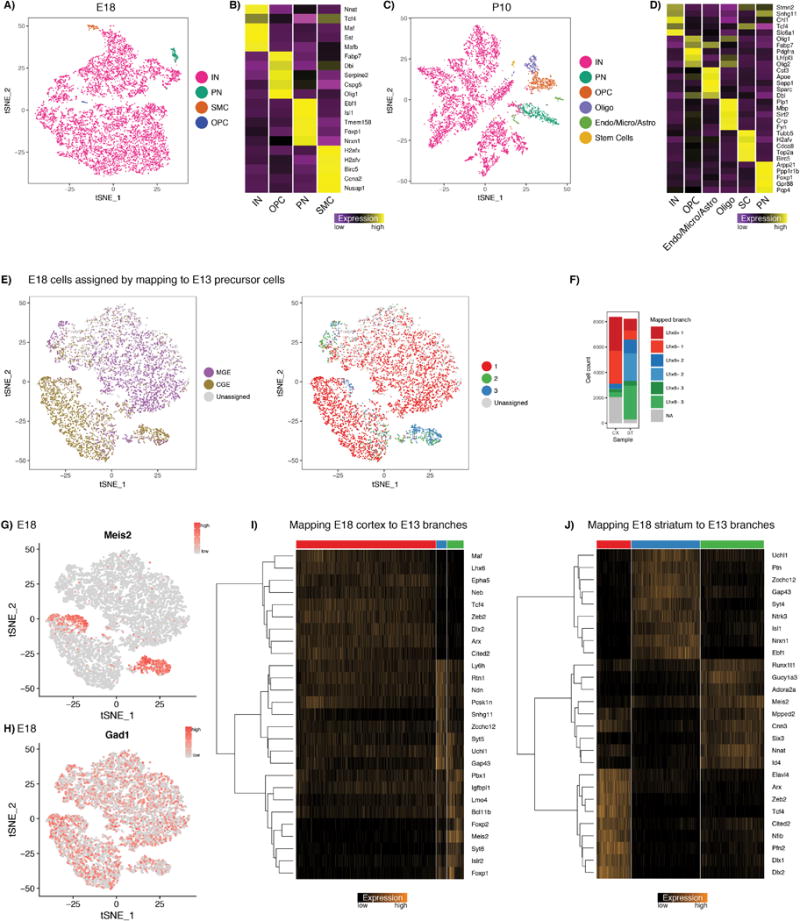
A,C) tSNE visualization of Dlx6a-Cre;RCEloxP positive E18.5 cortical cells, and Dlx6a-Cre;RCEloxP positive P10 cortical cells. Though the Dlx6a-Cre should mark only GABAergic eminence-derived cells, we identified rare populations that did not express canonical interneuron (IN) markers, likely representing false positives from FACS. B, D) Gene expression in these populations (heatmap shows average expression in group), identifies rare contaminating populations of microglia (micro), astrocytes (Astro), oligodendrocyte precursor cells (OPCs) and oligodendrocytes (Oligo); smooth muscle cells (SMC), stem cells (SC). For all downstream analyses, we considered only cells in the IN cluster.
E) tSNE visualization of 8,382 Dlx6a-Cre; RCEloxP positive E18.5 cortical cells (same dataset as in Supplementary Figure 5A, but after removing contaminating populations). Each E18.5 cell was mapped to one of six precursor states (branch 1, 2, and 3 for Lhx6-GFP-positive and Lhx6-GFP-negative datasets), using a correlation-based distance metric (Supplementary Methods). This enabled us to assign a putative eminence and branch of origin for each of the E18.5 cortical cells.
F) As expected, the vast majority of Dlx6a-Cre;RCEloxP positive E18.5 cortical cells map to the interneuron precursor state, and are split between MGE and CGE-derived precursors. By contrast, Dlx6a-Cre;RCEloxP positive E18.5 cells from the subcortex primarily map to branch 2 and 3, consistent with our interpretation of these branches as precursor states for projection neurons; CX, Cortex; ST, Subcortex.
G, H) The minority of Dlx6a-positive cortical cells mapping to precursor states 2 and 3 primarily co-express Gad1 and Meis2, likely representing a CGE-derived GABAergic population. These cells have been recently described as being present in the cortical white matter and likely represent projection neuron precursors21.
I) Heatmap showing single-cell expression markers for the three different mapped branches of Dlx6a-Cre;RCEloxP positive E18.5 cortical cells.
J) Heatmap showing single-cell expression markers for the three different mapped branches of Dlx6a-Cre;RCEloxP positive E18.5 cells from the subcortex.
Extended Data Figure 6. Clustering of adult visual cortical neurons into 14 major non-overlapping inhibitory interneuron subtypes.

A) Initial tSNE visualization and graph-based clustering of 8,329 single cells individually isolated from P56 mouse visual cortex and sequenced with the Smart-Seq2 protocol. Data was downloaded from the publicly available resource hosted by the Allen Brain Atlas22, 23.
B) Of all cells, 3,432 GABAergic interneurons were easily identified by the expression of Gad1 and depletion of Slc17a7, and were selected for downstream analysis.
C) tSNE visualization and graph-based clustering of the 3,432 GABAergic cells reveals 14 clusters, which could be broadly grouped into cardinal types based on the expression of canonical markers (D, E).
F) Single cell heatmap showing scaled expression values for the best transcriptomic markers in each cluster.
Extended Data Figure 7. Emergence of transcriptomically defined subtypes across development.

(Left) Differentially expressed (DE) genes between MGE and CGE derived subsets, that are conserved in both developmental and P56 cells. Each conserved gene is placed on the heatmap when it is first observed to be DE during development, and the number of conserved DE genes grow over time. Same analysis for Pvalb vs. Sst subsets (Middle), and Vip vs. Id2 subsets (Right). This Figure is identical to Figure 4E, but with all gene names displayed.
Extended Data Figure 8. The integrated analysis agrees with an independent tSNE analysis of each timepoint.

A) tSNE visualizations of interneuron precursors from E13.5, E18.5, and P10, calculated independently for each timepoint. Cells are colored as in Figure 4B-D, based on their mapping to P56 datasets in integrated analysis. However, since the tSNE was performed separately for each timepoint, we can assess how the integrated analysis agrees with an independent analysis of each timepoint. In each case, we can see that the ‘cardinal type’ separation we observe via integrated analysis (Figure 4B-D) is consistent with an independent analysis of each dataset. Integrated analysis with the P56 dataset results in clearer separation, and enables us to map developmental precursors to adult subtypes.
B) Expression of Gad1 and Meis2 in single cell datasets. Cells expressing both genes are likely projection neuron precursors that have recently been described in the CGE21, but whose progeny is not captured in the mouse visual cortex dataset. Therefore, these cells are correctly mapped as ‘unassigned’.
Extended Data Figure 9. Transcriptional segregation into cortical interneuron subtypes at different developmental stages.

A) tSNE visualization of all P10 cells mapping to a P56 subtype (as in right column of Figure 4B, but cells are colored by subtype instead of cardinal type).
B) tSNE visualization as in (A), but zoomed in on each cardinal type independently. C) Single cell heatmaps showing the best transcriptomic markers marking each subtype, for the Sst, Vip, and Id2 cardinal types, within P10 cells. We did not observe any statistically significant markers subdividing Pvalb subtypes.
D) tSNE visualization of all E18.5 cells mapping to a P56 subtype (as in right column of Figure 4C, but cells are colored by subtype instead of cardinal type).
E) tSNE visualization as in (D), but zoomed in on each cardinal type independently.
F) Single cell heatmaps showing the best transcriptomic markers marking each subtype, for the Sst, Vip, and Id2 cardinal types, within E18.5 cells. We did not observe any statistically significant markers subdividing Pvalb subtypes.
Extended Data Figure 10. A subset of embryonic markers of cardinal type specification in mouse are conserved in adult human neurons.

A) Quantification of Pvalb-positive cIN across the different cortical layers of the control and Mef2c cKO (Dlx6a-Cre;Mef2cloxp/loxpRCE) animals. Mef2c cKO results in a reduction in Pvalb density in all cortical layers except for layer 1; Error bars reflect s.e of the mean; Unpaired t-test; P < 0.05 *, P < 0.01**, P < 0.001 *** n= 4 brains each for cKO and control, 3-4 sections per brain.
(B-D) Scatter plot comparing average expression of 3,035 GABAergic single nuclei from post-mortem human neurons, after segregation into Pvalb and Sst (B), Vip, and Id2 types (C) and MGE vs. CGE inferred origins (D). Each dot represents the expression of a gene in human cells. Markers of transcriptomic cardinal types from our E13.5 and E18.5 datasets (from Figure 4E) are shown in red or blue dots. Mouse embryonic markers that also differ by 1.5-fold in human have gene names annotated on the plot.
Supplementary Material
Acknowledgments
We thank members of the Fishell and Satija Labs, and Claude Desplan, for valuable feedback and discussion, Lana Harshman, Bernadette Bracken, and William Stephenson for assistance with scRNA-seq experiments, and Naomi Habib for assistance with published datasets. This work was supported by NIH R01 NS074972 (GF), R01s NS081297 (GF), MH071679-12 (GF & RS), NIH DP2-HG-009623 (RS), EMBO ALTF 1295-2012 (CM), DFG Postdoctoral Fellow (CH), NIH F30MH114462 (RCB), T32GM007308 (RCB), NIH F31NS103398 (KA), and NSF DGE1342536 (AB). GF is also support by a grant from the Simons foundation.
Footnotes
Supplementary Information available online.
Author Contributions
CM, CH, RCB, GF, and RS conceived the research. CM and RCB led experimental work, assisted by RBB, XJ, KA, and supervised by GF. CH led computational analysis, assisted by CM and AB, and supervised by RS. All authors participated in interpretation and writing the manuscript.
Author Information
The authors declare no competing financial interests.
DATA AVAILABILITY
All source data, including sequencing reads and single cell expression matrices, is available from the Gene Expression Omnibus (GEO) under accession GSE104158.
References
- 1.Kepecs A, Fishell G. Interneuron cell types are fit to function. Nature. 2014;505:318–326. doi: 10.1038/nature12983. [DOI] [PMC free article] [PubMed] [Google Scholar]
- 2.Flames N, et al. Delineation of multiple subpallial progenitor domains by the combinatorial expression of transcriptional codes. J Neurosci. 2007;27:9682–9695. doi: 10.1523/JNEUROSCI.2750-07.2007. [DOI] [PMC free article] [PubMed] [Google Scholar]
- 3.Yun K, Garel S, Fischman S, Rubenstein JLR. Patterning of the lateral ganglionic eminence by the Gsh1 and Gsh2 homeobox genes regulates striatal and olfactory bulb histogenesis and the growth of axons through the basal ganglia. J Comp Neurol. 2003;461:151–165. doi: 10.1002/cne.10685. [DOI] [PubMed] [Google Scholar]
- 4.Shimamura K, Hartigan DJ, Martinez S, Puelles L, Rubenstein JL. Longitudinal organization of the anterior neural plate and neural tube. Development. 1995;121:3923–3933. doi: 10.1242/dev.121.12.3923. [DOI] [PubMed] [Google Scholar]
- 5.Nóbrega-Pereira S, et al. Origin and molecular specification of globus pallidus neurons. J Neurosci. 2010;30:2824–2834. doi: 10.1523/JNEUROSCI.4023-09.2010. [DOI] [PMC free article] [PubMed] [Google Scholar]
- 6.Zhao Y, et al. The LIM-homeobox gene Lhx8 is required for the development of many cholinergic neurons in the mouse forebrain. Proc Natl Acad Sci USA. 2003;100:9005–9010. doi: 10.1073/pnas.1537759100. [DOI] [PMC free article] [PubMed] [Google Scholar]
- 7.Inan M, Welagen J, Anderson SA. Spatial and temporal bias in the mitotic origins of somatostatin- and parvalbumin-expressing interneuron subgroups and the chandelier subtype in the medial ganglionic eminence. Cereb Cortex. 2012;22:820–827. doi: 10.1093/cercor/bhr148. [DOI] [PMC free article] [PubMed] [Google Scholar]
- 8.Miyoshi G, et al. Genetic fate mapping reveals that the caudal ganglionic eminence produces a large and diverse population of superficial cortical interneurons. J Neurosci. 2010;30:1582–1594. doi: 10.1523/JNEUROSCI.4515-09.2010. [DOI] [PMC free article] [PubMed] [Google Scholar]
- 9.Macosko EZ, et al. Highly Parallel Genome-wide Expression Profiling of Individual Cells Using Nanoliter Droplets. Cell. 2015;161:1202–1214. doi: 10.1016/j.cell.2015.05.002. [DOI] [PMC free article] [PubMed] [Google Scholar]
- 10.Buettner F, Natarajan KN, Casale FP, Proserpio V. Computational analysis of cell-to-cell heterogeneity in single-cell RNA-sequencing data reveals hidden subpopulations of cells. Nature. 2015;33:155–160. doi: 10.1038/nbt.3102. [DOI] [PubMed] [Google Scholar]
- 11.Tirosh I, et al. Dissecting the multicellular ecosystem of metastatic melanoma by single-cell RNA-seq. Science. 2016;352:189–196. doi: 10.1126/science.aad0501. [DOI] [PMC free article] [PubMed] [Google Scholar]
- 12.Petropoulos S, et al. Single-Cell RNA-Seq Reveals Lineage and X Chromosome Dynamics in Human Preimplantation Embryos. Cell. 2016;165:1012–1026. doi: 10.1016/j.cell.2016.03.023. [DOI] [PMC free article] [PubMed] [Google Scholar]
- 13.Qiu X, et al. Reversed graph embedding resolves complex single-cell trajectories. Nat Meth. 2017;14:979–982. doi: 10.1038/nmeth.4402. [DOI] [PMC free article] [PubMed] [Google Scholar]
- 14.Quah BJC, Parish CR. The use of carboxyfluorescein diacetate succinimidyl ester (CFSE) to monitor lymphocyte proliferation. J Vis Exp. 2010 doi: 10.3791/2259. [DOI] [PMC free article] [PubMed] [Google Scholar]
- 15.Telley L, et al. Sequential transcriptional waves direct the differentiation of newborn neurons in the mouse neocortex. Science. 2016:aad8361. doi: 10.1126/science.aad8361. [DOI] [PubMed] [Google Scholar]
- 16.Rudy B, Fishell G, Lee S, Hjerling-Leffler J. Three groups of interneurons account for nearly 100% of neocortical GABAergic neurons. Dev Neurobiol. 2010;71:45–61. doi: 10.1002/dneu.20853. [DOI] [PMC free article] [PubMed] [Google Scholar]
- 17.Waclaw RR, Ehrman LA, Pierani A, Campbell K. Developmental origin of the neuronal subtypes that comprise the amygdalar fear circuit in the mouse. J Neurosci. 2010;30:6944–6953. doi: 10.1523/JNEUROSCI.5772-09.2010. [DOI] [PMC free article] [PubMed] [Google Scholar]
- 18.Trapnell C, et al. The dynamics and regulators of cell fate decisions are revealed by pseudotemporal ordering of single cells. Nat Biotechnol. 2014;32:381–386. doi: 10.1038/nbt.2859. [DOI] [PMC free article] [PubMed] [Google Scholar]
- 19.Petros TJ, Bultje RS, Ross ME, Fishell G, Anderson SA. Apical versus Basal Neurogenesis Directs Cortical Interneuron Subclass Fate. Cell Reports. 2015;13:1090–1095. doi: 10.1016/j.celrep.2015.09.079. [DOI] [PMC free article] [PubMed] [Google Scholar]
- 20.Wichterle H, Turnbull DH, Nery S, Fishell G, Alvarez-Buylla A. In utero fate mapping reveals distinct migratory pathways and fates of neurons born in the mammalian basal forebrain. Development. 2001;128:3759–3771. doi: 10.1242/dev.128.19.3759. [DOI] [PubMed] [Google Scholar]
- 21.Frazer S, et al. Transcriptomic and anatomic parcellation of 5-HT3AR expressing cortical interneuron subtypes revealed by single-cell RNA sequencing. Nat Comms. 2017;8:14219. doi: 10.1038/ncomms14219. [DOI] [PMC free article] [PubMed] [Google Scholar]
- 22.Tasic B, et al. Adult mouse cortical cell taxonomy revealed by single cell transcriptomics. Nat Neurosci. 2016;19:335–346. doi: 10.1038/nn.4216. [DOI] [PMC free article] [PubMed] [Google Scholar]
- 23.© 2015 Allen Institute for Brain Science. Allen Cell Types Database. Available from: http://celltypes.brain-map.org/download.
- 24.Tremblay R, Lee S, Rudy B. GABAergic Interneurons in the Neocortex: From Cellular Properties to Circuits. Neuron. 2016;91:260–292. doi: 10.1016/j.neuron.2016.06.033. [DOI] [PMC free article] [PubMed] [Google Scholar]
- 25.Petilla Interneuron Nomenclature Group et al. Petilla terminology: nomenclature of features of GABAergic interneurons of the cerebral cortex. Nat Rev Neurosci. 2008;9:557–568. doi: 10.1038/nrn2402. [DOI] [PMC free article] [PubMed] [Google Scholar]
- 26.Butler A, Satija R. Integrated analysis of single cell transcriptomic data across conditions, technologies, and species. bioRxiv. 2017 doi: 10.1101/164889. [DOI] [PMC free article] [PubMed] [Google Scholar]
- 27.Butler A, Hoffman P, Smibert P, Papalexi E, Satija R. Integrating single-cell transcriptomic data across different conditions, technologies, and species. Nat Biotechnol. 2018 doi: 10.1038/nbt.4096. [DOI] [PMC free article] [PubMed] [Google Scholar]
- 28.Alcantara S, de Lecea L, Del Río JA, Ferrer I, Soriano E. Transient colocalization of parvalbumin and calbindin D28k in the postnatal cerebral cortex: evidence for a phenotypic shift in developing nonpyramidal neurons. Eur J Neurosci. 1996;8:1329–1339. doi: 10.1111/j.1460-9568.1996.tb01595.x. [DOI] [PubMed] [Google Scholar]
- 29.Harrington AJ, et al. MEF2C regulates cortical inhibitory and excitatory synapses and behaviors relevant to neurodevelopmental disorders. Elife. 2016;5:140. doi: 10.7554/eLife.20059. [DOI] [PMC free article] [PubMed] [Google Scholar]
- 30.Habib N, et al. Massively parallel single-nucleus RNA-seq with DroNc-seq. Nat Meth. 2017;65:631–958. doi: 10.1038/nmeth.4407. [DOI] [PMC free article] [PubMed] [Google Scholar]
- 31.© 2008 Allen Institute for Brain Science. Allen Developing Mouse Brain Atlas. Available from: http://developingmouse.brain-map.org/
- 32.Monory K, et al. The endocannabinoid system controls key epileptogenic circuits in the hippocampus. Neuron. 2006;51:455–466. doi: 10.1016/j.neuron.2006.07.006. [DOI] [PMC free article] [PubMed] [Google Scholar]
- 33.Madisen L, et al. A robust and high-throughput Cre reporting and characterization system for the whole mouse brain. Nat Neurosci. 2010;13:133–140. doi: 10.1038/nn.2467. [DOI] [PMC free article] [PubMed] [Google Scholar]
- 34.Sousa VH, Miyoshi G, Hjerling-Leffler J, Karayannis T, Fishell G. Characterization of Nkx6-2-derived neocortical interneuron lineages. Cereb Cortex. 2009;19(Suppl 1):i1–10. doi: 10.1093/cercor/bhp038. [DOI] [PMC free article] [PubMed] [Google Scholar]
- 35.Vong LH, Ragusa MJ, Schwarz JJ. Generation of conditional Mef2cloxP/loxP mice for temporal- and tissue-specific analyses. genesis. 2005;43:43–48. doi: 10.1002/gene.20152. [DOI] [PubMed] [Google Scholar]
- 36.Picelli S, et al. Smart-seq2 for sensitive full-length transcriptome profiling in single cells. Nat Meth. 2013;10:1096–1098. doi: 10.1038/nmeth.2639. [DOI] [PubMed] [Google Scholar]
- 37.Lee S, Hjerling-Leffler J, Zagha E, Fishell G, Rudy B. The largest group of superficial neocortical GABAergic interneurons expresses ionotropic serotonin receptors. J Neurosci. 2010;30:16796–16808. doi: 10.1523/JNEUROSCI.1869-10.2010. [DOI] [PMC free article] [PubMed] [Google Scholar]
- 38.Haghverdi L, Buettner F, Theis FJ. Diffusion maps for high-dimensional single-cell analysis of differentiation data. Bioinformatics. 2015;31:2989–2998. doi: 10.1093/bioinformatics/btv325. [DOI] [PubMed] [Google Scholar]
- 39.Blondel VD, Guillaume JL, Lambiotte R, Lefebvre E. Fast unfolding of communities in large networks. J Stat Mech. 2008;2008:P10008. [Google Scholar]
- 40.Kharchenko PV, Silberstein L, Scadden DT. Bayesian approach to single-cell differential expression analysis. Nat Meth. 2014;11:740–742. doi: 10.1038/nmeth.2967. [DOI] [PMC free article] [PubMed] [Google Scholar]
- 41.Qiu P, et al. Extracting a cellular hierarchy from high-dimensional cytometry data with SPADE. Nat Biotechnol. 2011;29:886–891. doi: 10.1038/nbt.1991. [DOI] [PMC free article] [PubMed] [Google Scholar]
- 42.Bendall SC, et al. Single-cell trajectory detection uncovers progression and regulatory coordination in human B cell development. Cell. 2014;157:714–725. doi: 10.1016/j.cell.2014.04.005. [DOI] [PMC free article] [PubMed] [Google Scholar]
- 43.Langfelder P, Horvath S. WGCNA: an R package for weighted correlation network analysis. BMC Bioinformatics. 2008;9:559. doi: 10.1186/1471-2105-9-559. [DOI] [PMC free article] [PubMed] [Google Scholar]
Associated Data
This section collects any data citations, data availability statements, or supplementary materials included in this article.