

Abstract
Order–disorder phase transitions driven by temperature or light in soft matter materials exhibit complex dissipative structures. Here, we investigate the spatio-temporal phenomena induced by light in a dye-doped nematic liquid crystal layer. Experimentally, for planar anchoring of the nematic layer and high enough input power, photoisomerization processes induce a nematic–isotropic phase transition mediated by interface propagation between the two phases. In the case of a twisted nematic layer and for intermediate input power, the light induces a spatially modulated phase, which exhibits stripe patterns. The pattern originates as an instability mediated by interface propagation between the modulated and the homogeneous nematic states. Theoretically, the phase transition, emergence of stripe patterns and front dynamics are described on the basis of a proposed model for the dopant concentration coupled with the nematic order parameter. Numerical simulations show quite a fair agreement with the experimental observations.
This article is part of the theme issue ‘Dissipative structures in matter out of equilibrium: from chemistry, photonics and biology (part 2)’.
Keywords: phase transition, front propagation, liquid crystals
1. Introduction
Non-equilibrium processes often lead to the emergence of dissipative structures developed from a homogeneous state through the spontaneous breaking of symmetries [1–4]. This self-organization is usually a consequence of a force imbalance or transport optimization of energy, momenta and/or particles. This phenomenon corresponds to an instability [1–4], the nature of which can be supercritical (smooth) or subcritical (abrupt), depending on the nonlinear response of the system. The abrupt transitions are characterized by exhibiting a coexistence region (hysteresis), that is, depending on the initial conditions, the system presents any of the two states or an interface between them. These interfaces can exhibit complex dynamical behaviours [3,4]. Indeed, depending on the relative stability of the two phases, the more stable state invades the less stable one giving rise to front dynamics.
Thermotropic liquid crystals are materials that naturally exhibit subcritical phase transitions when the temperature is modified [5–7]. In within this class of soft matter materials, nematic liquid crystal are made of anisotropic rod-like shaped organic molecules [5–7], which results in a strong anisotropy of all their physical properties, especially optical features. In the nematic phase, the configuration of lowest energy is reached when all the rod-like molecules are in average aligned along one privileged direction. When the temperature is increased, at a critical value, the nematic state is replaced by a disordered state, which corresponds to an isotropic-liquid phase [5–7]. This instability is known as the nematic–isotropic transition. One of the main optical features of nematic liquid crystals is their high birefringence, which can be modulated under the application of external electric and magnetic fields. This property is essential for the use of liquid crystals as displays in electronic devices [8,9]. Likewise, modulation of the birefringence can also be achieved by means of illumination with intense light beams [10,11]. Moreover, the inclusion of a small amount of certain types of dyes strongly reduces the critical light intensity to induce the molecular reorientation [12]. In particular, when the nematic liquid crystals are doped with azo-dyes, their nonlinear response to opto-electrical stimulus is increased by several orders of magnitude [13–15]. The dyes undergo a photoisomerization transition [12], namely, molecular conformational changes are generated by the light, leading to local changes of molecular interactions. As a matter of fact, photoisomerization facilitates order–disorder transitions [16]. Indeed, photoisomerization induced fronts have been recently reported for a dye-doped nematic planar layer [17].
The aim of this manuscript is to investigate the spatio-temporal phenomena induced by photoisomerization in a nematic dye-doped liquid crystal (DDLC) layer when is illuminated in the absorption band of the dopants. We show that, for high enough input power, the sample with planar anchoring presents a transition from a nematic to an isotropic phase. This transition is mediated by interface propagation between the two phases. Moreover, in the case of a DDLC twisted layer, and for lower input power, the light induces a spatially modulated nematic phase, which exhibits stripe patterns. This instability is mediated by propagation of an interface between the modulated and the homogeneous nematic phase. Theoretically, phase transitions, the emergence of stripe patterns and front dynamics are described on the basis of a model for the dopant concentration coupled with the nematic order parameter. Numerical simulations of the proposed model show quite a fair agreement with the experimental observations.
2. Experimental set-up and results
The experimental set-up is depicted in figure 1a. DDLC cells are subjected to a Gaussian laser beam in the absorption band of the dopant. The liquid crystal layers consist of the nematic E7 doped with the azo-dye methyl-red, concentration lower than 1.0% in weight. The mixture is injected in between two polyvinyl alcohol-coated glass plates, which are rubbed to favour the planar alignment of the liquid crystal molecules. The cell gap is 25 μm. We consider two types of cells, characterized by different anchoring conditions: first, planar cells, with a planar anchoring of the LC molecules, that is molecules are oriented parallel to the glass plates and parallel in the orientations over each glass plate (figure 1b), then, twisted cells, with a twisted anchoring of the LC molecules, that is molecules are oriented parallel to the glass plates and orthogonal in the orientations of each glass plate (cf. figure 1c). As we will observe, the light through the photoisomerization process will induce different phenomena depending on the anchoring of the liquid crystal cells (planar or twisted).
Figure 1.

(a) Experimental set-up: a dye-doped nematic liquid crystal layer (DDLC) is illuminated by a Gaussian light beam from a 532 nm laser. L1, L2 and L3 account for plano-convex lenses. PBS, polarizing beam-splitter; CCD, charge-coupled camera device. Schematic of the DDLC cell with (b) planar and (c) twisted anchoring conditions. (Online version in colour.)
The DDLC cell is irradiated by a frequency-doubled Nd3:YVO4 laser with wavelength λ0 = 532 nm in the absorption band of the dopants, vertically polarized (following the y-axis, figure 1). Two plano-convex lenses L1 and L2 double the laser beam diameter. In the case of planar cells (figure 1a), these are oriented at 45° with respect to the input beam polarization, hence, the angle between the input light polarization and the nematic director is 45°. In the case of twisted cells (figure 1b), these are oriented in such a way that the first plate is parallel to the input beam polarization; hence, the nematic director at the exit plate is twisted of an angle of 90° with respect to the input light polarization. A polarizing beam-splitter—which is configured so as to be orthogonal to the incident light—is placed in between the LC sample and the CCD camera in order to distinguish the molecular orientation in the sample. The cell was subjected to input powers P0 from 5 mW up to 700 mW. All experimental observations were made at room temperature.
As the samples are not illuminated, the dye molecules are in the trans state and oriented along the liquid crystal nematic director [12]. When the samples are illuminated by a light beam in the absorption band of the dopants, the scenario changes because the light induces a photoisomerization process and the dopants undergo a transition from the trans to the cis-state, corresponding to different molecular configurations of the azo-dyes [12]. Likewise, the dyes in the cis-state favour the reorientation of the liquid crystal molecules. However, the liquid crystal molecules are oriented in different directions as a result of intermolecular interaction. Hence, this transition is characterized by a loss of liquid crystal molecular order—which corresponds to an entropic effect—and, correspondingly, by a decrease of the order parameter and consequent modification of the refraction index [12,13]. The samples under study are irradiated with a Gaussian laser beam, then the intensity that crosses the sample has the form
| 2.1 |
where I0 is the maximum value of the intensity at the centre of the light beam and w stands for the waist of the optical beam.
(a). Planar cells
By increasing the input power of the light beam from 5 to 350 mW, the planar aligned LC layer exhibits an illuminated region of the order of 5 mm. After about 10 s of illumination, a circular front develops in the inner region of the light beam, letting a dark disc grow [17]. The disc diameter increases in the transient regime with a decreasing speed and becomes motionless at the end. Figure 2 illustrates the propagation of this circular front. The light extinction in the central disc is a manifestation of the isotropic phase, which is surrounded by the nematic phase. Because the polarization of the light and the polarizing cube are orthogonally configured, in the isotropic phase (non-birefringent medium), the light cannot cross the cube, that is, the light transmission is zero. Indeed, in the illuminated area, the dyes photoisomerization induces a phase transition to the isotropic state. Theoretically, based on nascent of bistability model with inhomogeneous coefficients allows quantitatively and qualitatively explain this adaptive front dynamics [17,18]. However, this description was not derived from the physics of liquid crystals and concentration of dopants, which are fundamental elements in the phenomenon under study. As we will show in the theoretical section, from equations of the dopant concentration coupled with the nematic order parameter a nascent of bistability model can, indeed, be derived.
Figure 2.

Front propagation between isotropic to nematic state driven by a Gaussian light beam. (a) Experimental nematic–isotropic front propagation in a DDLC planar cell. Temporal sequence of snapshots for P0 = 350 mW and beam waist 3.4 mm at t1 = 0, t1 = 15, t3 = 20, t4 = 25, t5 = 31 and t1 = 36 s, respectively. (b) Temporal sequence of numerical simulation of model equation (3.5) with A = − 0.05, B = 1.0, E = 1.0, α = 1, H = 1.0, D = 1.0, β = 0.02, λ = 2, CT = 1, δ⊥ = δ∥ = 1, γ = 1, η = 0, I = I0e−(x2 + y2)/w2, I0 = 20 and w = 60. The origin of the coordinates is located at the centre of the frame. The dark and gray zone account for the isotropic (S ≈ 0) and nematic state (S ≈ 1), respectively.
The nature of the nematic–isotropic transition is of first-order type, and the system exhibits a region of coexistence between two stable states [17]. Figure 3a shows the experimental bifurcation diagram of the nematic–isotropic transition. It depicts the liquid crystal cell transmissivity T versus input power of the light. Notice that, without any external forcing, and at room temperature, the sample is in the nematic phase, and the clearing point for the liquid crystal used in our mixture, is around 58°C, which is below the critical temperature of the isotropic-liquid transition. Figure 3b shows the theoretical bifurcation diagram of the transmissivity as a function of the bifurcation parameter in a liquid crystal cell between crossed polarizers in 45° with respect to the anchoring axis and considering that the difference between the ordinary and extraordinary refraction indices are small [19,20].
Figure 3.

Bifurcation diagram of the isotropic–nematic transition in planar DDLC cell. (a) Experimental bifurcation diagram. DDLC cell transmissivity T as a function of the light input power P; the symbols squares and diamonds correspond to increasing and decreasing the input power. (b) Theoretical bifurcation diagram using the transmittance of the sample between crossed polarizers as an order parameter. Continuous lines correspond to equilibrium transmittance states of the cell and discontinuous denote the value of the parameter when the equilibrium state ceases to exist or to be an stable one. (c) Bifurcation diagram of model equation (3.5) for homogeneous light intensity as a function of the bifurcation parameter A(I) = A + βC0(I). A*, APIS and AP+ account for saddle-node bifurcation of the nematic phase and the spatial bifurcation of the isotropic and nematic phase. (Online version in colour.)
(b). Twisted cells
Twisted anchoring conditions of the LC molecules favours the dopant molecules to be positioned with different orientations, which ensures a relevant coupling with the light that crosses the sample. Indeed, depending on the relative orientation of the light polarization and orientation of the dopant, the photoisomerization process can become more efficient [12]. Therefore, twisted DDLC are expected to exhibit a dynamical phenomenology richer than that observed in the case of planar cells.
Noticeably, illumination of the sample with a light beam of moderate power creates the gradual emergence of stripe domains between nematic states. These patterns correspond to distributions of molecules that are locally alternated between regions of higher and lower orientational order, even though remaining nematic. First, the stripe patterns appear in the peripheral region of the illuminated area, then, the stripe domains invade the whole illuminated zone. This front propagation takes about 3 h to invade an area of 3 cm2. After a while, the different domains are merged, generating several defects. Mainly dislocations are identified, which are characterized by local joints of stripe regions with different wavenumber [3]. Figure 4 shows a sequence of snapshots of the typical stripe patterns, dislocations defects and front propagation. This pattern corresponds to a spatial modulation of the nematic LC molecular orientation. Clearer stripes (darker stripes) in figure 4 account for regions where molecules are more (less) ordered. It is worthy to note that the stripe patterns are mostly oriented orthogonally to the direction of the light electric field. The wavelength of the stripe patterns is in the range 10–15 μm, which is of the same order of the cell thickness. The light intensity emerging from the twisted DDLC accounts for the molecular orientation, which is characterized by transverse spatial oscillations.
Figure 4.

Emergence of stripe patterns in a twisted DDLC cell. (a) Light-induced front propagation between a spatially modulated and a homogeneous nematic state. Example snapshots of a temporal sequence (t1 < t2 < t3 < t4 < t5 < t6). (b) Temporal sequence of numerical simulations of model equation (3.5) with A = 0.24, B = 1, E = 1.0, α = − 4, H = 1.0, D = 0.5, β = 0.1, λ = 1, CT = 0, δ⊥ = 1, δ∥ = 0.85, γ = 1, η = 0, I = I0e−(x2 + y2)/w2, I0 = 1 and w = 50. The origin of the coordinates is located at the centre of the frame.
3. Theoretical description
In order to understand the dynamical behaviour of the optically driven DDLC cells, let us introduce a scalar order parameter S(r, t) that accounts for the alignment of the molecules along a given direction [5–7], defined by
| 3.1 |
where the brackets 〈 · 〉 mean spatial average in a microscopic element volume in the position r and θ is the angle between the molecules and the local preferred direction [5–7]. Hence, the scalar order parameter for a perfectly aligned nematic phase is S = 1 and for an isotropic phase is S = 0. The transition between a nematic and isotropic phase is described by the Landau–de Gennes theory [6]
| 3.2 |
where A, B and E are parameters that characterize the transition and H accounts for the diffusion coefficient of the order parameter. All the parameters have adequate dimensions. This theory is based on the fact that the free energy depends in a polynomial form on the order parameter S, which is coupled to nearest neighbours and always the isotropic state is an equilibrium. This model, equation (3.8), predicts that the nematic–isotropic transition is of subcritical nature when the parameter A is modified [5–7]. On the other hand, the concentration of molecules in the cis-state C(r, t) satisfies a relaxation and diffusion equation of the form [12]
| 3.3 |
where λ is the decay rate related to the transition from cis to trans state by thermal relaxation. δ accounts for the diffusion coefficient of the concentration of molecules in the cis-state. C0 is the equilibrium concentration of molecules in the cis-state, which depends on the temperature and is proportional to the total intensity of the incident light I. The equilibrium concentration is modelled by
| 3.4 |
where γ and η are dimensional parameters [12] and CT is the equilibrium concentration of molecules in the cis-state determined by the temperature. Then, the concentration C0 grows linearly with the light intensity for small intensities, while it saturates at γ/η for large intensity.
The addition of dye-dopants increases the nonlinear response of liquid crystals under the excitation of external fields [11–17]. In order to account for dynamical behaviour mediated by the photoisomerization process in a dye-doped nematic layer, let us to propose a model that couples the concentration of molecules in the cis-state C(r⊥, t) and the scalar order parameter S(r⊥, t), by the following equations
 |
3.5 |
where r⊥ = {x, y} stands for the transverse coordinates of the LC layer. The longitudinal direction being small compared with the transverse directions, the spatial dependence along it can be ignored by temporal scale separation. The parameter α accounts for the reduction of the cis-state concentration when the LC molecules are more aligned (larger S) because the dopants tend to be oriented in the direction of the molecules (transition from cis to trans) [12]. Owing to the process of photoisomerization and elastic features of the liquid crystal, all transport processes must be anisotropic [6,11,12]. It is important to note that the molecular anchoring strongly modifies the anisotropic properties of the parameters. Indeed, {δ⊥, δ∥} are the diffusion coefficients of the dopant concentration in the parallel and orthogonal direction with respect to the incident light electric field. β stands for the entropic effect of the photoisomerization process, that is, by increasing the concentration of the cis molecules, the disordered state is favoured. Finally, D accounts for the mutual transport process. A gradient in dopant concentration induces propagation of the order parameter. In addition, for simplicity, we only consider anisotropy in the diffusion of dopants. Equations (3.5) are a non-variational model, namely, this set of equations do not derive from the variation of a free energy. This is because the system is out of equilibrium and the forcing is mediated by the continuous presence of the incident light field [2].
(a). Bifurcation diagram
For the sake of simplicity, we consider that the lighting is homogeneous (I is constant). Hence, the above model, equations (3.5), has two homogeneous states (S, C) = (SIS, CIS)≡(0, C0) and
 |
3.6 |
which accounts, respectively, for an isotropic and a dye-doped nematic phase. Figure 3b shows the bifurcation diagram of these states. This bifurcation diagram corresponds to a pitchfork transcritical bifurcation [4], which is controlled by the bifurcation parameter
| 3.7 |
For large values of A(I), the only homogeneous equilibrium is the isotropic state (S = 0). Decreasing the parameter, there is a critical value, A(I) = A* = (αβ + B)2/4E, from which the system presents coexistence with the nematic phase (cf. figure 3c). This state emerges by means of a saddle-node bifurcation. Then, for smaller values of the bifurcation parameter, the system exhibits coexistence of phases. The isotropic state exhibits a transcritical instability when the bifurcation parameter becomes zero (figure 3c). However, before the transcritical bifurcation depending on the coupling parameter α, the isotropic state can exhibit a spatial instability, which is highlighted by the APIS symbol in figure 3c. For negative values of the parameter, the only stable phase is the nematic phase. The bifurcation diagram described by model equation (3.5) shows a quite good agreement with the bifurcation diagram observed experimentally when one considers the approximation that the bifurcation parameter is linear with the light intensity [A(I) ≈ A + β(CT + γI)] (figure 3).
(b). Front propagation between homogeneous states
In order to take into account the effect of the planar layer illuminated by a Gaussian beam, we simulate model (3.5) with an inhomogeneous intensity I(x, y, I0, w), as given by formula (2.1). In addition, to be more realistic, we have added white noise to each equation, with a small level of noise intensity. Figure 2 shows a comparison between the experimental observations and numerical simulations of model (3.5), where the nematic–isotropic transition is driven by a Gaussian light beam. The dynamics observed show a good agreement. Namely, by increasing the input power parameter I0, after a transient, a circular front develops in the perturbed inner region, letting a dark disc to grow. The disc diameter increases in the transient regime with a decreasing speed and becomes motionless at the end.
The previous dynamical behaviour can be described universally by means of a bistable model with inhomogeneous parameters [17,18]. In order to reconcile our description with this universal one, we consider the limit for which the light beam varies slowly (w≫1) and the decay rate related to the transition from cis to trans state is much faster than the variation rate of the order parameter (λ≫A). In this limit, the cis-state concentration can be eliminated adiabatically and satisfies C ≈ C0(x, y, I0, w) − αS. Hence, the order parameter S satisfies the effective Landau–de-Gennes model
| 3.8 |
where the bifurcation parameter A + C0(x, y, I0, w) is controlled by the light intensity. By means of a simple variable translation with the objective of eliminating the quadratic term, one retrieves the universal model used to describe the front propagation in inhomogeneous media [17,18]. Note that by means of pulsed light, one can induce molecular disorder and molecular reorientation of pure liquid crystals [21]. Namely, it can be seen that light generates the emergence of fronts between different phases. However, these types of effects have been observed for intense power beams at least two orders of magnitude greater than those studied in the present study [21].
(c). Front propagation and pattern formation
The twisted illuminated cells show a rich dynamical behaviour between striped patterns and homogeneous states (figure 4). Because the molecules of the dopant have different orientations inside the cells as a result of the anchoring conditions, one expects that the coupling between the order parameter S and the concentration of the cis-state C will be stronger in comparison to planar cells. For small coupling α between the order parameter and the cis concentration, the stable equilibrium corresponds to the homogeneous nematic phase (S+, C+). By increasing the coupling parameter α, the homogeneous nematic phase becomes unstable, giving rise to the emergence of striped domains. Namely, the system exhibits a spatial instability. Figure 4b shows the typical observed stripe pattern when a weak anisotropy is considered (δ∥∼δ⊥).
All numerical simulations presented are obtained by considering a finite differences code with Runge–Kutta order-4 algorithm. In the case of considering the isotropic limit, model equation (3.5) exhibits hexagonal patterns, which is inconsistent with the experimental observations. The origin of this anisotropy is due to the photoisomerization process and the anisotropic interaction between molecules [6,11,12]. Indeed, liquid crystals are anisotropic materials by nature. Hence, the light polarization induces stripes patterns in a privileged spatial direction. Experimentally, stripes patterns are mainly orthogonal to the input light polarization. Notice that the observed experimental textures show quite a good agreement with that obtained from the model equation (3.5). The observed patterns are physically interpreted as molecules that locally alternate between regions of higher and lower orientational order. Namely, this pattern accounts for spatial modulation of the order parameter S and the concentration of the cis-state C. Owing to the refractive index dependence with the molecular orientation, the light that crosses the liquid crystal cell displays bands of different intensities, as seen in figure 4.
In order to understand the mechanism giving rise to the appearance of the stripe domains, a linear stability analysis over the homogeneous nematic phase (S+, C+) was performed. We consider, for the sake of simplicity, the isotropic case of model (3.5), i.e. δ∥ = δ⊥≡δ. By using an ansatz
where σ is the growth rate and k the wavevector, in equations (3.5), and by keeping only the linear terms in ΔS and ΔC, we obtain a relation between the growth rate and wavevector, σ(k, {λ, C0, δ, α, β, D, A, E, H}), which is a complex function of two components. Figure 5 displays the real part of the growth rate, Re(σ), as a function of the wavenumber k = ∥k∥ for fixed parameters at the spatial bifurcation (α = αc) and below the spatial instability (α < αc). The spatial instability of the homogeneous nematic phase occurs while increasing the coupling parameter α above a critical value αc. We then consider the anisotropic case ( δ∥≠δ⊥) of model (3.5). In this case, the instability occurs in the most unstable direction on wavenumber space, which depends on the relative values of δ∥ and δ⊥, so that, beyond the instability the stripes will be along the direction of the smallest diffusion coefficient, which corresponds to the direction orthogonal to the input light polarization (δ∥ > δ⊥). To analytically determine the wavenumber, one can consider the limit that the temporal evolution of the cis concentration is fast compared to the dynamics of the order parameter, i.e. λ≫A. At this limit, one can remove the concentration of the cis state adiabatically, replace this in the equation of the order parameter S, equation (3.5), and from this effective equation one can determine the critical wavelength which has the form 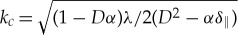 . Hence, we can infer that the differences of transport scales and relaxation processes for the order parameter S(r, t) and the cis-state concentration C(r, t) are responsible for the emergence of patterns. That is, the emergence of these patterns is associated with a Turing-type instability [22].
Figure 5.
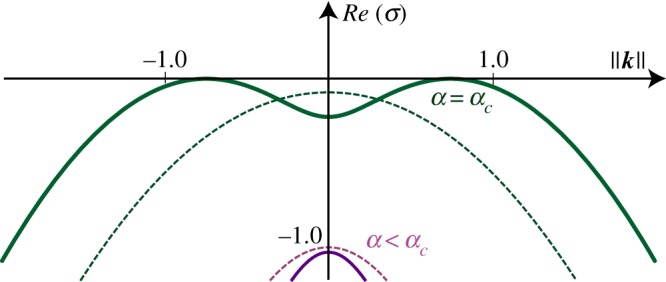
Growth rate, Re(σ), as a function of the wavenumber ∥k∥ from model equation (3.5) with A = 0.24, B = 1.0, E = 1.0, H = 1.0, D = 0.5, β = 0.01, λ = 1, CT = 0.01, δ⊥ = δ∥ = 1, γ = 1, η = 0 and I = 0 with different coupling parameter α = {4.1, 1.0}. The critical coupling parameter value for the spatial instability is αc = 4.1. (Online version in colour.)
4. Conclusion
Soft matter materials doped with azo-dyes and irradiated by light may exhibit unexpected spatio-temporal dynamical behaviours. In particular, isometric azo-dyes transitions can generate order-to-disorder transitions in liquid crystals. We have shown that for high enough input light power, samples with planar anchoring illuminated by a Gaussian beam present a transition from a nematic to an isotropic phase. The photoisomerization process is the physical mechanism at the origin of this transition. As a result of the applied Gaussian beam, the nematic–isotropic transition is mediated by an interface propagation between phases. In the case of a twisted dye-doped liquid crystal layer, and for intermediate input power, the light induces a spatially modulated nematic phase, which manifests itself as a stripe pattern. The physical origin of this instability is due to the differences of transport scales and relaxation processes for the order parameter and the cis-state concentration. To describe these phenomena, we have proposed a model for the dopant concentration coupled with the nematic order parameter, which allows us to explain the emergence of stripe patterns and front dynamics. Numerical simulations show quite a fair agreement with the experimental observations. Hence, the appearance of stripe nematic patterns correspond to a genuine Turing instability. This instability is mediated by the interface propagation between the modulated and the homogeneous nematic phase.
The optical properties presented by dye-doped nematic liquid crystals when they are illuminated with light in their absorption band show interesting spatial and temporal behaviours, such as front propagation, phase transitions and the emergence of patterns. These observations open the bases for applications in optical selective and smart windows, able to adapt their polarization properties depending on the intensity of the light to which they are subjected.
Acknowledgments
The authors thank to R. Barboza and V. Odent for fruitful discussions.
Data accessibility
This article has no additional data.
Competing interests
The authors declare that they have no competing interests.
Funding
This article was funded by Fondo Nacional de Ciencia y Tecnologia (FONDECYT) project 1150507, Chilean government and the Millennium Institute for Research in Optics (Miro). CONICYT-PFCHA/Doctorado Nacional/2017-21171672.
References
- 1.Glansdorff P, Prigogine I. 1971. Thermodynamic theory of structures. Stability and fluctuations. New York, NY: Wiley. [Google Scholar]
- 2.Nicolis G, Prigogine I. 1977. Self-organization in nonequilibrium systems. New York, NY: John Wiley & Sons. [Google Scholar]
- 3.Pismen LM. 2006. Patterns and interfaces in dissipative dynamics. Berlin, Germany: Springer. [Google Scholar]
- 4.Cross M, Greenside H. 2009. Pattern formation and dynamics in non-equilibrium systems. New York, NY: Cambridge University Press. [Google Scholar]
- 5.Chandrasekhar S. 1992. Liquid crystals. New York, NY: Cambridge University Press. [Google Scholar]
- 6.de Gennes PG, Prost J. 1995. The physics of liquid crystals. Oxford, UK: Clarendon Press. [Google Scholar]
- 7.Vertogen G, Jeu WH. 1988. Thermotropic liquid crystals, fundamentals. Berlin, Germany: Springer. [Google Scholar]
- 8.Yeh P, Gu C. 1990. Optics of liquid crystal displays. New York, NY: Wiley. [Google Scholar]
- 9.Wu S-T, Yang D-K. 2006. Fundamentals of liquid crystal devices. New York, NY: John Wiley & Sons. [Google Scholar]
- 10.Tabiryan NV, Sukhov AV, Zel'Dovich BY. 1986. Orientational optical nonlinearity of liquid crystals. Mol. Cryst. Liq. Cryst. 136, 1–139. ( 10.1080/00268948608074569) [DOI] [Google Scholar]
- 11.Khoo IC. 2009. Nonlinear optics of liquid crystalline materials. Phys. Rep. 471, 221–267. ( 10.1016/j.physrep.2009.01.001) [DOI] [Google Scholar]
- 12.Janossy I, Lloyd AD. 1991. Low-power optical reorientation in dyed nematics. Mol. Cryst. Liq. Cryst. 203, 77–84. ( 10.1080/00268949108046047) [DOI] [Google Scholar]
- 13.Khoo IC, Slussarenko S, Guenther BD, Shih MY, Chen P, Wood WV. 1998. Optically induced space-charge fields, dc voltage, and extraordinarily large nonlinearity in dye-doped nematic liquid crystals. Opt. Lett. 23, 253–255. ( 10.1364/OL.23.000253) [DOI] [PubMed] [Google Scholar]
- 14.Simoni F, Lucchetti L, Lucchetta DE, Francescangeli O. 2001. On the origin of the huge nonlinear response of dye-doped liquid crystals. Opt. Express. 9, 85 ( 10.1364/OE.9.000085) [DOI] [PubMed] [Google Scholar]
- 15.Petrossian A, Residori S. 2002. Surfactant enhanced re-orientation in dye-doped nematic liquid crystals. Europhys. Lett. 60, 79–85. ( 10.1209/epl/i2002-00321-x) [DOI] [Google Scholar]
- 16.Shishido A, Tsutsumi O, Kanazawa A, Shiono T, Ikeda T, Tamai N. 1997. Rapid optical switching by means of photo induced change in refractive index of azobenzene liquid crystals detected by reflection-mode analysis. J. Am. Chem. Soc. 119, 7791–7796. ( 10.1021/ja9706312) [DOI] [Google Scholar]
- 17.Odent V, Clerc MG, Falcón C, Bortolozzo U, Louvergneaux E, Residori S. 2014. Photo-isomerization fronts in dye-doped nematic liquid crystals. Opt. Lett. 39, 1861–1864. ( 10.1364/OL.39.001861) [DOI] [PubMed] [Google Scholar]
- 18.Odent V, Louvergneaux E, Clerc MG, Andrade-Silva I. 2016. Optical wall dynamics induced by coexistence of monostable and bistable spatial regions. Phys. Rev. E, 94, 052220 ( 10.1103/PhysRevE.94.052220) [DOI] [PubMed] [Google Scholar]
- 19.Horn Roger G. 1978. Refractive indices and order parameters of two liquid crystals. J. Phys. 39, 105–109. ( 10.1051/jphys:01978003901010500) [DOI] [Google Scholar]
- 20.Zywucki BJ, Kuczynski W. 2001. The orientational order in nematic liquid crystals from birefringence measurements. IEEE Trans. Dielectr. Electr. Insul. 8, 512–515. ( 10.1109/94.933375) [DOI] [Google Scholar]
- 21.Durbin SD, Arakelian SM, Shen YR. 1981. Optical-field-induced birefringence and Freedericksz transition in a nematic liquid crystal. Phys. Rev. Lett. 47, 1411–1414. ( 10.1103/PhysRevLett.47.1411) [DOI] [Google Scholar]
- 22.Turing AM. 1952. The chemical basis of morphogenesis. Proc. R. Soc. Lond. B 237, 37–72. ( 10.1098/rstb.1952.0012) [DOI] [Google Scholar]
Associated Data
This section collects any data citations, data availability statements, or supplementary materials included in this article.
Data Availability Statement
This article has no additional data.