

Abstract
Key points
In the present study, we investigated whether hypoxia during late pregnancy impairs kidney development in mouse offspring, and also whether this has long‐lasting consequences affecting kidney function in adulthood.
Hypoxia disrupted growth of the kidney, particularly the collecting duct network, in juvenile male offspring. By mid‐late adulthood, these mice developed early signs of kidney disease, notably a compromised response to water deprivation.
Female offspring showed no obvious signs of impaired kidney development and did not develop kidney disease, suggesting an underlying protection mechanism from the hypoxia insult.
These results help us better understand the long‐lasting impact of gestational hypoxia on kidney development and the increased risk of chronic kidney disease.
Abstract
Prenatal hypoxia is a common perturbation to arise during pregnancy, and can lead to adverse health outcomes in later life. The long‐lasting impact of prenatal hypoxia on postnatal kidney development and maturation of the renal tubules, particularly the collecting duct system, is relatively unknown. In the present study, we used a model of moderate chronic maternal hypoxia throughout late gestation (12% O2 exposure from embryonic day 14.5 until birth). Histological analyses revealed marked changes in the tubular architecture of male hypoxia‐exposed neonates as early as postnatal day 7, with disrupted medullary development and altered expression of Ctnnb1 and Crabp2 (encoding a retinoic acid binding protein). Kidneys of the RARElacZ line offspring exposed to hypoxia showed reduced β‐galactosidase activity, indicating reduced retinoic acid‐directed transcriptional activation. Wild‐type male mice exposed to hypoxia had an early decline in urine concentrating capacity, evident at 4 months of age. At 12 months of age, hypoxia‐exposed male mice displayed a compromised response to a water deprivation challenge, which was was correlated with an altered cellular composition of the collecting duct and diminished expression of aquaporin 2. There were no differences in the tubular structures or urine concentrating capacity between the control and hypoxia‐exposed female offspring at any age. The findings of the present study suggest that prenatal hypoxia selectively disrupts collecting duct patterning through altered Wnt/β‐catenin and retinoic acid signalling and this results in impaired function in male mouse offspring in later life.
Keywords: fetal hypoxia, kidney developement, collecting duct
Key points
In the present study, we investigated whether hypoxia during late pregnancy impairs kidney development in mouse offspring, and also whether this has long‐lasting consequences affecting kidney function in adulthood.
Hypoxia disrupted growth of the kidney, particularly the collecting duct network, in juvenile male offspring. By mid‐late adulthood, these mice developed early signs of kidney disease, notably a compromised response to water deprivation.
Female offspring showed no obvious signs of impaired kidney development and did not develop kidney disease, suggesting an underlying protection mechanism from the hypoxia insult.
These results help us better understand the long‐lasting impact of gestational hypoxia on kidney development and the increased risk of chronic kidney disease.
Introduction
The fetal kidney is highly susceptible to gestational stressors, including malnutrition, glucocorticoid exposure and hypoxia. Reduced glomerular number is a common outcome of a suboptimal intrauterine environment (Hinchliffe et al. 1991), which compromises functional renal capacity and increases vulnerability to hypertension and kidney disease in both humans (Brenner et al. 1988; Brenner & Mackenzie, 1997; Hughson et al. 2003; Keller et al. 2003) and animals (Cullen‐McEwen et al. 2012). However, nephron deficits alone do not always result in disease and, often, a secondary insult is required for dysfunction to emerge (Dorey et al. 2014). Fluid and electrolyte balance is maintained by a fine interplay between glomerular filtration and sodium/water reabsorption in the renal tubules. As such, alterations to tubular structure and function can have a profound impact on body fluid homeostasis. Surprisingly, tubule development has not been investigated in any model of prenatal insult. It is highly probable that disruptions to renal tubule development, in conjunction with reduced nephron number, contribute to kidney disease risk in adult life.
Unlike nephrogenesis, which is complete before birth in humans, renal tubular maturation persists for up to 2 years into postnatal life (Poláček et al. 1965) to support functional requirements of the neonatal kidney (Walton et al. 2016a). Surprisingly, there has been no systematic analysis of the growth of the renal medullary/papillary lobes in the human infant, and most information can be drawn from a limited number of rodent studies. At birth in the rodent, the renal papilla is underdeveloped; rapid elongation occurs during the first 2 months of life by extension of medullary/papillary tubules (Wilkinson et al. 2012; Walton et al. 2016a). Establishment of an osmotic gradient from the cortico‐medullary boundary to the papillary tip by countercurrent multiplication allows full urine concentration capacity, which is achieved 12 months after birth in humans (Atiyeh et al. 1996; Layton et al. 2009). All filtration units of the nephron drain through the collecting ducts of the papillary lobe(s), which are responsible for the final control of water excretion and therefore the urine concentration. In children, a reduced urine concentrating capacity is strongly associated with reduced glomerular filtration rate and tubular function (Nieto et al. 2008). Structural deficits as a result of a perturbed fetal kidney development probably also contribute to functional impairments.
Intrauterine hypoxia is one of the most common insults to the developing fetus with a wide aetiology, including placental insufficiency, pre‐eclampsia and living at high altitude. Fetal hypoxia reduces renal blood flow, increasing blood flow and maintaining an adequate oxygen delivery to the heart, brain and adrenals (Giussani, 2016). In vivo models of maternal hypoxia result in offspring with a range of renal phenotypes dependent upon the timing and severity of insult. Severe, acute hypoxia during early gestation (5.5–7.5% O2 for 8 h, 9.5–10.5 days post coitum) results in duplex kidneys in mouse offspring, similar to patients with congenital anomalies of the kidney and urinary tract (Wilkinson et al. 2015). Moderate hypoxia during mid‐gestation (12% O2 for 48 h, 12.5–14.5 days post coitum) was shown to permanently reduce nephron number but not cause overt congenital abnormalities (Wilkinson et al. 2015), although functional outcomes were not described. Gestational hypoxia is also associated with abnormalities in renal medulla patterning. Placental insufficiency as a result of genetic loss of placental Cited1 expression led to reduced renal oxygenation and medullary dysplasia (Sparrow et al. 2009). In adulthood, Cited1 mutant mice had deficits in urine concentrating capacity, which may confer an increased risk of renal disease. Similarly, placental insufficiency leading to reduced medullary vascularization in Crim1 mutant mice (Crim1KST264/KST264) was associated with defects in papillary elongation (Phua et al. 2016). The processes regulating postnatal kidney growth are not well characterized. It is well known that retinoic acid (the active metabolite of vitamin A), its receptors and their target genes are crucial for the process of nephrogenesis (Lelièvre‐Pégorier et al. 1998; Moreau et al. 1998; Niederreither et al. 2002). More recently, RARElacZ transgenic mice, which directly report endogenous retinoic acid activity, have been used to show that retinoic acid activity is restricted to the collecting duct epithelial cells until ∼3 weeks of age (Wong et al. 2011). Given this temporal and spatial expression of retinoic acid activity, it probably has a functional role during postnatal development of the renal medulla.
We have described adverse outcomes on renal and cardiovascular function in a mouse model of moderate, late‐gestational hypoxia [12% O2 for 5 days, embryonic day (E) 14.5 to birth] (Cuffe et al. 2014a; Cuffe et al. 2014b; Walton et al. 2016b; Walton et al. 2017). By contrast to many rodent models, this level and duration of hypoxia does not affect maternal food and water consumption (Cuffe et al. 2014a). Offspring exposed to hypoxia were growth‐restricted but, intriguingly, a nephron deficit was only detected in adult males but not females. At 12 months of age, these male offspring were hypertensive with marked signs of kidney disease, including albuminuria, glomerulosclerosis and interstitial fibrosis. Female offspring also developed hypertension in adulthood in the absence of an overt nephron deficit. To investigate the disease risk factors imposed by prenatal hypoxia, we examined the morphology and functional maturation of renal tubule structures, particularly the collecting duct system, with the use of the RARElacZ reporter mouse. We hypothesized that hypoxia during late gestation would impair postnatal tubular maturation, leading to an increased susceptibility to renal dysfunction in adulthood.
Methods
Ethical approval
All experiments were approved by the University of Queensland Animal Ethics Committee (AEC numbers 496/12 and 352/16) and were conducted in accordance with the Australian Code of Practice for the Care and Use of Animals for Scientific Purposes. The authors have read and the experiments also comply with the policies and regulations of The Journal of Physiology (Grundy, 2015).
Maternal hypoxia
All mice were sourced from our Institutional Breeding Facility (University of Queensland Biological Resources, St Lucia, QLD, Australia) and had access to food and water ad libitum throughout the study. Pregnant CD1 mice were either housed under normoxic room conditions (n = 31; 21% oxygen) or in a hypoxia chamber (n = 33; 12% oxygen) from E14.5 until birth (P0) as described previously (Cuffe et al. 2014a; Walton et al. 2017). Offspring were subsequently housed under normoxic room conditions with their mothers until weaning at P21.
Assessment of maternal
Peripheral capillary oxygen saturation () was measured using a pulse oximeter contained within a collar sensor, designed for measurements on conscious mice (Mouse Ox system; STARR Life Sciences, Philadelphia, PA, USA). Average measurements were collected for 10 min prior to housing in the chamber at E14.5, 10 min after housing in chamber for 1 h at E14.5 and again at E18.5 (n = 3).
Tissue collection in postnatal offspring
Offspring were culled at P0 (control: n = 2 offspring from 8 litters per group; hypoxia: n = 2 offspring from 10 litters per group) and P7 (control: n = 2 offspring from 8 litters per group; hypoxia: n = 2 offspring from 10 litters per group) by decapitation, and P14 (n = 2 offspring from 9 litters per group) and P21 (n = 2 offspring from 11 litters per group) by CO2 inhalation (2 L min–1). Kidneys were removed, decapsulated and snap frozen in liquid nitrogen or immersion fixed in 4% paraformaldehyde. Fixed kidneys were processed into OCT or paraffin and exhaustively sectioned at 5 μm. Body and kidney weights from P0 to P21 were taken as the litter average. Offspring remaining from the cohort culled at P21 were aged until 12 months for functional analyses.
RARE‐lacZ mice
RARE‐lacZ transgenic mice were maintained on a CD1 background and heterozygous males were time‐mated to CD1 females (n = 3 females per group). Mice were then subjected to 12% oxygen or normal room conditions, as described above, from E14.5 to birth. A subset of offspring was culled at P7 by decapitation. The left dissected kidney was fixed in glutaraldehyde for 1 h, cryoprotected in 30% sucrose and embedded in OCT. Sections were cut at 5 μm, and stained for 4 h in standard X‐gal staining solution (5 mm potassium ferricyanide, 5 mm potassium ferrocyanide, 2 mm magnesium chloride, 0.01% sodium deoxycholate, 0.02% NP‐40 and 1 mg mL–1 X‐Gal) at 37 °C for 2–4 h. Slides were counterstained with nuclear fast red or subjected to further immunohistochemical staining for aquaporin (AQP)2 as described below.
Stereology
Renal tubule lengths (proximal tubule, thin descending limb of Henle, distal tubule and collecting duct) from control and hypoxia‐exposed offspring at P21 at 12 months of age were estimated using our recently‐described design‐based stereological method (Walton et al. 2016a). In brief, 10 evenly spaced sections were systematically sampled across the kidney and immunohistochemically stained with AQP1 to mark the proximal tubules and thin descending limb of Henle (1 μg mL–1; AB2219; Millipore, Billerica, MA, USA), AQP2 to mark the collecting ducts (1 μg mL–1; AB3274; Millipore) or Tamm–Horsfall glycoprotein to mark the distal tubules (1 μg mL–1; AB733; Millipore). The cycloid arcs test system was used to estimate renal tubule lengths as described previously (Walton et al. 2016a). Slides were viewed on an Axiplan 2 light microscope (Carl Zeiss, Oberkochen, Germany) and stereological analysis of tubule lengths was carried out using the cycloid arc test system within Stereo Investigator software (MBF Bioscience, Williston, VT, USA).
Morphometry and pathology of postnatal kidneys
Median transverse sections from kidneys were stained with periodic acid‐Schiff (PAS) to assess tubular morphology by a researcher who was blinded to treatment groups. The width of the cortex was measured in midline kidney sections at all ages. The cortex thickness was defined as the area superficial to the arcuate arteries and containing predominantly proximal tubules, distal tubules and glomeruli. The medulla region was defined as the distance from the border of the cortex to the papillary tip.
Single labelling with immunohistochemistry
Kidney sections from offspring at P21 and 12 months of age were dewaxed and rehydrated in xylene and a series of ethanol washes. Endogenous peroxidase activity was blocked using 0.9% H2O2 in distilled water for 30 min. Non‐specific binding was blocked using 2% BSA in 10% serum in phosphate buffer (PB) for 1 h. Sequential sections were incubated with anti‐goat AQP2 (1 μg mL–1; sc‐9882; Santa Cruz Biotechnology, Santa Cruz, CA, USA) and anti‐rabbit V‐ATPase (1 μg mL–1; sc‐20943; Santa Cruz Biotechnology) at room temperature for 1 h in a sealed, humidified chamber. Slides were washed in PB and incubated with a biotinylated secondary antibody for 30 min. Following PB washes, slides were incubated in avidin/biotin ABC enzyme complex (Vecta‐Stain Elite ABC Reagent, PK‐6101 or PK‐6106; Vector Laboratories, Inc., Burlingame, CA, USA) for 30 min. Slides were then washed in PB. Colour was developed with ImmPACT 3,3′‐diaminobenzidine (DAB) peroxidase substrate solution (SK‐4805; Vector Laboratories). Slides were counterstained in Mayer's haematoxylin for 30 s, blued in Scott's tap water and mounted.
Double labelling with immunofluorescence
Sections from kidneys collected at P7 and P21 were blocked using 10% serum in PBS for 1 h at room temperature, followed by incubation with anti‐goat AQP2 (1 μg mL–1; sc‐9882; Santa Cruz Biotechnology) and anti‐rabbit V‐ATPase (1 μg mL–1; sc‐20943; Santa Cruz Biotechnology) for 1 h at room temperature. Slides were incubated with Alexa Fluor 488 goat anti‐rabbit (dilution 1:400; #A11011; Life Technologies, Eugene, OR, USA) and Alexa Fluor 555 donkey anti‐goat (dilution 1:400, #A21432; Life Technologies, Eugene, OR, USA) for 1 h at room temperature and counterstained with 4′,6‐diamidino‐2‐phenylindole for 3 min. Sections were visualized using a BX61 fluorescence microscope (Olympus, Tokyo, Japan).
Quantification of collecting duct composition
Twenty to 30 fields of view (40× magnification) within the renal cortex and medulla were selected systematically and randomly from three to five non‐sequential sections per kidney. The renal papilla tip was excluded from the counting process. To quantify the number of principal and intercalated cells in the cortical collecting duct and medullary collecting duct, the number of cells that exhibited immunoreactivity for AQP2 and V‐ATPase was counted and expressed as a percentage of the total number of cells in the tubule segments. One hundred to 250 cells were counted per kidney and the location within the cortex or medulla was noted. The percentage of positive staining for AQP2 was assessed in one midline, transverse section per kidney using Aperio ImageScope (Leica).
Quantitative real‐time PCR
RNA was extracted from kidneys at P7 and P21 using the RNeasy minikit (Qiagen, Chadstone Centre, VIC, Australia). All RNA was treated with deoxyribonuclease 1 and assessed for purity (260/280 and 260/230 ratios) and yield using a NanoDrop (ThermoFisher, Waltham, MA, USA) spectrophotometer. Then, 1 μg of RNA was reverse transcribed into cDNA (iScript; Bio‐Rad, Gladesville, NSW, Australia). Amplification was performed using SBYBR Green PCR Mastermix (Applied Biosystems, Scoresby, VIC, Australia) in a 10 μL reaction volume containing 25 ng of cDNA and 10 pmol of each primer, or using Taqman reagents as described previously (Cuffe et al. 2014a). All assays were performed in duplicate. PCR primer sequences and accession codes are provided in Table 1. The comparative cycle threshold method was used for all expression assays using the ß‐actin endogenous control. Statistical analysis identified that β‐actin expression was stable across treatment groups. mRNA levels were normalized to the mean of the control male group.
Table 1.
Primer sequences for quantitative real‐time PCR
| Gene | Forward primer (5′‐ to 3′) | Reverse primer (5′‐ to 3′) |
|---|---|---|
| Actb | GATGTATGAAGGCTTTGGTC | TGTGCACTTTTATTGGTCTC |
| Acta2 | CATCTTTCATTGGGATGGAG | TTAGCATACAGATCCTTCCTG |
| Aqp2 | CTTCCTTCGAGCTGCCTTC | CATTGTTGTGGAGAGCATTGA |
| Axin2 | AAGATCACAAAGAGCCAAAG | GAAAAAGTAGGTGACAACCAG |
| Ccnd1 | AACACTTCCTCTCCAAAATG | GAACTTCACATCTGTGGC |
| Lef1 | AAGAAATGAGAGCGAATGTC | CTAGTTCATAGTATTTGGCCTG |
| Pecam1 | CATCGCCACCTTAATAGTTG | CCAGAAACATCATCATAACCG |
| Wnt9b | ATGTCAGTTCCAGTTCAGG | TCTCCTTAAAGCCTCTCTG |
| Wnt7b | CCCGTGAGATCAAAAAGAAC | GACACTTACATTCCAGCTTC |
| Wnt4 | TCTCACAGTCCTTTGTGG | CATGTGTGTCAAGATGGC |
| Wnt11 | CCAATAAACTGATGCGTCTAC | ATTTACACTTCGTTTCCAGG |
| Gene | Accession number (Taqman Gene Expression Assays; Life Technologies, Grand Island, NY, USA) | |
| Ctnnb1 | Mm00483039_m1 | |
| Crabp2 | Mm00801693_g1 | |
| Vegfa | Mm00437304_m1 | |
| Renin | Mm0234887_mh | |
| Aldh1a2 | Mm00501306_m1 | |
| Crabp1 | Mm00442776_m1 |
Basal metabolic cage urine collection
Offspring at 2, 4 and 12 months of age (male: n = 7–11 per treatment group; female: n = 5–10 per treatment group) were acclimatized to individual metabolic cages two days prior to collection. Animals were then placed in individual metabolic cages for 24 h, with food and water consumption, body weight change and urine flow being recorded over 24 h. Urine samples were collected stored at −20°C for further analysis.
Water deprivation challenge
One week following initial basal urine collection, offspring at 4 and 12 months of age were subject to a 24 h water deprivation challenge in the metabolic cages. At 16.00 h, animals were placed in individual cages without access to water. Food was provided ad libitum. Food intake, body weight change and urine output were recorded. Urine samples were stored at −20°C for further analysis. Following the 24 h challenge, offspring were returned to their home cages, immediately offered water and their body weight monitored daily over the subsequent week. Animals were then culled by cervical dislocation and kidneys collected, as described above.
Urinalysis
Urinary sodium, chloride and potassium concentrations were measured for all urine samples by potentiometry using a Cobas Integra 400 Plus (Roche, Basel, Switzerland). Urine osmolality was assessed by freezing point depression using a Micro‐Osmette osmometer (Precision Systems, Natick, MA, USA).
Statistical analysis
All values are expressed as the mean ± SEM and analysed using Prism (GraphPad, La Jolla, CA, USA) or SPSS (IBM Corp., Armonk, NY, USA). Maternal was analysed by one‐way ANOVA. Multivariate analysis of variance (MANOVA) was conducted with the main effects being prenatal treatment, sex, and age or renal tubule type. For renal tubule lengths and renal function, there were significant effects of prenatal hypoxia, as well as interactions with sex. Therefore, data for males and females were analysed separately by two‐way ANOVA with treatment and age as factors, and Sidak post hoc tests were used when appropriate. Kidney structure analyses were conducted by two‐way ANOVA with treatment and kidney region, cell type or sex as factors. Student's t tests were used when comparing two groups. All data were tested for homogeneity of variance using Bartlett's test; if data showed heterogeneity of variance, data were analysed by non‐parametric means. Gene expression data were analysed by multiple t tests with a Bonferroni correction for multiple comparisons. A Pearson correlation coefficient was computed to assess the relationship between collecting duct cell composition and urine concentration capacity. P < 0.05 was considered statistically significant.
Results
Prenatal hypoxia reduces maternal arterial oxygen saturation ()
To investigate the effect of hypoxia during late gestation, pregnant dams were continuously housed in a hypoxia chamber at 12% O2 from E14.5 until birth (E19.5). Maternal under normal room conditions was 98.7% but decreased to 77.8% in the hypoxia chamber at E14.5 (Fig. 1 A). Maternal remained at this reduced level at E18.5.
Figure 1. Hypoxia chronically reduces maternal peripheral capillary oxygen saturation and leads to postnatal growth restriction.

A, maternal peripheral capillary oxygen saturation (, %) at E14.5 under standard room conditions (21% O2), following 1 h of hypoxia (12% O2, E14.5) and after 4 days of habitation in the chamber (12% O2, E18.5). Body weight (g) of male (B) and female (C) offspring from P0 to P21 (n = 2 offspring from 6–10 litters per group). Kidney weight (mg) of male (D) and female (E) offspring from P0 to P21 (n = 2 offspring from 6–11 litters per group). Kidney weight (mg) normalized to body weight (g) of male (F) and female (G) offspring from P0 to P21 (n = 2 offspring from 6–11 litters per group). Different lowercase letters between groups in (A) indicate statistical significance via one‐way ANOVA (P < 0.05) (n = 3). B–G, data analysed via two‐way ANOVA, *P < 0.05, **P < 0.01 by a Sidak post hoc test.
Prenatal hypoxia alters postnatal maturation of the renal tubules and collecting duct system in male offspring
We next examined the growth of the kidney during early postnatal life. We have previously reported that hypoxia‐exposed offspring are growth restricted at birth and throughout weaning, with male hypoxia‐exposed offspring displaying a 25% deficit of nephrons compared to control males (Walton et al. 2017). In the present study, we show that body weight (Fig. 1 B) and kidney mass (Fig. 1 D) was reduced during the lactation period in hypoxia‐exposed male offspring, although post hoc analysis demonstrated that this difference emerged at day 14. Kidney weight normalized to body weight at P14 was significantly reduced in hypoxia‐exposed males compared to controls (Fig. 1 F), suggesting that a slowed renal growth occurs predominantly between days 7 and 14. By contrast, although female hypoxia‐exposed offspring were growth‐restricted at birth until P21 (Fig. 1 C), kidneys of hypoxia‐exposed female offspring were the same weight as kidneys of control females from birth until P21 (Fig. 1 E and G). MANOVA revealed no statistically significant differerences in body or kidney weights between males and females from P0 to P21.
At weaning (P21), the proportion of renal cortex to renal medulla was significantly increased in kidneys from male hypoxia‐exposed offspring compared to controls (Fig. 2 A). To further investigate this phenomenon, unbiased design‐based stereology (Walton et al. 2016a) was used to assess tubular lengths in P21 kidneys. Kidneys of male hypoxia‐exposed offspring had an increase in total length of the proximal tubule (Fig. 2 B), comprising the predominant cortical tubule. Conversely, there was a trend towards decreased collecting duct length (Fig. 2 B) in hypoxia‐exposed males. By contrast to males, no differences in the proportion of cortex to medulla (Fig. 2 C) or lengths of the proximal tubule, thin descending limb of Henle, distal tubule or collecting duct were observed between control and hypoxia‐exposed female offspring at P21 (Fig. 2 D). MANOVA revealed that the lengths of proximal and distal tubules were not different between males and females; however, male offspring overall had significantly longer lengths of the thin descending limb of Henle (P = 0.01) and collecting ducts (P < 0.0001) compared to females. Furthermore, kidneys of male offspring had a significantly greater proportion of renal cortex to renal medulla length compared to females (P sex = 0.01 by two‐way ANOVA).
Figure 2. Prenatal hypoxia alters postnatal maturation of the renal tubules and collecting duct system in male offspring.

Renal cortex to medulla ratio in male (A) (n = 1 offspring from 8 litters per group) and female (C) offspring (n = 1 offspring from 3 litters per group) at P21. Lengths of the proximal tubule (PT, m), thin descending limb of Henle (TDLH, m), distal tubule (DT, m) and collecting duct (CD, m) in male (B) and female (D) offspring at P21 (n = 1 offspring from 8 litters per group). E, low power images of midline kidney sections from male offspring at P21, immunohistochemically stained for AQP2. Scale bar = 200 μm. F, quantification of AQP2 staining (% area) of male kidneys (n = 1 offspring from 6 litters per group). G, renal expression of Aqp2 mRNA in kidneys of male offspring at P21, presented relative to the control male with β‐actin as a housekeeper (n = 1 offspring from 11 litters per groups). H, higher power images showing AQP2 localization within the collecting ducts of the renal medulla of male offspring. Scale bar = 25 μm. I, mean cell number per collecting duct in kidneys of male offspring (n = 1 offspring from 6 litters). J, cellular composition of the collecting duct, expressed as the percentage of AQP2+ cells and V‐ATPase+ cells, in the renal cortex and medulla of male offspring (n = 1 offspring from 6 litters). Control: open points/bars; hypoxia: closed points/bars. Values are the mean ± SEM. A–G, data analysed by an unpaired Student's t test, *P < 0.05, ****P < 0.0001, # P = 0.059. I and J, data analysed via two‐way ANOVA.
Next, we examined the maturation of the collecting duct system in male offspring based on immunohistochemistry staining for AQP2, the vasopressin‐regulated water‐channel protein (Fig. 2 E and H). The proportion of renal tissue positively stained with AQP2 was reduced in hypoxia‐exposed males (Fig. 2 F), reflecting the decrease in collecting duct density. Intense AQP2 expression was concentrated on the apical surface of the collecting duct epithelial cells in the male hypoxia‐exposed offspring kidneys at P21. By contrast, kidneys from control offspring at P21 showed more basal AQP2 expression in collecting duct cells (Fig. 2 H). Relative Aqp2 mRNA expression was increased by 3‐fold in the male hypoxia‐exposed kidneys compared to controls (Fig. 2 G). Neither the total number of cells within individual collecting ducts (Fig. 2 I), nor the proportion of intercalated cells (V‐ATPase) compared to principle cells (AQP2) (Fig. 2 J) was different between control and hypoxia‐exposed males. By contrast, the proportion of tissue stained for AQP2 in P21 female kidneys was similar between treatment groups (control: 16.5 ± 4.0%; hypoxia: 15.0 ± 2.0%, P = 0.8). This was not surprising given that kidney weight and glomerular number did not differ between control and hypoxia‐exposed female offspring at P21 (Walton et al. 2017). Our findings indicate that the female kidney is more resilient than the male with respect to in utero hypoxic perturbation.
Aged male offspring exposed to prenatal hypoxia develop a urine concentrating defect
Given that the collecting ducts within the renal medulla and papilla are the final site of water reabsorption in the kidney, we hypothesized that hypoxia‐exposed male offspring may eventually have deficits in fluid homeostasis when the compensatory mechanism of the kidney fails. Urine osmolality was significantly reduced in both control male and female offspring at 12 months of age compared to 2 months (Fig. 3 A and B), suggesting a declining urine concentrating capacity with age. However, post hoc analysis showed that urine osmolality was reduced by ∼40% in hypoxia‐exposed male offspring compared to controls at 4 months of age, suggesting the age‐related decline in urine concentrating capacity occurred earlier in male offspring (Fig. 3 A).
Figure 3. Age‐related decline in urine concentrating capacity in male hypoxia‐exposed offspring.
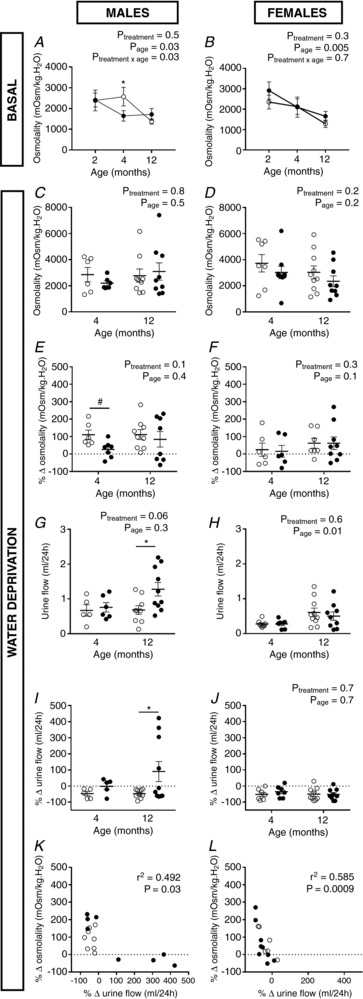
Urine osmolality (mOsm kg–1 H2O) measured in male (A) and female (B) mice given free access to food and water (basal) over a 24 h period at 2, 4 and 12 months of age. Response to a 24 h water deprivation challenge: urine osmolality (mOsm kg–1 H2O) in male (C) and female (D) mice, urine osmolality expressed as percentage change in osmolality (mOsm kg–1 H2O) from a basal to water‐deprived state in male (E) and female (F) offspring, urine flow (mL per 24 h) in male (G) and female (H) offspring and urine flow (mL per 24 h) from a basal to water‐deprived state in male (I) and female (J) offspring. Correlation analysis between the ability to reduce urine flow and urine osmolality during a 24 h water deprivation challenge in male (K) and female (L) offspring at 12 months of age. Control: open points; hypoxia: closed points. Values are the mean ± SEM. n = 1 offspring from 6–11 litters per group. All data analysed via two‐way ANOVA (*P < 0.05 by a Sidak post hoc test, # P = 0.05 by a paired t test), except (I), which was analysed by paired t tests (*P = 0.05)
We then examined the ability of the kidney to respond to a water deprivation challenge at 4 and 12 months of age. Male controls were able to decrease urine flow by ∼50% (Fig. 3 I) and increase urine osmolality (Fig. 3 E) over the 24 h water deprivation period at 4 and 12 months of age. At 4 months of age, male hypoxia‐exposed offspring did not increase urine osmolality to the same extent as controls when under water deprivation conditions (Fig. 3 E). At 12 months of age, a subset of hypoxia‐exposed male offspring increased urine flow under water deprivation conditions, leading to an overall difference to controls (P = 0.05) (Fig. 3 G and I). Urine flow reduction over the 24 h period correlated with increasing urine osmolality (Fig. 3G and I) in male and female offspring at 12 months of age. No differences in urine flow reduction (Fig. 3 H and J) or urine osmolality (Fig. 3 D and F) in response to 24 h water deprivation was observed between control and hypoxia‐exposed offspring at 4 and 12 months of age in female offspring. Food consumption did not differ between control and hypoxia‐exposed males at 4 months (control: 1.1 g ± 0.4 g, hypoxia: 1.2 g ± 0.3 g) or 12 months of age (control: 0.7 g ± 0.1 g, hypoxia: 0.7 g ± 0.2 g) throughout the water deprivation challenge. Similary, food consumption in female offspring was not different between treatment groups under water deprivation conditions at 4 months (control: 1.4 g ± 0.3 g, hypoxia: 1.1 g ± 0.3 g) or 12 months of age (control: 1.0 g ± 0.3 g, hypoxia: 0.8 g ± 0.2 g).
Correlation between urine concentration capacity and collecting duct composition in male offspring
Given the differences in both function and structure were specific to males, we went on to examine the correlation between urine concentration capacity and the structure of the renal medulla in males only. Kidney mass (Fig. 4 A and D) and the proportion of cortex to medulla (Fig. 4 B and E) did not differ between treatment groups at 2 and 4 months of age, indicating that catch up growth of the kidneys occurred after weaning in males exposed to prenatal hypoxia. Furthermore, this result suggests that gross structural abnormalities, such as medullary hypoplasia, did not contribute to the concentrating deficit. Microscopically, mild dilatation of the collecting ducts was evident in the renal papilla of hypoxia‐exposed males at 4 months of age (Fig. 4 F) but not at 2 months of age (Fig. 4 C).
Figure 4. Kidney morphology of male offspring at 2 and 4 months of age.
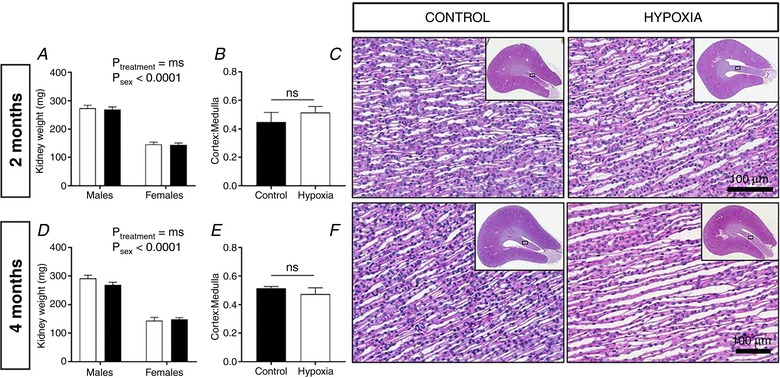
Kidney weight (mg) of male and female offspring at 2 (A) and 4 (D) months of age. Renal cortex to medulla ratio in male offspring at 2 (B) and 4 (E) months of age. Representative images of PAS staining of the inner renal medulla, with inset depicting gross renal morphology of male offspring at 2 (C) and 4 (F) months of age. Values are the mean ± SEM. Control: open bars; hypoxia: closed bars (n = 1 offspring from 4–5 litters per group). A, data analysed via two‐way ANOVA. B and E, data analysed via Student's t tests comparing same‐sex controls. Ns, not significant. [Color figure can be viewed at http://wileyonlinelibrary.com]
Medullary structure was examined in male kidneys at 12 months of age, at which point offspring are hypertensive, with albuminuria, glomerulosclerosis and fibrosis (Walton et al. 2017). Midline transverse sections of the adult male kidneys stained for AQP2 can be observed in Fig. 5 A. Clear atrophy of the renal papilla was observed in six of the ten hypoxia‐exposed kidneys examined (Fig. 5 A); no papillary atrophy was observed in any of the control kidneys. The cortex to medulla ratio (Fig. 5 B), collecting duct length (Fig. 5 C) and proximal tubule length (Fig. 5 D) were no longer different between control and hypoxia‐exposed males. Similarly to P21, lengths of the thin descending limb of Henle were similar between groups at 12 months of age (Fig. 5 E).
Figure 5. Correlation between urine concentration capacity and collecting duct composition in male offspring at 12 months of age.

A, gross morphology of kidneys of male offspring, with midline sections stained immunohistochemically for AQP2 (scale = 500 μm). B, renal cortical thickness normalized to papilla length in male offspring (n = 1 offspring from 5–6 litters per group). Total length (m) of the collecting duct system (C), proximal tubules (D) and thin descending limb of Henle (TDLH) (E) in kidneys of male offspring (n = 1 offspring from 5–6 litters per group). F, quantification of AQP2 staining (% area) of male kidneys (n = 1 offspring from 8 litters per group). G, sequential sections stained for AQP2 (principal cells, brown DAB staining) and V‐ATPase (intercalated cells, red DAB staining) in the cortical collecting ducts. Nuclei are stained with haematoxylin (blue). Scale bar = 50 μm. H, representative images of PAS staining of the inner renal medulla from offspring at 12 months of age. Scale bar = 50 μm. I, cellular composition of the collecting duct, expressed as the percentage of AQP2+ cells and V‐ATPase+ cells in the renal cortex and medulla (n = 1 offspring from 6–10 litters per group). Correlation analysis between the cellular composition of the (J) cortical collecting ducts (CCD) or (K) medullary collecting ducts (MCD) and ability to reduce urine flow during a 24 h water deprivation challenge. B–F, data analysed via Student's t tests comparing same‐sex controls, *P < 0.05. I, data analysed using two‐way ANOVA. J and K, data analysed using Pearson's correlation. Values are the mean ± SEM. Control: open points; hypoxia: closed points.
Immunohistochemistry revealed that AQP2 expression was decreased (Fig. 3 F and G) and also more diffusely distributed in the collecting duct cytoplasm in kidneys from hypoxia‐exposed animals compared to controls at 12 months of age (Fig. 5 G). Discernible tubular dilatation appeared in the renal papilla of most male hypoxia‐exposed offspring at 12 months (Fig. 3 G and H). Intense V‐ATPase staining was observed in cortical collecting ducts from a subset of hypoxia‐exposed kidneys, with a greater proportion of cortical collecting duct cells staining for V‐ATPase compared to AQP2 (Fig. 5 G). The renal cortical collecting duct consisted of ∼73.67% principal cells (AQP2‐positive) and 26.32% intercalated cells (V‐ATPase‐positive) in control male animals at 12 months of age (Fig. 5 I). However, there was a reduction in the proportion of principal cells and an increase in intercalated cells in the cortical collecting duct of kidneys from hypoxia‐exposed males (percentage principal cells: 58.46 ± 8.25 principal cells; percentage intercalated cells: 41.54 ± 8.25 intercalated cells; P < 0.05) (Fig. 3 I). Notably, there was much greater variation within this group compared to controls, with half of the samples presenting a greater proportion of V‐ATPase‐expressing intercalated cells compared to AQP2‐expressing principal cells. Fewer intercalated cells were present in medullary collecting ducts compared to cortical collecting ducts in control (percentage principal cells: 89.47 ± 2.81; percentage intercalated cells: 10.54 ± 2.81) and hypoxia‐exposed kidneys (percentage principal cells: 82.89 ± 4.11; percentage intercalated cells: 17.11 ± 4.11) (Fig. 5 I).
Pearson's correlation coefficient was used to determine whether the impaired urine concentration ability of the hypoxia‐exposed offspring might be associated with an altered cellular composition in the renal collecting duct. Overall, there was a strong, negative correlation between the percentage of AQP2‐expressing cells in the cortical collecting duct and urine concentrating ability (r = −0.872, n = 15, P < 0.0001, with r 2 = 0.785) (Fig. 5 J). Similarly, the percentage of AQP2‐expressing cells in the medullary collecting duct correlated with urine concentrating ability (r = −0.897, n = 15, P = 0.0001, with r 2 = 0.690) (Fig. 5 K). We also examined kidney sections from female offspring at 12 months of age and observed no differences in staining for AQP2 (control: 5.2 ± 1.2%; hypoxia: 5.9 ± 1.2%, P = 0.7)
Reduced Wnt and retinoic acid signalling in kidneys of juvenile males exposed to prenatal hypoxia
Having identified a defect in renal medulla function and structure in adult males, we re‐examined the kidneys of offspring at P7 (the timepoint at which kidney growth began to slow in hypoxia‐exposed males) to determine the contributing developmental pathways. Quantitative RT‐PCR analysis showed a significant reduction in Ctnnb1 expression in kidneys at P7 (Fig. 6 A). No changes in the expression of the canonical Wnt target genes (Axin2 and Lef1) or vasculogenesis markers (Pecam, Acta2 and Vegfa) were observed. However, prenatal hypoxia led to reductions in Flt1, Wnt7b, Wnt11 and Renin mRNA expression in P7 kidneys, as well as reduced expression of Crabp2, encoding a retinoic acid binding protein. Following Bonferroni adjustment for multiple comparisons, the reductions in Crabp2 and Ctnnb1 mRNA expression remained statistically significant. To examine this further, pregnant dams of a transgenic RARE‐lacZ reporter line of mice were housed in the hypoxia chamber from E14.5 to birth and male offspring were examined at P7. Kidneys of the RARElacZ line offspring exposed to hypoxia showed reduced β‐galactosidase activity (Fig. 3 B and D), indicating a lower than normal level of retinoic acid‐directed transcriptional activation at that timepoint. Dual staining of LacZ and AQP2 IHC revealed that retinoic acid activity was restricted to the collecting duct as described previously (Wong et al. 2011), although not every collecting duct was RA‐positive (Fig. 3 C and E). Quantification revealed the proportion of collecting ducts positive for RA was similar between control and hypoxia‐exposed offspring (Fig. 6 C).
Figure 6. Perturbed collecting duct growth in kidneys of male offspring at postnatal day 7.

A, quantitative RT‐PCR analysis of P7 male kidneys, normalized to the β‐actin housekeeper (n = 1 offspring from 8–10 litters per group). B, quantification of LacZ staining (% area) within kidneys of male offspring (n = 1 offspring from 3 litters per group). C, proportion of AQP2+ cells to LacZ+, AQP2+ cells in kidneys of male offspring at P7 (n=1 offspring from 3 litters per group). D, LacZ staining of P7 kidneys from control and hypoxia‐exposed males. Scale bar = 100 μm. E, dual LacZ (blue) and AQP2 (brown DAB) staining of P7 kidneys from control and hypoxia‐exposed males. Scale bar = 50 μm. F, immunoflourescence staining of AQP2 (principal cells) and V‐ATPase (intercalated cells) in the inner medulla and cortex of kidneys from male offspring. Scale bar = 25 μm. G, mean cell number per collecting duct in kidneys of male offspring (n = 1 offspring from 6 litters per group). H, cellular composition of the collecting duct, expressed as the percentage of AQP2+ cells and V‐ATPase+ cells in the renal cortex and medulla (n = 1 offspring from 6 litters per group; P < 0.05). A, data analysed by multiple t tests (*P < 0.05), with a Bonferroni correction for multiple corrections (#P < 0.05). C and G, data analysed via Student's t tests, *P < 0.05. Values are the mean ± SEM. Control: open bars/points; hypoxia: closed bars/points.
To assess the maturation of the collecting ducts at this timepoint, we investigated the expression of AQP2 and V‐ATPase in these mice using immunofluorescence staining (Fig. 6 F). There was a tendency for a reduced collecting duct cell number in the inner medulla (Fig. 6 G) of hypoxia‐exposed male offspring. However, both control and hypoxia‐exposed offspring presented a typical salt‐and‐pepper distribution of principal and intercalated cells within the collecting duct (Fig. 6 F). Quantification revealed no differences in the relative percentages of the cell types between control and hypoxia‐exposed kidneys in the renal cortex (Fig. 6 H). Similarly, analysis of the inner medulla showed no differences in collecting duct composition between control and hypoxia‐exposed kidneys (Fig. 6 H).
Discussion
The present study provides compelling evidence to show that prenatal hypoxia throughout late gestation affects the length, cellular identity and hence function of the collecting ducts of male offspring. These tubular alterations occurred in conjunction with a permanent reduction in nephron endowment. The altered maturation of the collecting duct system accelerated an age‐related decline in the urine concentrating capacity in male offspring exposed to hypoxia, and this was correlated with a reduced expression of AQP2 and a decrease in the number of principal cells. This is the first study to provide direct evidence showing that a common gestational stressor can disrupt postnatal development of the renal tubules and collecting ducts. Importantly, we highlight that sex strongly influences postnatal development and long‐term outcomes and thus should be considered as an important factor in the context of the developmental studies.
Nephron number is an important indicator of disrupted kidney development and the risk of hypertension. However, the implications of a gestational stressor extend beyond disrupted nephrogenesis to perturbed tubulogenesis. The renal tubular system, including the renal medulla/papilla, undergoes dramatic remodelling well into the postnatal period in rodents (Wilkinson et al. 2012; Walton et al. 2016a). To date, structural analyses of the renal medulla in infants are lacking; similar structural changes probably occur to support increased functional requirements, particularly an increased capacity to concentrate urine (Poláček et al. 1965). Abnormalities in urine concentrating capacity and acid/base homeostasis are seen in infants with intrauterine growth restriction (Robinson et al. 1990), indicating a potential deficit in medullary structure and function. We thus considered whether prenatal hypoxia would disrupt postnatal medullary development. In the mouse, the medulla is morphologically identifiable in late gestation (E15.5) (Cebrian et al. 2004), which lies within the duration of the hypoxic insult in the present study. Genetic activation of hypoxia signalling in renal stromal progenitors shows a significant impairment of tubular maturation (Gerl et al. 2017) and mice deficient in Cited1 have renal medullary dysplasia as a result of placental insufficiency (Sparrow et al. 2009). Similarly, transient mid‐gestational hypoxia in the mouse caused a permanent reduction in ureteric branching of the developing kidney (Wilkinson et al. 2015) partly as a result of aberrant Wnt/β‐catenin activity, which is critical for the processes of uretic bud branching morphogenesis, medulla formation and renal tubule elongation. In this model of late gestation hypoxia, Wnt/β‐catenin signalling, namely Ctnnb1 and a tendency for Wnt7b and Wnt11, was suppressed at P7. A deficiency of Wnt7b ( Yu et al. 2009 ) or Wnt11 ( Nagy et al. 2016 ) disrupts development of the kidney medullary tubular architecture, resulting in a compromised urine concentrating capacity. Therefore, deficits in Wnt/β‐catenin signalling following hypoxia strongly suggest the existence of an underlying mechanism for perturbed medullary development and function in these offspring.
Although the exact role of retinoic acid signalling in postnatal kidney is yet to be determined, its specific activity in principal cells and intercalated cells of the collecting duct system after birth (Wong et al. 2011) strongly suggests the involvement of endogenous retinoic acid in medullary patterning. In the present study, retinoic acid activity was diminished in hypoxia‐exposed offspring at P7, and this was associated with renal tubular abnormalities. The requirement for retinoic acid in the developing embryonic kidney has been observed in both in vivo studies (Moreau et al. 1998; Vilar et al. 1996), as well as in vitro, with maternal vitamin A deficiency leading to a permanent reduction in nephron endowment in rat offspring (Lelièvre‐Pégorier et al. 1998). A single bolus dose of retinoic acid during mid‐gestation was found to restore the nephron deficit in rat offspring exposed to maternal protein restriction (Makrakis et al. 2007), further highlighting the importance of appropriate retinoic acid activity in kidney development. However, the implications of retinoic acid deficiency in early postnatal life are not as well understood. Newborn male rats fed a vitamin A‐deficient diet showed marked glomerular abnormalities (Marín et al. 2005), although the maturation of the renal tubules and collecting ducts was not examined. Similarly, attempts to administer retinoic acid to baboons born pre‐term (which leads to reduced nephron number) showed that the therapy did not stimulate nephrogenesis, although, again, only glomerular development was considered (Sutherland et al. 2009). Thus, whether the reduction in retinoic acid activity in male hypoxia‐exposed mice simply reflects a reduced collecting duct surface area or has greater implications for the maturation of the collecting duct network remains to be clarified.
Renin, another gene associated with postnatal medulla development (Jeong et al. 2009), tended to be reduced in kidneys of male hypoxia‐exposed kidneys. Appropriate expression of the renin‐angiotensin system (RAS) components is a requirement for renal medulla formation, where mutation of RAS genes or pharmacological blockade of the RAS leads to medullary dysplasia and deficits in fluid homeostasis (Gerl et al. 2017). The expression of key vasculogenesis markers (Pecam, Acta2 and Vegfa) was not different. This may imply that there are no underlying deficits in the renal vasculature following intrauterine hypoxia, although we cannot discount possible subtle changes in vasa recta organization (as are critical for urine concentration in the medulla) arising following prenatal hypoxia.
Reduced renal mass at postnatal day 21 was associated with a reduced total length of the collecting duct network in male hypoxia‐exposed offspring. Despite no differences in collecting duct cell composition, there was a marked increase in apical AQP2 expression in collecting duct epithelial cells. The expression level and distribution of AQP2 closely correlate with an increased urine concentrating capacity from infancy to adulthood (Yasui et al. 1996). Increased apical AQP2 expression in the male offspring suggests hyper‐activation and possibly accelerated maturation of the collecting duct. We hypothesize that this ‘mature’ phenotype of AQP2 expression may allow the maintenance of fluid and electrolyte homeostasis in the face of a reduced collecting duct surface area. Indeed, despite early‐life disruption of renal growth, 2‐month‐old offspring maintained basal urine osmolality and no medullary hypoplasia was observed. All mice exhibited an age‐related decline in urine concentrating capacity, as observed in humans (Rowe et al. 1976; Phillips et al. 1984) and animals (Bengele et al. 1981; Perucca et al. 2007). However, the further reduction in osmolality of 4‐month‐old male hypoxia‐exposed offspring suggests an early‐onset decline in the urine concentrating capacity in these animals. Age‐related decline in urine concentration is multifactorial, as linked to progressive loss of functional glomeruli (Walton et al. 2017), a reduced secretion of vasopressin (Tian et al. 2004), an impaired cellular response to vasopressin (Beck & Yu, 1982; Corman et al. 1992) and reduced GFR (Levinsky et al. 1959), indicating that hypoxia offspring are at increased risk of renal disease.
Although basal function was largely maintained, a subset of male hypoxia‐exposed animals was unable to respond appropriately to a water deprivation challenge. This deficit bears striking similarity to the Cited1 mutant mice, in which a deficit emerged under water deprivation (Sparrow et al. 2009). We turned our attention to the cellular composition of the collecting duct of male offspring because this is the final site of water reabsorption in the kidney. We observed a reduced expression of AQP2, discernable tubular dilatation and disruption of the typical ‘salt and pepper’ distribution of the principal and intercalated cells within the collecting duct in kidneys from male hypoxia‐exposed offspring. Because collecting duct cell composition was unaffected by hypoxia in juvenile mice, a loss of AQP2+ cells suggests that remodelling occurred between weaning and old age. Interestingly, tubular cells in the adult kidney are quiescent under normal conditions; however, postnatal remodelling of the collecting duct has been reported in nephrogenic diabetes insipidus (Kim et al. 2003; Christensen et al. 2006) and a decrease in principal cells leads to urine concentrating defects and sodium wasting in Notch mutants (Jeong et al. 2009). Furthermore, AQP2 is subject to a variety of post‐translational modifications that affect cellular localization, activity and processing, and thus kidney function (Moeller et al. 2011). In rats, the age‐related decline in AQP2 protein and urine‐concentrating capacity is not associated with a decrease in Aqp2 mRNA transcripts, suggesting significant post‐transcriptional downregulation of AQP2 (Combet et al. 2008). Vasopressin levels, which control the abundance of cell‐surface expressed AQP2 via phosphorylation of AQP2, are also known to decline with ageing in humans (Tian et al. 2004). Thus, future studies should aim to perform in‐depth analyes of the vasopressin/V2 receptor pathway and post‐transcriptional modification of the AQP2 protein to shed light on the altered AQP2 expression at P21 and the urine concentrating deficit that emerged with age in male hypoxia‐exposed offspring. Of note, we found only a subset (∼50%) of male offspring exhibited renal deficits following prenatal hypoxia exposure. Future research should endeavour to better understand the differential outcomes following intrauterine insult.
Unlike males, female hypoxia‐exposed offspring responded appropriately to water deprivation and showed no disruption to the collecting duct architecture. Sex‐specific adaptations of the placenta mediate differences in fetal growth and survival (Clifton, 2010), with males being at higher risk of neonatal morbidity and mortality (Clifton, 2010). We have previously reported that placental adaptations in the regulation of vasculogenesis, glucocorticoid activity and nutrient transport were more evident in female fetuses exposed to chronic late‐gestational hypoxia (Cuffe et al. 2014a; Cuffe et al. 2014b), ensuring appropriate organ growth under hypoxic conditions. A recent study by Veiras et al. (2017b) showed that female rodents have a greater expression of heme oxygenase‐1 (HO1) (an enzyme induced by pro‐oxidant and inflammatory stimuli) compared to males. Because HO1 is considered to be protective against oxidative damage, higher expression of HO1 in females may confer an advantage against pathological hypoxia in this model. This ‘female advantage’ is seen in the human population, where age‐related renal functional decline occurs to a lesser extent in women than men (Berg, 2006; Baylis, 2009). The cardiorenal protective effects of oestrogens are assumed to protect females in the pre‐menopausal period from cardiovascular and renal disease risk, in part by preserving nitric oxide bioavailablity to maintain endothelial function. Indeed, our previous studies have shown that hypertension, endothelial dysfunction and vascular remodelling were more severe in hypoxia‐exposed male offspring compared to females (Walton et al. 2016b; Walton et al. 2017). These deficits probably contributed to the progressive loss of functional nephrons (glomeruli and tubules) in ageing hypoxia‐exposed males (Walton et al. 2017). Recently, distinct differences in key transporter/channel expression between male and female rats (Veiras et al. 2017a) have provided further evidence that renal fluid and electrolyte handling differ between the sexes. Future studies should aim to determine the underlying mechanisms of reno‐protection in the embryonic female kidney, during the hypoxic insult, because it is currently unknown why females show no obvious signs of renal damage but still develop hypertension in late adulthood.
Conclusions
The present study provides compelling evidence showing that prenatal hypoxia has a long‐lasting impact on postnatal development. Hypoxia disrupted collecting duct development during the early postnatal period, with altered patterning evident at 12 months of age. Although capable of maintaining basal fluid and electrolyte excretion, hypoxia‐exposed male offspring displayed a compromised response to water deprivation. These data suggest that the kidney had adapted to a nephron deficit; however, a renal phenotype was unmasked when presented with a functional challenge. The underlying mechanisms may be related to hypoxia‐induced suppression of Wnt/ß‐catenin and retinoic acid signalling postnatally; future work should focus on the mechanisms mediating the outcomes following hypoxia and also on whether these outcomes are reversible through therapy. Our report highlights that the non‐nephron compartments of the kidney should be considered in conjunction with the number of glomeruli in future studies. Furthermore, the present study has uncovered many unappreciated facets of kidney development within the context of an environmental perturbation, including postnatal maturation and the influence of sex.
Additional information
Competing interests
The authors declare that they have no competing interests.
Author contributions
SLW, RRS, MHL, JL and KMM were responsible for the conception and design of this work. SLW, RRS, JL and KMM were responsible for acquisition, analysis or interpretation of data. All authors were responsible for drafting the work or revising it critically for important intellectual content. All authors approved the final version of the manuscript submitted for publication.
Funding
This work was supported by the National Health and Medical Research Council of AustraliaAPP1009338). S. Walton was supported by an Australian Postgraduate Award. M. Little is an NHMRC Senior Principal Research Fellow. K. Moritz is an NHMRC Senior Research Fellow.
Acknowledgements
We thank Richard Schlegel, Kym French and Sarah Steane for their technical support.
Biography
Sarah Walton studied biomedical science before obtaining a PhD with Professor Karen Moritz, Professor Melissa Little and Dr Joan Li at The University of Queensland in Australia. She is presently a postdoctoral research fellow at Monash University. Her research focuses on understanding the long‐term health outcomes of infants following pregnancy complications, particularly with regard to prenatal hypoxia and its association with cardiovascular and renal disease.

Edited by: Laura Bennet & Janna Morrison
Linked articles This article is highlighted in a Perspectives article by Woodman&Bourque. To read this article, visit http://doi.org/10.1113/JP276318.
References
- Atiyeh BA, Dabbagh SS & Gruskin AB (1996). Evaluation of renal function during childhood. Pediatr Rev 17, 175–180. [DOI] [PubMed] [Google Scholar]
- Baylis C (2009). Sexual dimorphism in the aging kidney: differences in the nitric oxide system. Nat Rev Nephrol 5, 384–396. [DOI] [PubMed] [Google Scholar]
- Beck N & Yu BP (1982). Effect of aging on urinary concentrating mechanism and vasopressin‐dependent cAMP in rats. Am J Physiol Renal Physiol 243, F121–F125. [DOI] [PubMed] [Google Scholar]
- Bengele HH, Mathias RS, Perkins JH & Alexander EA (1981). Urinary concentrating defect in the aged rat. Am J Physiol Renal Physiol 240, F147–F150. [DOI] [PubMed] [Google Scholar]
- Berg UB (2006). Differences in decline in GFR with age between males and females. Reference data on clearances of inulin and PAH in potential kidney donors. Nephrol Dial Transplant 21, 2577–2582. [DOI] [PubMed] [Google Scholar]
- Brenner BM, Garcia DL & Anderson S (1988). Glomeruli and blood pressure. Less of one, more the other? Am J Hypertens 1, 335–347. [DOI] [PubMed] [Google Scholar]
- Brenner BM & Mackenzie HS (1997). Nephron mass as a risk factor for progression of renal disease. Kidney Int Suppl 63, S124–127. [PubMed] [Google Scholar]
- Cebrian C, Borodo K, Charles N & Herzlinger DA (2004). Morphometric index of the developing murine kidney. Dev Dyn 231, 601–608. [DOI] [PubMed] [Google Scholar]
- Christensen BM, Kim YH, Kwon TH & Nielsen S (2006). Lithium treatment induces a marked proliferation of primarily principal cells in rat kidney inner medullary collecting duct. Am J Physiol Renal Physiol 291, F39–F48. [DOI] [PubMed] [Google Scholar]
- Clifton VL (2010). Review: Sex and the human placenta: Mediating differential strategies of fetal growth and survival. Placenta 31, S33–S39. [DOI] [PubMed] [Google Scholar]
- Combet S, Gouraud S, Gobin R, Berthonaud V, Geelen G, Corman B & Verbavatz JM (2008). Aquaporin‐2 downregulation in kidney medulla of aging rats is posttranscriptional and is abolished by water deprivation. Am J Physiol Renal Physiol 294, F1408–F1414. [DOI] [PubMed] [Google Scholar]
- Corman B, Roinel N & Geelen G (1992). Plasma vasopressin and cortical nephron function in aging rats. Mech Ageing Dev 62, 263–277. [DOI] [PubMed] [Google Scholar]
- Cuffe J, Walton S, Singh R, Spiers J, Bielefeldt‐Ohmann H, Wilkinson L, Little M & Moritz K (2014a). Mid‐to late term hypoxia in the mouse alters placental morphology, glucocorticoid regulatory pathways and nutrient transporters in a sex‐specific manner. J Physiol 592, 3127–3141. [DOI] [PMC free article] [PubMed] [Google Scholar]
- Cuffe J, Walton S, Steane S, Singh R, Simmons D & Moritz K (2014b). The effects of gestational age and maternal hypoxia on the placental renin angiotensin system in the mouse. Placenta 35, 953–961. [DOI] [PubMed] [Google Scholar]
- Cullen‐McEwen LA, Douglas‐Denton RN & Bertram JF (2012). Estimating total nephron number in the adult kidney using the physical disector/fractionator combination. Methods Mol Biol 886, 333–350. [DOI] [PubMed] [Google Scholar]
- Dorey ES, Pantaleon M, Weir KA & Moritz KM (2014). Adverse prenatal environment and kidney development: implications for programing of adult disease. Reproduction 147, R189–R198. [DOI] [PubMed] [Google Scholar]
- Gerl K, Steppan D, Fuchs M, Wagner C, Willam C, Kurtz A & Kurt B (2017). Activation of hypoxia signaling in stromal progenitors impairs kidney development. Am J Pathol 187, 1496–1511. [DOI] [PubMed] [Google Scholar]
- Giussani DA (2016). The fetal brain sparing response to hypoxia: physiological mechanisms. J Physiol 594, 1215–1230. [DOI] [PMC free article] [PubMed] [Google Scholar]
- Grundy D (2015). Principles and standards for reporting animal experiments in The Journal of Physiology and Experimental Physiology. J Physiol 593:2547–2549. [DOI] [PMC free article] [PubMed] [Google Scholar]
- Hinchliffe S, Sargent P, Howard C, Chan Y & Van Velzen D (1991). Human intrauterine renal growth expressed in absolute number of glomeruli assessed by the disector method and Cavalieri principle. Lab Invest 64, 777–784. [PubMed] [Google Scholar]
- Hughson M, Farris AB, 3rd , Douglas‐Denton R, Hoy WE & Bertram JF (2003). Glomerular number and size in autopsy kidneys: the relationship to birth weight. Kidney Int 63, 2113–2122. [DOI] [PubMed] [Google Scholar]
- Jeong H‐W, Jeon US, Koo B‐K, Kim W‐Y, Im S‐K, Shin J, Cho Y, Kim J & Kong Y‐Y (2009). Inactivation of Notch signaling in the renal collecting duct causes nephrogenic diabetes insipidus in mice. J Clin Invest 119, 3290. [DOI] [PMC free article] [PubMed] [Google Scholar]
- Keller G, Zimmer G, Mall G, Ritz E & Amann K (2003). Nephron number in patients with primary hypertension. N Engl J Med 348, 101–108. [DOI] [PubMed] [Google Scholar]
- Kim Y‐H, Kwon T‐H, Christensen BM, Nielsen J, Wall SM, Madsen KM, Frøkiær J & Nielsen S (2003). Altered expression of renal acid‐base transporters in rats with lithium‐induced NDI. Am J Physiol Renal Physiol 285, F1244–F1257. [DOI] [PubMed] [Google Scholar]
- Layton AT, Layton HE, Dantzler WH & Pannabecker TL (2009). The mammalian urine concentrating mechanism: hypotheses and uncertainties. Physiology 24, 250–256. [DOI] [PubMed] [Google Scholar]
- Lelièvre‐Pégorier M, Vilar J, Ferrier ML, Moreau E, Freund N, Gilbert T & Merlet‐Bénichou C (1998). Mild vitamin A deficiency leads to inborn nephron deficit in the rat. Kidney Int 54, 1455–1462. [DOI] [PubMed] [Google Scholar]
- Levinsky NG, Davidson DG & Berliner RW (1959). Effects of reduced glomerular filtration on urine concentration in the presence of antidiuretic hormone. J Clin Invest 38, 730. [DOI] [PMC free article] [PubMed] [Google Scholar]
- Makrakis J, Zimanyi MA & Black MJ (2007). Retinoic acid enhances nephron endowment in rats exposed to maternal protein restriction. Pediatr Nephrol 22, 1861. [DOI] [PubMed] [Google Scholar]
- Marín MP, Esteban‐Pretel G, Alonso R, Sado Y, Barber T, Renau‐Piqueras J & Timoneda J (2005). Vitamin A deficiency alters the structure and collagen IV composition of rat renal basement membranes. J Nutr 135, 695–701. [DOI] [PubMed] [Google Scholar]
- Moeller HB, Olesen ET & Fenton RA (2011). Regulation of the water channel aquaporin‐2 by posttranslational modification. Am J Physiol Renal Physiol 300, F1062–F1073. [DOI] [PubMed] [Google Scholar]
- Moreau E, Vilar J, Lelièvre‐Pégorier M, Merlet‐Bénichou C & Gilbert T (1998). Regulation of c‐ret expression by retinoic acid in rat metanephros: implication in nephron mass control. Am J Physiol Renal Physiol. 275, F938–F945. [DOI] [PubMed] [Google Scholar]
- Nagy II, Xu Q, Naillat F, Ali N, Miinalainen I, Samoylenko A & Vainio SJ (2016). Impairment of Wnt11 function leads to kidney tubular abnormalities and secondary glomerular cystogenesis. BMC Dev Biol 16, 30. [DOI] [PMC free article] [PubMed] [Google Scholar]
- Niederreither K, Fraulob V, Garnier JM, Chambon P & Dolle P (2002). Differential expression of retinoic acid‐synthesising (RALDH) enzymes during fetal development and organ differentiation in the mouse. Mech Dev 110, 165–171 [DOI] [PubMed] [Google Scholar]
- Nieto VMG, Yanes MIL, Zamorano MM, González MJH, Aros CP & Garin EH (2008). Renal concentrating capacity as a marker for glomerular filtration rate. Acta Paediatr 97, 96–99. [DOI] [PubMed] [Google Scholar]
- Perucca J, Bouby N, Valeix P & Bankir L (2007). Sex difference in urine concentration across differing ages, sodium intake, and level of kidney disease. Am J Phys Regul Integr Comp Physiol 292, R700–R705. [DOI] [PubMed] [Google Scholar]
- Phillips PA, Rolls BJ, Ledingham JG, Forsling ML, Morton JJ, Crowe MJ & Wollner L (1984). Reduced thirst after water deprivation in healthy elderly men. N Engl J Med 311, 753–759. [DOI] [PubMed] [Google Scholar]
- Phua YL, Gilbert T, Combes A, Wilkinson L & Little MH (2016). Neonatal vascularization and oxygen tension regulate appropriate perinatal renal medulla/papilla maturation. J Pathol 238, 665–676. [DOI] [PubMed] [Google Scholar]
- Poláček E, Vocel J, Neugebauerova L, Šebková M & Věchetová E (1965). The osmotic concentrating ability in healthy infants and children. Arch Dis Child 40, 291. [DOI] [PMC free article] [PubMed] [Google Scholar]
- Robinson D, Weiner CP, Nakamura KT & Robillard JE (1990). Effect of intrauterine growth retardation on renal function on day one of life. Am J Perinatol 7, 343–346. [DOI] [PubMed] [Google Scholar]
- Rowe J, Shock N & DeFronzo R (1976). The influence of age on the renal response to water deprivation in man. Nephron 17, 270–278. [DOI] [PubMed] [Google Scholar]
- Sparrow DB, Boyle SC, Sams RS, Mazuruk B, Zhang L, Moeckel GW, Dunwoodie SL & de Caestecker MP (2009). Placental insufficiency associated with loss of cited1 causes renal medullary dysplasia. J Am Soc Nephrol 20, 777–786. [DOI] [PMC free article] [PubMed] [Google Scholar]
- Sutherland MR, Gubhaju L, Yoder BA, Stahlman MT & Black MJ (2009). The effects of postnatal retinoic acid administration on nephron endowment in the preterm baboon kidney. Pediatr Res 65:397. [DOI] [PMC free article] [PubMed] [Google Scholar]
- Tian Y, Serino R & Verbalis JG (2004). Downregulation of renal vasopressin V2 receptor and aquaporin‐2 expression parallels age‐associated defects in urine concentration. Am J Physiol Renal Physiol 287, F797–F805. [DOI] [PubMed] [Google Scholar]
- Veiras LC, Girardi ACC, Curry J, Pei L, Ralph DL, Tran A, Castelo‐Branco RC, Pastor‐Soler N, Arranz CT, Yu ASL & McDonough AA (2017). Sexual dimorphic pattern of renal transporters and electrolyte homeostasis. J Am Soc Nephrol 28, 3504–3517. [DOI] [PMC free article] [PubMed] [Google Scholar]
- Vilar J, Gilbert T, Moreau E & Merlet‐Bénichou C (1996). Metanephros organogenesis is highly stimulated by vitamin A derivatives in organ culture. Kidney Int 49, 1478–1487. [DOI] [PubMed] [Google Scholar]
- Walton SL, Bielefeldt‐Ohmann H, Singh RR, Li J, Paravicini TM, Little MH & Moritz KM (2017). Prenatal hypoxia leads to hypertension, renal renin‐angiotensin system activation and exacerbates salt‐induced pathology in a sex‐specific manner. Sci Reports 7, 8241. [DOI] [PMC free article] [PubMed] [Google Scholar]
- Walton SL, Moritz KM, Bertram JF & Singh RR (2016a). Lengths of nephron tubule segments and collecting ducts in the CD‐1 mouse kidney: an ontogeny study. Am J Physiol Renal Physiol 311, F976–F983. [DOI] [PubMed] [Google Scholar]
- Walton SL, Singh RR, Tan T, Paravicini TM & Moritz KM (2016b). Late gestational hypoxia and a postnatal high salt diet programs endothelial dysfunction and arterial stiffness in adult mouse offspring. J Physiol 594, 1451–1463. [DOI] [PMC free article] [PubMed] [Google Scholar]
- Wilkinson L, Kurniawan ND, Phua YL, Nguyen MJ, Li J, Galloway GJ, Hashitani H, Lang RJ & Little MH (2012). Association between congenital defects in papillary outgrowth and functional obstruction in Crim1 mutant mice. J Pathol 227, 499–510. [DOI] [PubMed] [Google Scholar]
- Wilkinson LJ, Neal CS, Singh RR, Sparrow DB, Kurniawan ND, Ju A, Grieve SM, Dunwoodie SL, Moritz KM & Little MH (2015). Renal developmental defects resulting from in utero hypoxia are associated with suppression of ureteric β‐catenin signaling. Kidney Int 87, 975–983. [DOI] [PubMed] [Google Scholar]
- Wong YF, Kopp JB, Roberts C, Scambler PJ, Abe Y, Rankin AC, Dutt N, Hendry BM & Xu Q (2011). Endogenous retinoic acid activity in principal cells and intercalated cells of mouse collecting duct system. PLoS ONE 6, e16770. [DOI] [PMC free article] [PubMed] [Google Scholar]
- Yasui M, Marples D, Belusa R, Eklof A, Celsi G, Nielsen S & Aperia A (1996). Development of urinary concentrating capacity: role of aquaporin‐2. Am J Physiol Renal Physiol 271, F461–F468. [DOI] [PubMed] [Google Scholar]
- Yu J, Carroll TJ, Rajagopal J, Kobayashi A, Ren Q & McMahon AP (2009). A Wnt7b‐dependent pathway regulates the orientation of epithelial cell division and establishes the cortico‐medullary axis of the mammalian kidney. Development 136, 161–171. [DOI] [PMC free article] [PubMed] [Google Scholar]