

Abstract
We present the genome-wide chromatin accessibility profiles of 410 tumor samples spanning 23 cancer types from The Cancer Genome Atlas. We identify 562,709 transposase-accessible DNA elements that substantially extend the compendium of known cis-regulatory elements. Integration of ATAC-seq with TCGA multi-omic data identifies a large number of putative distal enhancers that distinguish molecular subtypes of cancers, uncovers specific driving transcription factors via protein-DNA footprints, and nominates long-range gene-regulatory interactions in cancer. These data reveal genetic risk loci of cancer predisposition as active DNA regulatory elements in cancer, identify gene-regulatory interactions underlying cancer immune evasion, and pinpoint noncoding mutations that drive enhancer activation and may impact patient survival. These results suggest a systematic approach to understand the noncoding genome in cancer to advance diagnosis and therapy.
One Sentence Summary:
Chromatin accessibility profiling identifies principles of epigenetic regulation in 23 primary human cancers.
Cancer is a highly heterogeneous group of diseases, with each tumor type exhibiting distinct clinical features, patient outcomes, and therapeutic responses. The Cancer Genome Atlas (TCGA) was established to characterize this heterogeneity and understand the molecular underpinnings of cancer (1). Through large-scale genomic and molecular analyses, TCGA has revealed an exquisite diversity of genomic aberrations, altered transcriptional networks, and tumor subtypes that have engendered a more comprehensive understanding of disease etiologies, and laid the foundations for novel therapeutics and impactful clinical trials.
Work from TCGA and many others has demonstrated the importance of the epigenome to cancer initiation and progression (2). Profiling of cancer-specific coding mutations through whole exome sequencing has identified prominent driver mutations in genes encoding chromatin remodeling enzymes and modifiers of DNA methylation. These mutations drive alterations in the epigenome which, in turn, can establish the dysregulated cellular phenotypes that have become known as the hallmarks of cancer (3). While many principles of chromatin regulation have been elucidated in cultured cancer cells, epigenomic studies of primary tumors are uniquely valuable, capturing the genuine ecosystem of heterotypic tumor and stromal cell interactions and the impacts of factors in the tumor microenvironment such as hypoxia, acidosis, and matrix stiffness (4). TCGA has carried out targeted DNA methylation profiling of more than 10,000 samples, and more recently whole genome bisulfite sequencing of 39 TCGA tumor samples (5). This data-rich resource has identified cancer-specific differentially methylated regions, providing an unprecedented view of epigenetic heterogeneity in cancer. Integration of DNA methylation and additional TCGA data types has enabled the prediction of functional regulatory elements (6–8), and the identification of novel cancer subtypes (9–13). Additional work has identified cancer-relevant variable enhancer loci using histone modifications (14) and enhancer RNA sequencing (15). These studies represent, to date, the largest genome-wide epigenomic profiling efforts in primary human cancer samples.
Recently, the advent of the assay for transposase-accessible chromatin using sequencing (ATAC-seq) (16) has enabled the genome-wide profiling of chromatin accessibility in small quantities of frozen tissue (17). Because accessible chromatin is a hallmark of active DNA regulatory elements, ATAC-seq makes it possible to assess the gene regulatory landscape in primary human cancers. Combined with the richness of diverse, orthogonal data types in TCGA, the chromatin accessibility landscape in cancer provides a key link between inherited and somatic mutations, DNA methylation, long-range gene regulation, and ultimately gene expression changes that impact cancer prognosis and therapy.
Results:
ATAC-seq in frozen human cancer samples is highly robust
We profiled the chromatin accessibility landscape for 23 types of primary human cancers, represented by 410 tumor samples derived from 404 donors from TCGA. These 23 cancer types are representative of the diversity of human cancers (Fig. 1A, Data S1). From the 410 tumor samples, we generated technical replicates from 386 samples, yielding 796 genome-wide chromatin accessibility profiles (Data S1). Given the size of this cohort, we first ensured that all generated ATAC-seq data could be uniquely mapped to the expected donor through comparison with single nucleotide polymorphism (SNP) genotyping calls (Fig. S1A). In all samples, the genotype from the ATAC-seq data generated in this study correlated most highly with previously published genotyping array data for the expected donor compared to all other 11,126 TCGA donors. All ATAC-seq data included in this study passed a minimum threshold of enrichment of signal over background (Fig. S1B-D; Data S1) with most samples showing a characteristic fragment size distribution with clear nucleosomal periodicity (Fig. S1E). With this high-quality set of 410 tumor samples, we identified 562,709 reproducible (observed in more than one replicate) pan-cancer peaks of chromatin accessibility (Fig. 1B and Data S2). These peaks were identified using a normalized peak score metric to enable direct comparison of peaks across samples of unequal sequencing depth, with each cancer type having an average of 105,585 peaks (range 56,125 to 215,978; Fig. 1B, S1F; see methods). Reproducibility within the pan-cancer peak set was high for technical replicates (different nuclei from the same tumor sample; Fig. S1G and S1H), intra-tumor replicates (different samples from the same tumor; Fig. S1I), and inter-tumor replicates (tumor samples from different donors; Fig. S1J and S1K).
Fig. 1. Pan-cancer ATAC-seq of TCGA samples identifies diverse regulatory landscapes.
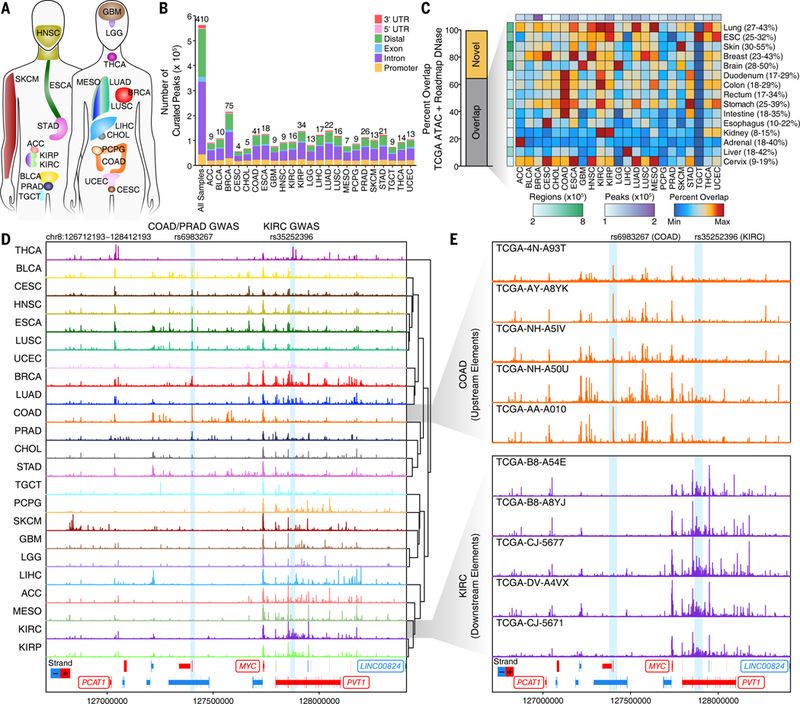
(A) Diagram of the 23 cancer types profiled in this study. Colors are kept consistent throughout the manuscript. Abbreviations are defined in Data S1. (B) Pan-cancer peak calls from ATAC-seq data. Peak calls from each cancer type are shown individually in addition to the 562,709 peaks that represent the pan-cancer merged peak set. Color indicates the type of genomic region overlapped by the peak. The numbers shown above each bar represent the number of samples profiled for each cancer type. (C) Overlap of cancer type-specific ATAC-seq peaks with Roadmap DNase-seq peaks from various tissues and cell types. Left, the percent of ATAC-seq peaks that are overlapped by one or more Roadmap peaks. Right, a heatmap of the percent overlap observed for each ATAC-seq peak set within the Roadmap DNase-seq peak set. Colors are scaled according to the minimum and maximum overlaps which are indicated numerically to the right of the DNase-seq peak set names. The total number of ATAC-seq peaks (white-to-purple) or Roadmap DNase-seq regions (white-to-green) are shown colorimetrically. (D) Normalized ATAC-seq sequencing tracks of all 23 cancer types at the MYC locus. Each track represents the average accessibility per 100-bp bin across all replicates. Known GWAS SNPs rs6983267 (COAD, PRAD) and rs35252396 (KIRC) are highlighted with blue boxes. Region shown represents chr8:126712193–128412193. (E) Normalized ATAC-seq sequencing tracks of 5 different colon cancer samples (top, orange) and kidney renal clear cell cancer samples (bottom, purple) shown across the same MYC locus as in Figure 1D. Known GWAS SNPs rs6983267 (COAD, PRAD) and rs35252396 (KIRC) are highlighted with blue boxes. Region shown represents chr8:126712193–128412193.
Cancer chromatin accessibility extends the dictionary of DNA regulatory elements
The pan-cancer and cancer type-specific peak sets generated in this study enabled quantification of the number of DNA regulatory elements identified. To do this, we compared the regions defined by our pan-cancer and cancer type-specific peak sets to the regions defined by the Roadmap Epigenomics Project DNase I hypersensitive sites sequencing (DNase-seq) studies (18), finding a median of 34.4% overlap between the cancer type-specific peak sets and the various Roadmap tissue type peak sets with the strongest overlap occurring in the expected combinations (Fig. 1C and Data S3). In total, approximately 65% of the pan-cancer peaks identified in this study had overlap with previously observed regulatory elements, highlighting both the consistency of our results with published data sets and the large number of additional putative regulatory elements observed in this study (Fig. 1C). Given the extensive coverage of Roadmap DNase-seq studies in healthy tissues, our results suggested that the disease context of cancer unveils the activity of additional DNA regulatory elements. Moreover, overlap of the ATAC-seq-defined DNA regulatory elements with ChIP-seq-defined chromHMM regulatory states shows a strong enrichment of accessible chromatin sites in promoter and enhancer regions, as expected (Fig. S1L). While we profiled many samples in some cancer types [i.e. breast invasive carcinoma (BRCA), 75 tumor samples], we profiled fewer samples in multiple other cancer types [i.e. cervical squamous cell carcinoma (CESC), 4 tumor samples] (Fig. 1B). By estimating the number of unique peaks added with each additional sample, we found that cancer types have an estimated average of 169,822 total peaks (range 97,995 to 309,313) at saturation (Fig. S1M, S1N, and Data S3), suggesting that profiling of additional samples of each cancer type would further expand the repertoire of regulatory elements.
Noncoding DNA elements reveal distinct cancer gene regulation and genetic risks
The MYC proto-oncogene locus provides a prime illustration of the diversity of the chromatin accessibility landscape across cancer types. MYC is embedded in a region with multiple DNA regulatory elements and noncoding transcripts that regulate MYC in a tissue-specific fashion (19). We observed sufficient diversity in the chromatin accessibility landscape of the MYC locus to enable clustering of cancer types into two primary categories: (i) cancer types with extensive chromatin accessibility at 5’ and 3’ DNA elements, such as colon adenocarcinoma (COAD), and (ii) cancer types with chromatin accessibility primarily at 3’ regulatory elements, such as kidney renal clear cell carcinoma (KIRC) (Fig. 1D). This trend is consistent across different samples of the same cancer type, as shown for COAD and KIRC (Fig. 1E) and is similar to the regulation observed in the HOXD locus (20).
Genome-wide association studies (GWAS) have identified numerous inherited risk loci for cancer susceptibility. However, many of these SNPs reside in the noncoding genome within known DNA regulatory elements. In the MYC locus, we identify known sites of chromatin accessibility, including peaks surrounding functionally validated GWAS cancer susceptibility SNPs (rs6983267 and rs35252396; Fig. 1D and 1E). SNP rs6983267 is associated with increased susceptibility to colon adenocarcinoma and prostate adenocarcinoma (PRAD) (21–23), consistent with the presence of focal chromatin accessibility in these cancer types. However, SNP rs6983267 has not been previously associated with breast cancer or any squamous tumor types, which also have strong chromatin accessibility at this regulatory element in our ATAC-seq data (Fig. 1D). Similarly, SNP rs35252396 has been associated with kidney renal clear cell cancer, and, in our data, shows strong accessibility in samples from kidney cancer types as well as breast and thyroid carcinoma (THCA), suggesting a potential role for these SNPs in previously unappreciated cancer contexts.
To visualize global patterns from our diverse ATAC-seq datasets, we performed Pearson correlation hierarchal clustering on distal and promoter elements (Fig. 2A). We found that distal elements exhibited a greater specificity and wider dynamic range of activity in association with cancer types, while promoter element accessibility was less cancer type-specific and showed similar patterns of correlation to global gene expression, as measured by RNA-seq (Fig. 2A). This functional specificity of distal regulatory elements was also previously observed in healthy tissues and in development (24, 25). Using t-distributed stochastic neighbor embedding (26) (t-SNE; Fig. 2B) and density clustering (27) (Fig. S2A), we identified 18 distinct clusters, which we labeled based on the observed cancer type enrichment (Fig. S2B and Data S3). We found strong concordance between this ATAC-seq-based clustering and the published multi-omic iCluster scheme using TCGA messenger RNA-seq, micro RNA-seq, DNA methylation, reverse phase protein array (RPPA), and DNA copy number data (28) (Fig. 2C-D). Comparing this clustering scheme to other TCGA-based clustering schemes, we observed the strongest concordance of our ATAC-seq clustering scheme with mRNA and cancer type (Fig. 2E). This is consistent with the connection of chromatin accessibility to transcriptional output and the observation that ATAC-seq is strongly cell type-specific. Multiple observations can be made from these clusters: (i) some cancer types split into two distinct clusters such as breast cancer (i.e. basal and non-basal) and esophageal cancer (i.e. squamous and adenocarcinoma), (ii) cancer samples derived from the same tissue type often group together [i.e. kidney renal papillary cell carcinoma (KIRP) and KIRC], and (iii) some cancers group together across tissues as observed for squamous cell types (Fig. 3A and S2B).
Fig. 2. Chromatin accessibility profiles reveal distinct molecular subtypes of cancers.

(A) Pearson correlation heatmaps of ATAC-seq distal elements (left), ATAC-seq promoters (middle), and RNA-seq of all genes (right). Clustering orientation is dictated by the ATAC-seq distal element accessibility and all other heatmaps use this same clustering orientation. Color scale values vary between heatmaps. Promoter peaks are defined as occurring between −1000 bp and +100 bp of a transcriptional start site. Distal peaks are all non-promoter peaks. The total number of features used for correlation is indicated above each Pearson correlation heatmap. (B) Unsupervised t-distributed stochastic neighbor embedding (t-SNE) on the top 50 principal components for the 250,000 most variable peaks across all cancer types. Each dot represents the merge of all technical replicates from a given sample. Color represents the cancer type shown above the plot. (C) Cluster residence heatmap showing the percent of each TCGA iCluster that overlaps with each ATAC-seq-based cluster. (D) ATAC-seq t-SNE clusters shown on the PanCanAtlas iCluster TumorMap. Each hexagon represents a cancer patient sample and the positions of the hexagons are computed from the similarity of samples in the iCluster latent space. The color and larger size of the hexagon indicates the ATAC-seq cluster assignment. Samples that were not included in the ATAC-seq analysis are represented by smaller grey-colored hexagons. The text labels indicate the cancer disease type. (E) Variation of information analysis of clustering schemes derived using various data types from TCGA.
Fig. 3. ATAC-seq clusters cancer samples to show cancer- and tissue-specific drivers.
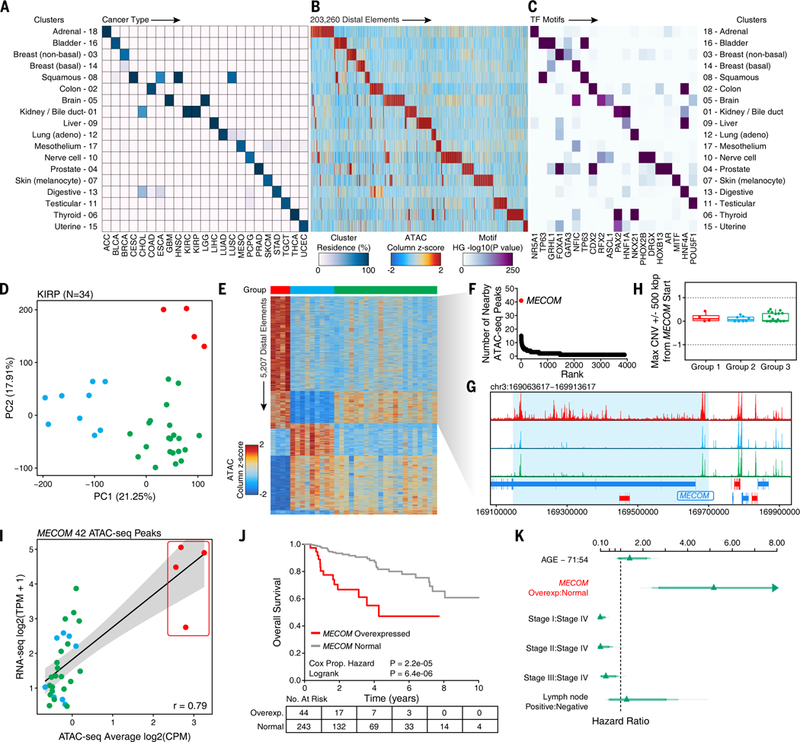
(A) Cluster residence heatmap showing the percent of samples from a given cancer type that reside within each of the 18 annotated ATAC-seq clusters. (B) Heatmap showing the ATAC-seq accessibility at distal elements (N=203,260) identified to be cluster-specific by distal binarization. (C) Enrichment of TF motifs in peak sets identified in Figure 3B. Enrichment is determined by a hypergeometric test –log10(p-value) of the motif’s representation within the cluster-specific peaks compared to the pan-cancer peak set. Transcription factors shown represent a manually trimmed set of factors whose expression is highly correlated (R > 0.4) with the accessibility of the corresponding motif. Color represents the –log10(p-value) of the hypergeometric test. (D) Principal component analysis of the top 25,000 distal ATAC-seq peaks within the KIRP cohort (N=34 samples). Each dot represents an individual sample. The color of the dots represents k-means clustering (k=3 by gap statistic). (E) Distal binarization analysis based on the three k-means-defined groups identified and shown (by color) in Figure 3D. (F) Dot plot showing the number of nearby ATAC-seq peaks per gene from the Group 1 distal binarization. Each dot represents a different gene. The MECOM (aka EVI1) gene is highlighted in red. (G) Normalized average sequencing tracks of k-means-defined Group 1, 2, and 3 at the MECOM locus. Peaks specific to Group 1 are highlighted by a light blue box. (H) DNA copy number data at the MECOM locus in the 3 k-means-defined groups. Each dot represents an individual sample. (I) Average chromatin accessibility at peaks near the MECOM gene (N=42 peaks) and RNA-seq gene expression of MECOM in KIRP samples (N=34 samples). Each dot represents an individual donor. Dots are colored according to the clustering group colors shown in Figure 3D. (J) Kaplan-Meier analysis of overall survival of all KIRP donors in TCGA (N=287) stratified by MECOM overexpressed (N=44) and normal MECOM expression (N=243). (K) Hazard plot of risk of dying from KIRP based on multiple covariates including MECOM expression (HR=5.2, 95% confidence interval = 2.4 – 11.0). Lines represent 95% confidence intervals.
Cluster-specific regulatory landscapes identify patterns of TF usage and DNA hypomethylation across cancer types
Grouping of samples into defined clusters enables the determination of patterns in chromatin accessibility that are unique to each cluster. Using a framework that we term “distal binarization,” we identified the distal regulatory elements that are accessible only in a single cluster or small group of clusters (Fig. 3B, S2C, and Data S4). Of the 516,927 pan-cancer distal elements, 203,260 were found to be uniquely highly accessible in a single cluster or group of clusters (up to 4 clusters). These cluster-specific peak sets are enriched for motifs of transcription factors (TFs) with correlated gene expression that are known to be important for cancer and tissue identity (Fig. 3C, S2D, and Data S4). These include the androgen receptor (AR) in prostate cancer, forkhead box A1 (FOXA1) in non-basal breast cancer, and melanogenesis associated transcription factor (MITF) in melanoma. Moreover, these cluster-specific peak sets are enriched for known GWAS SNPs that are associated with cancers of the corresponding type (Fig. S2E and Data S5), highlighting the fact that cancer-related GWAS SNPs tend to be located within or near cancer type-specific regulatory elements. The concordance of GWAS risk loci and cancer chromatin state has often been evaluated using cancer cell lines in the past, and our work provides a foundational map to evaluate noncoding GWAS SNPs in primary human cancers.
Consistent with published reports (12, 18, 29, 30), the degree of DNA methylation was anti-correlated with chromatin accessibility at regulatory elements and regions lacking chromatin accessibility were more frequently methylated (Fig. S2F). In particular, cluster-specific peak sets are hypomethylated in the relevant cancer types, while frequently methylated in other cancer types that lack accessibility in those peaks (Fig. S2G). Consistent with these observations, which are based on DNA methylation array data, we see a strong depletion of DNA methylation at the center of both distal peaks and promoter peaks in a single patient profiled by whole genome bisulfite sequencing (WGBS) (Fig. S2H) (5). In our analysis of methylation levels within cluster-specific peak sets, we also identified a subgroup of brain cancers that exhibits DNA hypermethylation of peaks specific to non-brain cancers (Fig. S2G), likely due to mutations in genes that affect DNA methylation, such as isocitrate dehydrogenase 1 (IDH1) (Fig. S3A). Similarly, we found that the subset of testicular germ cell tumors that are seminomas show a pattern of genome-wide DNA hypomethylation, consistent with a published report (31) (Fig. S3B). Thus, a small number of TFs dominate the cis-regulatory landscape in each cancer type. These TFs are often the known key drivers of the respective cancer or tissue type, and TF occupancy is associated with, and possibly causes, DNA hypomethylation of the corresponding DNA elements in cancer.
De novo identification of cancer subtypes from ATAC-seq data
Given the richness of the chromatin accessibility landscape, we explored the capacity of ATAC-seq data to define molecular subtypes of cancer de novo. This analysis was limited to cancer types with sufficient available donors: BRCA (N=74), PRAD (N=26), and KIRP (N=34). In KIRP, a gap statistic identified 3 distinct subgroups that are clearly separable by the first two principal components (Fig. 3D). The smallest of these subgroups contains 4 donors with very clear differences in ATAC-seq accessibility identified by distal binarization (Fig. 3E; red). Within the set of regulatory elements that are specific to this subgroup, we found 42 ATAC-seq peaks near the MDS1 and EVI1 complex locus (MECOM) gene (Fig. 3F and 3G). Notably, the high chromatin accessibility of these MECOM peaks is not related to copy number amplification, as determined by DNA copy number array data (Fig. 3H). The expression of the MECOM gene is highly correlated with the mean ATAC-seq accessibility at these 42 ATAC-seq peaks (R=0.79, Fig. 3I). Additionally, overexpression of MECOM is significantly associated with poorer overall survival across all available KIRP data from TCGA (p=2.2×10⁻⁵, Cox Proportional Hazard test, Fig. 3J) with a hazard ratio of 5.2 (95% confidence interval = 2.4–11.0). This association is more substantial than lymph node status or patient age and is independent of cancer stage (Fig. 3K), indicating a potential prognostic role for these findings. Importantly, MECOM overexpression is not readily explained by any previously identified subgroups of KIRP, including a subgroup with a CpG island methylator phenotype and mutations in the gene encoding fumarate hydratase, which have also been shown to confer poor overall survival (13). These results suggested that MECOM activation in KIRP identifies a previously unappreciated subgroup of patients with adverse outcomes, a finding that was uncovered by striking changes in the chromatin accessibility landscape of these samples.
Similarly, we found multiple distinct subgroups of PRAD and BRCA based on k-means clustering of the top 25,000 variable distal ATAC-seq peaks (Fig. S3C and S3D). In PRAD, these include subgroups driven by activity of the androgen receptor, tumor protein P63 (TP63), and forkhead box-family TFs (Fig. S3C). From an unsupervised analysis of breast cancer, we identified motifs of known TF drivers of luminal subtype identity, such as GATA binding protein 3 (GATA3) and FOXA1, as being enriched in the peak clusters specific to a subset of luminal samples (Clusters 3 and 4, Fig. S3D). We also identified a potential role for grainyhead-like (GRHL) TFs motifs in basal breast cancer (32) (Cluster 1, Fig. S3D) and an overlapping role for NFI in both basal and luminal A breast cancer (Cluster 2, Fig. S3D). Additionally, we note that ATAC-seq data can be used to identify regions of copy number amplification de novo (33), enabling the classification of HER2-amplified cases of breast cancer (Fig. S3E - S3G).
Footprinting analysis defines TF activities in cancer
The high sequencing depth of the ATAC-seq data generated in this study (median of 56.7 million unique reads per technical replicate) enabled the profiling of TF occupancy at base-pair resolution through TF footprinting. TF binding to DNA protects the protein-DNA binding site from transposition while the displacement or depletion of one or more nucleosomes creates high DNA accessibility in the immediate flanking sequence. Collectively, these phenomena are referred to as the TF footprint. To characterize TF footprints, we adapted a recent approach (34) that quantifies the “flanking accessibility,” a measure of the accessibility of the DNA adjacent to a TF motif, and “footprint depth,” a measure of the relative protection of the motif site from transposition (Fig. 4A and Data S6). To calculate these variables, we aggregated all insertions relative to the TF motif center, genome-wide (Fig. S4A). To account for known Tn5 transposase insertion bias, we computed the hexamer frequency centered at Tn5 insertions and normalized for the expected bias at each position relative to the motif center (34). Depending on the binding properties of a TF and its ability to affect local chromatin accessibility, changes in these properties would be detectable through this approach genome-wide (Fig. S4B - C). ChromVAR (35), a similar genome-wide approach which assesses the ability of a TF to affect flanking accessibility, identified a highly overlapping list of TFs (Fig. S4D).
Fig. 4. Footprinting analysis identifies distinct classes of transcription factor activities in cancer.

(A) Schematic illustrating the dynamics of transcription factor binding and Tn5 insertion. (B) Classification of TFs by the correlation of their RNA expression to the footprint depth and flanking accessibility of their motifs. Color represents whether the depth (red), flank (blue), or both (purple) are significantly correlated to TF expression below an FDR cutoff of 0.1. Each dot represents an individual deduplicated TF motif (see methods). (C) Transcription factor footprinting of the TP63 motif (CIS-BP M2321_1.02) in lung cancer samples from the squamous (cluster 8) or adenocarcinoma (cluster 12) subtype. The Tn5 insertion bias track of TP63 motifs is shown below. (D) Dot plots showing the footprint depth and flanking accessibility of TP63 motifs across all lung cancer samples studied. Each dot represents a unique sample. Color represents cancer type (top), RNA-seq gene expression (middle), or methylation beta value (bottom). Samples without matching RNA or methylation data are shown in grey. (E) Transcription factor footprinting of the NKX2–1 motif (CIS-BP M6374_1.02) in lung squamous (cluster 8) and lung adenocarcinoma (cluster 12) cell carcinoma samples. The Tn5 insertion bias of the NKX2–1 motif is shown below. (F) Dot plots showing the footprint depth and flanking accessibility of NKX2–1 motifs across all lung cancer samples studied. Each dot represents a unique sample. Color represents cancer type (top), RNA-seq gene expression (middle), or methylation beta value (bottom). Samples without matching RNA or methylation data are shown in grey.
To uncover transcriptionally driven TF binding patterns, we correlated the RNA-seq gene expression of a given TF to its corresponding footprint depth and flanking accessibility (Data S6). A factor whose expression is sufficient to generate robust DNA binding would have a footprint depth and flanking accessibility that are significantly correlated to its gene expression (FDR < 0.1, purple dots, Fig. 4B), such as TP63 (Fig. 4C and 4D) or NK2 homeobox 1 (NKX2–1) (Fig. 4E and 4F). Increases in flanking accessibility and decreases in footprint depth are likewise accompanied by decreases in methylation (Fig. 4D and 4F, bottom), consistent with the hypothesis that methylated DNA is less likely to be bound by TFs (36). While footprint depth and flanking accessibility are often correlated, their divergence can provide further insights into the modes of TF-DNA interaction. For example, factors whose expression is sufficient to cause opening of chromatin around the motif site but not to protect the motif site from transposition would be expected to only exhibit a correlation between gene expression and flanking accessibility (blue dots, Fig. 4B). This pattern of correlation could be caused by rapid TF off rates or low occupancy and is exemplified by FOXA1 (Fig. S4E and S4F). Conversely, a small number of TFs have expression that is only significantly correlated with footprint depth (red dots, Fig. 4B). Though likewise rare, we also identified potential negative regulators whose expression is inversely correlated to gain of flanking accessibility and loss of footprint depth, such as the cut-like homeobox 1 (CUX1) TF (37) (Fig. 4B, S4G, and S4H). This is the expected behavior of repressive TFs that bind DNA and lead to compaction of the neighboring sequence. These results predicted dozens of positive and negative regulators whose expression is strongly correlated with chromatin accessibility of their corresponding motif (Fig. S4I and Data S6). Overall, our footprinting analysis identified putative classes of TFs with different patterns of binding and activity at high resolution.
Linking of DNA regulatory elements to genes predicts interactions relevant to cancer biology
The breadth and depth of this sequencing study enabled a robust association of ATAC-seq peaks with the genes that they are predicted to regulate. To do this, we implemented a strategy based on the correlation of ATAC-seq accessibility and gene expression across all samples (Fig. 5A, N=373 with matched RNA-seq and ATAC-seq). Because promoter capture Hi-C data suggested that >75% of three-dimensional (3D) promoter-based interactions occur within a 500-kbp distance (38), we restricted the length scale of this analysis to 500 kbp to avoid spurious predictions. Using a conservative false discovery rate (FDR) cutoff of 0.01, we identified 81,323 unique links between distal ATAC-seq peaks and genes (Fig. 5B and Data S7). Some of these links are driven by correlation across many cancer types (Fig. 5C and 5D) while 70% are strongly driven by one cluster (Fig. 5E, 5F, and Data S7). To derive a final list of peak-to-gene links (Fig. 5B), putative links were filtered against (i) links whose correlation is strongly driven by DNA copy number amplification (“CNA”; Fig. S5A and S5B), (ii) regions with broad and high local correlation (“diffuse”, Fig. S5B and S5C), and (iii) links involving an ATAC-seq peak that overlaps the promoter of any gene (Fig. 5G). As expected, the histogram of distances between a peak and its target gene decays sharply with distance (39) (Fig. 5H). The expression of most genes is correlated with the activity of fewer than 5 different peaks (Fig. 5I), whereas most peaks are predicted to interact with a single gene (Fig. 5J). Additionally, this analysis found that only 24% of predicted links occur between an ATAC-seq peak and the nearest gene, indicating that the majority of predicted interactions skip over one or more genes and would not be possible to predict from primary sequence alone (Fig. 5K). In total, we predicted at least one peak-to-gene link for 8,552 protein-coding genes, accounting for nearly half of all protein coding genes in the human genome, including 48% of the curated COSMIC cancer-relevant genes (Data S7).
Fig. 5. In silico linking of ATAC-seq peaks to genes.

(A) Schematic of the in silico approach used to link ATAC-seq peaks in distal noncoding DNA elements to genes via correlation of chromatin accessibility and RNA expression. (B) Heatmap representation of the 81,323 unique peak-to-gene links predicted. Each row represents an individual link between one ATAC-seq peak and one gene. Color represents the relative ATAC-seq accessibility (left) or RNA-seq gene expression (right) for each link as a z-score. (C) Dot plot of the ATAC-seq accessibility and RNA-seq gene expression of a peak-to-gene link located 164 kbp away from the transcription start site of the BCL2 gene (peak 498895) that is predicted to regulate its expression. Color represents the cancer type. Each dot represents an individual sample. (D) Same as in Figure 5C but for a peak that is located 49 kbp away from the SRC gene (peak 525295). (E) Same as in Figure 5C but for a peak that is located 93 kbp away from the PPARG gene (peak 98874). (F) Same as in Figure 5C but for a peak that is located 58 kbp away from the ERBB3 gene (peak 381116). (G) Bar plot showing the number of predicted links that were filtered for various reasons. First, regions whose correlation is driven by DNA copy number amplification were excluded (“CNA”). Next, regions of high local correlation were filtered out (“Diffuse”). Lastly, peak-to-gene links where the peak overlapped a promoter region were excluded (“Promoter”). (H) Distribution of the distance of each peak to the transcription start site of the linked gene. (I) Distribution of the number of peaks linked per gene. (J) Distribution of the number of genes linked per peak. (K) Distribution of the number of genes “skipped” by a peak in order to reach its predicted linked gene.
In addition to predicting peak-to-gene links across cancer types, we also predicted peak-to-gene links within breast cancer (N=74 donors), identifying 9,711 unique peak-to-gene links (Fig. S5D and Data S7). Of these links, 36% were also identified in our analysis of all cancer types (Fig. S5E). Particularly important in these BRCA-specific links was the contribution of recurrent DNA CNA as a strong driver for spurious peak-to-gene correlation (Fig. 5G). These false-positive associations were removed through the use of published TCGA DNA copy number array data and a local correlation correction model, as mentioned above (see methods). The final predicted BRCA-specific links follow a similar distance distribution and peak-to-gene linking specificity as observed in the pan-cancer predicted links (Fig. S5F - I).
Many of these predicted peak-to-gene links occur in clusters where multiple nearby peaks are predicted to be linked to the same gene, indicating that these clusters of peak-to-gene links may function as part of a single regulatory unit or enhancer. Extending the width of the linked ATAC-seq peaks to 1,500 bp allows for joining of these peaks into defined merged putative enhancer units (Fig. S5J). This resulted in a total of 58,092 pan-cancer and 7,622 BRCA-specific enhancer-to-gene links (Data S7).
Validation and utility of predicted links between distal elements and genes
To verify a regulatory interaction for the predicted peak-to-gene links, we employed a CRISPR interference (CRISPRi) (40) strategy using a catalytically dead Cas9 (dCas9) fused to a Kruppel-associated box (KRAB) domain, which mediates focal heterochromatin formation and functional silencing of noncoding DNA regulatory elements (Fig. 6A). In this way, targeting the distal peak region of a predicted peak-to-gene link would be expected to cause a decrease in the expression of the linked gene, located tens to hundreds of kilobases away. CRISPRi of a predicted distal regulatory element linked to BCL2 (166 kbp, Fig. 5C) led to a significant reduction in BCL2 gene expression in the luminal-like breast cancer MCF7 cell line but not in the basal-like MDA-MB-231 cell line (Fig. 6B), consistent with the role of BCL2 as a luminal-specific survival factor (41). Similarly, CRISPRi of a distal regulatory element linked to the SRC oncogene (−48 kbp, Fig. 5D) led to a significant reduction in gene expression in both MCF7 cells and MDA-MB-231 cells (Fig. 6B). On a genome-wide scale, the predicted BRCA-specific peak-to-gene links show a strong enrichment in 3D chromosome conformation data from MDA-MB-231 cells (42), providing further support for our link prediction strategy (Fig. 6C). Moreover, we found that, of the peak-to-gene links predicted from BRCA ATAC-seq data that are also associated with a DNA methylation array CpG probe, 35% overlap with links predicted jointly from DNA methylation array and RNA-seq data in an ELMER analysis (8, 43) of the complete TCGA BRCA dataset (N=858 tumors) (p << 0.001, Fig. 6D, S6A, and Data S8). These overlaps contain significant numbers of both luminal-specific and basal-specific links (Fig. S6A), with a clear delineation between luminal (Fig. S6B) and basal (Fig. S6C) breast cancer samples. Integrating WGBS and ATAC-seq demonstrated the dynamics of methylation and chromatin accessibility and the overlap of predicted interactions at the non-basal FOXA1 and basal forkhead box C1 (FOXC1) loci (Fig. S6D and S6E).
Fig. 6. Validation of long-range gene regulation of cancer in peak-to-gene links.

(A) Schematic of CRISPRi experiments performed. Each experiment uses 3 guide RNAs to target an individual peak. The effect of this perturbation on the expression of the linked gene is determined using qPCR. (B) Gene expression changes by qPCR after CRISPRi of peaks predicted to be linked to the BCL2 (peak 498895) and SRC (peak 525295) genes in MCF7 and MDA-MB-231 cells. Error bars represent the standard deviation of 4 technical replicates. *** p < 0.001 by two-tailed t-test. (C) Meta-virtual 4C plot of predicted BRCA-specific peak-to-gene links with distances greater than 100 kbp. HiChIP interaction frequency is shown for the MDA-MB-231 basal breast cancer cell line as well as multiple populations of primary T cells. (D) Bar plot showing the overlap of predicted ATAC-seq-based peak-to-gene links and DNA methylation-based ELMER predicted probe-to-gene links in BRCA, as a percentage of all ATAC-seq-based peak-to-gene links with a peak overlapping a methylation probe. The percentage of peak-to-gene links overlapping an ELMER probe-to-gene link (34.9%) is compared to the overlap with 1,000 sets of randomized ELMER probe-to-gene links (3.6 +/− 0.6%, p << 0.001). (E) Virtual 4C plot of the peak-to-gene link between rs4322801 and the OSR1 gene. Normalized HiChIP interaction signal is shown for the MDA-MB-231 basal breast cancer cell line as well as multiple populations of primary T cells using the colors shown in Figure 6C. ATAC-seq sequencing tracks are shown below for 4 BRCA samples and MDA-MB-231 cells with increasing levels of OSR1 gene expression. The rs4322801 SNP (left) and OSR1 gene (right) are highlighted by light blue boxes. Region shown represents chr2:18999999−19425000. (F) Diagram of the hematopoietic differentiation hierarchy with differentiated cells colored as either B cells (green), T/NK cells (blue), or myeloid cells (red). (G) Schematic of the analysis shown in Figure 6H. Peak-to-gene links are classified as related to immune infiltration if their accessibility is higher in immune cells than TCGA cancer samples and they are highly correlated to cytolytic activity. (H) Dot plot showing ATAC-seq peak-to-gene links with relevance to immune infiltration. Each dot represents an individual peak with a known gene link. Peaks that are related to immune cells have higher ATAC-seq accessibility in immune cell types compared to TCGA cancer samples. Peaks related to immune infiltration have a higher correlation to cytolytic activity. Color represents the cell type of the observation. The vertical dotted line represents the mean + 2.5 standard deviations above the mean for all ATAC-seq peak correlations to the cytolytic activity. Red box indicates peak-to-gene links that are predicted to be related to immune infiltration. Blue box indicates peak-to-gene links that are not predicted to be related to immune infiltration. (I) Violin plots of the distribution of Spearman correlations across all peak-to-gene links predicted to be related to immune infiltration (red) or not (blue) with various metrics of tumor purity. (J) Normalized ATAC-seq sequencing tracks of the PDL1 gene locus in 6 samples with variable levels of expression of the PDL1 gene (right). Predicted links (red) are shown below for 4 peak-to-gene links (L1–4, peaks 293734, 293735, 293736, and 293740 respectively) to the promoter of PDL1. One of these peak-to-gene links (L2) overlaps an alternative start site for PDL1 and was therefore labeled as a “promoter” peak during filtration. This peak-to-gene link was added to this analysis after manual observation. Region shown represents chr9:5400502−5500502. (K) Heatmap representation of the ATAC-seq chromatin accessibility of the 5000-bp region centered at each of the 4 peak-to-gene links shown in Figure 6J. Each row represents a unique donor (N=373) ranked by PDL1 expression. The correlation of the chromatin accessibility of each peak with the expression of PDL1 is shown below the plot. Color represents normalized accessibility. (L) Gene expression changes by qPCR after CRISPRi of peaks predicted to be linked to the PDL1 gene in MCF7 and MDA-MB-231 cells. Error bars represent the standard deviation of 4 technical replicates. *** p < 0.0001, * p < 0.05 by two-tailed t-test.
Similarly, previous work has leveraged TCGA RNA-seq data to infer transcriptional networks that consist of regulons, each of which is based on a TF regulator and its associated positive and negative target genes (Fig. S7A) (44). For each regulon, every donor in the cohort can be assigned a positive, undefined, or negative regulon activity (dES) (45). Certain patterns of chromatin accessibility are expected based on the target gene set and dES status of the donor (Fig. S7B). For example, in donors with positive dES, chromatin at sites linked to positive target genes should be more accessible, while chromatin at sites linked to negative targets should be less accessible (Fig. S7B). Examination of the estrogen receptor 1 (ESR1) regulon in the 74 BRCA donors profiled in this study identified 482 ATAC-seq distal peak-to-gene links corresponding to 124 ESR1 target genes (Fig. S7C and Data S8). Accessibility at these peaks is strongly concordant with expectations, further supporting the predicted links (p < 1×10⁻²⁰, Fig. S7D). Examination of this regulon across all TCGA BRCA donors (N=1082) showed a significant difference in overall survival between ESR1 dES-positive and -negative samples (Fig. S7E and S7F).
Together, pan-cancer and BRCA-specific peak-to-gene links further informed cancer-related GWAS polymorphisms, allowing the linkage of SNPs to putative gene targets with approximately 65% of all GWAS polymorphisms targeting a gene other than the closest gene on the linear genome (Data S5). SNPs falling within peak-to-gene links were predicted to act on important cancer-related genes including master regulators of cancer and tissue identity such as NKX2–1 (Fig. S7G) and TP63 (Fig. S7H). Focusing specifically on the BRCA peak-to-gene links where published 3D chromosome conformation data is available, we found clear examples of GWAS SNPs interacting with distant, non-neighboring genes, such as OSR1 (Fig. 6E and S7I). Moreover, overlapping of the pan-cancer and breast cancer-specific peak-to-gene links with expression quantitative trait loci (eQTLs, where genetic variation at noncoding elements is associated with gene expression differences) from the Genotype-Tissue Expression (GTEx) project showed significant overlap in almost all comparisons (N=44 of 48) (Fig. S7J and Data S5). These results underscored the utility of these predicted peak-to-gene links to generate key insights into published data and inform previously poorly understood aspects of cancer biology.
Identification of DNA regulatory elements related to immunological response to cancer
Of particular interest to current cancer therapy, immune infiltrates represent a substantial contribution to the overall tumor composition in solid tumors (46–48). We reasoned that infiltrating immune cells could contribute to our ATAC-seq data, both through actions on tumor cells and through increased chromatin accessibility at known immune-specific regulatory elements. Leveraging published ATAC-seq datasets from the human hematopoietic system (25) and data generated here from human dendritic cell subsets (Fig. 6F), we characterized each of our linked peaks by comparing its accessibility in immune cell types to its accessibility in bulk cancer samples (Fig. 6G). We reasoned that peaks that are more accessible in immune cells compared to our cancer cohort might be generated from immune cells associated with the tumor tissue (Fig. 6G). Additionally, we correlated each linked peak to the cytolytic activity score (49) of the tumor. The cytolytic activity score is based on the log-average gene expression of granzyme A and perforin 1, two CD8 T cell-specific markers. Linked peaks that exhibit high correlation to cytolytic activity might also be considered to be related to immune infiltration. Combining these two metrics, we identified peak-to-gene links expected to be highly relevant to immune infiltration, including links to genes relevant to antigen presentation and T cell response (Fig. 6H and Data S9). The accessibility of these peak-to-gene links that were predicted to be immune-related is highly correlated with computationally predicted metrics of immune infiltration (46, 47) and inversely correlated with tumor purity (48) (Fig. 6I). One notable linked gene is programmed death ligand 1 (PDL1, also known as CD274), a key mediator of immune evasion by cancer and an important target for cancer immunotherapy. PDL1 is linked to 4 putative distal regulatory elements that exhibit distinct chromatin accessibility across cancer types and are located as far as 43 kbp away from the PDL1 transcription start site (Fig. 6J and 6K). CRISPRi of each of these 4 putative PDL1 regulatory elements significantly decreased but did not abrogate the expression of PDL1 mRNA in at least one of the two breast cancer cell lines tested (MCF7 and MDA-MB-231 cells, Fig. 6L). These results supported a model where the expression of PDL1 is affected by the combined activity of multiple distal regulatory elements.
Identification of cancer-relevant noncoding mutations
In addition to identifying gene regulatory interactions in cancer, ATAC-seq combined with whole genome sequencing (WGS) can be used to identify regulatory mutations driving cancer initiation and progression. For example, if a noncoding somatic mutation causes the generation of a TF binding site, this mutation could lead to an increase in chromatin accessibility in cis and a concomitant increase in the observed frequency of the mutant allele in ATAC-seq as compared to WGS (Fig. 7A). Similarly, a mutation that inactivates a TF binding site can lead to a decrease in chromatin accessibility and a concomitant decrease in the observed frequency of the mutant allele. If such mutations in regulatory elements were to be functional in cancer, we might also expect that they increase or decrease chromatin accessibility beyond the expected distribution observed in non-mutated samples.
Fig. 7. Integration of WGS and ATAC-seq identifies cancer-relevant regulatory mutations.

(A) Schematic of how functional variants are identified in regulatory elements. Example shown depicts the TERT promoter. (B) Dot plot of the difference in variant allele frequency of ATAC-seq and WGS and the changes in chromatin accessibility caused by the given variant with respect to other samples of the same cancer type. Variants with a higher variant allele frequency in ATAC-seq than WGS would be expected to cause an increase in accessibility. Each dot represents an individual somatic mutation. (C) Normalized ATAC-seq and RNA-seq of thyroid cancer samples profiled in this study. Each dot represents an individual donor. Blue dot represents the sample with a TERT promoter mutation shown in Figure 7B. Other thyroid cancer samples known to harbor a TERT promoter mutation were excluded from this plot. The hinges of the box represent the 25th to 75th percentile. (D) Normalized ATAC-seq and RNA-seq of bladder cancer samples profiled in this study. Each dot represents an individual donor. Purple dot represents the sample with a mutation upstream of the FGD4 gene shown in Figure 7B. The hinges of the box represent the 25th to 75th percentile. (E) Comparison of wildtype and mutant reads in WGS and ATAC-seq data at the TERT promoter and FGD4 upstream region. (F) Normalized ATAC-seq sequencing tracks of the FGD4 locus in the 10 bladder cancer samples profiled in this study, including the one sample with a mutation predicted to generate a de novo NKX motif (TCGA-BL-A13J). Locus shown represents chr12:32335774−32435774. The mutation position is indicated by a black dotted line. The predicted enhancer region surrounding this mutation is highlighted by a blue box. (G) Difference in motif score in the wildtype and mutant FGD4 upstream region. Motif score represents the degree of similarity between the sequence of interest and the relevant motif. Each dot represents an individual motif. (H) Overlay of the NXK2–8 motif (CIS-BP M6377_1.02) and the wildtype and mutant sequences of the FGD4 upstream region. (I) Kaplan-Meier survival analysis of TCGA bladder cancer patients with high (top 33%) and low (bottom 33%) expression for the FGD4 gene.
From the 404 unique donors profiled in this study, high-depth WGS data was available for 35 donors across 10 cancer types. These 35 donors had 374,705 called somatic mutations with 32,696 falling within annotated ATAC-seq peaks, and 2,259 having at least 30 reads in both ATAC-seq and WGS data (Data S10). Among these mutations were three separate occurrences of telomerase reverse transcriptase (TERT) gene promoter mutations (Fig. 7B), previously shown to generate de novo E26 Transformation-specific (ETS) motif sites. ATAC-seq is especially well-suited to identifying these TERT promoter mutations as the variant allele frequency is skewed due to the increase in accessibility on the mutant allele (Fig. S8A). Compared to the publicly available exome sequencing data from TCGA, where the TERT capture probes do not extend into the promoter region, ATAC-seq provided significantly higher sequencing coverage of the TERT promoter locus per read sequenced, enabling a more robust classification of TERT promoter mutations (p < 1×10⁻⁷, Fig. S8B). Of the 3 TERT promoter mutations identified in the subset of donors with matched WGS, one mutation, in particular, leads to a significant increase in accessibility compared to the other non-mutated members of that cancer type (FDR < 0.0001, Fig. 7B and 7C, blue dot). As expected, this increase in TERT promoter accessibility is associated with a concomitant increase in TERT gene expression (Fig. 7C, blue dot). TERT promoter mutations, however, are not the only way to increase TERT gene expression, as high TERT expression can also be observed in samples without identifiable TERT promoter mutations (Fig. 7C). Consistent with a previous report (50), differential motif analysis at the site of this TERT promoter mutation identified E74-like ETS Transcription Factor 1 (ELF1) or ELF2 as the TF that likely binds to the de novo ETS motif (Fig. S8C). In addition, we identified several mutations overlapping CCCTC-binding factor (CTCF) motif occurrences that are associated with decreased accessibility at that site (Fig. S8D and S8E). However, these mutations were relatively rare and often had only small effects on the accessibility of the CTCF motif site despite a known enrichment of somatic mutations in CTCF motif sites in cancer (51, 52).
In addition to known TERT promoter mutations, integrative analysis of WGS and ATAC-seq data uncovered a mutation upstream of the FYVE RhoGEF and PH domain-containing 4 (FGD4) gene, a regulator of the actin cytoskeleton and cell shape. This mutation occurs in a bladder cancer sample where the variant allele frequency observed in ATAC-seq is markedly enriched over the variant allele frequency observed in WGS (Fig. 7B). This mutation is associated with a significant increase in accessibility compared to other bladder cancer samples in this cohort (Fig. 7B and 7D) and is accompanied by a similar increase in FGD4 mRNA (Fig. 7D). Moreover, this mutation upstream of the FGD4 gene (referred to as eFGD4 for “enhancer FGD4”) leads to a level of accessibility that is higher than any of the 410 other samples profiled in this study (Fig. S8F), and a level of FGD4 gene expression that is in the top 3 percent of all bladder cancer samples in TCGA (Fig. S8G). As estimated by WGS data, this eFGD4 mutation is present in a subclone comprising approximately 13% of the tumor (Fig. 7E); however, the mutant allele is present in 96% of all ATAC-seq reads spanning this locus (Fig. 7E), demonstrating a strong preference for accessibility on the mutant allele. This eFGD4 mutation is analogous to but potentially more potent than the TERT promoter mutation described above (Fig. 7E). In the case of the eFGD4 mutation, this dramatic allele bias occurs because chromatin at this locus is not normally accessible in any of the bladder cancer samples profiled in this study (Fig. 7D and 7F, gray dots/tracks) but becomes highly accessible in the context of the eFGD4 mutation (Fig. 7D and 7F, purple dot/track). Differential motif analysis identified NKX factor motifs as the most strongly enriched in the sequence corresponding to the eFGD4 mutation (Fig. 7G), where a C to T transition at position 2 generated a perfect NKX2–8 motif de novo from a latent site (Fig. 7H). RNA-seq data from the mutated sample identified multiple expressed NKX TFs (TPM > 0.5), nominating NKX3–1, NKX2–3, and NKX2–5 as potential mediators of this DNA binding event (Fig. S8H). From this, we hypothesized that the eFGD4 mutation creates a de novo binding site for an NKX TF which, upon binding to the DNA, leads to a broad increase in accessibility across the entire 12-kbp region upstream of the FGD4 gene. This hypothesis was further supported by the observation that the ATAC-seq accessibility of the entire FGD4 upstream locus occurs on a single phased allele (Fig. S8I). Moreover, separation of sub-nucleosomal and nucleosome-spanning reads in the ATAC-seq data is consistent with protein binding at the site of the eFGD4 mutation (Fig. S8I, light blue box). Lastly, because higher FGD4 expression is significantly associated with worse overall survival in bladder cancer (Fig. 7I and S8J), this mutation could have functional consequence in this particular cancer. Whether the eFGD4 mutation or other enhancer mutations emerge as recurrent drivers of human cancer should be addressed in future studies. Our data identified multiple additional noncoding mutations associated with a concomitant gain of chromatin accessibility and increase in RNA expression (Fig. S8K - Q), and we anticipate that future work will uncover mechanisms underlying this type of regulatory mutation across all cancer types.
Discussion:
Here, we provided an initial characterization of the chromatin regulatory landscape in primary human cancers. This dataset identified hundreds of thousands of accessible DNA elements, expanding the dictionary of regulatory elements discovered through previous large-scale efforts such as The Roadmap Epigenomics Project. The identification of these additional elements was made possible through (i) our analysis of primary cancer specimens, (ii) greater saturation of some cancer/tissue types in our dataset, or (iii) potential differences between ATAC-seq and DNase-seq platforms. Nevertheless, the high overlap between the two datasets demonstrates the robustness of both platforms and the consistency of the observed results.
The exquisite cell type-specificity of distal regulatory elements from our ATAC-seq data enabled the classification of cancer types and the discovery of previously unappreciated cancer subtypes. De novo clustering of TCGA samples based on chromatin accessibility strongly overlaps previous integrative clustering methods, identifying 18 distinct cancer clusters. Comparing this clustering scheme to other clustering schemes defined by cancer type, mRNA, miRNA, DNA methylation, RPPA, and DNA copy number alterations, we observed the strongest concordance of our clustering scheme with mRNA and cancer type, consistent with a close functional linkage between chromatin accessibility and transcriptional output. We note that the strength of the observed associations is influenced by the features represented for each platform. For example, the DNA methylation clusters are based on cancer-specific promoter hypermethylation (28). Clustering based on DNA methylation at distal regulatory elements would likely show a stronger correlation with the ATAC-seq groupings, but distal regulatory element representation on the DNA methylation array used for these samples was too sparse to allow such an analysis. We also identified epigenetically distinct subtypes of kidney renal papillary cancer that have clear differences in overall survival. This cancer type-specific activity in DNA regulatory elements may arise via mutations within the regulatory element, pathologic transcription factor activity, or reflect the regulatory state of the tumor’s cell of origin (e.g. stem cells). As the chromatin accessibility landscapes of additional primary cancer samples are profiled, we anticipate the identification of further epigenetic subdivisions with prognostic implications, potentially nominating avenues for therapeutic intervention.
We note that the data generated in this study fully represents the cellular complexity of primary human tumors, comprising signals from tumor cells, infiltrating immune cells, stromal cells, and other normal cell types. In many ways, this complexity is advantageous as it allows complex systems-level analyses to be performed in the future, including cellular deconvolution approaches to understand the contributions of various cell types or cell states to the overall landscape of chromatin accessibility. However, the admixed nature of this signal also highlights the need for future work to profile the chromatin accessibility of matched healthy tissues to further refine the specific changes that drive cancer. Nevertheless, the chromatin accessibility profiles generated in this study represent the largest effort to date to characterize the regulatory landscape in primary human cancer cells.
Using this data-rich resource, we identified classes of TFs whose expression leads to different patterns in TF occupancy and motif protection. By integrating RNA-seq and ATAC-seq, we found factors whose expression is sufficient for both motif protection and nucleosome repositioning and demonstrated this binding to be inversely correlated with the level of DNA methylation at those binding sites. Despite this strong correlation, many sites of differential chromatin accessibility do not show differential methylation, demonstrating the complementarity of these two data types, perhaps due to the presence of intermediate chromatin states such as poised promoters or enhancers (53, 54).
Moreover, integration of RNA-seq and ATAC-seq across the 373 donors with paired data sets enabled a quantitative model to link the accessibility of a regulatory element to the expression of predicted target genes. This workflow identified putative links for more than half of the protein-coding genes in the genome, informing the target genes of poorly understood GWAS SNPs and increasing our understanding of cancer gene regulatory networks. These predictions were further supported using 3D chromosome conformation data and a subset were validated through CRISPRi experiments in breast cancer cell lines. However, profiling of chromosome conformation in primary cancer samples has not been performed on a large scale. Future work to produce maps of chromosome conformation in these or other primary cancer samples will improve our understanding of gene regulatory networks in cancer and further clarify the roles for certain GWAS-identified SNPs in cancer initiation and progression.
Lastly, through integration of whole genome sequencing and ATAC-seq, we revealed a class of somatic mutations that occur in regulatory regions and lead to strong gains in chromatin accessibility. We demonstrated that these mutations likely lead to changes in nearby gene expression and affect genes whose expression is linked to poorer overall survival. Some of these mutations, such as those occurring in the TERT promoter, have been found to be recurrent while others, such as the mutation upstream of the FGD4 gene, may be rare but functionally important. Because the enhancer functions are often distributed and latent enhancer sequences are pervasive in the genome, noncoding mutations in cancer may be especially challenging and require high throughput functional assessment. Future larger-scale efforts to combine genome and epigenome sequencing will pave the way to tackle the noncoding genome in cancer.
Methods and Materials Summary
ATAC-seq data was generated from 410 tissue samples from the TCGA collection of primary human tumors. These samples spanned 23 different tumor types. These ATAC-seq data were used to cluster samples, identifying epigenetically-defined patient subgroups. Moreover, TF regulators of cancer were defined and footprinting of these regulators was correlated to gene expression to identify putative classes of TFs. A correlation-based model was developed to link ATAC-seq peaks to putative target genes. These putative links were validated using CRISPRi-based perturbation of the peak region followed by quantification of changes in gene expression. Publicly available HiChIP data and GTEx eQTL data were further used to support genome-wide peak-to-gene linkage predictions. Lastly, WGS and ATAC-seq were combined to identify non-coding mutations that affect chromatin accessibility in an allele-specific manner.
Supplementary Material
Acknowledgments:
We thank Xuhuai Ji and John Coller for assistance in sequencing, Paul Giresi and Epinomics for sharing advice and expertise related to ATAC-seq data analysis, and the members of the Greenleaf and Chang laboratories for thoughtful advice and critique.
Funding: Supported by the National Cancer Institute, NIH grants R35-CA209919 (to H.Y.C.), P50-HG007735 (to H.Y.C., W.J.G.), and the Parker Institute for Cancer Immunotherapy (H.Y.C.). M.R.C. is supported by NIH K99-AG059918. Additional support through the NIH Genomic Data Analysis Networks 1U24CA210974–01 (Jingchun Zhu), 1U24CA210949–01 (John N. Weinstein), 1U24CA210978–01 (Rameen Beroukhim), 1U24CA210952–01 (Steven J. Jones), 1U24CA210989–01 (Olivier Elemento), 1U24CA210990–01 (Joshua Stuart), 1U24CA210950–01 (Rehan Akbani), 1U24CA210969–01 (Peter W. Laird), and 1U24CA210988–01 (Katherine Hoadley). W.J.G. is a Chan-Zuckerberg Biohub Investigator. H.Y.C. is an Investigator of the Howard Hughes Medical Institute.
Footnotes
Competing interests: H.Y.C. is a co-founder of Accent Therapeutics, Epinomics, and is an advisor of 10X Genomics and Spring Discovery. W.J.G is a co-founder of Epinomics, and an advisor to 10X Genomics, Guardant Health, Centrillion, and NuGen. C.C. is an advisor to GRAIL. Stanford University holds a patent on ATAC-seq, on which H.Y.C. and W.J.G. are named as inventors.
Data and materials availability: Processed data not provided in the supplementary data files is available through our TCGA Publication Page (https://gdc.cancer.gov/about-data/publications/ATACseq-AWG). This includes pan-cancer raw and normalized counts matrices, cancer type-specific peak calls, cancer type-specific raw and normalized count matrices, and bigWig track files for all technical replicates. Raw ATAC-seq data as fastq or aligned BAM files will be made available through the NIH Genomic Data Commons portal (https://portal.gdc.cancer.gov/). ATAC-seq data corresponding to human plasmacytoid dendritic cells and myeloid dendritic cells (the only non-TCGA data generated here) is available through SRA BioProject PRJNA491478. The ATAC-seq peak accessibility and computed peak-to-gene linkage predictions are publicly available for interactive visualization and exploration at the UCSC Xena Browser (https://atacseq.xenahubs.net). Sample-level ATAC-seq data across all 404 donors assayed can be visualized side-by-side with all other data from TCGA, including gene expression, DNA methylation from both Illumina 450K array and whole genome bisulfite sequencing (WGBS) platforms, ELMER enhancer analysis results, as well as the latest survival data and mutation calls from the Genomic Data Commons. ATAC-seq data can be queried by gene, genomic position, or individual peaks. The UCSC Xena Browser makes this rich resource available for interactive online analysis and visualization by the larger scientific community. Samples from the TCGA project can only be used for TCGA efforts due to restrictions in the Material Transfer Agreement used for acquisition. No external groups can access the tissue or analytes.
References and Notes:
- 1.Hutter C, Zenklusen JC, The Cancer Genome Atlas: Creating Lasting Value beyond Its Data. Cell. 173, 283–285 (2018). [DOI] [PubMed] [Google Scholar]
- 2.Flavahan WA, Gaskell E, Bernstein BE, Epigenetic plasticity and the hallmarks of cancer. Science. 357, 1–8 (2017). [DOI] [PMC free article] [PubMed] [Google Scholar]
- 3.Hanahan D, Weinberg RA, Hallmarks of Cancer : The Next Generation. Cell. 144, 646–674 (2011). [DOI] [PubMed] [Google Scholar]
- 4.Egeblad M, Nakasone ES, Werb Z, Tumors as organs: Complex tissues that interface with the entire organism. Dev. Cell. 18, 884–901 (2010). [DOI] [PMC free article] [PubMed] [Google Scholar]
- 5.Zhou W et al. , DNA methylation loss in late-replicating domains is linked to mitotic cell division. Nat. Genet. 50, 591–602 (2018). [DOI] [PMC free article] [PubMed] [Google Scholar]
- 6.Almamun M et al. , Integrated methylome and transcriptome analysis reveals novel regulatory elements in pediatric acute lymphoblastic leukemia. Epigenetics. 10, 882–890 (2015). [DOI] [PMC free article] [PubMed] [Google Scholar]
- 7.He Y et al. , Improved regulatory element prediction based on tissue-specific local epigenomic signatures. Proc. Natl. Acad. Sci. 114, E1633–E1640 (2017). [DOI] [PMC free article] [PubMed] [Google Scholar]
- 8.Yao L, Shen H, Laird PW, Farnham PJ, Berman BP, Inferring regulatory element landscapes and transcription factor networks from cancer methylomes. Genome Biol. 16, 1–21 (2015). [DOI] [PMC free article] [PubMed] [Google Scholar]
- 9.Ceccarelli M et al. , Molecular Profiling Reveals Biologically Discrete Subsets and Pathways of Progression in Diffuse Glioma. Cell. 164, 550–563 (2016). [DOI] [PMC free article] [PubMed] [Google Scholar]
- 10.Noushmehr H et al. , Identification of a CpG Island Methylator Phenotype that Defines a Distinct Subgroup of Glioma. Cancer Cell. 17, 510–522 (2010). [DOI] [PMC free article] [PubMed] [Google Scholar]
- 11.Hinoue T et al. , Genome-scale analysis of aberrant DNA methylation in colorectal cancer. Cancer Res. 71, 271–282 (2011). [DOI] [PMC free article] [PubMed] [Google Scholar]
- 12.Northcott PA et al. , The whole-genome landscape of medulloblastoma subtypes. Nature. 547, 311–317 (2017). [DOI] [PMC free article] [PubMed] [Google Scholar]
- 13.The Cancer Genome Atlas Research Network, Comprehensive Molecular Characterization of Papillary Renal-Cell Carcinoma. N. Engl. J. Med. 374, 135–145 (2016). [DOI] [PMC free article] [PubMed] [Google Scholar]
- 14.Akhtar-zaidi B et al. , Epigenomic Enhancer Profiling Defines a Signature of Colon Cancer. Science. 336, 736–740 (2012). [DOI] [PMC free article] [PubMed] [Google Scholar]
- 15.Chen H et al. , A Pan-Cancer Analysis of Enhancer Expression in Nearly 9000 Patient Samples. Cell. 173, 386–399.e12 (2018). [DOI] [PMC free article] [PubMed] [Google Scholar]
- 16.Buenrostro JD, Giresi PG, Zaba LC, Chang HY, Greenleaf WJ, Transposition of native chromatin for fast and sensitive epigenomic profiling of open chromatin, DNA-binding proteins and nucleosome position. Nat. Methods. 10, 1213–1218 (2013). [DOI] [PMC free article] [PubMed] [Google Scholar]
- 17.Corces MR et al. , An improved ATAC-seq protocol reduces background and enables interrogation of frozen tissues. Nat. Methods. 14, 959–962 (2017). [DOI] [PMC free article] [PubMed] [Google Scholar]
- 18.Roadmap Epigenetics Consortium et al. , Integrative analysis of 111 reference human epigenomes. Nature. 518, 317–330 (2015). [DOI] [PMC free article] [PubMed] [Google Scholar]
- 19.Schuijers J et al. , Transcriptional Dysregulation of MYC Reveals Common Enhancer-Docking Mechanism. Cell Rep. 23, 349–360 (2018). [DOI] [PMC free article] [PubMed] [Google Scholar]
- 20.Audrey G et al. , A Switch Between Topological Domains Underlies HoxD Genes Collinearity in Mouse Limbs. Science. 340, 1195 (2012). [DOI] [PubMed] [Google Scholar]
- 21.Yeager M et al. , Genome-wide association study of prostate cancer identifies a second risk locus at 8q24. Nat. Genet. 39, 645–649 (2007). [DOI] [PubMed] [Google Scholar]
- 22.Tomlinson IPM et al. , A genome-wide association study identifies colorectal cancer susceptibility loci on chromosomes 10p14 and 8q23.3. Nat. Genet. 40, 623–630 (2008). [DOI] [PubMed] [Google Scholar]
- 23.Sur IK et al. , Mice lacking a Myc enhancer that includes human SNP rs6983267 are resistant to intestinal tumors. Science. 338, 1360–1363 (2012). [DOI] [PubMed] [Google Scholar]
- 24.Thurman RE et al. , The accessible chromatin landscape of the human genome. Nature. 489, 75–82 (2012). [DOI] [PMC free article] [PubMed] [Google Scholar]
- 25.Corces MR et al. , Lineage-specific and single cell chromatin accessibility charts human hematopoiesis and leukemia evolution. Nat. Genet. 48, 1193–1203 (2016). [DOI] [PMC free article] [PubMed] [Google Scholar]
- 26.Van Der Maaten LJP, Hinton GE, Visualizing high-dimensional data using t-sne. J. Mach. Learn. Res. 9, 2579–2605 (2008). [Google Scholar]
- 27.Rodriguez A, Laio A, Clustering By Fast Search and Find of Desity Peaks. Science. 344, 1492–1496 (2014). [DOI] [PubMed] [Google Scholar]
- 28.Hoadley KA et al. , Cell-of-Origin Patterns Dominate the Molecular Classification of 10,000 Tumors from 33 Types of Cancer. Cell. 173, 291–304.e6 (2018). [DOI] [PMC free article] [PubMed] [Google Scholar]
- 29.Kulis M et al. , Whole-genome fingerprint of the DNA methylome during human B cell differentiation. Nat. Genet. 47, 746–756 (2015). [DOI] [PMC free article] [PubMed] [Google Scholar]
- 30.Kim HS et al. , Pluripotency factors functionally premark cell-type-restricted enhancers in ES cells. Nature. 556, 510–514 (2018). [DOI] [PMC free article] [PubMed] [Google Scholar]
- 31.Shen H et al. , Integrated Molecular Characterization of Testicular Germ Cell Tumors. Cell Rep. 23, 3392–3406 (2018). [DOI] [PMC free article] [PubMed] [Google Scholar]
- 32.Werner S et al. , Dual roles of the transcription factor grainyhead-like 2 (GRHL2) in breast cancer. J. Biol. Chem. 288, 22993–23008 (2013). [DOI] [PMC free article] [PubMed] [Google Scholar]
- 33.Denny SK et al. , Nfib Promotes Metastasis through a Widespread Increase in Chromatin Accessibility. Cell. 166, 328–342 (2016). [DOI] [PMC free article] [PubMed] [Google Scholar]
- 34.Baek S, Goldstein I, Hager GL, Bivariate Genomic Footprinting Detects Changes in Transcription Factor Activity. Cell Rep. 19, 1710–1722 (2017). [DOI] [PMC free article] [PubMed] [Google Scholar]
- 35.Schep AN, Wu B, Buenrostro JD, Greenleaf WJ, ChromVAR: Inferring transcription-factor-associated accessibility from single-cell epigenomic data. Nat. Methods. 14, 975–978 (2017). [DOI] [PMC free article] [PubMed] [Google Scholar]
- 36.Yin Y et al. , Impact of cytosine methylation on DNA binding specificities of human transcription factors. Science. 356, 1–15 (2017). [DOI] [PMC free article] [PubMed] [Google Scholar]
- 37.Ellis T et al. , The transcriptional repressor CDP (Cutl1) is essential for epithelial cell differentiation of the lung and the hair follicle. Genes Dev. 15, 2307–2319 (2001). [DOI] [PMC free article] [PubMed] [Google Scholar]
- 38.Javierre BM et al. , Lineage-Specific Genome Architecture Links Enhancers and Non-coding Disease Variants to Target Gene Promoters. Cell, 1369–1384 (2016). [DOI] [PMC free article] [PubMed] [Google Scholar]
- 39.Fulco CP et al. , Systematic mapping of functional enhancer - promoter connections with. Science. 354, 769–773 (2016). [DOI] [PMC free article] [PubMed] [Google Scholar]
- 40.Qi LS et al. , Repurposing CRISPR as an RNA-γuided platform for sequence-specific control of gene expression. Cell. 152, 1173–1183 (2013). [DOI] [PMC free article] [PubMed] [Google Scholar]
- 41.Eom YH, Kim HS, Lee A, Song BJ, Chae BJ, Breast Cancer BCL2 as a Subtype-Specific Prognostic Marker for Breast Cancer. 19, 252–260 (2016). [DOI] [PMC free article] [PubMed] [Google Scholar]
- 42.Cho SW et al. , Promoter of lncRNA Gene PVT1 Is a Tumor-Suppressor DNA Boundary Element. Cell. 173, 1398–1412.e22 (2018). [DOI] [PMC free article] [PubMed] [Google Scholar]
- 43.Silva TC et al. , Enhancer Linking by Methylation/Expression Relationships with the R package ELMER version 2. bioRxiv (2017) (available at http://biorxiv.org/content/early/2017/06/11/148726.abstract). [Google Scholar]
- 44.Robertson AG et al. , Comprehensive Molecular Characterization of Muscle-Invasive Bladder Cancer. Cell. 171, 540–556 (2017). [DOI] [PMC free article] [PubMed] [Google Scholar]
- 45.Castro MAA et al. , Regulators of genetic risk of breast cancer identified by integrative network analysis. Nat. Genet. 48, 12–21 (2015). [DOI] [PMC free article] [PubMed] [Google Scholar]
- 46.Thorsson V et al. , The Immune Landscape of Cancer. Immunity. 48, 812–830.e14 (2018). [DOI] [PMC free article] [PubMed] [Google Scholar]
- 47.Yoshihara K et al. , Inferring tumour purity and stromal and immune cell admixture from expression data. Nat. Commun. 4, 1–11 (2013). [DOI] [PMC free article] [PubMed] [Google Scholar]
- 48.Carter SL et al. , Absolute quantification of somatic DNA alterations in human cancer. Nat. Biotechnol. 30, 413 (2012). [DOI] [PMC free article] [PubMed] [Google Scholar]
- 49.Rooney MS, Shukla SA, Wu CJ, Getz G, Hacohen N, Molecular and genetic properties of tumors associated with local immune cytolytic activity. Cell. 160, 48–61 (2015). [DOI] [PMC free article] [PubMed] [Google Scholar]
- 50.Makowski MM et al. , An interaction proteomics survey of transcription factor binding at recurrent TERT promoter mutations. Proteomics. 16, 417–426 (2016). [DOI] [PubMed] [Google Scholar]
- 51.Katainen R et al. , CTCF/cohesin-binding sites are frequently mutated in cancer. Nat. Genet. 47, 818–821 (2015). [DOI] [PubMed] [Google Scholar]
- 52.Hnisz D et al. , Activation of proto-oncogenes by disruption of chromosome neighborhoods. Science. 351, 1454–1458 (2016). [DOI] [PMC free article] [PubMed] [Google Scholar]
- 53.Hawkins RD et al. , Distinct epigenomic landscapes of pluripotent and lineage-committed human cells. Cell Stem Cell. 6, 479–491 (2010). [DOI] [PMC free article] [PubMed] [Google Scholar]
- 54.Kelly TK et al. , Genome-wide mapping of nucleosome positioning and DNA methylation within individual DNA molecules. Genome Res, 2497–2506 (2012). [DOI] [PMC free article] [PubMed] [Google Scholar]
- 55.Mo A et al. , Epigenomic Signatures of Neuronal Diversity in the Mammalian Brain. Neuron. 86, 1369–1384 (2015). [DOI] [PMC free article] [PubMed] [Google Scholar]
- 56.Picelli S et al. , Tn5 transposase and tagmentation procedures for massively scaled sequencing projects. Genome Res. 24, 2033–2040 (2014). [DOI] [PMC free article] [PubMed] [Google Scholar]
- 57.Buenrostro JD, Wu B, Chang HY, Greenleaf WJ, ATAC-seq: A Method for Assaying Chromatin Accessibility Genome-Wide. Curr. Protoc. Mol. Biol. 109, 1–9 (2015). [DOI] [PMC free article] [PubMed] [Google Scholar]
- 58.Adamson B et al. , A Multiplexed Single-Cell CRISPR Screening Platform Enables Systematic Dissection of the Unfolded Protein Response. Cell. 167, 1867–1882.e21 (2016). [DOI] [PMC free article] [PubMed] [Google Scholar]
- 59.Perez AR et al. , GuideScan software for improved single and paired CRISPR guide RNA design. Nat. Biotechnol. 35, 347–349 (2017). [DOI] [PMC free article] [PubMed] [Google Scholar]
- 60.Jiang H, Lei R, Ding SW, Zhu S, Skewer: A fast and accurate adapter trimmer for next-generation sequencing paired-end reads. BMC Bioinformatics. 15, 1–12 (2014). [DOI] [PMC free article] [PubMed] [Google Scholar]
- 61.Langmead B, Salzberg SL, Fast gapped-read alignment with Bowtie 2. Nat. Methods. 9, 357–359 (2012). [DOI] [PMC free article] [PubMed] [Google Scholar]
- 62.Li H et al. , The Sequence Alignment/Map format and SAMtools. Bioinformatics. 25, 2078–2079 (2009). [DOI] [PMC free article] [PubMed] [Google Scholar]
- 63.Korn JM et al. , Integrated genotype calling and association analysis of SNPs, common copy number polymorphisms and rare CNVs. Nat. Genet. 40, 1253–1260 (2008). [DOI] [PMC free article] [PubMed] [Google Scholar]
- 64.Newton Y et al. , TumorMap: Exploring the molecular similarities of cancer samples in an interactive portal. Cancer Res. 77, e111–e114 (2017). [DOI] [PMC free article] [PubMed] [Google Scholar]
- 65.Weirauch MT et al. , Determination and Inference of Eukaryotic Transcription Factor Sequence Specificity. Cell. 158, 1431–1443 (2014). [DOI] [PMC free article] [PubMed] [Google Scholar]
- 66.Du P et al. , Comparison of Beta-value and M-value methods for quantifying methylation levels by microarray analysis. BMC Bioinformatics. 11, 1–9 (2010). [DOI] [PMC free article] [PubMed] [Google Scholar]
- 67.Gendoo DMA et al. , Genefu: An R/Bioconductor package for computation of gene expression-based signatures in breast cancer. Bioinformatics. 32, 1097–1099 (2016). [DOI] [PMC free article] [PubMed] [Google Scholar]
- 68.Ali HR et al. , Genome-driven integrated classification of breast cancer validated in over 7, 500 samples. Genome Biol. 15, 1–14 (2014). [DOI] [PMC free article] [PubMed] [Google Scholar]
- 69.Wirapati P et al. , Meta-analysis of gene expression profiles in breast cancer: Toward a unified understanding of breast cancer subtyping and prognosis signatures. Breast Cancer Res. 10, 1–11 (2008). [DOI] [PMC free article] [PubMed] [Google Scholar]
- 70.Bernard PS et al. , Supervised risk predictor of breast cancer based on intrinsic subtypes. J. Clin. Oncol. 27, 1160–1167 (2009). [DOI] [PMC free article] [PubMed] [Google Scholar]
- 71.Ciriello G et al. , Comprehensive Molecular Portraits of Invasive Lobular Breast Cancer. Cell. 163, 506–519 (2015). [DOI] [PMC free article] [PubMed] [Google Scholar]
- 72.Curtis C et al. , The genomic and transcriptomic architecture of 2,000 breast tumours reveals novel subgroups. Nature. 486, 346–352 (2012). [DOI] [PMC free article] [PubMed] [Google Scholar]
- 73.He HH et al. , Refined DNase-seq protocol and data analysis reveals intrinsic bias in transcription factor footprint identification. Nat. Methods. 11, 73–78 (2013). [DOI] [PMC free article] [PubMed] [Google Scholar]
- 74.Fletcher MNC et al. , Master regulators of FGFR2 signalling and breast cancer risk. Nat. Commun. 4, 1–12 (2013). [DOI] [PMC free article] [PubMed] [Google Scholar]
- 75.Liu J et al. , An Integrated TCGA Pan-Cancer Clinical Data Resource to Drive High-Quality Survival Outcome Analytics. Cell. 173, 400–416.e11 (2018). [DOI] [PMC free article] [PubMed] [Google Scholar]
- 76.Zhou W, Triche TJ, Laird PW, Shen H, SeSAMe: reducing artifactual detection of DNA methylation by Infinium BeadChips in genomic deletions. Nucleic Acids Res, 1–15 (2018). [DOI] [PMC free article] [PubMed] [Google Scholar]
- 77.Mumbach MR et al. , Enhancer connectome in primary human cells reveals target genes of disease-associated DNA elements. Nat. Genet. 49, 1602–1612 (2017). [DOI] [PMC free article] [PubMed] [Google Scholar]
- 78.Machiela MJ, Chanock SJ, LDlink: A web-based application for exploring population-specific haplotype structure and linking correlated alleles of possible functional variants. Bioinformatics. 31, 3555–3557 (2015). [DOI] [PMC free article] [PubMed] [Google Scholar]
Associated Data
This section collects any data citations, data availability statements, or supplementary materials included in this article.