

ABSTRACT
Background
We assessed trends in incidence, in‐hospital mortality, and admission among patients with adult congenital heart disease (ACHD) presenting to the emergency department (ED) from 2006 to 2012.
Hypothesis
There is a considerable burden of ACHD in the US EDs.
Methods
We used the 2006–2012 US Nationwide Emergency Department Sample. All ED visits with ACHD were identified using standard International Classification of Diseases, Ninth Edition, Clinical Modification codes.
Results
The number of patients presenting to the ED with simple (40.6%) as well as complex (37.6%) ACHD across 2006–2012 increased significantly. Also, there was a considerable increase in prevalence of traditional cardiovascular risk factors among ACHD patients, including hypertension, diabetes, smoking, obesity, and chronic kidney disease. Besides miscellaneous noncardiovascular conditions, nonspecific chest pain (15.9%) and respiratory disorders (15.0%) were the most common reasons for ED visits among patients with simple and complex ACHD, respectively. Although there was a trend toward decrease in admissions across 2006–2012 (P trend < 0.001), the proportion of patients with ACHD presenting to ED requiring admission remained substantial (63.4%). Finally, there was significant variation in admission trends across different geographic locations, hospital types, insurance status, and ED volume among ACHD patients presenting to the ED.
Conclusions
There has been a progressive increase in number of ED visits among ACHD patients across 2006–2012 in the United States. Moreover, the cardiovascular risk‐factor profile of ACHD patients has changed, adding to complexity in management. Current health care delivery to ACHD patients also shows significant geographical, hospital‐based, and insurance status–based disparities.
Introduction
Emergency care in the United States is under considerable stress, with increasing patient visits and decreasing number of emergency departments (ED).1, 2, 3, 4 Data from other cardiovascular subspecialties have indicated that EDs are increasingly being relied upon for evaluation and management of complex cardiac patients.5 With an increase in hospitalization rates of patients with simple as well as complex adult congenital heart disease (ACHD) reported previously, one can surmise that there has been a corresponding increase in the burden of these patients in EDs across the nation.6, 7 Although care for this population is ideally provided at centers of excellence, fragmentation of care remains an issue, and patients with ACHD often present to small hospitals without considerable expertise in ACHD care, especially in emergency settings. However, data regarding the temporal changes in ED visits for patients with ACHD are lacking. Therefore, in this study we evaluated the trends in ED visits for ACHD from 2006 to 2012, stratified into simple and complex disorders.
Methods
Data Source
Data were obtained from the Nationwide Emergency Department Sample (NEDS) database from 2006 to 2012. The NEDS database contains discharge data for ED visits from hospitals located in 30 states, approximating a 20% stratified sample of US hospital‐based EDs. All data available from the Health Care Utilization Project (HCUP) have been de‐identified; hence, the analysis is exempt from federal regulations for the protection of human research participants. The dataset was obtained from the Agency for Healthcare Research and Quality (AHRQ) after completing the Data Use Agreement with HCUP.
Study Population
The NEDS database provides up to 15 diagnoses and 15 procedures for each ED visit. All these have been coded using the standard International Classification of Diseases, Ninth Edition, Clinical Modification (ICD‐9‐CM) codes. In addition, we used the HCUP Clinical Classification Software (CCS) to identify patient comorbidities and specific procedures.8, 9 All adult hospitalizations with a diagnosis code corresponding to known ACHD were included in our study. In administrative databases such as NEDS, it is not possible to distinguish between atrial septal defects (ASD) and patent foramen ovale, as both of these diagnoses are captured by a single ICD‐9 code (745.5). To understand the true burden of “real” ACHD upon the US ED, we excluded these patients from our study, unless there was another coexisting ACHD condition or pulmonary hypertension (PH). (See Supporting Information, Table 1, in the online version of this article for a list of simple, complex, and unclassified ACHD according to the Bethesda classification, along with ICD‐9 codes.10) The first diagnosis in the database is referred to as the principal diagnosis and is considered the primary reason for the ED visit. In cases where the principal diagnosis designated ACHD, the second diagnosis was utilized to determine the primary reason for the ED visit. (For the ICD‐9‐CM/CCS codes for principal diagnoses performed during the hospitalization, see Supporting Information, Table 2, in the online version of this article.)
Table 1.
Baseline Characteristics of the Study Population Stratified by Year of Presentation
| 2006 | 2007 | 2008 | 2009 | 2010 | 2011 | 2012 | % Changea | |
|---|---|---|---|---|---|---|---|---|
| All patients | 36 513 | 39 515 | 43 094 | 47 176 | 50 572 | 54 407 | 52 765 | 41.0 |
| Type of ACHD | ||||||||
| Simple lesion | 12 712 (34.8) | 12 621 (31.9) | 13 346 (31.0) | 14 857 (31.5) | 15 457 (30.6) | 18 052 (33.2) | 17 872 (33.9) | 41.8 |
| Complex lesion | 15 287 (41.9) | 16 404 (41.5) | 18 650 (43.3) | 20 689 (43.9) | 22 098 (43.7) | 23 214 (42.7) | 21 033 (39.9) | 39.6 |
| Unclassified lesion | 8513 (23.3) | 10 489 (26.5) | 11 098 (25.8) | 11 630 (24.7) | 13 018 (25.7) | 13 141 (24.2) | 13 860 (26.3) | 42.1 |
| Mean age, y (SE) | 50.4 (0.5) | 51.2 (0.7) | 51.2 (0.5) | 51.1 (0.4) | 51.4 (0.5) | 51.8 (0.5) | 51.1 (0.4) | 1.3 |
| Sex | ||||||||
| F | 19 077 (52.3) | 20 636 (52.2) | 22 380 (51.9) | 24 191 (51.3) | 26 475 (52.4) | 28 193 (51.8) | 26 612 (50.4) | 38.0 |
| M | 17 429 (47.7) | 18 869 (47.8) | 20 706 (48.1) | 22 974 (48.7) | 24 093 (47.6) | 26 187 (48.2) | 26 153 (49.6) | 44.2 |
| Primary payor | ||||||||
| Medicare | 13 751 (37.8) | 14 841 (37.7) | 16 664 (38.7) | 18 078 (38.4) | 19 486 (38.6) | 21 468 (39.5) | 20 194 (38.3) | 45.7 |
| Medicaid | 5191 (14.3) | 6178 (15.7) | 6882 (16.0) | 7991 (17.0) | 8430 (16.7) | 9218 (17.0) | 9142 (17.3) | 61.5 |
| Private Insurance | 12 819 (35.2) | 13 144 (33.4) | 14 449 (33.6) | 14 825 (31.5) | 16 104 (31.9) | 17 084 (31.5) | 16 284 (30.9) | 28.5 |
| Uninsured | 3121 (8.6) | 3982 (10.1) | 3674 (8.5) | 4305 (9.2) | 4727 (9.4) | 4740 (8.7) | 5002 (9.5) | 37.2 |
| Other | 1540 (4.2) | 1246 (3.2) | 1363 (3.2) | 1847 (3.9) | 1713 (3.4) | 1810 (3.3) | 2081 (3.9) | 39.7 |
| Hospital region | ||||||||
| Northeast | 7307 (20.0) | 7932 (20.1) | 7344 (17.0) | 8406 (17.8) | 8644 (17.1) | 9242 (17.0) | 8955 (17.0) | 19.4 |
| Midwest | 9905 (27.1) | 11 298 (28.6) | 11 262 (26.1) | 11 710 (24.8) | 13 484 (26.7) | 13 580 (25.0) | 13 651 (25.9) | 28.4 |
| South | 12 214 (33.5) | 13 857 (35.1) | 16 272 (37.8) | 18 097 (38.4) | 18 725 (37.0) | 21 346 (39.2) | 19 257 (36.5) | 55.7 |
| West | 7087 (19.4) | 6428 (16.3) | 8216 (19.1) | 8963 (19.0) | 9719 (19.2) | 10 238 (18.8) | 10 902 (20.7) | 56.4 |
| Teaching status/location of hospital | ||||||||
| Metropolitan nonteaching | 13 841 (37.9) | 17 067 (43.2) | 17 499 (40.6) | 18 233 (38.6) | 19 154 (37.9) | 20 824 (38.3) | 18 089 (34.3) | 25.9 |
| Metropolitan teaching | 18 112 (49.6) | 17 396 (44.0) | 19 848 (46.1) | 22 445 (47.6) | 25 965 (51.3) | 27 154 (49.9) | 28 180 (53.4) | 55.8 |
| Nonmetropolitan | 4559 (12.5) | 5051 (12.8) | 5747 (13.3) | 6487 (13.8) | 5455 (10.8) | 6428 (11.8) | 6497 (12.3) | 34.5 |
| Socioeconomic status by median residential HHI | ||||||||
| Q1 | 8761 (24.4) | 10 533 (27.3) | 10 974 (26.2) | 12 256 (26.8) | 12 838 (26.0) | 13 961 (26.2) | 14 406 (27.8) | 47.0 |
| Q2 | 8601 (24.0) | 9849 (25.6) | 12 149 (29.0) | 12 883 (28.1) | 13 706 (27.7) | 13 075 (24.5) | 12 937 (24.9) | 41.0 |
| Q3 | 9709 (27.1) | 10 208 (26.5) | 9755 (23.3) | 11 525 (25.2) | 11 768 (23.8) | 14 314 (26.9) | 12 674 (24.4) | 35.5 |
| Q4 | 8790 (24.5) | 7949 (20.6) | 8944 (21.4) | 9142 (20.0) | 11 081 (22.4) | 11 954 (22.4) | 11 840 (22.8) | 42.1 |
| Clinical characteristics | ||||||||
| Hypertension | 12 672 (34.7) | 14 713 (37.2) | 16 788 (39.0) | 19 170 (40.6) | 20 580 (40.7) | 22 695 (41.7) | 22 223 (42.1) | 64.0 |
| Diabetes | 4474 (12.3) | 5547 (14.0) | 6547 (15.2) | 7054 (14.9) | 7395 (14.6) | 8442 (15.5) | 7970 (15.1) | 63.8 |
| CKD | 2517 (6.8) | 2909 (7.4) | 3288 (7.6) | 3989 (8.5) | 4324 (8.6) | 4926 (9.1) | 4779 (9.1) | 78.9 |
| Obesity | 1984 (5.4) | 2026 (5.1) | 2845 (6.6) | 3675 (7.8) | 4131 (8.2) | 4367 (8.0) | 4231 (8.0) | 114.4 |
| Smoking | 6054 (16.6) | 6786 (17.2) | 8090 (18.8) | 8529 (18.1) | 9604 (18.9) | 10 647 (19.6) | 11 175 (21.2) | 70.0 |
| PVD | 1520 (4.2) | 1910 (4.8) | 2292 (5.3) | 2617 (5.5) | 3002 (5.9) | 3412 (6.2) | 3134 (5.9) | 90.8 |
Abbreviations: ACHD, adult congenital heart disease; CKD, chronic kidney disease; DM, diabetes mellitus; F, female; HHI, household income; HTN, hypertension; M, male; PVD, peripheral vascular disease; Q, quartile; SE, standard error.
Numbers in parentheses indicate % unless otherwise stated.
Indicates % change in the specific characteristic during the study period. This was calculated by computing the difference between the average 2011–2012 and average 2006–2007, to minimize random variation.
Study Outcomes
The primary aim of this study was to evaluate the trend in ED visits among patients with known ACHD across 2006–2012, stratified by simple, complex, and unclassified ACHD. We also assessed the trends in in‐hospital mortality among the study population across 2006–2012. We further evaluated changes in the distribution of demographic and clinical characteristics among these patients. In addition, resource utilization was evaluated using admission and length of stay following the ED visit among patients requiring admission. Furthermore, we evaluated the independent predictors of admission in the study population.
Statistical Analysis
Survey statistics traditionally used to analyze complex semi‐random survey designs were employed to analyze these data. Because the data from NEDS represent a collection of scattered hospital clusters, analysis was structured to account for a complex, multistage, probability sampling. The NEDS recommends the use of “strata” for constructing analysis clusters, which includes geographic census region, trauma center level, teaching status, urban/rural location, and hospital ownership. Moreover, the analysis is further stratified into individual hospitals, which serve as primary sampling units for the analysis. In the NEDS database, each ED visit is linked to a “discharge weight” that can be utilized to calculate projected national estimates for all hospital‐related outcomes, after accounting for the hierarchical structure of the dataset. Multivariable hierarchical logistic regression analysis with exchangeable working matrix was utilized to determine independent predictors of admission. The analysis of all outcomes has been presented after adjusting for age, sex, insurance status, hypertension (HTN), diabetes mellitus (DM), obesity, peripheral vascular disease, smoking, chronic pulmonary disease, chronic kidney disease (CKD), reason for the ED visit, and year of presentation, along with hospital characteristics including geographic location, teaching status, and metropolitan location.
Results
Trends in Adult Congenital Heart Disease–Related Emergency Department Visits
We included a total of 72 090 ED visits with ACHD across 2006 2012, of which 23 359 (32.4%) involved subjects with simple lesions, 30 653 (42.5%) involved subjects with complex lesions, and the remaining 18 078 (25.1%) were unclassified lesions. Because the included sample represented a 20% weighted sample of the entire US population, the study cohort projected to an estimated 324 040 ED visits nationally across the 7‐year period.
Figure 1A demonstrates the trend in annual number of ED visits among adults with ACHD across the United States from 2006 to 2012. There has been a considerable increase in ED visits (± SE) among patients with ACHD, from 36 513 ± 1349 in 2006 to 52 765 ± 1843 in 2012, corresponding to a 44.5% increase in the ED visit numbers during the 7‐year period. When expressed as a proportion of all ED visits, there was still a significant trend toward increase in ACHD‐related ED visits in the United States during 2006 2012. Figure 1B demonstrates the annual ED visits after stratifying by ACHD category. The number of ED visits for patients with simple ACHD increased from 12 712 ± 560 during 2006 to 17 872 ± 810, corresponding to a 40.6% increase in the number of ED visits across 2006 2012. Similarly, there was a 37.6% increase in the ED visit rates for complex ACHD and a 62.8% increase in the ED visit rates for unclassified ACHD.
Figure 1.

Projected annual national estimates of ED visits among patients with ACHD. (A) Overall national estimates with 95% CIs. The black line demonstrates the estimated number of annual ED visits and corresponds to the left sided Y‐axis. The dotted lines around the effect estimates constituting the black line represent the 95% CI of the respective effect estimate. The colored bars represent the number of ED visits among ACHD patients, expressed per 100 000 ED visits and correspond to the right‐sided Y‐axis. The lines on top of the bars denote the standard error of the respective effect estimate. (B) National estimates stratified into simple, complex, and unclassified defects. The lines on top of the bars denote the standard error of the respective effect estimate. For each year, the bar on the left (dark gray) represents simple ACHD, the bar in the middle (blue) represents complex ACHD, and the bar on the right (light gray) represents unclassified ACHD. Abbreviations: ACHD, adult congenital heart disease; CI, confidence interval; ED, emergency department.
The trend of annual numbers of ED visits for specific simple and complex defects is shown in Supporting Information, tables 3 and 4, respectively, in the online version of this article. There was an increase in the number of all simple disorders, including ventricular septal defects (VSD; +10.6%), congenital aortic valve abnormalities (+57.2%), congenital mitral valve abnormalities (+36.5%), and coronary anomalies (+60.1%). Among the complex disorders, secundum ASD with PH, VSD with PH, aortic anomalies, and Tetralogy of Fallot were the most common diseases encountered. The aortic anomalies increased from 3714 ± 315 in 2006 to 5007 ± 301 in 2012 (a 34.8% increase). The number of ED visits with secundum ASD with PH also increased, from 2416 ± 161 in 2006 to 8700 ± 390 in 2012 (a 115.8% increase). The prevalence of coexisting PH with various ACHD increased from 4802 ± 291 in 2006 to 8526 ± 464 in 2012, corresponding to a 77.6% increase during the 7‐year period.
Baseline Characteristics
The Table 1 demonstrates the baseline characteristics of the study population from 2006 to 2012. There was no significant difference in age distribution (P trend = 0.25), sex distribution (P trend = 0.10), or the proportion of uninsured patients (P trend = 0.76) across the study duration. Although Southern states contributed the largest proportion of patients to the study pool, there were no statistically significant differences in regional distribution noted across 2006–2012 (P trend = 0.29). On the contrary, there was a significant increase in the proportion of ACHD patients with HTN, DM, CKD, obesity, and smoking (P trend < 0.001 for each comparison) from 2006 to 2012. (The baseline characteristics stratified into simple and complex ACHD, respectively, are shown in Supporting Information, tables 5 and 6, in the online version of this article.) Among patients age <65 years, there was a significant decrease in the proportion of patients with private insurance, with a corresponding increase in proportion of patients with Medicaid as their primary insurance (see Supporting Information, Table 7, in the online version of this article).
Figure 2 demonstrates the primary reason for ED visits, stratified into simple and complex ACHD. Besides the miscellaneous causes for ED visits, nonspecific chest pain and arrhythmias were the most common primary reasons for ED visit among simple‐ACHD patients. Among complex‐ACHD patients, miscellaneous causes, respiratory disorders, and arrhythmias were most common reasons for primary presentation to the ED. As noted in Figure 2, there was a considerable difference in reasons for ED visits among patients with simple and complex ACHD. Respiratory disorders contributed to 8.6% of all ED visits in simple‐ACHD patients, compared with 15.0% of all ED visits among complex‐ACHD patients (P < 0.001). Congestive heart failure and cardiomyopathy contributed to 9.9% of ED visits in patients with complex ACHD, which was significantly higher than the 4.2% among simple‐ACHD patients (P < 0.001). Acute myocardial infarction contributed to 6.5% and 2.2% of ED visits among patients with simple and complex ACHD, respectively (P < 0.001).
Figure 2.
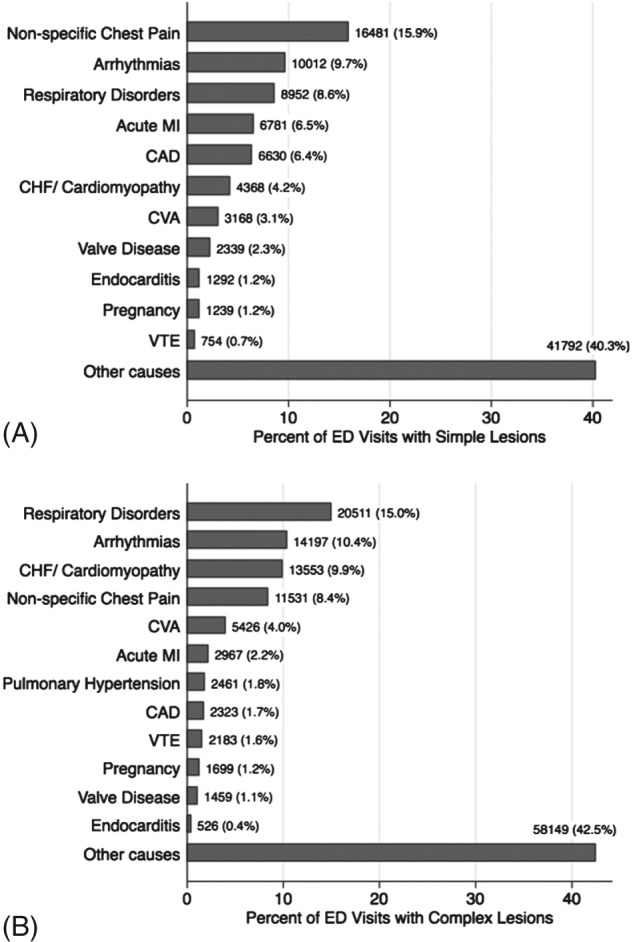
This figure demonstrates the primary reasons for presentation to the ED among patients with (A) simple ACHD and (B) complex ACHD. Abbreviations: ACHD, adult congenital heart disease; CAD, coronary artery disease; CHF, congestive heart failure; CVA, cerebrovascular accident; ED, emergency department; MI, myocardial infarction; VTE, venous thromboembolism.
In‐hospital Mortality, Admissions, and Length of Stay
Figure 3 shows the incidence of in‐hospital mortality and admission in patients with simple and complex ACHD following ED visits across the study duration. We observed significantly higher in‐hospital mortality among complex‐ACHD patients as compared with simple‐ACHD patients (2.8% vs 1.7%; P < 0.001). In addition, there was a trend toward a reduction in in‐hospital mortality among both simple (1.9% in 2006 to 1.5% in 2012; P trend < 0.02) as well as complex ACHD (3.3% in 2006 to 2.8% in 2012; P trend = 0.04).
Figure 3.

In‐hospital mortality and admission. (A) Annual in‐hospital mortality among patients admitted with simple and complex ACHD. (B) Annual admissions among patients admitted with simple and complex ACHD. In this figure, the black line with circles indicates trends in simple ACHD and the red line with squares indicates trends in complex ACHD. The dotted lines around the effect estimates indicate the 95% CI of the respective effect estimate. Abbreviations: ACHD, adult congenital heart disease; CI, confidence interval.
We noted that a large proportion of patients with underlying ACHD presenting to the ED were consequently admitted to the hospital (63.4% for overall cohort). The proportion of patients admitted to the hospital following ED visits was significantly higher among simple‐ACHD patients as compared with complex‐ACHD patients (70.1% vs 66.9%; P < 0.001). On the other hand, the proportion of patients transferred from an ED to a different hospital was significantly higher for complex ACHD (2.1%) as compared with simple ACHD (0.9%; P < 0.001). As seen in Figure 3B, there has been a consistent decline in the rate of admission among patients with both simple and complex ACHD across 2006–2012 (P trend < 0.001 for both comparisons). Independent predictors of admission after an ED visit among patients with simple and complex ACHD, respectively, are shown in Supporting Information, tables 8 and 9, in the online version of this article. We noted lower rates of admission among younger patients and female patients among both simple and complex ACHD‐related ED visits. We also observed significantly higher rates of admission in the Northeast as compared with other geographic regions. Metropolitan teaching hospitals had significantly higher rates of admission compared with other hospital types for complex ACHD. In terms of reasons for presentation to the ED, endocarditis, acute myocardial infarction, venous thromboembolism, and cerebrovascular accidents were highly significant predictors of admission for patients with both simple and complex ACHD. In addition, uninsured patients were observed to have significantly lower rates of admission compared with insured patients among both simple and complex ACHD cohorts. Figure 4 demonstrates the trend in admission across the study duration stratified by hospital type, hospital location, and insurance status. Furthermore, there was no significant difference in median length of stay among simple‐ACHD and complex‐ACHD patients across the study duration (see Supporting Information, Figure, in the online version of this article).
Figure 4.
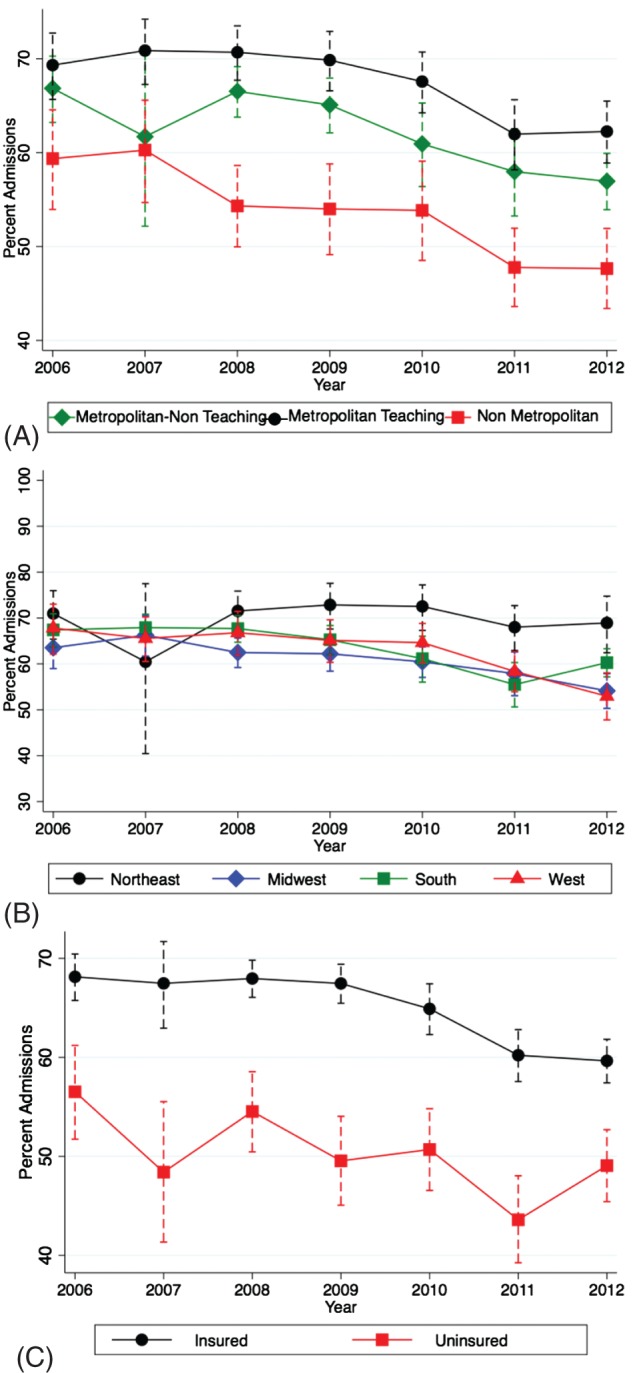
Trend in admission across the study duration stratified by (A) hospital type, (B) hospital location, and (C) insurance status. The dotted lines around the effect estimates indicate the 95% CI of the respective effect estimate. Abbreviations: CI, confidence interval.
The impact of the size of the ED (estimated using total number of annual ED visits) upon the proportion of ACHD visits and the proportion of patients admitted to the hospital subsequently is shown in Supporting Information, Table 10, in the online version of this article. When divided into quartiles based on annual ED volume, there was no significant trend toward changing proportion of ACHD patients across the quartiles (P trend = 0.83). However, there was a statistically significant trend toward a higher proportion of patients getting admitted from larger EDs. Mean admission rates across ED volume quartiles 1–4 were 46.7%, 60.3%, 65.2%, and 67.5%, respectively (P trend < 0.001).
Discussion
Our study has evaluated the burden of underlying ACHD in patients presenting to the ED in the United States from 2006 to 2012. We have several important findings. First, there has been a significant increase in the number of adults with simple and complex ACHD presenting to the ED during 2006 2012. Notably, there has been a considerable increase in the number of patients with PH. Second, there was an increase in the prevalence of cardiovascular risk factors, including HTN, DM, smoking, obesity, and CKD, over the study duration. Third, besides miscellaneous noncardiovascular conditions, nonspecific chest pain and respiratory disorders were the top reasons for ED visits among adults with simple and complex ACHD, respectively. Fourth, although there was a trend toward decrease in admissions across 2006–2012, the overall proportion of patients with ACHD presenting to the ED requiring admission remains substantial. Finally, there was a significant variation in admission trends noted across different geographic locations, hospital types, insurance status, and overall ED volume among ACHD patients presenting to the ED.
The overwhelming growth in the ACHD population in the United States is multifactorial and attributable to advancement in the surgical and medical approach to children with congenital heart disease, which has led to marked improvement in survival to adulthood and overall life expectancy. In addition, management of a larger number of patients in ACHD centers of excellence has possibly led to improvement in outcomes and survival.11 As of 2015, there are 114 self‐designated ACHD specialty centers in the United States, with 799 median patient visits per year.12 However, it is estimated that >500 000 patients with complex ACHD require specialized care in the United States, exposing a major gap in current health care delivery to these patients.13, 14 For the first time, the current study has characterized the burden of ACHD patients in US EDs. During 2006 2012, there was an increase in the absolute number as well as the relative proportion of ACHD patients presenting to the ED. Besides increasing numbers, there appears to be an increase in the complexity of these patients. We demonstrated a considerable increase in the number of patients with PH during 2006 2012. Although the reasons for this are not completely clear, it is possible that advances in echocardiography and invasive diagnostics in the ACHD arena have led to increasing diagnosis of PH among these patients. In addition, there has been an increase in the proportion of patients with cardiovascular‐related comorbidities, adding a layer of complexity in the management of ACHD patients. Similar findings have been reported in several other studies, making our results consistent with current understanding.6, 15
One of the important findings of our study was a large proportion of patients with ACHD presenting to the ED being admitted to the hospital for management. Although there has been a trend toward reduction in this proportion during recent years, the overall proportion of admission still remains substantial. Besides the complexity of ACHD patients and the presenting diagnosis, the large proportion of admissions may be due to the tolerance of risk by the ED physician. The tolerance of risk with respect to discharge from the ED by a physician who may lack an ongoing relationship with the patient or may be unfamiliar with the complexity of the patient's condition is likely to be low. This emphasizes the need for ED physicians to have training and exposure to patients with ACHD. The reduction in the admission rates over 2006 2012, without change in in‐hospital mortality, is encouraging and likely reflects on the improvement in familiarity of ED physicians with ACHD and corresponding changes in the threshold of admission from the ED. Further mitigating factors include better outpatient treatment of the underlying ACHD condition, increased use of secondary prevention strategies, availability of guidelines for management of ACHD, and better control of risk factors, as well as antecedent of growth of ACHD centers across the nation.
Our study demonstrated a considerable heterogeneity in the presentation and disposition of simple and complex ACHD patients. We noted a significantly higher rate of admission among patients with simple ACHD as compared with complex ACHD. Although the reasons for this difference are largely unclear, differences in the reasons for presentation between the 2 cohorts might account for this disparity. The higher rate of admission among simple‐ACHD patients reflects a considerable use of health care resources even among patients with so‐called “simple” defects. On the contrary, we noted a higher rate of transfer to other acute‐care hospitals from the primary ED for complex ACHD as compared with simple ACHD.
One of the important findings of our study was regional variability in the admission decisions across the United States. We noted a significantly higher rate of admissions in the Northeast compared with other regions. Similar regional variability has been reported in presentation of acute heart failure in US EDs.5 Ideally, these rates should be viewed in context of readmission rates over the next 30 days, which were unavailable in the current version of NEDS. It is probably more cost and resource effective to manage a higher proportion of patients in the hospital, rather than having them present to the ED multiple times in a short time span. Disparities in admissions between metropolitan and nonmetropolitan hospitals, as well as teaching and nonteaching hospitals, can be attributed to increased complexity of the case mix at larger tertiary‐care hospitals. Moreover, our study also demonstrated lower rates of admission among uninsured patients, which has considerable implications on implementation of equitable national quality‐of‐care initiatives. This is potentially due to a lower disease acuity as well as overwhelming concern over a large amount of unfunded care for admission among uninsured patients. It has been previously reported that congenital heart disease patients without insurance are likely to use the ED as their usual source of care, and therefore may be less clinically ill than their insured counterparts.16 This might be responsible for a higher rate of discharge following treatment and a period of observation in the ED, without need for admission among these patients. Interestingly, our study also demonstrated differences in admission rates based on overall ED volume. Despite lack of association between the proportion of ACHD visits with overall ED volume, we observed significantly higher rates of admission following presentation to busier EDs. Although differences in the presentation and complexity of patients might partially account for these discrepancies between the EDs, one could hypothesize that differences in risk tolerance as well as lack of familiarity with medical conditions in a relatively uncommon ACHD patient cohort in smaller EDs might also be responsible for these differences.
Study Limitations
Our study has several limitations, of which many are inherent to large administrative databases. First, there may be errors in coding of diseases or procedures. Second, because the unit of analysis in the NEDS database is “unique visit” rather than “unique patient,” it is possible that 1 patient might have been represented more than once, in case of a repeat ED visit. In addition, because several ACHD diagnoses might coexist in a single patient, we acknowledge that the trends might be overestimated. However, patients with ≥1 ACHD diagnosis represented a minority of patients (<5%), and the direction of trends in our analysis is largely accurate. Third, this is a retrospective observational study, which may be subject to traditional biases of observational studies, like selection bias. However, these limitations might be partially compensated for by the large size of the NEDS database and a uniform representation of all regions of the United States. Fourth, a few diagnoses, such as secundum ASD/patent foramen ovale, suffer from lack of diagnostic specificity, which may limit distinction of resource utilization in these discrete disease states. Therefore, we decided to exclude this from our study, unless it was coexistent with another ACHD diagnosis or with PH. Fifth, the HCUP database is limited in coding of “observation” services. Observation may be coded as inpatient admission or as ED discharge, depending on whether the services were rendered by the inpatient team or the ED team. Finally, residual measured and unmeasured confounding may have influenced some of these findings.
Conclusion
There has been a significant increase in the number of ED visits among patients with both simple as well as complex ACHD over 2006 2012. Besides miscellaneous noncardiovascular conditions, nonspecific chest pain and respiratory disorders were the top causes of ED visits among adults with simple and complex ACHD, respectively. Although there was a trend toward a decrease in admissions across 2006 2012, the overall proportion of patients with ACHD presenting to the ED requiring admission remains substantial. Finally, there was a significant variation in admission trends noted across different geographic locations, hospital types, and insurance status, as well as overall ED volume among ACHD patients presenting to the ED. These findings emphasize the need for increased awareness and enhanced resources to care for this growing population of patients.
Supporting information
Supplementary figure 1: Length of hospital stay among ACHD patients admitted to the hospital after ED visit. Panel A demonstrates length of stay among simple ACHD patients admitted to the hospital following an ED visit, across 2006‐2012. Panel B demonstrates length of stay among complex ACHD patients admitted to the hospital following an ED visit, across 2006‐2012. The length of stay has been represented using modified box and whisker plots, where the central line denotes the median, the box denotes the interquartile range and the whiskers denote the largest and smallest values that are not outliers (>|1.5*interquartile range|). The median length of stay among simple and complex ACHD patients was 3 days and 4 days respectively and remained unchanged across the duration of the study.
Supplementary Table 1: ICD‐9 codes for congenital heart defects included in our analysis. The stratification into simple, complex and unclassified categories was based on the 32nd Bethesda Conferecne document and other published reports. Simple diagnoses with coexising complex diagnosies or pulmonary hypertension were classified as complex.
Supplementary Table 2: ICD‐9 based and CCS based codes for reason for hospital admission
Supplementary table 3: Annual number of ED visits for adults with simple congenital heart disease across 2006‐2012. The numbers is brackets represent the standard error of the estimate. According to the Bethesda classification of congenital heart disease, simple lesions with coexisting pulmonary hypertension were classified as complex lesions.
Supplementary table 4: Annual number of ED visits for adults with complex congenital heart disease across 2006‐2012. The numbers is brackets represent the standard error of the estimate. According to the Bethesda classification of congenital heart disease, simple lesions with coexisting pulmonary hypertension were classified as complex lesions.
Supplementary Table 5: Baseline characteristics for adults with simple lesions (excluding ASD/PFO) stratified by the year of presentation The last column on the right indicates the percent change in the specific characteristic during the study period. This was calculated by computing the difference between the average 2011/2012 and average 2006/2007, in order to minimize random variation.
Supplementary Table 6: Baseline characteristics for adults with complex lesions stratified by the year of presentation. The last column on the right indicates the percent change in the specific characteristic during the study period. This was calculated by computing the difference between the average 2011/2012 and average 2006/2007, in order to minimize random variation.
Supplementary table 7: Distribution of primary insurance for patients under 65 years of age with ACHD presenting to the ED. The numbers in brackets indicate the percentage of patients in that category.
Supplementary table 8: Multivariable hierarchical logistic regression model to predict admission following ED visit among patients with simple lesions
Supplementary table 9: Multivariable hierarchical logistic regression model to predict admission following ED visit among patients with complex lesions
Supplementary table 10: Impact of overall annual ED volume on ED visits and admissions among ACHD patients.
Acknowledgments
The author would like to acknowledge the help of Ms. Kathryn Brock in editing the manuscript.
Dr. Menon is a consultant for and has received research grant from Astra Zeneca and is a consultant for Takeda pharmaceuticals. All other authors have no funding, financial relationships or conflicts of interest to disclose.
References
- 1. Hsia RY, Kellermann AL, Shen YC. Factors associated with closures of emergency departments in the United States [published correction appears in JAMA. 2011;306:162]. JAMA. 2011;305:1978–1985. [DOI] [PMC free article] [PubMed] [Google Scholar]
- 2. Kellermann AL. Crisis in the emergency department. N Engl J Med. 2006;355:1300–1303. [DOI] [PubMed] [Google Scholar]
- 3. Pitts SR, Pines JM, Handrigan MT, et al. National trends in emergency department occupancy, 2001 to 2008: effect of inpatient admissions versus emergency department practice intensity. Ann Emerg Med. 2012;60:679.e3–686.e3. [DOI] [PubMed] [Google Scholar]
- 4. Tang N, Stein J, Hsia RY, et al. Trends and characteristics of US emergency department visits, 1997–2007. JAMA. 2010;304:664–670. [DOI] [PMC free article] [PubMed] [Google Scholar]
- 5. Storrow AB, Jenkins CA, Self WH, et al. The burden of acute heart failure on U.S. emergency departments. JACC Heart Fail. 2014;2:269–277. [DOI] [PMC free article] [PubMed] [Google Scholar]
- 6. Agarwal S, Sud K, Menon V. Nationwide hospitalization trends in adult congenital heart disease across 2003–2012 [published online ahead of print January 19, 2016]. J Am Heart Assoc. doi: 10.1161/JAHA.115.002330. [DOI] [PMC free article] [PubMed] [Google Scholar]
- 7. Opotowsky AR, Siddiqi OK, Webb GD. Trends in hospitalizations for adults with congenital heart disease in the U.S. J Am Coll Cardiol. 2009;54:460–467. [DOI] [PubMed] [Google Scholar]
- 8.US Agency for Healthcare Research and Quality, Healthcare Cost and Utilization Project (HCUP). Clinical Classifications Software (CCS) for ICD‐9‐CM. http://www.hcup‐us.ahrq.gov/toolssoftware/ccs/ccs.jsp. Published 2014. Accessed February 12, 2014.
- 9. US Agency for Healthcare Research and Quality , Healthcare Cost and Utilization Project (HCUP). Comorbidity Software, version 3.7. http://www.hcup‐us.ahrq.gov/toolssoftware/comorbidity/comorbidity.jsp. Published 2013. Accessed February 14, 2014.
- 10. Warnes CA, Liberthson R, Danielson GK, et al. Task force 1: the changing profile of congenital heart disease in adult life. J Am Coll Cardiol. 2001;37:1170–1175. [DOI] [PubMed] [Google Scholar]
- 11. Fernandes SM, Chamberlain LJ, Grady S Jr, et al. Trends in utilization of specialty care centers in California for adults with congenital heart disease. Am J Cardiol. 2015;115:1298–1304. [DOI] [PubMed] [Google Scholar]
- 12. Adult Congenital Heart Association . http://www.achaheart.org//clinic‐directory.aspx. Accessed April 4, 2015.
- 13. Marelli AJ, Therrien J, Mackie AS, et al. Planning the specialized care of adult congenital heart disease patients: from numbers to guidelines; an epidemiologic approach. Am Heart J. 2009;157:1–8. [DOI] [PubMed] [Google Scholar]
- 14. Webb G, Landzberg MJ, Daniels CJ. Specialized adult congenital heart care saves lives. Circulation. 2014;129:1795–1796. [DOI] [PubMed] [Google Scholar]
- 15. O'Leary JM, Siddiqi OK, de Ferranti S, et al. The changing demographics of congenital heart disease hospitalizations in the United States, 1998 through 2010. JAMA. 2013;309:984–986. [DOI] [PubMed] [Google Scholar]
- 16. Gurvitz MZ, Inkelas M, Lee M, et al. Changes in hospitalization patterns among patients with congenital heart disease during the transition from adolescence to adulthood. J Am Coll Cardiol. 2007;49:875–882. [DOI] [PubMed] [Google Scholar]
Associated Data
This section collects any data citations, data availability statements, or supplementary materials included in this article.
Supplementary Materials
Supplementary figure 1: Length of hospital stay among ACHD patients admitted to the hospital after ED visit. Panel A demonstrates length of stay among simple ACHD patients admitted to the hospital following an ED visit, across 2006‐2012. Panel B demonstrates length of stay among complex ACHD patients admitted to the hospital following an ED visit, across 2006‐2012. The length of stay has been represented using modified box and whisker plots, where the central line denotes the median, the box denotes the interquartile range and the whiskers denote the largest and smallest values that are not outliers (>|1.5*interquartile range|). The median length of stay among simple and complex ACHD patients was 3 days and 4 days respectively and remained unchanged across the duration of the study.
Supplementary Table 1: ICD‐9 codes for congenital heart defects included in our analysis. The stratification into simple, complex and unclassified categories was based on the 32nd Bethesda Conferecne document and other published reports. Simple diagnoses with coexising complex diagnosies or pulmonary hypertension were classified as complex.
Supplementary Table 2: ICD‐9 based and CCS based codes for reason for hospital admission
Supplementary table 3: Annual number of ED visits for adults with simple congenital heart disease across 2006‐2012. The numbers is brackets represent the standard error of the estimate. According to the Bethesda classification of congenital heart disease, simple lesions with coexisting pulmonary hypertension were classified as complex lesions.
Supplementary table 4: Annual number of ED visits for adults with complex congenital heart disease across 2006‐2012. The numbers is brackets represent the standard error of the estimate. According to the Bethesda classification of congenital heart disease, simple lesions with coexisting pulmonary hypertension were classified as complex lesions.
Supplementary Table 5: Baseline characteristics for adults with simple lesions (excluding ASD/PFO) stratified by the year of presentation The last column on the right indicates the percent change in the specific characteristic during the study period. This was calculated by computing the difference between the average 2011/2012 and average 2006/2007, in order to minimize random variation.
Supplementary Table 6: Baseline characteristics for adults with complex lesions stratified by the year of presentation. The last column on the right indicates the percent change in the specific characteristic during the study period. This was calculated by computing the difference between the average 2011/2012 and average 2006/2007, in order to minimize random variation.
Supplementary table 7: Distribution of primary insurance for patients under 65 years of age with ACHD presenting to the ED. The numbers in brackets indicate the percentage of patients in that category.
Supplementary table 8: Multivariable hierarchical logistic regression model to predict admission following ED visit among patients with simple lesions
Supplementary table 9: Multivariable hierarchical logistic regression model to predict admission following ED visit among patients with complex lesions
Supplementary table 10: Impact of overall annual ED volume on ED visits and admissions among ACHD patients.