

SUMMARY
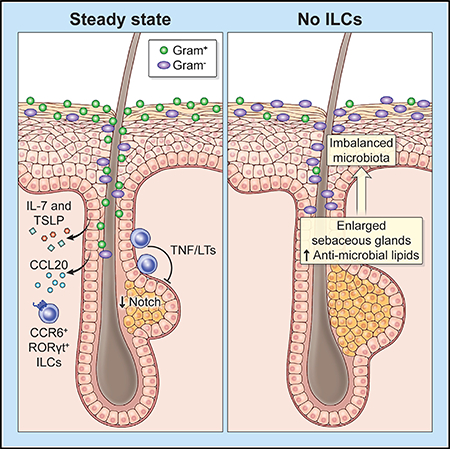
Immune cells and epithelium form sophisticated barrier systems in symbiotic relationships with microbiota. Evidence suggests that immune cells can sense microbes through intact barriers, but regulation of microbial commensalism remain largely unexplored. Here, we uncovered spatial compartmentalization of skin-resident innate lymphoid cells (ILCs) and modulation of sebaceous glands by a subset of RORγt+ ILCs residing within hair follicles in close proximity to sebaceous glands. Their persistence in skin required IL-7 and thymic stromal lymphopoietin, and localization was dependent on the chemokine receptor CCR6. ILC subsets expressed TNF receptor ligands, which limited sebocyte growth by repressing Notch signaling pathway. Consequently, loss of ILCs resulted in sebaceous hyperplasia with increased production of antimicrobial lipids and restricted commensalism of Gram-positive bacterial communities. Thus, epithelia-derived signals maintain skin-resident ILCs that regulate microbial commensalism through sebaceous gland-mediated tuning of the barrier surface, highlighting an immune-epithelia circuitry that facilitates host-microbe symbiosis.
In Brief
Skin innate lymphoid cell subsets rely on hair follicle-derived factors for persistence and localization and tune the skin microbiota by controlling sebaceous gland function.
Graphical Abstract
INTRODUCTION
Mammalian barrier surfaces are inhabited by a variety of microorganisms that have developed symbiotic relationships. Evolutionary pressure has led to the sophistication of barrier systems that, together with the immune system, have co-evolved to form an alliance both to protect against pathogens and to ensure host-microbe symbiosis. Despite the importance of microbiota in both physiological and pathological states (Honda and Littman, 2016), the specific mechanisms involved in crosstalk between epithelia and the immune system that achieve sustainable tuning of microbial equilibrium remain elusive.
Mammalian skin is the body’s outermost barrier that provides protection against trauma, thermal changes, and external agents, including microbes. Skin fulfills its barrier functions through its multiple layers, which consist of three different anatomical compartments: epidermis, dermis, and subcutis. Each of these layers has distinct morphological and physiological functions. Epidermis, the outer most layer of skin, requires the highest barrier stringency because of its constant exposure to external stimuli and microbial challenges, providing the first line of physical and immunological defense. Epidermis is a sophisticated composition of structures, including hair follicles, a defining feature of mammals. Hair follicles are equipped with sebaceous glands and by producing sebum, a complex formation of lipids, tune the skin surface barrier.
Skin is home to a vast number of resident innate and adaptive immune cells with tissue-specialized functions, potentially including many that have not yet been elucidated. These immune cells add another layer of functional complexity to the skin barrier system (Nestle et al., 2009). Mechanisms that elicit antimicrobial immune responses have been extensively studied in the past. However, it is not clear whether skin-resident immune cells are constitutively involved in barrier homeostasis and how they collaborate with epithelial cells to effectively maintain the balance of skin microbiota.
Recent identification of an innate arm of the lymphoid lineage referred to as innate lymphoid cells (ILCs) (Spits et al., 2013) has prompted a fundamental reassessment of the roles of innate immunity in pathogen defense and tissue homeostasis. In contrast to T lymphocytes, ILCs lack the T cell receptor and become activated in an antigen-independent manner in response to tissue-derived signals in a perturbed microenvironment. ILCs display a wide range of effector functions and consist of three functionally distinct groups: termed ILC1, ILC2, and ILC3, which are defined by transcription factors and effector molecules that they express (Diefenbach et al., 2014). ILCs modulate epithelial cell function by producing cytokines and growth factors that promote barrier function and expulsion of pathogens (Klose and Artis, 2016) (McKenzie et al., 2014). Although the roles of ILCs have been extensively investigated in recent years in the contexts of infection and inflammation, their roles in regulating barrier homeostasis and balancing microbial ecology remain unexplored.
Here, we uncover a role of skin-resident ILCs in the regulation of barrier homeostasis and the microbiota. Previous studies have targeted specific groups of skin ILCs and their functions during immune responses, but the detailed landscape of ILC subsets is unclear. By immunophenotyping, as well as transcriptome and regulome profiling, we determined a high degree of compartmentalization of ILCs with distinct characteristics in different anatomical layers of skin. Positioning and skin-residency of ILCs require epithelia-derived chemokines and cytokines. Identification of a unique population of RORγt+ ILCs around hair follicles in close proximity to sebaceous glands led us to focus on the role of ILCs in the regulation of sebaceous function. Remarkably, the lack of skin ILCs resulted in sebaceous hyperplasia with excessive production of an antimicrobial free fatty acid leading to restricted commensalism of Gram-positive bacterial communities. Subsets of ILCs expressed tumor necrosis factor (TNF) and lymphotoxins, both of which restricted sebocyte growth and repressed Notch signaling, revealing an epithelia-immune circuitry in the homeostatic regulation of skin barrier systems. Thus, our data provide evidence of a previously unrecognized epithelia-immune alliance for sustaining microbial equilibrium.
RESULTS
ILCs with Distinct Transcriptome and Regulome Landscapes Are Compartmentalized in the Skin
To investigate the identities and characteristics of ILCs in different anatomical skin layers, epidermis, dermis, and subcutis were separately isolated from the skin of wild-type C57BL/6 mice. Flow cytometry analysis of each layer revealed distinct populations that expressed Thy1.2 but lacked expression of lymphoid- and myeloid-lineage markers (Lin−) (Figure 1A). These Lin− Thy1.2+ cells persisted in T and B lymphocyte-deficient Rag2−/− mice but were eradicated in Rag2−/− Il2rg−/− mice. All Lin− Thy1.2+ cells from each skin layer displayed a typical lymphoid morphology with a high nucleus to cytoplasmic ratio (Figure 1B) and expressed IL-7Rα (Figure S1A), of which downstream signaling is critical for ILC development (Diefenbach et al., 2014). These data demonstrated that the Lin− Thy1.2+ cells were bona fide ILCs.
Figure 1. Compartmentalization of Skin ILCs with Distinct Transcriptome and Regulome Landscapes.

(A) Flow cytometry of live CD45+ cells from WT, Rag2−/−, and Rag2−/− Il2rg−/− mice. Proportions of Lin− Thy1.2+ ILCs are shown.
(B) Diff-Quik staining of sorted Lin− Thy1.2+ ILCs.
(C) Surface phenotype of skin ILCs in WT mice.
(D) Intracellular cytokine staining of PMA/Ionomycin-stimulated Lin− Thy1.2+ ILCs.
(E) PCA of RNA-seq transcriptome analysis of sorted skin ILCs.
(F) Heatmap showing differential expression of ILC2 and ILC3 signature genes by skin ILCs.
(G) Venn diagram showing percentages of ATAC peaks that were shared or distinct among skin ILCs.
(H) Heatmap displaying relative enrichment of transcription factor motifs in skin ILCs.
(A to D) Data are representative of more than three independent experiments with similar results. (E to H) Data were pooled from two to three independent experiments (n > 5 per experiment).
Distinct cell surface phenotypes were observed in ILCs of different compartments. In particular, ILCs in the epidermis and dermis could be distinguished from those in the subcutis by their expression of inducible T cell costimulator (ICOS) and lack of ILC2 markers KLRG1, IL-2Rα, and IL-33R (Klose and Artis, 2016), all of which were distinctively expressed on ILCs in subcutis (Figures 1C and S1A). Another ILC2 marker, Sca-1 (Moro et al., 2010), was uniformly expressed by ILCs in subcutis, but only a subset of dermal ILCs expressed this marker (Figure S1A). Epidermal ILCs were distinguishable from dermal ILCs by their high expression of Thy1.2 and their uniform expression of CD103, a binding partner of E-cadherin which promotes tissue-residency of immune cells (Figure S1A). In contrast to subsets of gut ILCs that regulate T cell responses against gut microbes (Hepworth et al., 2015), none of the skin ILC subsets clearly expressed MHC class II (Figure S1A).
ILC subsets are known for their signature cytokine production during execution of effector functions (Sonnenberg and Artis, 2015) (Klose and Artis, 2016). The majority of subcutaneous ILCs produced IL-5 and IL-13 upon PMA and ionomycin stimulation (Figure 1D). Taken together with their cell surface phenotype, subcutaneous ILCs were consistent with ILC2s. Dermal ILCs consisted of heterogeneous populations including IL-5-and IL-13-producing ILC2s and IL-17A-producing ILC3s. Interestingly and in contrast to other skin ILC subsets, epidermal ILCs only minimally produced IL-5, IL-13, and IL-17A upon PMA and ionomycin stimulation (Figure 1D).
To better characterize skin ILC subsets, we performed RNA-sequencing (RNA-seq) on sorted Lin− Thy1.2+ ILCs from each skin compartment. Dermal ILCs that were discernible by the expression of CCR6 and Sca-1 were individually analyzed. Principal-component analysis revealed distinct tissue-specific signatures among skin ILCs (Figure 1E) with 3,078 differentially expressed genes (DEG; fold change > 2 and p-value < 0.05). Unsupervised hierarchical clustering of DEGs revealed that epidermal and subcutaneous ILCs were most distant and that CCR6+ and Sca-1+ dermal ILCs shared features with epidermal and subcutaneous ILCs, respectively (Figure 1F and Figure S1B). Consistent with their cytokine profiles (Figure 1D), subcutaneous ILCs were highly enriched in ILC2-signature genes (Gury-BenAri et al., 2016) (Figure 1F). While epidermal ILCs exhibited gene expression profiles that suggested an ILC3 signature, which included they key transcription factor Rorc (Gury-BenAri et al., 2016), they also expressed genes that have been associated with ILC2s, such as Il2, Hlf, and Il13 (Figure 1F). None of the skin ILCs expressed NK cell- and ILC1-related genes such as Tbx21, Eomes, Ifng, and Il15ra (data not shown). Collectively, in contrast to the typical ILC2 signature in subcutis ILCs, epidermal ILCs exhibited an ILC3 signature with skin-specific transcriptome features.
Chromatin accessibility reveals transcriptional programs that are more stable over time and thus reflects developmental and functional constraints (Shih et al., 2016). We therefore analyzed skin ILC via Assay for Transposase-Accessible Chromatin with high-throughput sequencing (ATAC-seq) to gain more insight into regulatory elements that shape skin ILC identities. ATAC-seq revealed distinct and similar patterns among skin ILCs subsets (Figure 1G, Figure S1C). Among 20,869 accessible regulatory elements in total, approximately 40% of the accessible regions were common to all skin ILC subsets, suggesting that core regulatory machinery is conserved among skin ILCs (Figure 1G). The remaining 60% of the regions were either unique to, or overlapped between, certain subsets of ILCs. We further investigated enrichment of transcription factor motifs in regulatory elements and identified distinct motif signatures, which included enrichment of ILC2- and ILC3-defined transcription factors, as well as previously reported ILC signature-motifs (Shih et al., 2016). Transcription factor motifs that have been associated with an ILC2 signature were enriched in subcutaneous ILCs. In contrast, enrichment of ILC3-signature motifs including RORγt, Tcf3, and Tcf4 were prominent in epidermal ILCs (Figure 1H).
Single-Cell RNA-Sequencing Reveals a Comprehensive Catalogue of Skin ILC Subsets
To explore the heterogeneity of skin ILCs, we sorted Lin− Thy1.2+ ILCs from each skin layer and performed single-cell RNA-seq (Figure 2A). We analyzed 3,431; 3,356; and 1,061 ILCs from epidermis, dermis, and subcutis, respectively. Unsupervised clustering of the combined dataset performed in Seurat identified 6 distinct ILC clusters (Figure 2B). ILCs from each skin layer segregated (Figure 2B), further highlighting layer-specific transcriptomic profiles of ILCs. In contrast to the uniformity of subcutaneous ILCs, epidermal and dermal ILCs each formed two clusters (Figure 2B). Gata3 and Rora, key transcription factors for ILC2, were highly expressed by dermal and subcutaneous ILC clusters 3 and 5, respectively (Figure 2C). Cells expressing Rorc were enriched in epidermal ILC clusters. Tbx21, a transcription factor expressed by ILC1, was undetected.
Figure 2. Single-cell RNA-Sequencing Reveals Layer-Specific Heterogeneity of Skin ILC Subsets.

(A) Workflow of single-cell RNA-seq.
(B) Unsupervised clustering of skin ILC subsets that were sorted from epidermis, dermis, and subcutis (left) and proportions of cell origin among clusters (right).
(C) Expression of transcription factors in tSNE plots.
(D) Unsupervised heatmap showing expression of the top 10 DEGs per clusters.
(E) Metascape analysis of upregulated genes in cluster 2 and 4.
(F) Expression of cytokine receptor mRNA in tSNE plots.
(G) Cell numbers of ILCs that were treated with indicated cytokines for 2 days.
(A to G) Data are representative of more than two independent experiments. (G) The data are shown as mean ± SD. Student’s t-test was used to measure significance. *p < 0.05, **p < 0.01 and ***p < 0.001.
An unsupervised heatmap revealed signature genes in individual clusters (Figure 2D). Subcutaneous ILC cluster 5 showed ILC2 transcriptome identities, represented by the expression of Il5, Il1rl1, Arg1, and others. DEGs were observed between dermal ILC clusters 3 and 4, and Metascape analysis identified pathways involved in regulation of protein phosphorylation, hemopoiesis, and cell death in dermal ILC cluster 4, suggesting that expression of genes underlying distinct cellular activities delineated it from cluster 3 (Figure 2E). Both epidermal ILC clusters 1 and 2 expressed high levels of Ptprcap, Ctsw, Lck, Capg, Ly6g5b, Ccr6, and Itgae. Epidermal ILC cluster 2, in comparison to cluster 1, was characterized by the higher expression of Cd70, Ltb, Bcl2a1d, Cd83, Tff1, and Ramp1. Epidermal ILC cluster 2 displayed enrichment of pathways involved in cytokine production, cytokine receptor interaction, and cytokine signaling, suggesting differential activation states between the two epidermal ILC clusters (Figure 2E).
ILCs respond to various tissue-derived signals. To identify cytokines that activate skin ILCs, we examined mRNA expression of cytokine receptors that have been reported to be expressed by ILCs. We found layer specific patterns of receptor expression. As expected for an ILC2 subset, Il1rl1 (encoding an IL-33 receptor subunit) and Il2ra were expressed by subcutaneous ILCs (Figure 2F). In contrast, epidermal and dermal ILCs highly expressed Il18r1, consistent with a recent finding (Ricardo-Gonzalez et al., 2018). While Il17rb (encoding IL-25R) expression was enriched in epidermal and dermal ILC clusters, all skin ILCs expressed Crlf2 (encoding the TSLP receptor subunit) and Tnfrsf25 (encoding DR3). Il23r and Il1r1 (encoding IL-1R subunit) were minimally expressed. Consistent with their receptor expression profiles, epidermal and dermal ILCs proliferated in vitro in the presence of IL-18, while IL-33 promoted the proliferation of subcutaneous ILCs (Figure 2G). Collectively, these results establish that distinct tissue-derived signals differentially drove skin ILC proliferation and that skin ILCs exhibited unique transcriptome and regulome landscapes with a high degree of compartmentalization and layer-specific identities.
ILCs in Skin Require GATA3 and RORγt to Gain Effector Functions
Differentiation and functions of ILCs are determined by the expression of lineage-specific transcription factors, including GATA3 for ILC2s and RORγt for ILC3s (Fang and Zhu, 2017). Flow cytometry confirmed the expression of GATA3 by subcutaneous ILCs and the co-expression of RORγt and GATA3 by epidermal ILCs (Figure S1A). The fate-mapping of Rorc-expressing cells demonstrated that, in spite of Gata3 expression, epidermal ILC were distinct from subcutaneous ILC2s and was more related to the RORγt+ ILC3 lineage (Figure S2B). Consistently, induced ablation of Gata3 in Gata3fl/fl Cre-ERT2 mice (Yagi et al., 2014) resulted in the eradication of subcutaneous ILCs, whereas the numbers of ILCs in the epidermis and dermis were unaffected (Figure S2C).
To determine if GATA3 was required for skin ILCs to gain effector functions, we utilized a skin inflammation model, in which topical application of the vitamin D3 analog, MC903 (calcipotriol), induces atopic dermatitis (AD)-like skin inflammation with expansion of skin ILCs (Kim et al., 2013) (Salimi et al., 2013). In contrast to increases of all skin ILCs after MC903 application in control mice, ILCs failed to expand in GATA3-depleted mice (Figure S2D). Moreover, all skin ILCs exhibited impaired IL-13 and IL-17A production in GATA3-depleted mice, resulting in attenuated skin inflammation (Figures S2E and S2F). These data indicated that GATA3 was required for triggering effector programs in skin ILCs under inflammatory conditions, in line with the current understanding that GATA3 regulates the maintenance and functions of ILC3s (Zhong et al., 2016).
We further examined RORγt-deficient mice (RorcGFP/GFP). Despite the expression of RORγt and other ILC3-related transcriptomic features, the numbers of ILCs in the epidermis and dermis was unaffected (Figure S2G). IL-17A production by epidermal and dermal ILCs was impaired, and skin inflammation was reduced in MC903-treated RorcGFP/GFP mice (Figures S2H and S2I). These results indicated that RORγt was dispensable for the development of epidermal ILCs during steady state but was required to gain effector functions during inflammation. Taken together, GATA3 and RORγt differentially contributed to the homeostatic maintenance of ILCs and drove effector programs that mediated AD-like skin inflammation.
Skin ILCs Are Tissue-Resident during Steady State and Inflammation
It has become clear over recent years that resident immune cells in different organs play crucial roles in host-protective immunity and in immune-mediated diseases. While ILCs in the gut and lung are reported to be tissue-resident (Gasteiger et al., 2015) (Moro et al., 2016), whether skin ILCs are tissue-resident and whether they retain tissue residency under inflammation has yet to be determined.
To first study the persistence of skin ILCs, we generated doxycycline-inducible GFP mice (H2B-GFP;R26-M2rtTA). Like αβ T cells, over 60% of skin ILCs lost GFP expression 8 weeks after induction, while the majority of epidermal γδ T cells retained GFP (Figures 3A and S3), demonstrating distinctive turnover rates among skin lymphoid subsets. We also assessed cell proliferation by treating wild-type mice with Bromodeoxyuridine (BrdU) for 7 days. Negligible numbers of γδ T cells were labeled with BrdU after 7 days, while 2%–4% of ILCs incorporated BrdU (Figure 3B). Collectively, these results demonstrated a fast turnover of ILCs relative to epidermal γδ T cells.
Figure 3. Skin ILCs Are Tissue-Resident during Steady State and Inflammation.

(A) Percentage of GFP+ cells from H2B-GFP;R26-M2rtTA mice that were treated with doxycycline for 6 days to induce GFP expression. GFP+ cells were detected by flow cytometry at indicated time points.
(B) Percentage of BrdU+ cells from WT mice that were treated with BrdU for 7 days. BrdU+ cells were detected by flow cytometry on day 8.
(C) Percentage of CD45.1+ (donor) and CD45.2+ (host) cells from bone marrow chimeric mice. CD45.1+ bone marrow cells were transferred into lethally irradiated CD45.2+ mice. Chimerism was analyzed by flow cytometry 8 weeks after bone marrow transplantation.
(D and E) Percentage of host-derived cells from skin and peripheral blood of parabiotic mice, wherein CD45.1+ and CD45.2+ congenic mice were surgically connected. Chimerism was analyzed by flow cytometry 8 weeks after surgery. (E) Both parabiotic partners were treated with MC903 every other day for 12 days.
(A to E) The data are shown as mean ± SD and were pooled from more than two independent experiments (n = 3 to 4 per experiment). Each dot represents an individual mouse. ANOVA with Tukey’s multiple comparison test was used to measure significance. *p < 0.05, **p < 0.01 and ***p < 0.001.
Further highlighting distinct properties of skin lymphoid subsets, γδ T cells were highly radio-resistant in bone marrow chimeric mice that were transplanted with congenic bone marrow (CD45.1 → CD45.2), whereas the majority of ILCs were replaced by donor-bone marrow (Figure 3C). To determine if ILCs were maintained locally in skin, we generated parabiotic mice, wherein CD45.1+ and CD45.2+ congenic mice were surgically connected to share blood circulation. We found over 90% of ILCs in all three skin layers to be of host origin, whereas approximately 40% of αβ T cells in skin were replenished by donor-derived cells (Figure 3D), indicating that the vast majority of ILCs were locally maintained in skin during steady state, independent of circulating precursors. To further test whether tissue-residency was maintained under inflammation, we treated parabiotic mice with MC903. While a minor contribution of donor-derived cells (<5%) was detected in the expanded ILCs, the majority of expanded ILCs during inflammation remained of host origin in all skin layers (Figure 3E). These data established that expansion of ILCs was supported by local proliferation of resident ILCs, with only a minor contribution of circulating or bone marrow-derived progenitors. Thus, skin ILCs are bona fide tissue-resident immune cells under steady-state and inflammatory conditions.
Epidermis-Derived Factors Govern Development and Localization of Epidermal ILCs
Residency of immune cells is likely mediated by mutual stroma-immune crosstalk, which may involve distinct tissue-specific mechanisms. In skin, resident immune cells, such as Langerhans cells and αβ memory T cells, rely on hair follicle-derived chemokines and cytokines to maintain their residency (Nagao et al., 2012) (Adachi et al., 2015). We have previously shown that IL-7, the predominant source of which in epidermis is hair follicle keratinocytes, is required for memory T cell residency in the epidermis (Adachi et al., 2015). Consistent with ILC subsets in other organs, skin-resident ILCs expressed IL-7Rα (Figure S1A). To definitively determine skin ILCs’ reliance on IL-7 receptor signaling, we first analyzed Il7r−/− mice. The complete absence of ILCs in all 3 layers of skin in Il7r−/− mice indicated that IL-7Rα was crucial for skin ILC (Figure 4A). Surprisingly, however, analysis in Il7−/− mice revealed disparate dependency of skin ILCs on IL-7. Whereas subcutaneous ILCs were completely eradicated, ILCs in epidermis and dermis were only modestly reduced in total numbers (Figure 4A). Therefore, epidermal and dermal ILC relied on IL-7Rα, but not completely on IL-7, suggesting that another epithelium-derived cytokine that binds to IL-7Rα was involved in supporting tissue-residency of epidermal and dermal ILCs.
Figure 4. Epidermis-Derived Factors Govern Tissue Residency and Localization of ILCs.

(A) Flow cytometry of live CD45+ cells. Frequencies of Lin− Thy1.2+ ILCs are shown. Lower panels show quantification of ILCs from each layer.
(B) Flow cytometry of live CD45+ cells. Proportions of Lin− Thy1.2+ ILCs are shown. Lower panels show quantification of ILCs from each layer.
(C) Immunofluorescence microscopy of Thy1.2+ ILCs in an epidermal sheet from Rag2−/− mice. HF: hair follicle and SG: sebaceous gland. Scale bars = 25 μm.
(D) Heatmap of selected chemokine receptors from RNA-seq analysis of sorted ILCs.
(E) Flow cytometry analysis for cell-surface expression of CCR6 on skin ILCs.
(F) Flow cytometry of live CD45+ cells. Right panels show quantification of skin ILCs.
(A, B, E, and F) Data are representative of more than two independent experiments with similar results. (A, B, and F) Data are shown as mean ± SD and were pooled from more than two independent experiments (n = 3 to 4 per experiment). Each dot represents an individual mouse. ANOVA with Tukey’s multiple comparison test or Student’s t test was used to measure significance. *p < 0.05, **p < 0.01 and ***p < 0.001. (D) Data were pooled from two to three independent experiments (n > 5 per experiment).
IL-7 receptor α chain heterodimerizes with IL-2 receptor gamma chain to form the IL-7 receptor (Noguchi et al., 1993). It also forms a heterodimer with the thymic stromal lymphopoietin (TSLP) receptor chain to constitute the functional TSLP receptor (Leonard, 2002). TSLP is mainly produced from epithelial cells and acts as an alarmin to elicit ILC activation (Kim et al., 2013). Although TSLP has been studied in the context of ILC-mediated inflammation (Kim et al., 2013), its contribution to homeostatic maintenance of ILCs remains unknown. Flow cytometry analysis revealed that TSLPR was expressed at the protein level by epidermal and dermal ILCs (Figure S4A). To examine the requirement for TSLP by ILCs, we analyzed TSLP-deficient (Suto et al., 2018) and TSLPR-deficient (Al-Shami et al., 2004) mice. Interestingly, both Tslp−/− and Tslpr−/− mice exhibited significant but incomplete reduction of ILCs in epidermis and dermis, while those in subcutis were unaffected (Figure 4B). Simultaneous deletion of IL-7 and TSLP in Il7−/−Tslp−/− mice resulted in complete loss of epidermal and dermal ILCs (Figure 4B). Importantly, Il7−/−Tslp−/− mice lacked ILC2 precursors but common ILC precursors existed in the bone marrow (Figure S4B), suggesting that the reduction of epidermal and dermal ILCs in Tslp−/− and Il7−/−Tslp−/− mice was not due to the loss of ILC precursors. In aggregate, these results indicated that the persistence of skin ILC subsets was governed by IL-7 and TSLP. Interestingly, the analysis of ILC2 and ILC3 in the lung and gut demonstrated their differential dependency on IL-7 and TSLP (Figure S4C), highlighting the importance of tissue-derived cytokines for ILC residency beyond skin.
Given our previous finding that IL-7 is produced by keratinocytes in the upper hair follicles (Adachi et al., 2015), we hypothesized that epidermal ILCs might associate with hair follicles. We stained epidermal sheets prepared from tail skin of lymphocyte-deficient Rag2−/− mice with anti-Thy1.2 antibody, which revealed clusters of Thy1.2+ cells in the upper region of hair follicles (Figure 4C). Staining in WT mice revealed that ILCs were particularly in closer proximity to sebaceous glands when compared to γδ T cells and αβ T cells, which were distributed throughout the interfollicular epidermis and hair follicles (Figures 4C and S4D).
The specific localization of epidermal ILCs prompted us to investigate what tissue-derived signals mediated their positioning. RNA-seq analysis of sorted ILCs revealed distinct expression patterns of chemokine receptors among skin ILC subsets (Figure 4D). High expression of Ccr6 in epidermal ILCs was particularly interesting because of our previous observation that CCL20, the sole ligand of CCR6 identified thus far, was expressed in keratinocytes in the upper region of hair follicles (Nagao et al., 2012), coinciding with epidermal ILC localization (Figures 4C and S4D). Flow cytometry analysis confirmed that CCR6 was uniformly expressed by epidermal ILCs and by a subset of dermal ILCs (Figure 4E). CCR6-deficiency (Ccr6GFP/GFP mice) selectively reduced the number of epidermal ILCs (Figure 4F), indicating that hair follicle localization of ILCs was mediated through the CCL20-CCR6 circuitry. Collectively, these data emphasize the importance of epithelium-derived signals in supporting the residency of epidermal ILCs via cytokines IL-7 and TSLP and localization via CCR6-mediated signaling.
ILCs Negatively Regulate Sebaceous Gland Function
Epidermal ILCs’ proximity to sebaceous glands prompted us to investigate whether they may be functionally involved in the regulation of folliculo-sebaceous units. We conducted histological examinations on flank skin sections from WT, Rag2−/−, and Rag2−/− Il2rg−/− mice. Strikingly, morphological alteration of sebaceous glands was evident in Rag2−/− Il2rg−/− mice (Figure 5A, upper panels). Observation of sebaceous glands visualized by Oil-red-O staining in tail epidermal sheets of WT and Rag2−/− mice generally revealed two symmetric oval lobes of sebaceous glands in each hair follicle (Figure 5A, lower panels). By contrast, sebaceous glands in Rag2−/− Il2rg−/− mice were enlarged, irregularly shaped, and multi-lobulated (Figures 5A to 5D). Sebaceous gland morphology was comparable between 2-week-old WT, Rag2−/−, and Rag2−/− Il2rg−/− mice, but alterations became evident at 5 weeks after birth, as determined by sebaceous gland sizes, in which differences were established in 8-week-old Rag2−/− Il2rg−/− mice (Figures 5B and S5A), indicating that the morphological alterations occurred postnatally and were not due to developmental defects. The modest enlargement of sebaceous glands observed in Rag2−/− mice (Figure 5B), which became evident only after unbiased quantification, suggested a minor contribution of lymphocytes. However, absence of lymphocytes did not lead to strikingly hyperplastic and multilobulated sebaceous glands as observed in Rag2−/− Il2rg−/− mice (Figures 5A to 5D), indicating that ILCs were the primary regulators of sebaceous glands.
Figure 5. Skin ILCs Negatively Regulate Sebaceous Gland Size.

(A) Morphology of sebaceous glands in H&E staining of skin sections from the flank (upper panels) and Oil-red-O staining of tail epidermal sheets (lower panels).
(B–D) Sebaceous glands in tail epidermis were analyzed for (B) their sizes as determined by surface area, (C) percentage of sebaceous glands with indicated numbers of lobules, (D) and percentage of sebaceous glands with sizes above 100 μm in longitudinal diameter.
(E) Immunofluorescence microscopy images of tail epidermal sheets stained for LRIG1 (sebocyte precursors) and MGST1 (mature sebocytes). Right panels show quantification of LRIG1+ and MGST1+ area/hair follicle, respectively. Each dot on the graphs represents an individual hair follicle.
(F) Quantification of LRIG1+ BrdU+ cells by flow cytometry 2 days after in vivo treatment of BrdU.
(G) Images of Oil-red-O staining in tail epidermal sheets and quantification of sebaceous gland sizes.
(H) Flow cytometry of live CD45+ cells in epidermis (left panels) and quantification of sebaceous gland sizes (right panel) in Rag2−/− Il2rg−/− mice that received bone marrow from Rag2−/− or Rag2−/− Il2rg−/− mice.
(A, E, and G) Images are representative of more than two independent experiments with similar results. Scale bars = 50 μm. (B to H) Data are shown as mean ± SD and data were pooled from more than two independent experiments (n = 3 to 4 per experiment). ANOVA with Tukey’s multiple comparison test or Student’s t test was used to measure significance. *p < 0.05, **p < 0.01 and ***p < 0.001. (B, G and H) Each dot represents an individual sebaceous gland.
Sebaceous hyperplasia in Rag2−/− Il2rg−/− mice was associated with increased LRIG1+ compartments, where sebocyte progenitors reside (Page et al., 2013), with irregular expansion of MGST1+ mature sebocytes (Figure 5E). Whereas Ki-67+ proliferating sebocytes were regularly aligned at LRIG1+ junctional zone in the periphery of sebaceous glands in WT and Rag2−/− mice, the alignment of Ki-67+ LRIG1+ sebocytes in Rag2−/− Il2rg−/− mice was disrupted (Figure S5B). In vivo BrdU incorporation revealed increased numbers of BrdU-labeled LRIG1+ cells in Rag2−/− Il2rg−/− mice (Figure 5F), demonstrating that increased proliferation of sebocyte progenitors accounted for sebaceous hyperplasia in these mice.
Furthermore, we analyzed morphological changes of sebaceous glands in Il7−/− mice lacking subcutaneous ILCs, and Il7−/− Tslp−/− mice lacking all skin ILCs (Figures 4A and 4B). Sebaceous hyperplasia was evident in Il7−/− Tslp−/−, but not in Il7−/− mice (Figure 5G), indicating that the loss of epidermal and dermal ILCs was responsible for sebaceous hyperplasia. In contrast to Rag2−/− Il2rg−/− mice which were devoid of lymphoid lineages (Figure 1A), Il7−/− Tslp−/− mice harbored recently described Lin− CD2+ epidermal lymphoid cells (Almeida et al., 2015) (Figure S5C), further solidifying that the sebaceous gland phenotype that we observed is specific to the loss of ILCs. Importantly, adoptive transfer of Rag2−/− mouse bone marrow into Rag2−/− Il2rg−/− mice led to the reconstitution of skin ILCs and rescued the sebaceous hyperplasia phenotype in recipient mice (Figure 5H). Thus, epidermal and dermal ILCs negatively regulate sebaceous glands under homeostatic conditions.
TNF/Lymphotoxins Mediate Inhibition of Sebocyte Proliferation via Downregulation of Notch Signaling
ILCs promote functions of hematopoietic and non-hematopoietic cells by producing various effector molecules such as cytokines and growth factors (Sonnenberg and Artis, 2015). We postulated that effector molecules that are produced from skin ILCs have negative effects on sebocyte proliferation and differentiation. To determine this, we cultured a human sebocyte cell line (SEB-1) with recombinant proteins of transcripts which were differentially expressed by epidermal and dermal ILCs (Figure 1F). Interestingly, the growth and proliferation of sebocytes were inhibited by TNF receptor ligands, TNF, and lymphotoxin (LT) α3, a soluble form of lymphotoxin, as well as LTα1β2, a membrane-bound form of lymphotoxin that binds to lymphotoxin receptors (Figures 6A and S6A). The inhibitory effects of TNF and lymphotoxins on sebocyte proliferation were dose-dependent (Figure S6B). The expression of TNF and lymphotoxins in epidermal and dermal ILCs was verified by single-cell RNA-seq analysis and the production of TNF was validated by flow cytometry (Figure S6C). These data supported that ILCs negatively regulated sebocyte growth via the production of TNF and lymphotoxins.
Figure 6. Inhibition of Sebocyte Proliferation via a TNF/Lymphotoxin–Notch Signaling Pathway.

(A) Cell numbers of a human sebocyte cell line (SEB-1) that were cultured with indicated recombinant proteins for 3 days.
(B) Heatmap showing differential gene expression of SEB-1 cells cultured with indicated recombinant proteins for 3 days. Gene expression was analyzed by Nanostring assay and genes were filtered by adjusted p values with FDR < 0.05.
(C) Volcano plot of differential expression of TNF-treated SEB-1 cells. Positive log2-fold changes show upregulated genes and negative log2-fold changes show downregulated genes as compared to untreated control.
(D) Fold changes of top 10 downregulated genes in SEB-1 cells cultured with indicated recombinant proteins. Genes with fold changes less than −5 and p value less than 10−4 in (C) are highlighted.
(E) siRNA knockdown of indicated genes in SEB-1 cells. The number of cells from the 2nd passage is shown.
(F) The numbers of SEB-1 cells that were cultured with TNF and JAG2.
(G) Representative images of H&E staining of skin sections (left panels, dashed lines demarcate sebaceous glands) from indicated strains of mice and quantification of sebaceous gland sizes (right panel). Scale bar = 50 μm.
(A, E, F, and G) The data are shown as mean ± SD and data were pooled from more than two independent experiments (n = 3 to 4 per experiment). ANOVA with Tukey’s multiple comparison test was used to measure significance. *p < 0.05, **p < 0.01 and ***p < 0.001. Each dot represents an individual well of in vitro experiments (A, E and F) or a sebaceous gland (G). (B to D) Data are representatives of more than two independent experiments (n = 3 per experiment).
To determine downstream pathways that are regulated by TNF/lymphotoxins during sebocyte proliferation, we exposed cultured human sebocytes to recombinant TNF, LTα3, and LTα1β2 and performed multiplex gene expression analysis via Nanostring assay. TNF and lymphotoxins regulated overlapping sets of genes in human sebocytes (Figures 6B to 6D). In line with the potent inhibitory effects on sebocyte growth (Figures 6A and S6B), the most striking changes in gene expression were observed in TNF-treated sebocytes (Figure 6B). TNF downregulated the expression of genes encoding transcription factors (ID1, ID2, CEBPA, and PBX1) and cell surface molecules (JAG2 and IL7R) (Figure 6C).
We hypothesized that TNF and lymphotoxins mediated down-regulation of signaling pathways that were essential for sebocyte proliferation. To test this hypothesis, we conducted siRNA knockdown for the six most downregulated genes that were induced by TNF (fold change < −5, p-value < 1 × 10⁻⁴). Importantly, downregulation of these genes also occurred in LTα3- and LTα1β2-treated sebocytes (Figure 6D). Inhibition of sebocyte growth was observed by siRNA knockdown of JAG2, a ligand of Notch signaling, and PBX1, a direct Notch-regulated transcription factor, but not other genes (Figures 6E and S6D), suggesting that anti-proliferative effects of TNF/lymphotoxin on sebocytes are mediated by repression of Notch signaling. Indeed, TNF-induced inhibition of sebocyte growth was partially rescued by the addition of recombinant human JAG2 protein (Figure 6F).
To validate our findings in vivo, we analyzed sebaceous gland sizes in skin sections from Tnf−/−, Lta−/−, and Ltb−/− single knockout, as well as triple knockout (Tnf−/− Lta−/− Ltb−/−) mice. While no remarkable changes were observed in the sebaceous glands of single knockout mice, they were hyperplastic in the triple knockout mice (Figure 6G). Analysis of mice in which impairment of Notch signaling can be induced in hair follicle constituents (Krt15-CrePR1 × Adam10fl/fl) revealed marked hypoplasia of sebaceous glands (Figure S6E), further highlighting the importance of Notch signaling in sebaceous gland homeostasis. Collectively, these data revealed that TNF and lymphotoxins, which the epidermal and a subset of dermal ILCs predominantly express, negatively regulated proliferation of sebocytes via modulation of Notch signaling pathways and that this axis was operational in vivo.
ILCs and Lymphocytes Differentially Impact the Skin Microbiota
Sebaceous glands secrete sebum, a complex mixture of lipids that coats the skin surface of mammalian bodies. While the putative function of sebum remains enigmatic, it has been suggested that sebaceous lipids have antibacterial effects and can also be a source of nutrients for commensal bacteria (Chen et al., 2018; Smith and Thiboutot, 2008). Increases in Oil-red-O+ and MGST1+ sebocytes in Rag2−/− Il2rg−/− mice (Figures 5A and 5E) suggested an excess production of sebum. Indeed, staining for lipids in frozen skin sections revealed an increase of skin surface lipids in Rag2−/− Il2rg−/− mice as compared to WT and Rag2−/− mice (Figure 7A), demonstrating that sebaceous hyperplasia, which resulted from loss of skin ILCs, led to a sebum-rich skin-surface environment. Therefore, we sought to investigate whether the absence of ILCs and subsequent alteration of skin lipids have negative effects on the balance of skin bacterial communities.
Figure 7. Lymphocytes and ILCs Differentially Regulate the Skin Microbiota.

(A) Representative immunofluorescence images (left panels) and quantifications on the intensity and thickness (right panels) of lipid staining in frozen skin sections.
(B and C) PCoA (B) and relative abundance of major taxa (C) based on 16S rRNA sequencing analysis of skin swab samples from indicated mouse strains.
(D) Experimental scheme of co-housing experiments. Duration of co-housing and separation and the timing of microbiome sampling are depicted.
(E and F) Principal coordinates analysis (E) and relative abundance of major taxa (F) based on 16S rRNA sequencing analysis of skin swab samples before, 2 weeks after co-housing and 2 weeks after separation.
(G) LC-MS analysis of mouse skin surface free fatty acids.
(H) Measurement of bacterial growth inhibition by free fatty acids. S: Staphylococcus, B: Bacteroides.
(B, C, E, and F) Data are representatives of more than two independent experiments (n = 3 to 4 per experiment). (G and H) Data are shown as mean ± SD and data were pooled from more than two independent experiments (n = 3 to 4 per experiment). ANOVA with Tukey’s multiple comparison test was used to measure significance. *p < 0.05, **p < 0.01 and ***p < 0.001.
To investigate the global impact that lymphocytes and ILCs may have on skin microbiota, we performed skin microbiome analyses via bacterial 16S rRNA gene sequencing of WT, Rag2−/−, and Rag2−/− Il2rg−/− mice. Principal coordinates analysis (PCoA) suggested marked differences in the microbiomes of each group (Figure 7B; p < 0.05 by AMOVA test). Next, we sought to find altered microorganisms in Rag2−/− and Rag2−/− Il2rg−/− mice, using the linear discriminant analysis effect size (LEfSe) tool. Members of the Gram-positive class Bacilli, including the aerobic families Planococcacea and Staphylococcacea, were overrepresented in Rag2−/− mice (Figures 7C and S7A). In contrast, Bacilli were underrepresented in Rag2−/− Il2rg−/− mice, and Gram-negative anaerobic bacteria in the class Bacteroidales were overrepresented (Figures 7C and S7A). Restricted commensalism of Bacilli in Rag2−/− Il2rg−/− mice (Figure S7B) was in line with their resistance to S. aureus colonization (Figure S7C).
These data suggested that lymphocytes and ILCs differentially regulated the skin microbiota, but it was possible that these differences arose from the cage effect. To exclude this possibility, the skin microbiome was analyzed before and after co-housing; WT, Rag2−/−, and Rag2−/− Il2rg−/− mice were all co-housed in the same cage after weaning for 2 weeks and were then separated for another 2 weeks. Microbiome samples were taken at indicated time points (Figure 7D)
Consistent with the experiment in Figure 7B, PCoA demonstrated that baseline differences were established between genotypes (Figure 7E). Strikingly, however, after 2 weeks of co-housing, the microbiota of all genotypes converged, indicating that the skin microbiota was shared through direct contact (Figure 7E). Furthermore, divergence of the microbiome, highlighted by increased proportions of Bacilli in Rag2−/− mice and Bacteroidales in Rag2−/− Il2rg−/− mice, reemerged at 2 weeks after the separation, which definitively showed that the differences in microbiota were shaped by the absence of lymphocytes or ILCs (Figures 7E and 7F). Sebaceous hyperplasia was still observed in Rag2−/− Il2rg−/− mice at the time of microbial convergence and also in Rag2−/− Il2rg−/− mice that were treated for 8 weeks with antibiotics that have been previously used to target dysbiotic skin flora (Kobayashi et al., 2015) (Figures S7D and S7E) indicating that hyperplasia did not occur secondarily to skin microbial changes.
ILCs Restrict the Production of a Free Fatty Acid with Selective Antimicrobial Activity
To understand how the sebum-rich environment altered the composition of microbiota, we took a mass spectrometric approach. Skin-surface lipids were collected from WT, Rag2−/−, and Rag2−/− Il2rg−/− mice and quantitative analysis was performed for triglycerides and free fatty acids, the major components of sebaceous lipids (Smith and Thiboutot, 2008). Of all lipids that were analyzed, only palmitoleic acid and oleic acid were significantly increased in samples from Rag2−/− Il2rg−/− mice (Figures 7G and S7F). These unsaturated free fatty acids were of particular interest because both have been reported to possess antimicrobial activity (Smith and Thiboutot, 2008). Testing antimicrobial activities of these free fatty acids on several species of skin-associated Gram-positive aerobic and Gram-negative anaerobic bacteria revealed that palmitoleic acid, but not oleic acid, displayed robust, yet selective antimicrobial effects (Figure 7H). Palmitoleic acid significantly inhibited the growth of several species of Gram-positive aerobic cocci, such as S. aureus and S. xylosus, but neither inhibited nor enhanced the growths of Gram-negative anaerobic Bacteroides species. Taken together, palmitoleic acid exhibited selective antimicrobial activity against skin-associated Gram-positive cocci, namely Staphylococcus. This was consistent with the restricted commensalism of Gram-positive cocci in Rag2−/− Il2rg−/− mice (Figures S7B and S7C). Together with the excess lipids that may promote anaerobic conditions, an environment that disfavors the commensalism of Gram-positive cocci is established in the absence of ILCs in Rag2−/− Il2rg−/− mice.
Thus, during homeostasis, skin ILCs, primarily those in epidermis and in part in dermis, act on sebaceous glands through TNF/lymphotoxins and negatively regulate both the quantity and quality of sebum and enhance the commensalism of Gram-positive cocci. Since lymphocytes appear to negatively control Gram-positive cocci (Figures 7C, S7A, S7B and S7C), the function of ILCs reported herein may represent a counter-balancing mechanism that tunes microbial equilibrium on the skin surface.
DISCUSSION
Previous studies on the immunological functions of barrier systems have, for the most part, investigated infected or inflamed tissues, and much of what we know about the host-microbe interactions today is based on understanding of inflammatory responses against pathogens and during tissue repair. The mechanisms that constitutively maintain host-microbe mutualism under homeostatic conditions could be distinct from that of perturbed environments. Recent emerging evidence indicate that commensal bacteria modulate host immunity through intact or incompletely breached barriers (Belkaid and Tamoutounour, 2016), which further highlight the importance of understanding mechanisms involved in the homeostatic dialog between immune cells and epithelium that regulate microbial ecology on barrier surfaces. Studies in mice during steady state enabled us to identify unique epithelia-derived signals that supported skin ILC localization and residency, as well as a non-redundant function of skin ILCs that regulated commensal bacteria equilibrium.
Recent work has established that hair follicles not only form physical barriers by producing hair shafts but also mediate immune cell homeostasis by supporting the recruitment and residency of immune cells including Langerhans cells, effector memory, and regulatory T cells (Nagao et al., 2012) (Adachi et al., 2015) (Scharschmidt et al., 2017). These studies, together with the reliance of ILCs on hair follicles reported herein, suggest that hair follicles are central to tissue-immune crosstalk in skin, but this is not unidirectional; hair follicles in turn rely on monocytes for quorum sensing-mediated regeneration (Chen et al., 2015), on regulatory T cells for stem cell maintenance (Ali et al., 2017), and, as demonstrated in this study, on ILCs for sebaceous gland control.
Notch signaling is one of the essential canonical pathways in epithelial differentiation, including formation of hair follicles and sebaceous glands (Watt et al., 2008). We found that TNF receptor ligands expressed by skin ILCs suppressed sebocyte expression of JAG2, a Notch ligand. TNF-mediated suppression of sebocyte proliferation in vitro was, in part, rescued by recombinant JAG2. Thus, it appears that ILCs constitutively mediate the regulation of sebaceous glands via a TNF/lymphotoxins - Notch signaling pathway. Skin resident-regulatory T cells produce another Notch ligand, JAG1, to facilitate hair follicle stem cell differentiation (Ali et al., 2017), emphasizing the complexity of tissue-immune crosstalk that involves hair follicles. Thus, the dialog between hair follicles and immune cells is crucial for the homeostatic maintenance of immunological and structural functions of the skin.
Sebaceous glands secrete various lipids, free fatty acids, and antimicrobial peptides, all of which potentially modulate the growth of, and have different effects on, various types of bacteria (Nakatsuji and Gallo, 2012; Smith and Thiboutot, 2008). The invagination of hair follicles in skin also creates a unique anaerobic, lipid-rich environment that provides a microbial niche (Puhvel et al., 1975). The finding that the production of a free-fatty acid component of sebum with antimicrobial property, palmitoleic acid, is regulated by ILCs provides an opportunity to further dissect how the host immune system helps form a symbiotic relationship with the commensal bacteria and how it may be disrupted in disease. Whereas mechanisms involved in lymphocyte-mediated commensal microbe regulation is incompletely understood, the opposing effects of lymphocytes and skin ILCs on the skin microbiota suggest that microbial equilibrium is, at least in part, mediated by these lymphoid subsets. This warrants further investigation on microbiota- and host-driven cues that regulate the balance.
In conclusion, ILCs regulated commensal bacteria through mutual crosstalk with hair follicles and sebaceous glands, thereby representing tissue-immune crosstalk unique to skin. Our study supports that ILC functions have diverged from adaptive immunity as both systems evolved and that subsets of ILCs have become more specialized in tuning host-microbe interfaces that ultimately ensure efficient barrier immunity (Vivier et al., 2016). Further exploration of tissue-specific roles of ILCs and their alliance with epithelia or stroma should facilitate our understanding of the sophisticated nature of host-microbe symbiosis.
STAR★METHODS
CONTACT FOR REAGENT AND RESOURCE SHARING
Further information and requests for resources and reagents should be directed to, and will be fulfilled by, the Lead Contact, Keisuke Nagao (keisuke.nagao@nih.gov).
EXPERIMENTAL MODELS AND SUBJECT DETAILS
Experimental Animals
Mice were bred and/or maintained in the NCI specific pathogen-free facility in accordance with the Guide for the Care and Use of Laboratory Animals. All experiments were performed at the NCI under an animal study proposal approved by the NCI Animal Care and Use Committee. Sex- and age-matched mice between 7 and 12 weeks of age were used for each experiment. The mice were purchased from The Jackson Laboratory or provided by other sources as detailed in the Key Resources Table. tetOH2B-GFP mice were cross-bred with R26-M2rtTA mice to obtain heterozygous tetO-H2B-GFP;R26-M2rtTA mice. Il7−/− mice were kindly provided by Dr. Jung-Hyun Park (NCI/NIH). Il7−/− mice were crossed with Tslp−/− mice (Suto et al., 2018) to generate Il7−/− Tslp−/− mice. Gata3f/f mice were crossed with Cre-ERT2 mice to generate Gata3f/f Cre-ERT2 mice (Yagi et al., 2014).
KEY RESOURCES TABLE.
| REAGENT or RESOURCE | SOURCE | IDENTIFIER |
|---|---|---|
| Antibodies | ||
| LEAF Purified anti-mouse CD16/32 (93) | BioLegend | Cat# 101310 |
| PerCP/Cy5.5 anti-mouse CD3ε (145–2C11) | BioLegend | Cat# 100328 |
| PerCP/Cy5.5 anti-mouse CD5 (53–7.3) | BioLegend | Cat# 100624 |
| PerCP/Cy5.5 anti-mouse CD19 (6D5) | BioLegend | Cat# 115534 |
| PerCP/Cy5.5 anti-mouse CD11c (N418) | BioLegend | Cat# 117328 |
| PerCP/Cy5.5 anti-mouse/human CD11b (M1/70) | BioLegend | Cat# 101228 |
| PerCP/Cy5.5 anti-mouse FcεRIα (MAR-1) | BioLegend | Cat# 134320 |
| PerCP/Cy5.5 anti-mouse TCR γ/δ (GL3) | BioLegend | Cat# 118118 |
| PerCP/Cy5.5 anti-mouse TCR β chain (H57–597) | BioLegend | Cat# 109228 |
| PerCP/Cy5.5 anti-mouse NK-1.1 (PK-36) | BioLegend | Cat# 108728 |
| PerCP/Cy5.5 anti-mouse/human CD45R/B220 (RA3–6B2) | BioLegend | Cat# 103236 |
| PerCP/Cy5.5 anti-mouse CD2 (RM2–5) | BioLegend | Cat# 100116 |
| APC anti-mouse/human KLRG1 (2F1/KLRG1) | BioLegend | Cat# 138412 |
| APC/Cy7 anti-human/mouse/rat CD278 (ICOS) (C398.4A) | BioLegend | Cat# 313529 |
| BUV395 Rat Anti-Mouse CD45 (30-F11) | BD | Cat# 564279 |
| PE/Cy7 anti-mouse CD90.2 (Thy-1.2) (53–2.1) | BioLegend | Cat# 140309 |
| Brilliant Violet 421 anti-mouse CD45 Antibody (30-F11) | BioLegend | Cat# 103134 |
| BUV395 Rat Anti-Mouse CD25 (PC61) | BD | Cat# 564022 |
| Brilliant Violet 650 anti-mouse CD45 (30-F11) | BioLegend | Cat# 103151 |
| Brilliant Violet 650 anti-mouse CD45.1 (A20) | BioLegend | Cat# 110736 |
| BUV395 Mouse Anti-Mouse CD45.2 (104) | BD | Cat# 564616 |
| BUV395 Rat Anti-Mouse CD90.2 (53–2.1) | BD | Cat# 565257 |
| Brilliant Violet 421 anti-human/mouse/rat CD278 (ICOS) (C398.4A) | BioLegend | Cat# 313524 |
| PE-eFluor 610 IL-13 Monoclonal Antibody (eBio13A) | eBioscience | Cat# 61–7133-82 |
| Brilliant Violet 650 anti-mouse IL-17A (TC11–18H10.1) | BioLegend | Cat# 506929 |
| APC anti-mouse I-A/I-E (M5/114.15.2) | BioLegend | Cat# 107614 |
| PE Rat Anti-Mouse CD103 (M290) | BD | Cat# 557495 |
| PE/Cy7 anti-mouse CD2 (RM2–5) | BioLegend | Cat# 100114 |
| Alexa Fluor 488 Gata-3 Monoclonal Antibody (TWAJ) | eBioscience | Cat# 53–9966-42 |
| FITC anti-mouse IL-17A (TC11–18H10.1) | BioLegend | Cat# 506908 |
| ROR gamma (t) Monoclonal Antibody (B2D) | eBioscience | Cat# 61–6981-82 |
| PE IL-5 Monoclonal Antibody (TRFK5) | eBioscience | Cat# 12–7052-82 |
| PE anti-mouse CD196 (CCR6) (29–2L17) | BioLegend | Cat# 129804 |
| PE T1/ST2 (IL-33 R) Monoclonal Antibody | MD Biosciences | Cat# 101001PE |
| PE anti-mouse Ly-6A/E (Sca-1) (E13–161.7) | BioLegend | Cat# 122508 |
| APC/Cy7 anti-mouse Ly-6A/E (Sca-1) (D7) | BioLegend | Cat# 108126 |
| PE/Cy7 anti-mouse CD127 (IL-7Rα) (A7R34) | BioLegend | Cat# 135014 |
| Brilliant Violet 421 anti-mouse TNF-α | BioLegend | Cat# 506327 |
| Mouse TSLP R Fluorescein-conjugated Antibody | R&D | Cat# FAB5461F |
| Goat anti-mouse LRIG1 | R&D | Cat# AF3688 |
| Rabbit anti-mouse/human MGST-1 (EPR7934) | Abcam | Cat# ab131059 |
| Alexa Fluor 647 anti-mouse/human Ki-67 (11F6) | BioLegend | Cat# 151206 |
| Alexa Fluor 488 Donkey anti-goat IgG(H+L) | Thermo Fisher Scientific | Cat# A-11055 |
| Alexa Fluor 568 Donkey anti-rabbit IgG(H+L) | Thermo Fisher Scientific | Cat# A-10041 |
| Bacterial and Virus Strains | ||
| Staphylococcus aureus (SAAS9) | Isolated from mouse skin (Kobayashi et al., 2015) | N/A |
| Staphylococcus hominis | Isolated from human skin | N/A |
| Staphylococcus schleiferi | Isolated from human skin | N/A |
| Staphylococcus xylosus | Isolated from mouse skin | N/A |
| Staphylococcus warneri | Isolated from human skin | N/A |
| Staphylococcus capitis | Isolated from human skin | N/A |
| Bacillus megaterium | Isolated from human skin | N/A |
| Streptococcus sp. | Isolated from human skin | N/A |
| Bacteroides vulgatus | ATCC | Cat# 8482 |
| Bacteroides fragillis | ATCC | Cat# 25285 |
| Bacteroides ovatus | ATCC | Cat# 8483 |
| Chemicals, Peptides, and Recombinant Proteins | ||
| Trypsin-EDTA (0.05%) | GIBCO | Cat# 25300054 |
| Trypsin-EDTA (0.25%) | GIBCO | Cat# 25200056 |
| Antibiotic-Antimycotic (100X) | GIBCO | Cat# 15240062 |
| Liberase TL Research Grade | ROCHE | Cat# 5401020001 |
| PBS, pH 7.4 | GIBCO | Cat# 10010023 |
| RPMI 1640 Medium | GIBCO | Cat# 11875–093 |
| Sodium Pyruvate | GIBCO | Cat# 11360070 |
| MEM Non-Essential Amino Acids Solution | GIBCO | Cat# 11140076 |
| β-mercaptoethanol | GIBCO | Cat# 21985023 |
| phorbol myristate acetate (PMA) | Sigma-Aldrich | Cat# P8139 |
| ionomycin | Sigma-Aldrich | Cat# I0634 |
| Zombie Aqua Fixable Viability Kit | Biolegend | Cat# 423101 |
| Fixation/Permeabilization Solution Kit with BD GolgiPlug | BD Biosciences | Cat# 555028 |
| Foxp3/Transcription Factor Staining Buffer Set | eBioscience | Cat# 00–5523-00 |
| Lympholyte-M Cell Separation Media | Cedarlane | Cat# CL5035 |
| 7-AAD Viability Staining Solution | Biolegend | Cat# 420404 |
| NEBNext High-Fidelity 2X PCR Master Mix | NEB | Cat# M0541S |
| Sebomed basal medium | Cedarlane | Cat# NC9711618 |
| Human recombinant EGF | R&D | Cat# 236-EG |
| Lipofectamine RNAiMAX Transfection Reagent | Invitrogen | Cat# 13778075 |
| Opti-MEM | GIBCO | Cat# 31985062 |
| SMARTpool: ON-TARGETplus ID1 siRNA | Dharmacon | Cat# L-005051 |
| SMARTpool: ON-TARGETplus ID2 siRNA | Dharmacon | Cat# L-009864 |
| SMARTpool: ON-TARGETplus CEBPA siRNA | Dharmacon | Cat# L-006422 |
| SMARTpool: ON-TARGETplus JAG2 siRNA | Dharmacon | Cat# L-017187 |
| SMARTpool: ON-TARGETplus PBX1 siRNA | Dharmacon | Cat# L-019680 |
| SMARTpool: ON-TARGETplus IL7R siRNA | Dharmacon | Cat# L-007996 |
| ON-TARGETplus Non-targeting Pool | Dharmacon | Cat# D-001810 |
| Tamoxifen | Sigma-Aldrich | Cat# T5648 |
| MC903 (Calcipotriol) | TOCRIS | Cat# 2700 |
| DAPI (4’,6-Diamidino-2-Phenylindole, Dilactate) | BioLegend | Cat# 422801 |
| ProLong Gold Antifade Mountant with DAPI | Thermo Fisher Scientific | Cat# P36931 |
| Isopropanol (2-propanol) | Avantor Performance Materials | Cat# 9084–01 |
| LipiDye | Funakoshi | Cat# FDV-0010 |
| Oil Red O | Sigma-Aldrich | Cat# O0625 |
| Paraformaldehyde, 16% solution | Electron Microscopy Sciences | Cat# 15710 |
| Dispase II (neutral protease, grade II) | Roche | Cat# 4942078001 |
| Ready-Lyse Lysozyme Solution | Epicenter | Cat# R1810M |
| Tn5 transposase | Illumina | Cat# FC-121–1030 |
| Recombinant Human Jagged 2 Fc Chimera Protein | R&D | Cat# 1726-JG-050 |
| Palmitoleic acid | Sigma-Aldrich | Cat# P9417 |
| Oleic acid | Sigma-Aldrich | Cat# O1383 |
| Recombinant Mouse IL-18 | R&D | Cat# 9139-IL |
| Recombinant Mouse IL-17E | R&D | Cat# 1399-IL |
| Recombinant Mouse IL-33 | R&D | Cat# 3626-ML |
| Recombinant Mouse IL-7 | R&D | Cat# 407-ML |
| Recombinant Mouse TSLP | R&D | Cat# 555-TS |
| Enroflox 100 (Enrofloxacin) | Norbrook | N/A |
| Cefazolin | WG Critical Care | Cat# 44567–707-25 |
| Critical Commercial Assays | ||
| RNeasy Plus Mini Kit | QIAGEN | Cat# 74134 |
| nCounter PanCancer Pathways Panels | NanoString Technologies | Cat# XT-CSO-PATH1–12 |
| PureLink Genomic DNA Mini Kit | Invitrogen | Cat# K182001 |
| Agencourt AMPure XP - PCR Purification | Beckman Coulter | Cat# A63880 |
| Quant-iT dsDNA Assay Kit | Invitrogen | Cat# Q33120 |
| MinElute PCR Purification Kit | QIAGEN | Cat# 28004 |
| SMART-Seq v4 Ultra Low Input RNA Kit | TAKARA | Cat# 634888 |
| APC BrdU Flow Kit | BD | Cat# 552598 |
| Chromium Single Cell 3′ Reagent Kit (v2 Chemistry). | 10X Genomics | Cat# 120237 |
| Deposited Data | ||
| RNA-seq and ATAC-seq | This paper | GEO: GSE120130 |
| Microbiome | This paper | BioProject: PRJNA445721 |
| Single-cell RNA-seq | This paper | GEO: GSE120787 |
| Experimental Models: Cell Lines | ||
| SEB-1 | Dr. D. Thiboutot (Pennsylvania State University) | N/A |
| SEB-1 | Dr. D. Thiboutot (Pennsylvania State University) |
N/A |
| Experimental Models: Organisms/Strains | ||
| Mouse: C57BL/6NCr | NCI-Charles River | STRAIN CODE: 556 |
| Mouse: B6(Cg)-Rag2tm1.1Cgn/J | Jackson Laboratory | Stock No: 008449 |
| Mouse: C57BL/10SgSnAi-[KO]RAG 2-[KO]gc | NIAID-Taconic Repository | Model# 4111 |
| Mouse: B6-Gata3-[fl/fl]-Cre-ERT2 (Gata3fl/fl Cre-ERT2) | NIAID-Taconic Repository | Model# 8445 |
| Mouse: B6.129P2(Cg)-Rorctm2Litt/J (RorcGFP/GFP) | Jackson Laboratory | Stock No: 007572 |
| Mouse: Tg(tetO-HIST1H2BJ/GFP)47Efu/J (tetO-H2B-GFP) | Jackson Laboratory | Stock No: 005104 |
| Mouse: B6.Cg-Gt(ROSA)26Sortm1(rtTA*M2)Jae/J (R26-M2rtTA) | Jackson Laboratory | Stock No: 006965 |
| Mouse: B6.SJL-Ptprca Pepcb/BoyJ (CD45.1) | Jackson Laboratory | Stock No: 002014 |
| Mouse: B6.129S7-Il7rtm1Imx/J (Il7r−/−) | Jackson Laboratory | Stock No: 002295 |
| Mouse: Il7−/− | Dr. J. Park (NCI/NIH) | N/A |
| Mouse: Tslp−/− | Dr. S. Nakae (University of Tokyo) | CDB0777K (RIKEN) |
| Mouse: Il7−/−Tslp−/− | Dr. K. Moro (RIKEN) | N/A |
| Mouse: Tslpr−/− | Dr. W. J. Leonard (NHLBI/NIH) | N/A |
| Mouse: B6.129S6-Ccr6tm1(EGFP)Irw/J (Ccr6GFP/GFP) | Jackson Laboratory | Stock No: 013061 |
| Mouse: Tnf−/− | Dr. D. Schlessigner (NIA/NIH) | N/A |
| Mouse: Lta−/− | Dr. D. Schlessigner (NIA/NIH) | N/A |
| Mouse: Ltb−/− | Dr. D. Schlessigner (NIA/NIH) | N/A |
| Mouse: Tnf−/− Lta−/− Ltb−/− | Dr. D. Schlessigner (NIA/NIH) | N/A |
| Mouse: B6.FVB-Tg(Rorc-cre)1Litt/J (Rorc-Cre) | Jackson Laboratory | Stock No: 022791 |
| Mouse: B6.129X1-Gt(ROSA)26Sortm1(EYFP)Cos/J (ROSA-EYFP) | Jackson Laboratory | Stock No: 006148 |
| Mouse: B6;SJL-Tg(Krt1–15-cre/PGR)22Cot/J | Jackson Laboratory | Stock No: 005249 |
| Mouse: Adam10tm1.1Khr (Adam10flox) | Dr. K. Horiuchi (National Defense Medical College) | N/A |
| Software and Algorithms | ||
| FlowJo | FlowJo, LLC | https://www.flowjo.com/solutions/flowjo |
| Partek Flow | Partek | http://www.partek.com/partekflow |
| Partek Genomics Suite | Partek | http://www.partek.com/pgs |
| nSolver Analysis Software 4.0 | NanoString Technologies | https://www.nanostring.com/products/analysis-software/nsolver |
| GraphPad Prism | GraphPad Software | https://www.graphpad.com/ |
| Imaris | Bitplane | http://www.bitplane.com/ |
| Seurat | Satija Lab | https://satijalab.org/seurat/ |
METHOD DETAILS
Tissue Processing
Skin cell suspensions were prepared from mouse dorsal skin. Hairs were shaved with electric clippers and harvested whole skin samples were placed in PBS on ice. Subcutaneous tissues were mechanically removed with forceps and were placed in PBS on ice. The rest of skin was floated on 10 mL of 0.15% trypsin and 0.75 mM EDTA (a mixture of 5 mL of 0.25% Trypsin-1mM EDTA and 5 mL of 0.05% Trypsin-0.5mM EDTA) (GIBCO) and incubated at 37°C for 45 min. The epidermis was then scraped off with forceps into PBS containing 5% FBS. The cell suspension was further mechanically dissociated with a 50 ml syringe (Covidien) and then filtered through a sterile 100 μm cell strainer (BD). The cells were washed with PBS containing 5% FBS and further filtered through a 40 μm cell strainer into a new 50 ml conical tube. Dermis and subcutaneous tissues were minced with scissors in 5 mL of RPMI containing 0.25 mg/mL of Liberase TL Research grade (Roche) and 1 μg/mL of DNase I (Sigma) in 6 well plates and were incubated at 37°C for 2 hours. Cell suspensions were further mechanically dissociated with a 12 ml syringe and were then filtered through a sterile 100 μm cell strainer. The cells were washed with PBS containing 5% FBS and were then filtered through a 40 μm cell strainer into a new 50ml conical tube. To sort cells for RNA-seq and ATAC-seq, tissues were harvested from 8 to 10 mice and cell suspensions were pooled for the subsequent sorting. The enrichment of lymphoid cells was performed by a density separation of Lympholyte-M Cell Separation Media (Cedarlane).
In vitro Re-stimulation
For detection of cytokine production, single cell suspensions were cultured ex vivo in 12-well plates in 2 mL of complete RPMI (RPMI 1640 supplemented with 10% fetal bovine serum [FBS], 1 mM sodium pyruvate and non-essential amino acids, 100 U/mL penicillin, 100 μg/mL streptomycin, 0.25 μg/mL of Amphotericin B and 50 mM β-mercaptoethanol) and were stimulated with 50 ng/mL phorbol myristate acetate (PMA) and 500 ng/mL ionomycin in the presence of brefeldin A (GolgiPlug, BD Biosciences) for 3 hours at 37°C in 5% CO2. After stimulation, cells were used for intracellular cytokine staining to be analyzed via flow cytometry.
In vitro culture with cytokines
Cell suspension was prepared from skin as described above and lymphoid cells were enriched by density separation using Lympholyte-M Cell Separation Media. Cells were cultured in 2ml of complete RMPI with 50ng/mL of recombinant mouse cytokines (IL-18, IL-25, IL-33, IL-7 or TSLP) for 2 days prior to analysis.
Flow Cytometry Analysis
Cells were stained with Zombie Aqua Fixable Viability Kit (BioLegend) for 20 min at room temperature and were incubated with anti-mouse CD16/32 Antibody to block Fc receptors and were then incubated primary antibodies for 30 min on ice. For intracellular cytokine staining, cells were fixed and permeabilized using BD Cytofix/Cytoperm and were then incubated with anti-cytokine antibodies for 30 min on ice. For transcription factor staining, cells were fixed and permeabilized with Foxp3/Transcription Factor Staining Buffer Set (eBioscience) and were incubated with anti-transcription factor antibodies for 30 min on ice. The antibodies were purchased from BioLegend, eBioscience or BD Biosciences as detailed in the Key Resources Table. The data was acquired by LSR ll (BD Biosciences) and analyzed by using FlowJo software (FlowJo, LLC). Zombie Aqua-stained dead cells and doublet cells were removed from the analysis and CD45+ cells were gated as hematopoietic cells. To distinguish ILCs from other immune cells, lineage markers were used. Lineage markers included CD3e, CD5, CD19, CD11c, CD11b, FcεRIα, TCRγδ, TCRαβ, NK1.1 and B220. To exclude epidermal lymphoid cells, anti-CD2 antibody was included in the lineage markers except in experiments displayed in Figure 1A, Figure 5H, and Figure S5C. To sort cells for RNA-seq and ATAC-seq, 7-AAD was used for dead cell staining.
RNA-sequencing
5,000 to 20,000 cells were sorted into PBS containing 10% FBS using FACS ARIA ll (BD Biosciences) and RNA was isolated by RNeasy Plus Mini Kit. RNA libraries were prepared using SMRT-seq Ultra Low Input RNA kit (TAKARA) with Nextera XT library prep protocol. This protocol is not strand-specific. 10 samples were pooled per lane to be sequenced with HiSeq2500 (Illumina) using Illumina TruSeq v4 chemistry (Illumina). Sample reads were trimmed of adapters and low-quality bases using Trimmomatic software. The trimmed reads were aligned with reference mouse genome mm10 and Gencode M9 annotation using STAR software. Read counts were normalized to TPM (Transcripts Per Kilobase Million) with PartekFlow (Partek). PCA plots, heat maps of the differential gene expression were generated using Partek Genomics Suite (Partek).
ATAC-sequencing
ATAC-seq was performed according to published methods (Shih et al., 2016). 5,000 to 20,000 cells were sorted by FACS ARIA ll (BD Biosciences) and treated with lysis buffer (10 mM Tris-HCl [pH 7.4], 10 mM NaCl, 3 mM MgCl2, 0.1% IGEPAL CA-630). After spinning down, the pellets were re-suspended in a transposition reaction with Tn5 transposase (Illumina) to tag and fragmentalize accessible chromatin and were then incubated at 37°C for 30 min. The fragmentalized DNAs were purified using a QIAGEN MinElute kit and were amplified with 12 cycles of PCR using NEBNext High-Fidelity 2X PCR Master Mix (NEB) based on the amplification curve. The libraries were purified using a QIAGEN PCR cleanup kit and sequenced with HiSeq2500 (Illumina) using TruSeq V4 chemistry. The reads were trimmed for adapters and low-quality bases and aligned to mouse mm10 genome.
Single cell RNA-sequencing
Lin− Thy1.2+ ILCs from skin layers were sorted, ran through 10X Chromium (10X Genomics) and cDNA libraries were prepared following the recommended protocol for the Chromium Single Cell 3′ Reagent Kit (v2 Chemistry). Sequencing was performed with HiSeq3000. Post-processing and quality control were performed using the 10X Cell Ranger pipelines (v2.2.0, 10X Genomics). Reads were aligned to mouse genome mm10 reference assembly (v2.2.0, 10X Genomics). Estimated number of cells of epidermal ILCs was 4,072 with 4,237 median unique molecular identifiers (UMIs, transcripts) per cell and 1,705 median genes per cell sequenced to 91.1% sequencing saturation with 98,442 mean reads per cell. Estimated number of dermal ILCs was 3,990 with 3,415 median UMIs per cell and 1,284 median genes per cell sequenced to 92.2% sequencing saturation with 94,347 mean reads per cell. Estimated number of subcutaneous ILCs was 1,236 with 4,215 median UMIs per cell and 1,381 median genes per cell sequenced to 97.0% sequencing saturation with 316,241 mean reads per cell. Seurat R package (v2.3.4) (Butler et al., 2018) was used for further analysis with default parameters applied unless otherwise indicated. For quality control purpose, we restricted the analysis to the cells (unique barcode) exhibiting a percentage of mitochondrial genes < 5%, a total number of genes > 300 and a total UMI count comprised between 2,000 and 8,000. These filtration criteria led to a final number of 3,431 Epidermal ILCs (1,745 median genes and 4,461 median UMI), 3,356 Dermal ILCs (1,368 median genes and 3,741 median UMI) and 1,061 Subcutaneous ILCs (1,450 median genes and 4,502 median UMI) that were subsequently merged using the MergeSeurat function. The merged dataset was then Log normalized (NormalizeData function) and Scaled (ScaleData function, including a linear regression of UMI and mitochondrial genes to reduce these sources of variation). Principal component analysis was conducted (RunPCA function), and we further selected a total of 8 Principal components (based on the standard deviation curve of principal components) combined with a shared nearest neighbor of 0.5 for subsequent graph-based cell clustering. Small amounts of T cell contamination (< 5%) were detected by Cd3e expression and were removed from further analysis. DEGs (log2 fold change > 0.25, p values < 0.05, pct > 0.1) were determined by calculating the difference between the average expression by cells in a cluster to the average expression by cells in all other clusters. Log-normalized gene expression data was used for visualizations of projected gene expression on tSNE plots (FeaturePlot function) while Scaled log-normalized gene expression data was used for heatmap visualization (DoHeatmap function).
Tamoxifen treatment
Tamoxifen (Sigma) was dissolved in sun flower oil at 10 mg/mL and 1mg of tamoxifen (50 mg/body weight) was injected intraperitoneally into 6-week-old Gata3fl/fl Cre-ERT2 mice every other day, 4 times in total.
Atopic dermatitis-like skin inflammation
MC903 (calcipotriol, TOCRIS) was dissolved in EtOH at 20 μg/mL and topically applied onto both dorsal and ventral sides of mouse ears (20 μL for each ear) or shaved back skin (90 μl) every other day for 12 or 18 days. Ear thickness was measured with a thickness gauge (Swiss Precision Instruments). Cell suspensions harvested from back skin of mice were used for flow cytometry analysis of skin ILCs.
Induction of H2B-GFP
Induction of H2B-GFP in tetO-H2B-GFP;R26-M2rtTA mice was performed with 2 mg/mL doxycycline (Sigma) and 7.5% sucrose (Sigma) dissolved in drinking water. Mice were induced for 6 days after which doxycycline-containing water was replaced by regular drinking water. GFP expression was detected by flow cytometry.
BrdU treatment in vivo
Bromodeoxyuridine (BrdU) was dissolved at 10 mg/mL in PBS. 8 to 10-week-old female C57BL/6J mice then received intraperitoneal injections of 100 μL/10 g body weight of the BrdU solution. Additionally, the mice received 120 mg/mL BrdU in drinking water. BrdU-containing drinking water was replaced every three days. On day 9, tissues were harvested and cells that have taken up BrdU were quantified using the APC BrdU Flow Kit (BD Biosciences) via flow cytometry, according to the manufacturer’s recommendations.
BrdU treatment in vitro
SEB-1 were cultured with 10 μM of BrdU for 2 hours and BrdU incorporation was detected by APC BrdU Flow Kit (BD Biosciences) via flow cytometry.
Parabiosis
Age-matched CD45.1+ and CD45.2+ congenic mice were co-housed for 1 week prior to surgery to ensure harmonious cohabitation. The mice were anesthetized with i.p. injection of a mixture of Ketamine (Putney) and Xylazine (Lloyd). 0.25% Marcaine (Hospira) was injected along the surgical area for local anesthesia. The lateral sides of two mice were shaved and disinfected. Matching skin incisions were made from the elbow to the knee and excess skin was excised to ensure a tight union. The elbows and knee joints of both mice were connected using a non-absorbable suture and then the skins of two mice were connected by a continuous suture with Vicryl (ETHICON). Suture types were cruciate for skin overlaying the joints and short stretches of continuous suture for the dorsal and ventral skin in between. Immediately post-surgery, 0.5–1.0 mL of pharmaceutical-grade physiological saline were injected subcutaneously to prevent dehydration. Buprenorphine (ZooPharm) was administrated post-surgery for pain control every 24 hours and as needed. Parabiotic mice were maintained under antibiotic-containing water for 2 weeks after surgery. The mice were analyzed 8 weeks after surgery.
Bone Marrow Transfer
2 × 10⁶ of bone marrow cells from CD45.1+ congenic mice were transferred into lethally irradiated (9.5 Gy) CD45.2+ mice to determine radio-sensitivity of ILCs (Fig. 3C). For sebaceous gland size analysis (Fig. 5G), 2 × 10⁶ of bone marrow cells from Rag2−/− or Rag2−/− Il2rg−/− mice were transferred into non-irradiated Rag2−/− Il2rg−/− mice and were analyzed 8 weeks after transplantation.
Human Sebocyte Culture
The human sebocyte cell line (SEB-1) was kindly provided by Dr. D. Thiboutot (Thiboutot et al., 2003). SEB-1 was cultured in Sebomed basal medium (Cedarlane) supplemented with 5 ng/mL human EGF (R&D) and 10% FBS at 37°C, 5% CO2. For cytokine treatment, human recombinant cytokines as detailed in the Key Resources Table were added into 1 mL of culture medium in 24 well plates. The cells were cultured for 3 days and were harvested to be quantified for cell numbers and RNA extraction. Cell numbers were quantified with Countess Automated Cell Counter (Invitrogen) and RNA was extracted using RNeasy Plus Mini Kit (QIAGEN). For siRNA knockdown, sebocytes were seeded in 1 mL of culture medium in 24 well plates on day 0 and siRNA transfection was performed on day 1 using Lipofectamine RNAiMAX Transfection Reagent (Invitrogen) and Opti-MEM (GIBCO). ON-TARGETplus SMARTpool (Dharmacon) was used for siRNA reagents as described in the Key Resources Table. The cells were harvested on day 4 to count the cell numbers or seeded again for analysis at 2nd passage which were cultured for 4 additional days.
Nanostring Gene Expression Analysis
Gene expression analysis of extracted RNA from SEB-1 was performed by nCounter PanCancer Pathways Panels (NanoString Technologies) according to the manufacture’s protocol. Normalization of gene expression was performed using nSolver Analysis Software (NanoString Technologies) and differentially expressed genes were generated by Partek Genomics Suite (Partek).
Preparation of whole mount epidermal sheets
Skin from mouse tails were harvested using sterile blades and forceps and were washed with PBS and then transferred into a 35mm dish. Skin was incubated with 1mg/mL Dispase II (Roche) in RPMI medium for one hour at 37°C. After incubation, the epidermis was carefully peeled off from the dermis using fine forceps.
Immunofluorescent staining of whole mount epidermal sheets
Epidermal sheets were fixed in 4% paraformaldehyde solution (Electron Microscopy Sciences) in 6-well plates for 20 min at room temperature. After washing three time in PBS, 5 min each, samples were incubated in blocking buffer (3% skim milk, 5% donkey serum, and 0.1% Triton X) for 30 min at room temperature. Epidermal sheets were then incubated with goat anti-LRIG1 (polyclonal, R&D) at 1:20, rabbit anti-MGST1 (EPR7934, Abcam) at 1:200, and rat anti-Ki-67 (11F6, Biolegend) antibodies at 1:100 overnight at 4°C. The samples were washed three times with PBS, 5 min each, then incubated with Alexa Fluor 488-conjugated anti-goat (Thermo Fisher Scientific), and Alexa Fluor 568-conjugated anti-rabbit (Thermo Fisher Scientific) antibody for 45 min at room temperature. Samples were washed three times in PBS, 5 min each, and then mounted with ProLong Gold (Molecular Probes) anti-fade reagent. Images of sebaceous glands were captured with a Nikon Ti2-E microscope (Nikon Instruments, Inc., Melville, NY) equipped with a CSU-W1 spinning disk unit (Yokogawa Corp. of America, Newnan, GA). Tile images were stitched into a final large image with extended field of view using the Nikon Elements software (v4.2). LRIG+ and MGST1+ area and Ki-67+ cell counts were analyzed based on 3D reconstructed images that were generated in the Imaris (Bitplane) software. LRIG+ and MGST1+ areas were measured based on isosurface images that were generated for each channel. Ki-67+ cells per each hair follicle were manually counted.
LipiDye staining and quantification
Mouse tail skin was embedded in OCT compound (Tissue-Tek), frozen on dry ice, and were cryo-sectioned at 7 μm thickness. Sections were fixed with 4% paraformaldehyde for 20 min at room temperature, washed three times in PBS, 5 min each, then stained with 5 μM LipiDye (Funakoshi, Japan) for 30 min on ice. Slides were washed three times with PBS, 5 min each, and were then mounted using Prolong Gold. Images were captured using a Zeiss Axio Image A1 fluorescent microscope (Carl Zeiss) and Zeiss AxioVision 4.8 software. The absolute thickness of surface lipid and the relative staining intensity of surface lipid over the entire epidermis of sections was analyzed using ImageJ software (NIH).
Oil-red-O staining
Epidermal sheets were fixed with 4% paraformaldehyde solution for 20 min at room temperature and were washed twice in PBS, 5 min each, then washed with 60% isopropanol (Avantor Performance Materials) for 5 min. The samples were stained with 0.5% Oil-red-O (Sigma-Aldrich) solution for 30 min at room temperature, washed twice in 60% isopropanol and once in PBS before mounting. Images were captured using a Zeiss Axio Image A1 fluorescent microscope (Carl Zeiss) and Zeiss AxioVision 4.8 software. The sizes of Oil-red-O-positive sebaceous glands were quantified in the captured images using ImageJ software (NIH).
Hematoxylin and Eosin (H&E) staining
Skin samples were harvested from mouse back skin and were fixed in 10% formalin at room temperature. Samples were then sent to Histoserv, Inc (Germantown, MD), where preparation of paraffin embedded tissue sections and H&E staining were performed according to standard protocols. Images were captured using a Leica DM2000 microscope. The sizes of sebaceous glands in Figure 6F were quantified in the captured images of H&E staining using ImageJ software (NIH).
Antibiotics treatment
Mice were treated continuously for 8 weeks with 0.5mg/mL of Cefazolin and Enrofloxacin in drinking water.
Bacteria inhibition assay
Bacteria were cultured in Tryptic Soy Broth medium in aerobic condition or fastidious media in an anaerobic chamber and were plated onto Tryptic Soy Agar plates or Tryptic Soy Agar with 5% sheep blood plates. Antimicrobial susceptibility test discs were placed onto plates and were cultured overnight. Zone of inhibition was measured as the inhibitory area (diameter) of bacteria growth, excluding the diameter of the discs.
LC-MS lipid assay
Skin surface of euthanized mice were scraped with scalpels to obtain samples for LC-MS analysis. The samples were analyzed by LC-MS using standardized methods at the Lipidomics Core Facility at Wayne State University on a QTRAP5500 mass analyzer (Sciex) and the data were analyzed using LipidView (Sciex, version 1.2). The free fatty acids and triglycerides were quantitated against the spike internal standards.
Sample collection, DNA extraction, PCR amplification and sequencing for microbiome analysis
Swab samples were collected from the facial area of mice and processed as described previously (Kobayashi et al., 2015) (Kong et al., 2012). Briefly, skin swabs were taken with pre-moistened (with lysis buffer; 20mM Tris (pH 8.0), 2mM EDTA, 1.2% Triton X-100) Catch-All Sample Collection Swabs (Epicenter). Control swabs for contaminations were obtained by exposing pre-moistened swabs to environmental air. Swabs were stored in 180ul lysis solution at −80°C following collection.
For DNA extraction, swabs were incubated in Yeast Cell Lysis buffer and ReadyLyse Lysozyme Solution (Epicenter) for 3hrs with shaking at 37°C, followed by 5-mm steel bead-beating using a Tissuelyser (QIAGEN) for 2 min at 30 Hz, and 1hr incubation at 65°C for complete lysis. MPC Reagent was then added and centrifuged to samples to remove cellular debris and proteins. Resulting supernatant was processed using the PureLink Genomic DNA Kit (Invitrogen). DNA was eluted in DNA-Free PCR Water (MoBio). Control swabs also underwent the same DNA extraction processes and sequencing along with experimental samples, and no apparent contamination from either reagents or experimental procedures were observed.
The V1-V3 region was amplified using primers 27F (5′-AGAGTTTGATCCTGGCTCAG) and 534R (5′-ATTACCGCGGCTGCTGG) with Illumina adapters. PCR reactions were performed in duplicate for 30 cycles, combined, purified using Agencourt AmpureXP (Beckman Coulter), and quantified using the Quant-IT dsDNA Kit (Invitrogen). Equivalent amounts of amplicons were pooled together, purified (MinElute PCR Purification Kit; QIAGEN), and sequenced on an Illumina MiSeq platform.
Microbiome analysis pipeline
For sequence analysis, a mothur-based pipeline was used (Kobayashi et al., 2015) (Kong et al., 2012) (Schloss et al., 2009). Briefly, sequences were pre-processed to remove primers and barcodes, and paired-end reads were merged using FLASh. Assembled reads were quality filtered (qaverage = 25), subsampled to 5000 sequences per sample, and checked for chimeras using UCHIME in mothur. (Edgar et al., 2011) After chimeras were removed, reads were clustered into operational taxonomic units (OTUs) at 97% nucleotide similarity (average neighbor). Between-sample similarity was calculated using the Yue & Theta dissimilarity index with OTUs, and principal coordinates analysis was used for visualization. Analysis of molecular variance (AMOVA) was used to test for statistically significant differences between groups. The linear discriminant analysis effect size (LEfSe) method (Segata et al., 2011) was used to discover discriminatory taxa for each group.
Mouse co-housing experiment
4-week-old WT, Rag2−/− and Rag2−/− Il2rg−/− mice that were initially maintained in different cages according to their genotypes were co-housed in the same cage for 14 days and were then separated according to their genotypes. Skin swab samples were collected before co-housing, after co-housing for 2 weeks, and after separation for 2 weeks.
QUANTIFICATION AND STATISTICAL ANALYSIS
Statistical analysis
Statistical analysis was performed with GraphPad Prism (GraphPad Software) using two-tailed unpaired or paired Student’s t test or ANOVA with Tukey’s multiple comparison. Investigators were blinded for the quantifications of size of sebaceous glands.
DATA AND SOFTWARE AVAILABILITY
The accession number for the RNA-seq and ATAC-seq data reported in this paper is GEO: GSE120130.
The accession number for the microbiome sequence data reported in this paper is BioProject: PRJNA445721.
The accession number for the single-cell RNA-seq data reported in this paper is GEO: GSE120787.
Supplementary Material
Figure S1. Characterization of Skin ILCs, Related to Figure 1
(A) Flow cytometry analysis showing expression of indicated cell surface proteins on ILCs (live CD45+, Lin−, Thy1.2+) from the epidermis, dermis and subcutis of WT mice. (B) Heatmap of RNA-seq transcriptome analysis of sorted ILCs from the epidermis, dermis and subcutis. (fold change > 2 and p value < 0.05) (C) ATAC-seq signal profiles of ILCs from epidermis, dermis and subcutis in genes associated with ILC effector cytokines. (A and C) Data are representative of more than two independent experiments (n > 3 per experiment) with similar results. (B) Data are pooled from two to three independent experiments.
Figure S2. GATA3 and RORγt Are Required for Skin ILCs to Gain Effector Functions, Related to Figure 2
Flow cytometry analysis of GATA3 and RORγt expression in Lin− Thy1.2+ ILCs. (B) Flow cytometry of RORγt fate-mapped mice (Rorc-Cre ROSA-EYFP). The proportions of EYFP+ cells in ILCs from the epidermis, dermis and subcutis. αβ T cells from the dermis are shown as a reference for Cre-recombinase efficiency in Rorc-Cre ROSA-EYFP. (C) Quantification of skin ILCs from Gata3fl/fl Cre-ERT2 mice. (D) Flow cytometry of skin ILCs from Gata3fl/fl Cre-ERT2 mice. Mice were treated with MC903 for 12 days. (E) Quantification of IL-13 and IL-17-producing skin ILCs from MC903-treated Gata3fl/fl Cre-ERT2 mice. (F) Measurements of ear thickness in MC903-treated Gata3fl/fl Cre-ERT2 mice. (G) Quantification of skin ILCs from RorcGFP/GFP mice. (H) Quantification of IL-13 and IL-17-producing skin ILCs from RorcGFP/GFP mice. (I) Ear thickness of MC903-treated WT and RorcGFP/GFP mice. (A, B and D) Data are representative of more than three independent experiments with similar results. (C, E, F, G, H and I) The data are shown as mean ± SD and were pooled from more than two independent experiments (n = 3 to 4 per experiment). Each dot represents an individual mouse. Student’s t-test was used to measure significance. *p < 0.05, **p < 0.01 and ***p < 0.001.
Figure S3. Turnover of Skin ILCs, Related to Figure 3
Flow cytometry of H2B-GFP;R26-M2rtTA mice that were treated with doxycycline for 6 days. Proportions of GFP+ cells in ILCs from the epidermis, dermis and subcutis and epidermal γδ T cells at indicated time points are shown.
Figure S4. Tissue Residency and Localization of ILCs, Related to Figure 4
(A) Flow cytometry analysis for TSLPR expression on ILCs (live CD45+, Lin−, Thy1.2+) from the epidermis, dermis and subcutis of WT mice. (B) Lin- IL-7Rα+ integrin α4β7+ Flt3- ILC precursors in bone marrow from indicated mice. CD25− cells are common ILC precursors and CD25+ are ILC2 precursors. (C) Analysis of lung and gut ILC2 and ILC3 in indicated mice. (D) Whole mount immunofluorescence microscopy of tail epidermal sheet visualized for indicated molecules (upper left and lower panel, scale bars = 50 μm, arrow heads indicate CD3- Thy1.2+ ILCs, dashed lines demarcate sebaceous glands) and quantification on the anatomical distribution of epidermal ILCs as compared to other lymphoid subsets in the epidermis (upper right panels). (A, B and D) Data are representative of more than two independent experiments with similar results. (C) The data are shown as mean ± SD and were pooled from more than two independent experiments (n = 3 to 4 per experiment). ANOVA with Tukey’s multiple comparison test was used to measure statistical significance. *p < 0.05, **p < 0.01 and ***p < 0.001.
Figure S5. Regulation of Sebaceous Glands Are Mediated by ILCs, Related to Figure 5
(A) Quantification of sebaceous gland sizes in tail skin epidermal sheets from WT, Rag2−/− and Rag2−/− Il2rg−/− mice at indicated ages. (B) Whole mount immunofluorescence staining of tail epidermal sheets from WT, Rag2−/− and Rag2−/− Il2rg−/− mice visualized for Ki-67 and LRIG1 (upper panels). Quantification of Ki-67+ sebocytes and the percentages of irregularly distributed Ki-67+ cells, which were defined as cells that resided outside of the LRIG1high junctional zone in the periphery of sebaceous glands (lower panels). (C) Flow cytometry of live CD45+ Lin− Thy1.2+ cells in the epidermis from WT, Il7−/− and Il7−/− Tslp−/− mice. Anti-CD2 antibody, which was included in lineage markers for other experiments, was independently stained. Proportions of CD2+ ICOS− epidermal lymphoid cells and CD2− ICOS+ ILCs are shown.
(A) The data are shown as mean ± SD and were pooled from more than two independent experiments (n = 3 to 4 per experiment). Each dot represents an individual sebaceous gland. ANOVA with Tukey’s multiple comparison test was used to measure significance. *p < 0.05, **p < 0.01 and ***p < 0.001. (B and C) Images and data are representative of more than two independent experiments with similar results.
Figure S6. TNF- and Lymphotoxin-Mediated Inhibition of Sebocyte Growth Is Associated with Downregulation of JAG2, Related to Figure 6
(A) BrdU incorporation in TNF- or lymphotoxins-treated SEB-1 cells. (B) Quantification of cell numbers of human sebocyte cell line (SEB-1) cultured with recombinant TNF, LTα3 and LTα1β2 at indicated concentrations for 3 days. (C) Expression of TNF and lymphotoxins as detected by single-cell RNA-seq (left) and the production of TNF was analyzed by flow cytometry (right). (D) siRNA knockdown of indicated genes on cultured SEB-1 cells. The number of cells from the 1st passage is shown (left). The efficiency of siRNA knockdown was evaluated via real-time PCR (right). (E) Images of Oil-red-O staining in tail epidermal sheets of Adam10fl/fl K15-CrePR1 mice. Right panel shows the quantification of sebaceous gland sizes. Scale bar = 50 μm. (A to C) Data are representatives of more than two independent experiments (n = 3 to 4 per experiment). (D and E) Data were pooled from more than two independent experiments (n = 3 to 4 per experiment). The data are shown as mean ± SD. ANOVA with Tukey’s multiple comparison test was used to measure significance. *p < 0.05, **p < 0.01 and ***p < 0.001.
Figure S7. Differential Role of Lymphocytes and ILCs on Skin Microbiome, Related to Figure 7
(A) Supervised LEfSE analysis of 16S rRNA sequencing analysis from skin swab samples of WT, Rag2−/− and Rag2−/− Il2rg−/− mice and (B) the proportions of Planococcacea and Staphylococcacea. (C) S. aureus was inoculated onto back skin of WT, Rag2−/− or Rag2−/− Il2rg−/− mice and the number of colonies cultured from skin swabs are shown for indicated time points. (D) Quantification of sebaceous gland sizes in tail skin epidermal sheets from WT, Rag2−/− and Rag2−/− Il2rg−/− mice after co-housing. (E) Quantification of sebaceous gland sizes of Rag2−/− Il2rg−/− mice after 8 weeks of antibiotics treatment with cefazolin and enrofloxacin. (F) LC-MS analysis of skin surface triglycerides of mice. (A to F) Data are representatives of, or pooled from, more than two independent experiments (n = 3 to 4 per experiment) with similar results. The data are shown as mean ± SD. ANOVA with Tukey’s multiple comparison test was used to measure significance. *p < 0.05, **p < 0.01 and ***p < 0.001.
Highlights.
Skin ILCs rely on hair follicle-derived factors for localization and maintenance
ILCs produce TNF/lymphotoxins, which limit sebocyte growth via Notch signaling
Lack of ILCs leads to sebaceous hyperplasia, altering the microbial landscape
Host immunity tunes the skin commensals by regulating sebaceous gland function
ACKOWLEDGEMENTS
This work was supported by the Division of Intramural Research of NIAMS, NCI, NHLBI, NIAID, and NIA. T.K. was supported in part by the NIH-JSPS Intramural Fellowship. A.T. was supported by the NIH Medical Research Scholars Program. Authors thank the NCI and NIAMS sequencing and flow cytometry cores and Michael Kruhlak (NCI) for confocal microscopy.
Footnotes
DECLARATION OF INTERESTS
The authors declare no competing interests.
SUPPLEMENTAL INFORMATION
Supplemental Information includes seven figures and can be found with this article online at https://doi.org/10.1016/j.cell.2018.12.031.
REFERENCES
- Adachi T, Kobayashi T, Sugihara E, Yamada T, Ikuta K, Pittaluga S, Saya H, Amagai M, and Nagao K (2015). Hair follicle-derived IL-7 and IL-15 mediate skin-resident memory T cell homeostasis and lymphoma. Nat. Med 21, 1272–1279. [DOI] [PMC free article] [PubMed] [Google Scholar]
- Al-Shami A, Spolski R, Kelly J, Fry T, Schwartzberg PL, Pandey A, Mackall CL, and Leonard WJ (2004). A role for thymic stromal lymphopoietin in CD4(+) T cell development. J. Exp. Med 200, 159–168. [DOI] [PMC free article] [PubMed] [Google Scholar]
- Ali N, Zirak B, Rodriguez RS, Pauli ML, Truong HA, Lai K, Ahn R, Corbin K, Lowe MM, Scharschmidt TC, et al. (2017). Regulatory T Cells in Skin Facilitate Epithelial Stem Cell Differentiation. Cell 169, 1119–1129.e11. [DOI] [PMC free article] [PubMed] [Google Scholar]
- Almeida FF, Tenno M, Brzostek J, Li JL, Allies G, Hoeffel G, See P, Ng LG, Fehling HJ, Gascoigne NR, et al. (2015). Identification of a novel lymphoid population in the murine epidermis. Sci. Rep 5, 12554. [DOI] [PMC free article] [PubMed] [Google Scholar]
- Belkaid Y, and Tamoutounour S (2016). The influence of skin microorganisms on cutaneous immunity. Nat. Rev. Immunol 16, 353–366. [DOI] [PubMed] [Google Scholar]
- Butler A, Hoffman P, Smibert P, Papalexi E, and Satija R (2018). Integrating single-cell transcriptomic data across different conditions, technologies, and species. Nat. Biotechnol 36, 411–420. [DOI] [PMC free article] [PubMed] [Google Scholar]
- Chen CC, Wang L, Plikus MV, Jiang TX, Murray PJ, Ramos R, Guerrero-Juarez CF, Hughes MW, Lee OK, Shi S, et al. (2015). Organ-level quorum sensing directs regeneration in hair stem cell populations. Cell 161, 277–290. [DOI] [PMC free article] [PubMed] [Google Scholar]
- Chen YE, Fischbach MA, and Belkaid Y (2018). Skin microbiota-host interactions. Nature 553, 427–436. [DOI] [PMC free article] [PubMed] [Google Scholar]
- Diefenbach A, Colonna M, and Koyasu S (2014). Development, differentiation, and diversity of innate lymphoid cells. Immunity 41, 354–365. [DOI] [PMC free article] [PubMed] [Google Scholar]
- Edgar RC, Haas BJ, Clemente JC, Quince C, and Knight R (2011). UCHIME improves sensitivity and speed of chimera detection. Bioinformatics 27, 2194–2200. [DOI] [PMC free article] [PubMed] [Google Scholar]
- Fang D, and Zhu J (2017). Dynamic balance between master transcription factors determines the fates and functions of CD4 T cell and innate lymphoid cell subsets. J. Exp. Med 214, 1861–1876. [DOI] [PMC free article] [PubMed] [Google Scholar]
- Gasteiger G, Fan X, Dikiy S, Lee SY, and Rudensky AY (2015). Tissue residency of innate lymphoid cells in lymphoid and nonlymphoid organs. Science 350, 981–985. [DOI] [PMC free article] [PubMed] [Google Scholar]
- Gury-BenAri M, Thaiss CA, Serafini N, Winter DR, Giladi A, Lara-Astiaso D, Levy M, Salame TM, Weiner A, David E, et al. (2016). The Spectrum and Regulatory Landscape of Intestinal Innate Lymphoid Cells Are Shaped by the Microbiome. Cell 166, 1231–1246.e13. [DOI] [PubMed] [Google Scholar]
- Hepworth MR, Fung TC, Masur SH, Kelsen JR, McConnell FM, Dubrot J, Withers DR, Hugues S, Farrar MA, Reith W, et al. (2015). Immune tolerance. Group 3 innate lymphoid cells mediate intestinal selection of commensal bacteria-specific CD4+ T cells. Science 348, 1031–1035. [DOI] [PMC free article] [PubMed] [Google Scholar]
- Honda K, and Littman DR (2016). The microbiota in adaptive immune homeostasis and disease. Nature 535, 75–84. [DOI] [PubMed] [Google Scholar]
- Kim BS, Siracusa MC, Saenz SA, Noti M, Monticelli LA, Sonnenberg GF, Hepworth MR, Van Voorhees AS, Comeau MR, and Artis D (2013). TSLP elicits IL-33-independent innate lymphoid cell responses to promote skin inflammation. Sci. Transl. Med 5, 170ra16. [DOI] [PMC free article] [PubMed] [Google Scholar]
- Klose CS, and Artis D (2016). Innate lymphoid cells as regulators of immunity, inflammation and tissue homeostasis. Nat. Immunol 17, 765–774. [DOI] [PubMed] [Google Scholar]
- Kobayashi T, Glatz M, Horiuchi K, Kawasaki H, Akiyama H, Kaplan DH, Kong HH, Amagai M, and Nagao K (2015). Dysbiosis and Staphylococcus aureus Colonization Drives Inflammation in Atopic Dermatitis. Immunity 42, 756–766. [DOI] [PMC free article] [PubMed] [Google Scholar]
- Kong HH, Oh J, Deming C, Conlan S, Grice EA, Beatson MA, Nomicos E, Polley EC, Komarow HD, Murray PR, et al. ; NISC Comparative Sequence Program (2012). Temporal shifts in the skin microbiome associated with disease flares and treatment in children with atopic dermatitis. Genome Res 22, 850–859. [DOI] [PMC free article] [PubMed] [Google Scholar]
- Leonard WJ (2002). TSLP: finally in the limelight. Nat. Immunol 3, 605–607. [DOI] [PubMed] [Google Scholar]
- McKenzie ANJ, Spits H, and Eberl G (2014). Innate lymphoid cells in inflammation and immunity. Immunity 41, 366–374. [DOI] [PubMed] [Google Scholar]
- Moro K, Yamada T, Tanabe M, Takeuchi T, Ikawa T, Kawamoto H, Furusawa J, Ohtani M, Fujii H, and Koyasu S (2010). Innate production of T(H) 2 cytokines by adipose tissue-associated c-Kit(+)Sca-1(+) lymphoid cells. Nature 463, 540–544. [DOI] [PubMed] [Google Scholar]
- Moro K, Kabata H, Tanabe M, Koga S, Takeno N, Mochizuki M, Fukunaga K, Asano K, Betsuyaku T, and Koyasu S (2016). Interferon and IL-27 antagonize the function of group 2 innate lymphoid cells and type 2 innate immune responses. Nat. Immunol 17, 76–86. [DOI] [PubMed] [Google Scholar]
- Nagao K, Kobayashi T, Moro K, Ohyama M, Adachi T, Kitashima DY, Ueha S, Horiuchi K, Tanizaki H, Kabashima K, et al. (2012). Stress-induced production of chemokines by hair follicles regulates the trafficking of dendritic cells in skin. Nat. Immunol 13, 744–752. [DOI] [PMC free article] [PubMed] [Google Scholar]
- Nakatsuji T, and Gallo RL (2012). Antimicrobial peptides: old molecules with new ideas. J. Invest. Dermatol 132, 887–895. [DOI] [PMC free article] [PubMed] [Google Scholar]
- Nestle FO, Di Meglio P, Qin JZ, and Nickoloff BJ (2009). Skin immune sentinels in health and disease. Nat. Rev. Immunol 9, 679–691. [DOI] [PMC free article] [PubMed] [Google Scholar]
- Noguchi M, Nakamura Y, Russell SM, Ziegler SF, Tsang M, Cao X, and Leonard WJ (1993). Interleukin-2 receptor gamma chain: a functional component of the interleukin-7 receptor. Science 262, 1877–1880. [DOI] [PubMed] [Google Scholar]
- Page ME, Lombard P, Ng F, Göttgens B, and Jensen KB (2013). The epidermis comprises autonomous compartments maintained by distinct stem cell populations. Cell Stem Cell 13, 471–482. [DOI] [PMC free article] [PubMed] [Google Scholar]
- Puhvel SM, Reisner RM, and Amirian DA (1975). Quantification of bacteria in isolated pilosebaceous follicles in normal skin. J. Invest. Dermatol 65, 525–531. [DOI] [PubMed] [Google Scholar]
- Ricardo-Gonzalez RR, Van Dyken SJ, Schneider C, Lee J, Nussbaum JC, Liang HE, Vaka D, Eckalbar WL, Molofsky AB, Erle DJ, and Locksley RM (2018). Tissue signals imprint ILC2 identity with anticipatory function. Nat. Immunol 19, 1093–1099. [DOI] [PMC free article] [PubMed] [Google Scholar]
- Salimi M, Barlow JL, Saunders SP, Xue L, Gutowska-Owsiak D, Wang X, Huang LC, Johnson D, Scanlon ST, McKenzie AN, et al. (2013). A role for IL-25 and IL-33-driven type-2 innate lymphoid cells in atopic dermatitis. J. Exp. Med 210, 2939–2950. [DOI] [PMC free article] [PubMed] [Google Scholar]
- Scharschmidt TC, Vasquez KS, Pauli ML, Leitner EG, Chu K, Truong HA, Lowe MM, Sanchez Rodriguez R, Ali N, Laszik ZG, et al. (2017). Commensal Microbes and Hair Follicle Morphogenesis Coordinately Drive Treg Migration into Neonatal Skin. Cell Host Microbe 21, 467–477.e5. [DOI] [PMC free article] [PubMed] [Google Scholar]
- Schloss PD, Westcott SL, Ryabin T, Hall JR, Hartmann M, Hollister EB, Lesniewski RA, Oakley BB, Parks DH, Robinson CJ, et al. (2009). Introducing mothur: open-source, platform-independent, community-supported software for describing and comparing microbial communities. Appl. Environ. Microbiol 75, 7537–7541. [DOI] [PMC free article] [PubMed] [Google Scholar]
- Segata N, Izard J, Waldron L, Gevers D, Miropolsky L, Garrett WS, and Huttenhower C (2011). Metagenomic biomarker discovery and explanation. Genome Biol. 12, R60. [DOI] [PMC free article] [PubMed] [Google Scholar]
- Shih HY, Sciumè G, Mikami Y, Guo L, Sun HW, Brooks SR, Urban JF Jr., Davis FP, Kanno Y, and O’Shea JJ (2016). Developmental Acquisition of Regulomes Underlies Innate Lymphoid Cell Functionality. Cell 165, 1120–1133. [DOI] [PMC free article] [PubMed] [Google Scholar]
- Smith KR, and Thiboutot DM (2008). Thematic review series: skin lipids. Sebaceous gland lipids: friend or foe? J. Lipid Res 49, 271–281. [DOI] [PubMed] [Google Scholar]
- Sonnenberg GF, and Artis D (2015). Innate lymphoid cells in the initiation, regulation and resolution of inflammation. Nat. Med 21, 698–708. [DOI] [PMC free article] [PubMed] [Google Scholar]
- Spits H, Artis D, Colonna M, Diefenbach A, Di Santo JP, Eberl G, Koyasu S, Locksley RM, McKenzie AN, Mebius RE, et al. (2013). Innate lymphoid cells–a proposal for uniform nomenclature. Nat. Rev. Immunol 13, 145–149. [DOI] [PubMed] [Google Scholar]
- Suto H, Nambu A, Morita H, Yamaguchi S, Numata T, Yoshizaki T, Shimura E, Arae K, Asada Y, Motomura K, et al. (2018). IL-25 enhances TH17 cell-mediated contact dermatitis by promoting IL-1b production by dermal dendritic cells. J. Allergy Clin. Immunol 142, 1500–1509.e10. [DOI] [PubMed] [Google Scholar]
- Thiboutot D, Jabara S, McAllister JM, Sivarajah A, Gilliland K, Cong Z, and Clawson G (2003). Human skin is a steroidogenic tissue: steroidogenic enzymes and cofactors are expressed in epidermis, normal sebocytes, and an immortalized sebocyte cell line (SEB-1). J. Invest. Dermatol 120, 905–914. [DOI] [PubMed] [Google Scholar]
- Vivier E, van de Pavert SA, Cooper MD, and Belz GT (2016). The evolution of innate lymphoid cells. Nat. Immunol 17, 790–794. [DOI] [PMC free article] [PubMed] [Google Scholar]
- Watt FM, Estrach S, and Ambler CA (2008). Epidermal Notch signalling: differentiation, cancer and adhesion. Curr. Opin. Cell Biol 20, 171–179. [DOI] [PMC free article] [PubMed] [Google Scholar]
- Yagi R, Zhong C, Northrup DL, Yu F, Bouladoux N, Spencer S, Hu G, Barron L, Sharma S, Nakayama T, et al. (2014). The transcription factor GATA3 is critical for the development of all IL-7Rα-expressing innate lymphoid cells. Immunity 40, 378–388. [DOI] [PMC free article] [PubMed] [Google Scholar]
- Zhong C, Cui K, Wilhelm C, Hu G, Mao K, Belkaid Y, Zhao K, and Zhu J (2016). Group 3 innate lymphoid cells continuously require the transcription factor GATA-3 after commitment. Nat. Immunol 17, 169–178. [DOI] [PMC free article] [PubMed] [Google Scholar]
Associated Data
This section collects any data citations, data availability statements, or supplementary materials included in this article.
Supplementary Materials
Figure S1. Characterization of Skin ILCs, Related to Figure 1
(A) Flow cytometry analysis showing expression of indicated cell surface proteins on ILCs (live CD45+, Lin−, Thy1.2+) from the epidermis, dermis and subcutis of WT mice. (B) Heatmap of RNA-seq transcriptome analysis of sorted ILCs from the epidermis, dermis and subcutis. (fold change > 2 and p value < 0.05) (C) ATAC-seq signal profiles of ILCs from epidermis, dermis and subcutis in genes associated with ILC effector cytokines. (A and C) Data are representative of more than two independent experiments (n > 3 per experiment) with similar results. (B) Data are pooled from two to three independent experiments.
Figure S2. GATA3 and RORγt Are Required for Skin ILCs to Gain Effector Functions, Related to Figure 2
Flow cytometry analysis of GATA3 and RORγt expression in Lin− Thy1.2+ ILCs. (B) Flow cytometry of RORγt fate-mapped mice (Rorc-Cre ROSA-EYFP). The proportions of EYFP+ cells in ILCs from the epidermis, dermis and subcutis. αβ T cells from the dermis are shown as a reference for Cre-recombinase efficiency in Rorc-Cre ROSA-EYFP. (C) Quantification of skin ILCs from Gata3fl/fl Cre-ERT2 mice. (D) Flow cytometry of skin ILCs from Gata3fl/fl Cre-ERT2 mice. Mice were treated with MC903 for 12 days. (E) Quantification of IL-13 and IL-17-producing skin ILCs from MC903-treated Gata3fl/fl Cre-ERT2 mice. (F) Measurements of ear thickness in MC903-treated Gata3fl/fl Cre-ERT2 mice. (G) Quantification of skin ILCs from RorcGFP/GFP mice. (H) Quantification of IL-13 and IL-17-producing skin ILCs from RorcGFP/GFP mice. (I) Ear thickness of MC903-treated WT and RorcGFP/GFP mice. (A, B and D) Data are representative of more than three independent experiments with similar results. (C, E, F, G, H and I) The data are shown as mean ± SD and were pooled from more than two independent experiments (n = 3 to 4 per experiment). Each dot represents an individual mouse. Student’s t-test was used to measure significance. *p < 0.05, **p < 0.01 and ***p < 0.001.
Figure S3. Turnover of Skin ILCs, Related to Figure 3
Flow cytometry of H2B-GFP;R26-M2rtTA mice that were treated with doxycycline for 6 days. Proportions of GFP+ cells in ILCs from the epidermis, dermis and subcutis and epidermal γδ T cells at indicated time points are shown.
Figure S4. Tissue Residency and Localization of ILCs, Related to Figure 4
(A) Flow cytometry analysis for TSLPR expression on ILCs (live CD45+, Lin−, Thy1.2+) from the epidermis, dermis and subcutis of WT mice. (B) Lin- IL-7Rα+ integrin α4β7+ Flt3- ILC precursors in bone marrow from indicated mice. CD25− cells are common ILC precursors and CD25+ are ILC2 precursors. (C) Analysis of lung and gut ILC2 and ILC3 in indicated mice. (D) Whole mount immunofluorescence microscopy of tail epidermal sheet visualized for indicated molecules (upper left and lower panel, scale bars = 50 μm, arrow heads indicate CD3- Thy1.2+ ILCs, dashed lines demarcate sebaceous glands) and quantification on the anatomical distribution of epidermal ILCs as compared to other lymphoid subsets in the epidermis (upper right panels). (A, B and D) Data are representative of more than two independent experiments with similar results. (C) The data are shown as mean ± SD and were pooled from more than two independent experiments (n = 3 to 4 per experiment). ANOVA with Tukey’s multiple comparison test was used to measure statistical significance. *p < 0.05, **p < 0.01 and ***p < 0.001.
Figure S5. Regulation of Sebaceous Glands Are Mediated by ILCs, Related to Figure 5
(A) Quantification of sebaceous gland sizes in tail skin epidermal sheets from WT, Rag2−/− and Rag2−/− Il2rg−/− mice at indicated ages. (B) Whole mount immunofluorescence staining of tail epidermal sheets from WT, Rag2−/− and Rag2−/− Il2rg−/− mice visualized for Ki-67 and LRIG1 (upper panels). Quantification of Ki-67+ sebocytes and the percentages of irregularly distributed Ki-67+ cells, which were defined as cells that resided outside of the LRIG1high junctional zone in the periphery of sebaceous glands (lower panels). (C) Flow cytometry of live CD45+ Lin− Thy1.2+ cells in the epidermis from WT, Il7−/− and Il7−/− Tslp−/− mice. Anti-CD2 antibody, which was included in lineage markers for other experiments, was independently stained. Proportions of CD2+ ICOS− epidermal lymphoid cells and CD2− ICOS+ ILCs are shown.
(A) The data are shown as mean ± SD and were pooled from more than two independent experiments (n = 3 to 4 per experiment). Each dot represents an individual sebaceous gland. ANOVA with Tukey’s multiple comparison test was used to measure significance. *p < 0.05, **p < 0.01 and ***p < 0.001. (B and C) Images and data are representative of more than two independent experiments with similar results.
Figure S6. TNF- and Lymphotoxin-Mediated Inhibition of Sebocyte Growth Is Associated with Downregulation of JAG2, Related to Figure 6
(A) BrdU incorporation in TNF- or lymphotoxins-treated SEB-1 cells. (B) Quantification of cell numbers of human sebocyte cell line (SEB-1) cultured with recombinant TNF, LTα3 and LTα1β2 at indicated concentrations for 3 days. (C) Expression of TNF and lymphotoxins as detected by single-cell RNA-seq (left) and the production of TNF was analyzed by flow cytometry (right). (D) siRNA knockdown of indicated genes on cultured SEB-1 cells. The number of cells from the 1st passage is shown (left). The efficiency of siRNA knockdown was evaluated via real-time PCR (right). (E) Images of Oil-red-O staining in tail epidermal sheets of Adam10fl/fl K15-CrePR1 mice. Right panel shows the quantification of sebaceous gland sizes. Scale bar = 50 μm. (A to C) Data are representatives of more than two independent experiments (n = 3 to 4 per experiment). (D and E) Data were pooled from more than two independent experiments (n = 3 to 4 per experiment). The data are shown as mean ± SD. ANOVA with Tukey’s multiple comparison test was used to measure significance. *p < 0.05, **p < 0.01 and ***p < 0.001.
Figure S7. Differential Role of Lymphocytes and ILCs on Skin Microbiome, Related to Figure 7
(A) Supervised LEfSE analysis of 16S rRNA sequencing analysis from skin swab samples of WT, Rag2−/− and Rag2−/− Il2rg−/− mice and (B) the proportions of Planococcacea and Staphylococcacea. (C) S. aureus was inoculated onto back skin of WT, Rag2−/− or Rag2−/− Il2rg−/− mice and the number of colonies cultured from skin swabs are shown for indicated time points. (D) Quantification of sebaceous gland sizes in tail skin epidermal sheets from WT, Rag2−/− and Rag2−/− Il2rg−/− mice after co-housing. (E) Quantification of sebaceous gland sizes of Rag2−/− Il2rg−/− mice after 8 weeks of antibiotics treatment with cefazolin and enrofloxacin. (F) LC-MS analysis of skin surface triglycerides of mice. (A to F) Data are representatives of, or pooled from, more than two independent experiments (n = 3 to 4 per experiment) with similar results. The data are shown as mean ± SD. ANOVA with Tukey’s multiple comparison test was used to measure significance. *p < 0.05, **p < 0.01 and ***p < 0.001.
Data Availability Statement
The accession number for the RNA-seq and ATAC-seq data reported in this paper is GEO: GSE120130.
The accession number for the microbiome sequence data reported in this paper is BioProject: PRJNA445721.
The accession number for the single-cell RNA-seq data reported in this paper is GEO: GSE120787.