

Abstract
How cellular and organismal complexity emerges from combinatorial expression of genes is a central question in biology. High-content phenotyping approaches such as Perturb-seq (single-cell RNA-seq pooled CRISPR screens) present an opportunity for exploring such genetic interactions (GIs) at scale. Here, we present an analytical framework for interpreting high-dimensional landscapes of cell states (manifolds) constructed from transcriptional phenotypes. We applied this approach to Perturb-seq profiling of strong GIs mined from a growth-based, gain-of-function GI map. Exploration of this manifold enabled ordering of regulatory pathways, principled classification of GIs (e.g. identifying suppressors), and mechanistic elucidation of synergistic interactions, including an unexpected synergy between CBL and CNN1 driving erythroid differentiation. Finally, we apply recommender system machine learning to predict interactions, facilitating exploration of vastly larger GI manifolds.
One Sentence Summary:
Rich phenotyping using single-cell RNA sequencing reveals principles and mechanisms of genetic interactions.
Introduction
The complexity of cell types in multicellular organisms is driven not by a large increase in gene number but instead by the combinatorial expression of a surprisingly small number of components. Specific combinations of genes exhibit emergent properties when expressed together, enabling the generation of many diverse cell types and behaviors. Searching for such emergent properties is enabled by the quantitative study of genetic interactions (GIs), which compare the phenotypic consequences of perturbing a pair of genes alone or in combination, typically by measuring growth (although other phenotypic readouts such as reporter gene expression and transcriptional responses have been explored) (1, 2). GIs can reveal synthetic lethal vulnerabilities in tumors, identify suppressors of inherited and acquired disorders, and guide the design of cocktails of genes to drive differentiation between cell types (3, 4). Pioneering efforts in yeast to construct systematic GI maps between all gene pairs have enabled systematic determination of gene function, identification of protein complexes and definition of gene regulatory networks in a principled and unbiased manner (1, 2).
Recent studies have extended such approaches to mammalian and other metazoan systems, but these efforts face two major challenges: scale and information content (1, 2). For example, mapping pairwise interactions among the ~10,000 transcribed genes in a human cell would require measuring ~50 million double mutants. This scale has necessitated the use of highly parallelizable readouts of phenotype, such as growth rate, that obscure the mechanistic or molecular basis for any particular interaction. Put simply, there are many ways for cells to appear equally “unfit”: the reprogramming of a pluripotent cell to a terminally differentiated neuron may affect growth as much as induction of apoptosis or cell cycle arrest. Furthermore, many metazoan cell types are quiescent or post-mitotic, and as such are not amenable to growth-based screens. Finally, bulk measures of their properties may obscure important cell-to-cell variability.
Emerging high-throughput approaches for monitoring rich phenotypes of individual cells (e.g. imaging or droplet single-cell transcriptomics) present a potential solution to these problems. For example, Perturb-seq pairs CRISPR-based screens with single-cell RNA sequencing (5–8). Each individual cell is in effect an independent experiment connecting a genetic perturbation to its transcriptional consequences, allowing hundreds of thousands of parallel measurements (9, 10). It has been suggested that the rich phenotypes enabled by Perturb-seq can be used to better interpret the impact of genetic interactions (7).
Here we exploit the scalability and rich transcriptome readout of Perturb-seq to implement a principled approach for systematically studying mammalian GIs. Each transcriptional measurement, and effectively each genetic perturbation (single or combinatorial), can be viewed as defining a point in high-dimensional space. By measuring many GIs, we therefore effectively map out a surface—a manifold in mathematical terminology—that describes the transcriptional states a cell can occupy upon perturbation (Fig. 1A). We argue that this GI manifold carries much more information about interactions than a traditional GI map, and is intrinsically more interpretable in several ways, including the ability to resolve the distinct outcomes underlying GIs and to model the different ways genetic perturbations combine to yield new phenotypes.
Figure 1. A CRISPRa fitness-level genetic interaction (GI) map.

(A) Experimental strategy. Pairs of genes were systematically co-activated using dual sgRNA CRISPRa libraries and a GI map was generated from the fitness measurements. A subset of GIs were then profiled transcriptionally using Perturb-seq. These high-dimensional measurements define a surface called a GI manifold. Distinct GIs that lie in markedly different parts of the GI manifold may result in similar outcomes when viewed only at the level of fitness. (B) CRISPRa fitness-level GI map. Gene-level GI profiles were clustered by average linkage hierarchical clustering based on Pearson correlation. Clusters were annotated by assigning DAVID annotations if a DAVID term was significantly enriched in that cluster (hypergeometric ln(p) ≤ −7.5; see Methods). (C-D) GI profile correlation between pairs of sgRNAs targeting any genes (black) or the same gene (green). Data is displayed as scatter plot of replicates (C) and histogram of replicate-averaged GIs (D). (E-F) Gene-level GI scores generated by averaging all sgRNA-level GIs for each gene pair. (E) Scatter plot of replicates. Red points indicate non-targeting control sgRNA pairs and dashed line indicates a radius of 6 standard deviations from non-targeting controls. (F) Histogram of gene-level GI scores with estimated empirical 5% FDR threshold. (G) Comparison of fold activation of target gene measured by Perturb-seq when the targeting sgRNA is in the A or B position in the dual sgRNA expression cassette. (H) Fold activation of the target gene compared with the total number of differentially expressed genes.
An overexpression strategy identifies strong genetic interactions
Most previous studies of GIs have focused on loss-of-function perturbations, but many important cellular processes like differentiation are also associated with the expression of new genes (e.g. MYOD1 in muscle cells). Genes that exhibit phenotypes when expressed alone have a higher rate of genetic interactions with other genes (1, 2). To identify mechanistically diverse GIs arising from gene activation, we therefore selected 112 “hit” genes whose activation enhances or retards growth of K562 cells (Fig. 1A, Table S1) (11), including cell cycle regulators, transcription factors, kinases, phosphatases, as well as genes of unknown function.
To systematically measure gain-of-function (overexpression) GIs, we adapted a technology developed for constructing fitness GI maps in human cells using CRISPRi (12) (Fig. 1A–B and fig. S1). Each candidate interaction was probed by constructing a library of vectors containing pairs of sgRNAs (Table S2). As we included two distinct sgRNAs targeting each gene, a total of 28,680 unique sgRNA pairs were tested. K562 cells stably expressing the SunTag CRISPRa system (11) were transduced with the CRISPRa GI library, and sgRNA pair abundance was compared at the start of the screen and after ten days of growth to measure fitness phenotypes. GI scores were assigned by measuring deviation between the observed fitness of overexpressing both genes from the expected fitness based on the average impact of each single gene ((12); see Methods; fig. S2, Table S3). Independent replicate experiments showed high levels of concordance for sgRNA-level GI scores and GI profile correlations, and independent sgRNAs targeting the same gene were much more similar than the background of all sgRNA GI correlations (median R=0.50 compared to 0.04; Fig. 1C,D and fig. S3A, Table S4). The gene-level GI scores obtained by averaging sgRNAs targeting the same gene were also well correlated between replicates (gene-level GI R=0.80, p<10−300; Fig. 1E, S3A, Table S5) and followed a bell-shaped distribution but with GIs ranging well beyond the expectation from negative control sgRNAs (Fig. 1F and fig. S3B).
We then clustered genes according to the similarity of their GI profiles to produce a GI map (Fig. 1B; larger version with gene labels provided in fig. S4). Highly correlated genes were enriched for genes with the same DAVID term annotations (13), allowing for unbiased annotation of clusters (Fig. 1B and fig. S5A–B, Table S6). In addition, the map contained fewer clusters than would be expected in a random map (fig. S5C–D), consistent with the typical low-rank structure of GI maps (i.e. groups of genes interact similarly so that there are fewer overall degrees of freedom than total genes). Thus the structure of the CRISPRa GI map, like past efforts based on loss-of-function alleles, can assign function to individual genes by the similarity of GI profiles (1, 2). However, though the GI map robustly identified many strong GIs, the origins of specific interactions were difficult to deduce as each GI was characterized only by a single scalar value (i.e. deviation from expected growth rate).
A Perturb-seq platform for measuring GIs
We reasoned that Perturb-seq, which allows single-cell, pooled transcriptional profiling of CRISPR-mediated perturbations (5–8), would enable us to better resolve the mechanisms underlying GIs. We picked 132 gene pairs from the GI map, chosen both within and between blocks of genes with similar interaction profiles, and targeted each with CRISPRa sgRNA pairs (Fig. 1A, fig. S6A, Table S2, Methods). Given the low-rank structure of the fitness GI map, we reasoned that we could broadly sample the biological processes represented without measuring all gene pairs, as many GIs that fell into the “blocks” in the GI map were likely explained by similar mechanisms (Methods). We also profiled all single gene perturbations to enable direct comparison of individual and combined perturbations (i.e. single gene A, single gene B, and pair AB). In total, we obtained transcriptional readouts for 287 perturbations measured across ~110,000 single cells (median 273 cells per condition, Methods, fig S1, and Table S7) in one pooled experiment.
The Perturb-seq profiles also allowed us to directly assess the performance of our CRISPRa reagents (Table S7). Levels of target gene activation spanned a broad range (Fig. 1G and fig. S6B–C), with a general trend that poorly expressed targets were more highly induced. The A and B positions of the sgRNA cassette performed similarly (Fig. 1G, fig. S6D–E), and expression of genes neighboring the target was generally unperturbed except when transcripts shared promoter regions (Methods; fig. S7A–B, Table S8). Finally, there was minimal correlation between fold activation and the number of differentially expressed genes, implying that even small increases in the mRNA abundance of some genes can strongly alter a cell’s state (R=0.07; Fig. 1H). The degree of fitness defect was related to the number of differentially expressed genes (fig. S7C).
Constructing a GI manifold reveals biological processes driving GIs
While GI maps assign a scalar score to each GI, our Perturb-seq approach instead associates a transcriptional phenotype. We viewed this ensemble of measurements as defining a high-dimensional analogue of a GI map, here termed a GI manifold. In our manifold analogy, each possible cellular transcriptional state defines a point on a high-dimensional surface. By applying a diverse set of perturbations and measuring the resulting states (as we have), it becomes possible to infer the shape of this surface (Fig. 1A). Moreover, as each GI is characterized by a rich phenotype, we envisioned that this perspective would allow us to organize GIs by common features and globally examine their mechanistic underpinnings.
To visualize this GI manifold, we used UMAP (uniform manifold approximation and projection, (14)) to project the mean expression profiles for our 287 perturbations into a two-dimensional plane (Fig. 2A–B, single-cell version in fig. S8). This algorithm approximates the shape of a high-dimensional surface in two dimensions by trying to conserve nearest neighbor relationships. Perturbations that induced similar transcriptional changes then naturally clustered close to each other; we defined stable clusters using the HDBSCAN algorithm ((15), Methods). Both fitness and GI scores were distributed throughout the GI manifold (Fig. 2C–D), in accordance with the idea that scalar fitness measurements collapse the much larger landscape of transcriptional states (Fig. 1A). In contrast, by overlaying markers derived from the underlying transcriptional data, we could gain insight into mechanism by looking at common features of perturbations within each cluster. For example, one cluster of mean expression profiles (“G1 cell cycle arrest”) contained canonical regulators of the cell cycle. In this case, the underlying single-cell data confirmed that these perturbations induced cell cycle arrest in the expected cell cycle stages (Fig. 2E–F), explaining the growth defect.
Figure 2. Visualization of the GI manifold.
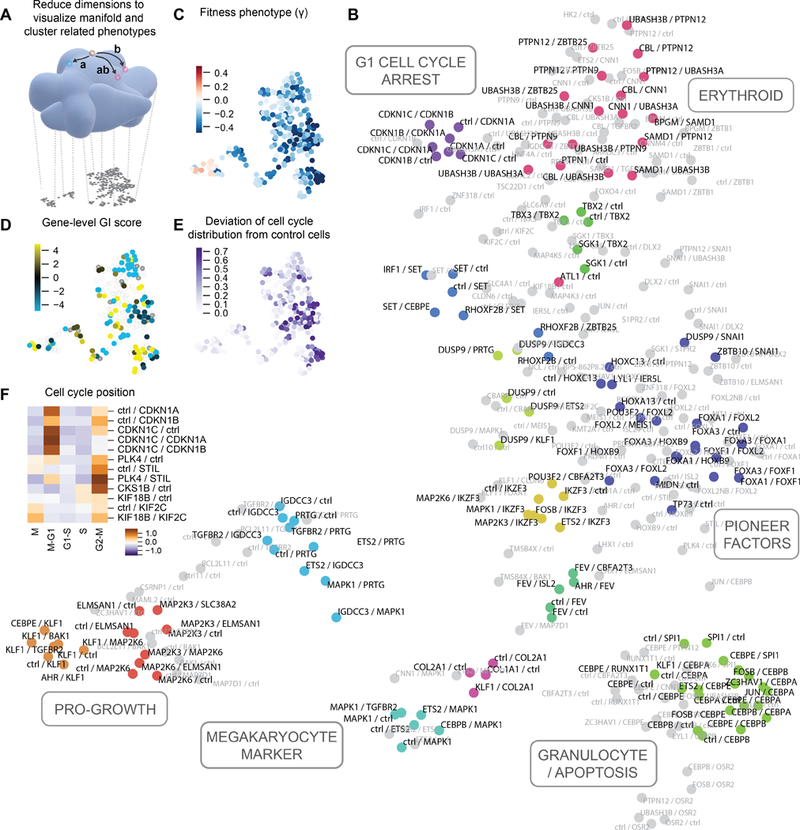
(A) Using diverse genetic perturbations, the structure of the GI manifold can be inferred and then visualized by dimensionality reduction to a plane. (B) UMAP projection of all single gene and gene pair Perturb-seq profiles. Each dot represents a genetic perturbation characterized by its mean expression profile. Clusters of transcriptionally similar perturbations are colored identically, while grey dots are perturbations that do not fall within stable clusters. (C) Fitness measurements from the GI map, expressed as gene pair growth phenotypes (γ). (D) GI scores from the fitness-level GI map. Single gene perturbations are not included. (E) Cell cycle deviation scores. Stronger scores indicate alteration from the distribution of cell cycle positions observed in unperturbed cells. (F) Relative enrichment or depletion of cell cycle phases relative to unperturbed cells induced by selected genetic perturbations.
Interestingly, we observed clusters of perturbations that caused cells to induce erythroid, granulocyte or megakaryocyte markers, which is consistent with the known multilineage potential of the K562 model (Fig. 2B, 3A–B and fig. S9) (16, 17). These results suggested that cell differentiation/priming and a concomitant decrease in proliferation explained some of the structure of the GI manifold. For example, many interactions surrounding CBL, its regulators UBASH3A/B, and several multi-substrate tyrosine phosphatases (e.g. PTPN9/12) induced erythroid markers, suggesting a common mechanism in regulation of receptor tyrosine kinase signaling (18). By contrast, the granulocyte cluster mostly contained perturbations of canonical regulators such as C/EBP-α, -β, -ε (CEBPA/B/E) and PU.1 (SPI1). Finally, a cluster of perturbations induced expression of the canonical megakaryocyte marker CD41, but these cells did not adopt the characteristic morphological features of megakaryocytes by microscopy (fig. S9G), suggesting that they are at best primed towards megakaryocytic differentiation (16, 17).
Figure 3. Dissecting a genetic interaction using Perturb-seq.

(A) Expression of marker genes for different hematopoietic cell types in GI manifold UMAP projection. Color is scaled by mean expression Z-score of a marker gene panel. (B) Hematopoietic differentiation hierarchy. K562 cells are a poorly differentiated erythroid-like cancer cell line. (C) Perturb-seq profiling of the CBL/CNN1 GI. Average transcriptional profiles for the two constituent single perturbations are compared to the double perturbation. Heatmaps show deviation in gene expression relative to unperturbed cells. (D) UMAP projection of single-cell Perturb-seq data in the CBL/CNN1 interaction. Each dot is a cell colored according to genetic background. (E) ARCHS4 (35) cell type term enrichment for genes showing large expression changes in CBL/CNN1 doubly-perturbed cells. (F) Expression of hemoglobin in HUDEP2 cells upon cDNA overexpression of CBL or CNN1. Hemoglobin was labeled with anti-HbF antibody and measured by flow cytometry. (G) Pelleted HUDEP2 cells. Hemoglobin expression appears red.
To test our ability to better resolve specific interactions using Perturb-seq, we examined a strong synergistic interaction identified by our fitness GI map between CBL and CNN1 (calponin) that belonged to the erythroid cluster. CNN1 is a poorly characterized gene that is annotated as a smooth-muscle-specific protein, although it is expressed in many cell types (19, 20). Overexpressing either gene induced similar transcriptional changes, and single-cell analysis revealed an apparent progression of phenotypes from unperturbed through singly-perturbed to doubly-perturbed CBL/CNN1 cells (Fig. 3C,D). Consistent with an erythroid transcriptional program, overexpression of CBL and CNN1 caused strong induction of canonical markers: hemoglobin genes (6 – 39-fold), an iron importer involved in heme biosynthesis (SLC25A37, 13-fold), and the blood group antigen CD235a (GYPA, 2-fold) (Fig. 3C and 3E and fig. S10A–B) (17). Furthermore, overexpression of CBL and CNN1 transgenes in a human erythroid progenitor model (HUDEP2 cells) individually and in combination also induced markers of erythroid differentiation (Fig. 3F–G and fig. S10C–D) (21).
This example highlighted how Perturb-seq analysis can directly lead to a hypothesis about the biology underlying a GI even when one of the components is poorly understood. More generally, because our approach was sensitive to single-cell phenotypes, incomplete differentiation and could simultaneously detect signatures of multiple differentiation states, it could facilitate higher-order combinatorial perturbation screens aimed at improving protocols for driving cells into distinct differentiation states.
Quantitative modeling of GIs defines mechanisms of interaction
Our large collection of matched single and double overexpression transcriptional phenotypes provides us with the opportunity to quantitatively model GIs directly from transcription profiles, without appealing to the fitness GI map. We devised an approach based on fitting a regression model δab = c1δa + c2δb + ϵ that decomposes the transcriptional changes observed in doubly perturbed cells (δab) as a linear combination of the transcriptional changes induced by the two single perturbations of gene a and b (c1δa + c2δb) and an error term (ϵ) that contains unmodeled or nonlinear effects. The coefficients c1 and c2 then effectively measure how much of the phenotype is accounted for by each single perturbation (Fig. 4A). This linear model of transcriptional GIs explained more than 70% of the variance in gene expression on average (Fig. 4B; mean R2 = 0.71).
Figure 4. A quantitative model for high-dimensional GIs.

(A) Model of transcriptional genetic interactions. Different transcriptional states define points on the surface of the GI manifold and genetic perturbations define vectors of travel. The model decomposes double perturbations as a linear combination of the two constituent single perturbations. (B) Model fit across all GIs measured with Perturb-seq. (C) Magnitude of model coefficients compared to GI score from the fitness-level GI map. (D-E) Application of the model to selected GIs. For each GI, transcriptional profiles for the two constituent single perturbations are compared to the double perturbation and the model fit. Heatmaps show deviation in gene expression relative to unperturbed cells. (F) Visualization of all measured GIs in Perturb-seq experiment. Each GI was characterized using features derived from the model (x-axis) and by measures of similarity among the transcriptional profiles (y-axis). These two viewpoints were each clustered and collapsed to a single dimension using UMAP to define the two axes. The features defining the two axes are plotted next to them. Categories of GIs are annotated based on features shared within the clusters.
GI maps traditionally classify interactions as either buffering (indicating antagonism, GI score positive) or synthetic sick/lethal (SSL, indicating synergy, GI score negative). We observed a robust anti-correlation (R = −0.72) between the magnitude of the coefficients c1 and c2 and the fitness-based GI score (Fig. 4C). An intuitive explanation was that buffering interactions travel less “far” (smaller coefficients) along the GI manifold while SSL interactions travel further (bigger coefficients) (Fig. 4A).
To explore the ability of Perturb-seq to better resolve GIs (by analogy with past efforts in other systems, (1, 22, 23)), we examined two strong buffering interactions that each had scores of +10.1 in our fitness GI map but appeared to behave differently on a transcriptional level. Analysis by Perturb-seq revealed that the GI between KLF1 and CEBPA resulted from genetic epistasis (i.e. one single overexpression phenotype masking the other), resulting in smaller, asymmetrical coefficients (c1 = 0.19, c2 = 0.72, Fig. 4D and fig. S11A). By contrast, the PTPN12/SNAI1 GI resulted from genetic suppression (i.e. when combined overexpression of two genes attenuated each other’s individual phenotypes), resulting in two smaller coefficients (e.g. PTPN12/SNAI1, c1 = 0.60, c2 = 0.57, Fig. 4E and fig. S11B). Finally, as discussed above, synergistic or synthetic lethal interactions tended to result in two larger coefficients (e.g. CBL/CNN1, c1 = 1.24, c2 = 0.8, Fig. 3C and fig. S11C).
A central question when considering GIs is how often new or unexpected (neomorphic) phenotypes emerge through the combined action of genes. A relatively small number of GIs (lower mode in Fig. 4B) deviated from the expectation given by the linear model (which we quantified by distance correlation d, Methods, fig. S11D). A common neomorphic behavior, similar to one observed in yeast (22), occurred when a perturbation that had little transcriptional effect on its own appeared to enhance the effects of a second perturbation (e.g. FEV/CBFA2T3, d = 0.74, fig. S11E). We also observed relatively rare instances where double phenotypes appeared to be completely unexpected (e.g. the physical interactors PLK4/STIL ((24) d = 0.53, fig. S11F)). The model’s parameters thus provided a simple, useful summary of how perturbations combine (Table S9).
To look for structure among interactions, we used a two-dimensional visualization and clustering technique (25) (Table S9 and Methods). One axis grouped interactions according to properties derived from the model coefficients (c1, c2, d), while the other grouped interactions according to how correlated the underlying transcriptional responses were (Methods). The resulting figure (Fig. 4F) identified numerous distinct categories of interaction, showing that the model can serve as a generalization of the one-dimensional “buffering vs. synthetic lethal” paradigm that has typically been used to categorize genetic interactions.
Ordering genes into linear pathways using Perturb-seq
The linear GI model allowed us to make hypotheses about gene regulation, as it can identify, for example, which single perturbation phenotype better explains the double perturbation phenotype. We examined the strong GIs among the genes DUSP9, ETS2, and MAPK1. In the DUSP9/ETS2 interaction (Fig. 5A), the DUSP9 phenotype dominated, suggesting that DUSP9 overexpression antagonized ETS2. Similarly, DUSP9 and MAPK1 antagonized each other’s activities (Fig. 5B). Finally, ETS2 and MAPK1 induced similar phenotypes, and ETS2 transcription was activated in all backgrounds (9.3-fold in MAPK1, 9.2-fold in ETS2, and 35.8-fold in MAPK1/ETS2 overexpression, Fig. 5C). This type of interaction, in which a perturbation (MAPK1) acts at least partly by upregulating its partner (ETS2), was uncommon in our dataset (fig. S11G). Taken together, these results suggested a linear regulatory pathway in which DUSP9 (a phosphatase) inhibits MAPK1 (a kinase) that activates ETS2 (a transcription factor), which is consistent with the known biology of these gene families (Fig. 5D) (26). Following similar logic, the model allowed us to orient all the buffering interactions in which one perturbation is epistatic to another (Fig. 5E).
Figure 5. Inferring gene regulatory logic underlying GIs.

(A)-(C) Application of linear genetic interaction model to GIs among DUSP9, MAPK1, and ETS2. (D) Order of pathway inferred from model fits. (E) Epistatic buffering interactions oriented using the genetic interaction model. Each arrow denotes a genetic interaction, originating in the gene that dominates when the two genes are simultaneously perturbed. Arrow size denotes the degree of dominance as measured by asymmetry of model coefficients. Genetic perturbations with similar transcriptional profiles are colored identically. (F) Stochastic heterogeneity can cause individual cells (dots) bearing a given genetic perturbation to explore the space on the GI manifold surrounding the average direction of travel (arrows). (G) UMAP projection of single cells with overexpression of DUSP9 and/or MAPK1. Black line represents the principal curve, which tracks the primary direction of variation in the dataset that can be used to order all cells. (H) Gene expression averaged along the principal curve. Each row denotes a cell ordered according to position along the principal curve. The left three columns indicate that cell’s genetic background. At each point, cells that are close on the principal curve are averaged to produce a local estimate of median gene expression. The heatmap shows normalized expression of differentially expressed genes. The DUSP9 and MAPK1 expression columns show the same data for the targeted genes.
Single-cell heterogeneity reveals the trajectory of GIs
The single-cell resolution afforded by Perturb-seq can reveal phenotypic heterogeneity for some GIs that we reasoned could yield further insight into mechanism (Fig. 5F and cf. fig S8). For example, cells overexpressing both DUSP9 and MAPK1 showed a range of phenotypes spanning the transcriptional states observed in cells overexpressing either DUSP9 or MAPK1 alone (Fig. 5G). In particular, we observed cells in which DUSP9 and MAPK1 appeared to suppress each other’s activity entirely.
We reasoned that we could then identify DUSP9 or MAPK1 regulatory targets that showed differing sensitivity to the levels of these proteins by exploiting single-cell data. To order cells in an unbiased way by “phenotype,” we computed a principal curve measuring the path of maximum variation in the data set ((27); Fig. 5G, Methods). Examining median-filtered gene expression (Methods) along this curve revealed distinct classes of transcripts regulated by DUSP9 or MAPK1 activity (e.g. GYPA appeared to be more sensitive to DUSP9 activity than HBZ, Fig. 5H and fig. S12A). This variation did not appear to be the result of stable differences in the expression of MAPK1 and DUSP9 (fig. S12B), suggesting a possible role either for historical differences or stochastic gene expression. Perturb-seq can therefore reveal graded phenotypes resulting from antagonism between two proteins.
Predicting GIs using a recommender system
One possible strategy to address the scale of genetic interactions is to pursue a split experimental/computational approach, in which only a subset of interactions are sampled (either randomly or through “compressed” experimental designs (28)) and the remainder are predicted computationally (Fig. 6A) (7, 29, 30). Perturb-seq provides a scalable means of constraining these types of searches (7), enabling exploration of the GI landscape.
Figure 6. A recommender system for exploring the GI landscape.

(A) Schematic of prediction strategy. Fitness phenotypes of a limited subset of GIs are measured. Each gene is characterized by its Perturb-seq transcriptional profile, and similarity among these profiles is used as side information to constrain a recommender system model to impute remaining fitness GI scores and highlight regions of interest. (B) True vs. predicted GI map obtained by prediction from 10% of randomly sampled fitness-level GIs. (C) Block-averaged true and predicted GI maps obtained by averaging GI scores within clusters. (D) Scatter plot of true and predicted GI scores (blue dots) from (B). The dashed lines show 5% and 95% quantiles, used to designate strong GIs. Orange dots show equivalent scatter for block-averaged GI scores in (C). (E) Spearman correlation between true and predicted GI scores at different levels of random sampling. Fifty random subsets were measured for each sampling level. Blue and orange denote individual and block-averaged GIs. (F) Cophenetic correlation of GI profiles as a function of sampling level, measuring the similarity of correlation structure in the true and predicted GI maps. (G) To assess scaling ability, the representation of each perturbation in the Perturb-seq experiment was randomly downsampled to different levels of representation. Plot shows cophenetic correlation between downsampled and true transcriptional profiles used to construct the GI manifold visualization of Figure 2.
There is substantial similarity between this problem and that of predicting a person’s shopping preferences based on past buying behavior, which is commonly addressed via “recommender system” algorithms. Many of these approaches can exploit low-rank structure like that seen in GI maps and leverage additional side information obtained by other means to improve predictive power. We examined the Perturb-seq profiles of single gene overexpression (fig. S13A) and found that there was a modest concordance between GI profile and Perturb-seq profile correlations (R=0.29, p<10−103; fig. S13B), suggesting that the transcriptional data provided a complementary, scalable means of comparing genes that might inform GI prediction.
We constructed a matrix factorization model for fitness GIs and then constrained this model to encourage similar interaction profiles among genes that induced similar transcriptional changes (fig. S14A and materials and methods) (30, 31). We then predicted unobserved GIs using this model trained on different fractions of randomly subsampled interactions (Fig. 6A and materials and methods). The end result (Fig. 6B–D) preserved much of the large–scale structure of the map as seen through block averaging of GI scores (Fig. 6C–D; fig. S14B and materials and methods). Our approach was also substantially better than random sampling at predicting the top 10% of interactions and reasonably preserved both the rank order of all interactions (Spearman ρ ≈ 0.5 at 10% sampling; Fig. 6D–E and fig S14C) and the pairwise similarities between GI profiles (Fig. 6F). Notably, the use of Perturb–seq–derived single perturbation profiles as side information substantially improved performance (fig. S14D). These results suggest that the hybrid approach can nominate blocks of GIs for in-depth study.
Finally, we used our data to model the minimum number of cells that would be required to perform larger experiments. By down-sampling our measured perturbations and re-performing our analyses, we observed that as few as 50 cells per perturbation could be sufficient, meaning ~106 cells to collect side information for the entire set of protein coding sequences (Fig. 6G).
Discussion
A central goal of genetics is to understand the relationship between the set of genes a cell expresses and its phenotype. However, this relationship is challenging to study because many phenotypes emerge only through the coordinated action of multiple genes. Here, we used Perturb-seq to manipulate a large number of gene pairs and then measure the resulting changes in cell state. This ensemble of measurements described a high-dimensional surface called a GI manifold. By interpreting and modeling the GI manifold, we can gain several insights into how complex phenotypes emerge.
First, the transcriptional profiles can distinguish distinct outcomes such as cell death, slow growth, and differentiation to a variety of cell states that would appear equivalent at fitness level. We also identified both canonical (e.g. KLF1, GATA1) and unexpected genes (e.g. CNN1) that interacted to promote differentiation to a specific cell state (erythrogenesis). As our single-cell approach is sensitive to multiple outcomes or perturbations with incomplete penetrance, it is a natural strategy to pursue combinatorial searches for factors driving (trans)differentiation (4). Second, the shape of the GI manifold can reveal how GIs arise. We derived a simple, geometric GI model and used it to identify the different ways in which genetic perturbations combine to yield new phenotypes, for example allowing us to order genes into linear pathways. We and others have established that functionally related genes interact similarly—in geometric terms the GI manifold is therefore highly constrained, enabling imputation strategies (1, 2, 7, 12, 29). Our results provide a strategy for exploring large spaces of combinatorial genetic interactions by measuring only a subset of fitness-level GIs. This provides a complementary approach to efforts based on composite measurements, compressed sensing, and rich readouts to predict unmeasured GIs (7, 28). By intelligently measuring and exploring the GI manifold, one can start to create a global view of the nonlinear mapping between genotype and phenotype. Such approaches should enable large-scale searches for synthetic lethal interactions in cancer, the discovery of gene targets that lessen the severity of genetic disease, and, more generally, the understanding of how complex, multigenic interactions govern biological traits and disease risk.
Supplementary Material
Acknowledgments
We thank B. Adamson, O. Chen, M. Cho, J. Corn, C. Forester and J. Hussmann, S. Weissman, the Innovative Genomics Institute and members of the Weissman and Gilbert labs for discussion or reagents.
Funding:
This work was funded by grants from the National Institutes of Health (P50 GM102706, U01 CA168370, U01 CA217882, RM1 HG009490, R01 DA036858 to JSW, K99/R00 CA204602 and DP2 CA239597 to LAG, and F32 GM116331 to MJ) and by DARPA HR0011–19-2–0007 to JSW and LAG. JSW is a Howard Hughes Medical Institute Investigator. LAG is the Goldberg-Benioff Endowed Professor in Prostate Cancer Translational Biology. T.M.N. is a fellow of the Damon Runyon Cancer Research Foundation DRG-2211–15. M.A.H. is a Byers Family Discovery Fellow and is supported by the UCSF Medical Scientist Training Program and the School of Medicine.
Footnotes
This manuscript has been accepted for publication in Science. This version has not undergone final editing. Please refer to the complete version of record at https://www.sciencemag.org/. The manuscript may not be reproduced or used in any manner that does not fall within the fair use provisions of the Copyright Act without the prior, written permission of AAAS.
Competing Interests: TMN, MAH, LAG, MJ, and JSW have filed patent applications related to CRISPRi/a screening, Perturb-seq and GI mapping. JSW consults for and holds equity in KSQ Therapeutics, Maze Therapeutics, and Tenaya Therapeutics. JSW is a venture partner at 5AM Ventures. TMN, MJ, JMR and MAH consult for Maze Therapeutics.
Data and materials availability: All data are available in the manuscript or the supplementary materials or GEO (GSE133344). Notebooks implementing analyses are available at github.com/mhorlbeck and github.com/thomasmaxwellnorman.
References and Notes
- 1.Costanzo M, Kuzmin E, van Leeuwen J, Mair B, Moffat J, Boone C, Andrews B, Global Genetic Networks and the Genotype-to-Phenotype Relationship. Cell 177, 85–100 (2019). [DOI] [PMC free article] [PubMed] [Google Scholar]
- 2.Domingo J, Baeza-Centurion P, Lehner B, The Causes and Consequences of Genetic Interactions (Epistasis). Annu Rev Genomics Hum Genet (2019), 10.1146/annurev-genom-083118-014857. [DOI] [PubMed]
- 3.Hartman JL, Garvik B, Hartwell L, Principles for the buffering of genetic variation. Science 291, 1001–1004 (2001). [DOI] [PubMed] [Google Scholar]
- 4.Takahashi K, Yamanaka S, Induction of pluripotent stem cells from mouse embryonic and adult fibroblast cultures by defined factors. Cell 126, 663–676 (2006). [DOI] [PubMed] [Google Scholar]
- 5.Jaitin DA, Weiner A, Yofe I, Lara-Astiaso D, Keren-Shaul H, David E, Salame TM, Tanay A, van Oudenaarden A, Amit I, Dissecting Immune Circuits by Linking CRISPR-Pooled Screens with Single-Cell RNA-Seq. Cell 167, 1883–1896.e15 (2016). [DOI] [PubMed] [Google Scholar]
- 6.Adamson B, Norman TM, Jost M, Cho MY, Nuñez JK, Chen Y, Villalta JE, Gilbert LA, Horlbeck MA, Hein MY, Pak RA, Gray AN, Gross CA, Dixit A, Parnas O, Regev A, Weissman JS, A Multiplexed Single-Cell CRISPR Screening Platform Enables Systematic Dissection of the Unfolded Protein Response. Cell 167, 1867–1882.e21 (2016). [DOI] [PMC free article] [PubMed] [Google Scholar]
- 7.Dixit A, Parnas O, Li B, Chen J, Fulco CP, Jerby-Arnon L, Marjanovic ND, Dionne D, Burks T, Raychndhury R, Adamson B, Norman TM, Lander ES, Weissman JS, Friedman N, Regev A, Perturb-seq: Dissecting molecular circuits with scalable single cell RNA profiling of pooled genetic screens. Cell 167, 1853–1866.e17 (2016). [DOI] [PMC free article] [PubMed] [Google Scholar]
- 8.Datlinger P, Rendeiro AF, Schmidl C, Krausgruber T, Traxler P, Klughammer J, Schuster LC, Kuchler A, Alpar D, Bock C, Pooled CRISPR screening with single-cell transcriptome readout. Nat. Methods 14, 297–301 (2017). [DOI] [PMC free article] [PubMed] [Google Scholar]
- 9.Gasperini M, Hill AJ, McFaline-Figueroa JL, Martin B, Kim S, Zhang MD, Jackson D, Leith A, Schreiber J, Noble WS, Trapnell C, Ahituv N, Shendure J, A Genome-wide Framework for Mapping Gene Regulation via Cellular Genetic Screens. Cell 176, 377–390.e19 (2019). [DOI] [PMC free article] [PubMed] [Google Scholar]
- 10.Replogle JM, Xu A, Norman TM, Meer EJ, Terry JM, Riordan D, Srinivas N, Mikkelsen TS, Weissman JS, Adamson B, Direct capture of CRISPR guides enables scalable, multiplexed, and multi-omic Perturb-seq. bioRxiv, 503367 (2018).
- 11.Gilbert LA, Horlbeck MA, Adamson B, Villalta JE, Chen Y, Whitehead EH, Guimaraes C, Panning B, Ploegh HL, Bassik MC, Qi LS, Kampmann M, Weissman JS, Genome-Scale CRISPR-Mediated Control of Gene Repression and Activation. Cell 159, 647–661 (2014). [DOI] [PMC free article] [PubMed] [Google Scholar]
- 12.Horlbeck MA, Xu A, Wang M, Bennett NK, Park CY, Bogdanoff D, Adamson B, Chow ED, Kampmann M, Peterson TR, Nakamura K, Fischbach MA, Weissman JS, Gilbert LA, Mapping the Genetic Landscape of Human Cells. Cell 174, 953–967.e22 (2018). [DOI] [PMC free article] [PubMed] [Google Scholar]
- 13.Huang DW, Sherman BT, Lempicki RA, Bioinformatics enrichment tools: paths toward the comprehensive functional analysis of large gene lists. Nucleic Acids Res 37, 1–13 (2009). [DOI] [PMC free article] [PubMed] [Google Scholar]
- 14.McInnes L, Healy J, Melville J, UMAP: Uniform Manifold Approximation and Projection for Dimension Reduction (2018) (available at https://arxiv.org/abs/1802.03426v2).
- 15.McInnes L, Healy J, Astels S, hdbscan: Hierarchical density based clustering. The Journal of Open Source Software 2, 205 (2017). [Google Scholar]
- 16.Alitalo R, Induced differentiation of K562 leukemia cells: a model for studies of gene expression in early megakaryoblasts. Leuk. Res 14, 501–514 (1990). [DOI] [PubMed] [Google Scholar]
- 17.Orkin SH, Zon LI, Hematopoiesis: An Evolving Paradigm for Stem Cell Biology. Cell 132, 631–644 (2008). [DOI] [PMC free article] [PubMed] [Google Scholar]
- 18.Kowanetz K, Crosetto N, Haglund K, Schmidt MHH, Heldin C-H, Dikic I, Suppressors of T-cell Receptor Signaling Sts-1 and Sts-2 Bind to Cbl and Inhibit Endocytosis of Receptor Tyrosine Kinases. J. Biol. Chem 279, 32786–32795 (2004). [DOI] [PubMed] [Google Scholar]
- 19.Winder SJ, Walsh MP, Calponin: thin filament-linked regulation of smooth muscle contraction. Cell. Signal 5, 677–686 (1993). [DOI] [PubMed] [Google Scholar]
- 20.GTEx Consortium, Laboratory, Data Analysis &Coordinating Center (LDACC)—Analysis Working Group, Statistical Methods groups—Analysis Working Group, Enhancing GTEx (eGTEx) groups, NIH Common Fund, NIH/NCI, NIH/NHGRI, NIH/NIMH, NIH/NIDA, Biospecimen Collection Source Site—NDRI, Biospecimen Collection Source Site—RPCI, Biospecimen Core Resource—VARI, Brain Bank Repository—University of Miami Brain Endowment Bank, Leidos Biomedical—Project Management, ELSI Study, Genome Browser Data Integration &Visualization—EBI, Genome Browser Data Integration &Visualization—UCSC Genomics Institute, University of California Santa Cruz, Lead analysts:, Laboratory, Data Analysis &Coordinating Center (LDACC):, NIH program management:, Biospecimen collection:, Pathology:, eQTL manuscript working group:, Battle A, Brown CD, Engelhardt BE, Montgomery SB, Genetic effects on gene expression across human tissues. Nature 550, 204–213 (2017).29022597 [Google Scholar]
- 21.Kurita R, Suda N, Sudo K, Miharada K, Hiroyama T, Miyoshi H, Tani K, Nakamura Y, Establishment of immortalized human erythroid progenitor cell lines able to produce enucleated red blood cells. PLoS ONE 8, e59890 (2013). [DOI] [PMC free article] [PubMed] [Google Scholar]
- 22.van Wageningen S, Kemmeren P, Lijnzaad P, Margaritis T, Benschop JJ, de Castro IJ, van Leenen D, Groot Koerkamp MJA, Ko CW, Miles AJ, Brabers N, Brok MO, Lenstra TL, Fiedler D, Fokkens L, Aldecoa R, Apweiler E, Taliadouros V, Sameith K, van de Pasch LAL, van Hooff SR, Bakker LV, Krogan NJ, Snel B, Holstege FCP, Functional overlap and regulatory links shape genetic interactions between signaling pathways. Cell 143, 991–1004 (2010). [DOI] [PMC free article] [PubMed] [Google Scholar]
- 23.Van Driessche N, Demsar J, Booth EO, Hill P, Juvan P, Zupan B, Kuspa A, Shaulsky G, Epistasis analysis with global transcriptional phenotypes. Nat. Genet 37, 471–477 (2005). [DOI] [PubMed] [Google Scholar]
- 24.Ohta M, Ashikawa T, Nozaki Y, Kozuka-Hata H, Goto H, Inagaki M, Oyama M, Kitagawa D, Direct interaction of Plk4 with STIL ensures formation of a single procentriole per parental centriole. Nat Commun 5, 5267 (2014). [DOI] [PMC free article] [PubMed] [Google Scholar]
- 25.Cheng Y, Wong MT, van der Maaten L, Newell EW, Categorical Analysis of Human T Cell Heterogeneity with One-Dimensional Soli-Expression by Nonlinear Stochastic Embedding. J. Immunol 196, 924–932 (2016). [DOI] [PMC free article] [PubMed] [Google Scholar]
- 26.Caunt CJ, Keyse SM, Dual-specificity MAP kinase phosphatases (MKPs). FEBS J 280, 489–504 (2013). [DOI] [PMC free article] [PubMed] [Google Scholar]
- 27.Trapnell C, Cacchiarelli D, Grimsby J, Pokharel P, Li S, Morse M, Lennon NJ, Livak KJ, Mikkelsen TS, Rinn JL, The dynamics and regulators of cell fate decisions are revealed by pseudotemporal ordering of single cells. Nat. Biotechnol 32, 381–386 (2014). [DOI] [PMC free article] [PubMed] [Google Scholar]
- 28.Cleary B, Cong L, Cheung A, Lander ES, Regev A, Efficient Generation of Transcriptomic Profiles by Random Composite Measurements. Cell 171, 1424–1436.e18 (2017). [DOI] [PMC free article] [PubMed] [Google Scholar]
- 29.Madhukar NS, Elemento O, Pandey G, Prediction of Genetic Interactions Using Machine Learning and Network Properties. Front Bioeng Biotechnol 3, 172 (2015). [DOI] [PMC free article] [PubMed] [Google Scholar]
- 30.Žitnik M, Zupan B, Data Imputation in Epistatic MAPs by Network-Guided Matrix Completion. Journal of Computational Biology 22, 595–608 (2015). [DOI] [PMC free article] [PubMed] [Google Scholar]
- 31.Xu M, Jin R, Zhou Z-H, in Advances in neural information processing systems (2013), pp. 2301–2309. [Google Scholar]
- 32.Székely GJ, Rizzo ML, Bakirov NK, Measuring and testing dependence by correlation of distances. Ann. Statist 35, 2769–2794 (2007). [Google Scholar]
- 33.Attar A, Changes in the Cell Surface Markers During Normal Hematopoiesis: A Guide to Cell Isolation. Global Journal of Hematology and Blood Transfusion (2014), 10.15379/2408-9877.2014.01.01.4. [DOI]
- 34.Kuleshov MV, Jones MR, Rouillard AD, Fernandez NF, Duan Q, Wang Z, Koplev S, Jenkins SL, Jagodnik KM, Lachmann A, McDermott MG, Monteiro CD, Gundersen GW, Ma’ayan A, Enrichr: a comprehensive gene set enrichment analysis web server 2016 update. Nucleic Acids Res 44, W90–W97 (2016). [DOI] [PMC free article] [PubMed] [Google Scholar]
- 35.Lachmann A, Torre D, Keenan AB, Jagodnik KM, Lee HJ, Wang L, Silverstein MC, Ma’ayan A, Massive mining of publicly available RNA-seq data from human and mouse. Nat Commun 9, 1366 (2018). [DOI] [PMC free article] [PubMed] [Google Scholar]
Associated Data
This section collects any data citations, data availability statements, or supplementary materials included in this article.