

Abstract
Purpose
Although age is a recognized independent prognostic risk factor, its relative importance among molecular subtypes of Breast cancer (BCA) is not well documented. The aim of this study was to evaluate the prognostic role of age at diagnosis among different immunohistochemical subtypes of BCA.
Methods
We conducted a retrospective study of women with invasive BCA undergoing surgery at the Johns Hopkins Hospital, excluding patients presenting with stage IV breast cancer. Patients were stratified into three age groups: ≤ 40, 41–60, and > 60 years, and multivariable analysis was performed using Cox regression. We also identified differentially expressed genes (DEG) between age groups among BCA subtypes in the public TCGA dataset. Finally, we identified key driver genes within the DEGs using a weighted gene co-expression network analysis.
Results
Luminal A breast cancer patients had significantly lower 5 year disease-free survival (DFS) and distant metastasisfree survival (DMFS) in the ≤ 40 year age group compared to the 41–60 year age group, while the other molecular subtypes showed no significant association of DFS or DMFS with age. Age was a stronger outcome predictor than tumor grade or proliferative index in Luminal A BCA patients, but not other subtypes. BCA TCGA gene expression data were divided into two groups (≤ 40 years, > 40 years). We identified 374 DEGs in the Luminal A BCA subset, which were enriched in seven pathways and two modules of co-expressed genes. No age group-specific DEGs were identified in non-Luminal A subtypes.
Conclusions
Age at diagnosis may be an important prognostic factor in Luminal A BCA.
Keywords: Breast cancer, Intrinsic subtype, Age, Prognosis, Gene expression
Introduction
Breast cancer (BCA) is a common and heterogeneous disease. In 2017, there were 268,670 new cases of invasive breast cancer and 41,400 breast cancer deaths among US women [1]. Sorlie and Perou first classified breast carcinomas based on variations in gene expression patterns in 2001 [2], allowing breast cancer to be classified into “intrinsic” subtypes including Luminal A, Luminal B (HER2 negative), Luminal B (HER2 positive), HER2 over-expression, and Triple Negative breast cancer [3], each with different patterns of relapse, sensitivity to systemic agents, and long-term prognosis [2, 4–8].
Several studies have reported that age at diagnosis is an independent prognostic factor for BCA [9–14], but the extent to which age affects prognosis among each molecular subtype is still incompletely defined. We also analyzed how the importance of age compared to that of other classic prognostic factors, and explored possible biological reasons why age may play different roles among subtypes using publically available information from the TCGA research network BCA data set [15].
Methods
We conducted a retrospective study of consecutive female patients with a first invasive BCA undergoing mastectomy or lumpectomy at the Johns Hopkins Hospital (JHH) between January 2000 and December 2016. De-identified electronic medical record data were reviewed for patient age, tumor stage, tumor grade, Ki-67, tumor receptor status (Estrogen receptor [ER], Progesterone receptor [PR], HER2), follow-up period, and treatment received (chemotherapy, hormone therapy, or radiation therapy). Patients with stage IV breast cancer at presentation and patients with missing data were excluded. We then used the TCGA breast dataset [15] to explore differentially expressed genes (DEG) between age groups among breast cancer subtypes, and we performed gene set enrichment analysis (GSEA) for the DEG. Finally, we identified hub genes of DEG using a weighted gene coexpression network analysis (WGCNA).
Variable definitions
Institutional dataset
Patient age was stratified into three age groups: ≤ 40 years, 41–60 years, and > 60 years. Immunohistochemistry (IHC), including ER, PR, HER2, and Ki67 status, was used as a surrogate for molecular classification of intrinsic BCA subtypes. ER and PR status was considered positive if at least 1% of tumor nuclei showed staining [16]. Cancer cell Ki-67 labeling by IHC was reported as a percentage from 0 to 100%. HER2 testing involved performing HER2 IHC, reported as 0, 1+, 2+, and 3+, followed by reflex fluorescent in situ hybridization testing of all IHC equivocal (2+) cases. A HER2 IHC score of 3+ or HER2:chromosome 17 fluorescent in situ hybridization ratio of > 2.2 was considered positive [17].
Patients were classified into five molecular subtypes according to their IHC profiles: Luminal A (ER and/or PR positive, HER2 negative, Ki67 < 30% [18]), Luminal B-HER2 negative (ER and/or PR positive, HER2 negative, Ki67 ≥ 30%), Luminal B-HER2 positive (ER and/or PR positive, HER2 positive), HER2 over-expression (ER and PR negative, HER2 positive), and Triple Negative (ER and PR negative, HER2 negative) [3].
TCGA dataset
Patients were stratified into two age groups: ≤ 40 years, and > 40 years. Because Ki67 information is not available in the TCGA dataset, patients were classified into only four BCA subtypes: Luminal A (ER+ and/or PR+, Her2–), Luminal B (ER+ and/or PR+, Her2+), Her2, and Triple Negative. Non-Luminal A patients include Luminal B-Her2-positive, Her2 over-expression, and Triple Negative subtypes.
Statistical analysis
Disease-free survival (DFS) was defined as the time from BCA diagnosis to the development of any disease recurrence or death due to any cause. Distant metastasis-free survival (DMFS) was defined as the time from BCA diagnosis to the development of distant metastatic disease. Survival was modeled using Cox proportional hazards models, compared using log-rank tests, and plotted using the Kaplan-Meier method. Multivariable analysis was performed using Cox regression models to estimate hazard ratios (HR) and was adjusted for the following variables: race, molecular subtype, histologic grade, tumor stage, tumor size, lymph node status, chemotherapy (yes/no), hormone therapy (yes/no), and radiation therapy (yes/no). All statistical tests were two sided, and P < 0.05 was considered significant. Random forest survival models, as implemented in the R package randomforestSRC, were used to derive measures of the relative importance of prognostic factors, which are visualized with heatmaps. A variable importance score (VIMP) is calculated by permutation for each predictive variable included in the model [19]. Specifically, after building each tree in the forest, the values of variable x are randomly permuted among samples that were not used to train the tree in question, and the VIMP summarizes the reduction in predictive accuracy that results. Thus a large VIMP indicates a potentially predictive variable. DEG analyses were performed with the LIMMA package for R [20], using R version 3.4.2. Gene set enrichment analysis (GSEA) was performed using the MsigDB Hallmark gene sets [29], with GSEA 3.0. Weighted gene co-expression network analysis was performed with WGCNA package for R. Briefly, WGCNA assigns a connection weight between pairs of genes within the network based on a biologically motivated criterion and attempts to identify relevant modules by applying a soft threshold to correlations between pairs of genes within a network. Modules were defined as branches of the hierarchical cluster tree generated using the topological overlap-based dissimilarity as the input. The hybrid dynamic tree-cutting method was used to cut branches using a minimum module size of 30. Highly connected genes in a module (hub genes) suggest important roles in the biological processes. Hub genes were detected by calculating the module connectivity and defined as having an absolute value of the Pearson’s correlation (cor. geneModuleMembership) > 0.8.
Results
Patient characteristics
Our institutional study cohort included 3524 (56%) of the 6233 initially screened JHH patients with invasive BCA. Table 1 lists the patient demographics, pathology, and clinical characteristics overall, and for each age group. 395 patients were ≤ 40 years old, 1,838 patients were 41–60 years old, and 1,291 patients were > 60 years old. The majority of our patients were white (67%) with a tumor ≤ 2 cm (67%). The majority of tumors had a negative lymph node status (66%), moderate tumor grade (51%), positive ER status (78%), positive PR status (68%), negative HER2 status (82%), and Ki67 < 30% (65%). The majority of molecular subtypes were Luminal A subtype (54%), followed by Luminal B-HER2 negative (13%), Luminal B-HER2 positive (12%), Triple Negative (16%), and HER2 over-expression (6%). With the exception of race, outcome-related characteristics captured in our data set showed significant age-specific variation, with overrepresentation of factors associated with more aggressive disease in the ≤ 40 age cohort, and were generally consistent with published reports [21–23].
Table 1.
Characteristics of total patient cohort by age group
| Patient cohort | Age at diagnosis | ||||
|---|---|---|---|---|---|
| ≤ 40 years, N (%) | 41–60 years, N (%) | > 60 years, N (%) | P | ||
| Race | 0.139 | ||||
| White | 2368 (67.2) | 262 (66.3) | 1220 (66.4) | 886 (68.6) | |
| Black | 714 (20.2) | 79 (20.0) | 367 (19.9) | 268 (20.8) | |
| Other | 442 (12.6) | 54 (13.7) | 251 (13.7) | 137 (10.6) | |
| Tumor size | < 0.001 | ||||
| ≤ 2 cm | 2351 (66.7) | 242 (61.1) | 1199 (65.2) | 910 (70.5) | |
| 2–5 cm | 1008 (28.6) | 128 (32.6) | 554 (30.1) | 326 (25.3) | |
| > 5 cm | 165 (4.7) | 25 (6.3) | 85 (4.7) | 55 (4.2) | |
| Node status | 0.001 | ||||
| N+ | 1208 (34.3) | 192 (48.6) | 662 (36.0) | 354 (27.4) | |
| N0 | 2316 (65.7) | 203 (51.4) | 1176 (64.0) | 937 (72.6) | |
| Cancer stage | < 0.001 | ||||
| I | 1757 (49.9) | 150 (37.9) | 873 (47.5) | 734 (56.9) | |
| II | 1285 (36.5) | 170 (43.2) | 698 (38.0) | 417 (32.3) | |
| III | 482 (13.6) | 75 (18.9) | 267 (14.5) | 140 (10.8) | |
| Histology grade | < 0.001 | ||||
| Low | 546 (15.5) | 32 (8.1) | 269 (14.7) | 245 (18.9) | |
| Moderate | 1804 (51.2) | 164 (41.4) | 920 (50.0) | 720 (55.8) | |
| High | 1174 (33.3) | 199 (50.5) | 649 (35.3) | 326 (25.3) | |
| ER status | < 0.001 | ||||
| Positive | 2732 (77.5) | 258 (65.4) | 1398 (76.1) | 1076 (83.3) | |
| Negative | 792 (22.5) | 137 (34.6) | 440 (23.9) | 215 (16.7) | |
| PR status | < 0.001 | ||||
| Positive | 2389 (67.8) | 234 (59.3) | 1227 (66.8) | 928 (71.9) | |
| Negative | 1135 (32.2) | 161 (40.7) | 611 (33.2) | 363 (28.1) | |
| Her2 status | < 0.001 | ||||
| Positive | 621 (17.6) | 111 (28.3) | 337 (18.3) | 173 (13.4) | |
| Negative | 2903 (82.4) | 284 (71.7) | 1501 (82.7) | 1118 (86.6) | |
| Ki67 | < 0.001 | ||||
| < 30% | 2287 (64.9) | 192 (48.5) | 1160 (63.1) | 935 (72.4) | |
| ≥ 30% | 1237 (35.1) | 203 (51.5) | 678 (36.9) | 356 (27.6) | |
| Molecular subtype | < 0.001 | ||||
| Luminal A | 1893 (53.7) | 130 (32.8) | 946 (51.4) | 817 (63.2) | |
| Luminal B (her2-negative) | 465 (13.2) | 60 (15.2) | 253 (13.9) | 152 (11.8) | |
| Luminal B (her2-positive) | 407 (11.5) | 76 (19.4) | 215 (11.7) | 116 (9.1) | |
| Her2 | 214 (6) | 35 (8.8) | 122 (6.6) | 57 (4.4) | |
| Triple Negative | 545 (15.5) | 94 (23.7) | 302 (16.4) | 149 (11.4) | |
| Chemo and/or target therapy | < 0.001 | ||||
| Yes | 1780 (50.5) | 324 (82.0) | 1081 (58.8) | 375 (29.0) | |
| No | 1663 (47.2) | 67 (16.9) | 726 (39.5) | 870 (67.4) | |
| Unknown | 81 (2.3) | 4 (1.1) | 31 (1.7) | 46 (3.6) | |
| Endocrine therapy | < 0.001 | ||||
| Yes | 2147 (60.9) | 206 (52.2) | 1135 (61.7) | 806 (62.4) | |
| No | 1296 (36.8) | 185 (46.7) | 672 (36.6) | 439 (34.0) | |
| Unknown | 81 (2.3) | 4 (1.1) | 31 (1.7) | 46 (3.6) | |
| Radiation therapy | < 0.001 | ||||
| Yes | 2019 (57.3) | 214 (54.2) | 1068 (58.1) | 737 (57.1) | |
| No | 1424 (40.4) | 177 (44.7) | 739 (40.2) | 508 (39.3) | |
| Unknown | 81 (2.3) | 4 (1.1) | 31 (1.7) | 46 (3.6) | |
ER estrogen receptor, HER2 human epidermal growth factor receptor 2, PR progesterone receptor, Chemo chemotherapy
Patient DFS and DMFS by age group
Among our cohort, the median follow-up was 85.1 months (Range 1.0–191.7 months). Patients ≤ 40 years old and patients > 60 years old showed a statistically significant decrease in 5 year DFS and 5 year DMFS, compared to that of 41–60 year old patients. On multivariate analysis, the Hazard Ratio (HR) for 5 year DFS and DMFS of patients ≤ 40 years was 1.36 and 1.39 fold higher than that observed for 41–60 year old patients, respectively [95% Confidence Interval (CI) 1.07–1.74 and 95% CI 1.07–1.80]. Moreover, the HR for 5-year DFS and DMFS of patients > 60 years was 1.22- and 1.26-fold higher than that of patients 40–60 years, respectively (95% CI 1.01–1.47 and 95% CI 1.03–1.56) (see Table 2).
Table 2.
Five year DFS and DMFS according to age group
| Age group | Patient number | 5 years DFS, N (%) | P value | HR (95% CI)a |
|---|---|---|---|---|
| DFS | ||||
| ≤ 40 years | 395 | 305 (77.2) | < 0.001 | 1.36 (1.07–1.74) |
| 41–60 years | 1838 | 1563 (85.0) | 1.0 (REF) | |
| >60 years | 1291 | 1077 (83.4) | 1.22 (1.01–1.47) | |
| DMFS | ||||
| ≤ 40 years | 395 | 316 (80.0) | < 0.001 | 1.39 (1.07–1.80) |
| 41–60 years | 1838 | 1608 (87.5) | 1.0 (REF) | |
| > 60 years | 1291 | 1113 (86.2) | 1.26 (1.03–1.56) | |
HR hazard ratios, DFS disease-free survival, REF reference, DMFS distant metastasis-free survival
Adjusted for tumor stage, histological grade, tumor size, lymph node status, molecular subtype, chemotherapy, hormone therapy, radiation therapy, and race
Patient survival by molecular subtype
When stratified by age group, the 5 year DFS and 5 year DMFS was significantly different only among Luminal A breast cancer patients (P < 0.001, Table 3; Fig. 1 and SFigure 1). The 5 year DFS and DMFS were significantly lower in Luminal A patients in the ≤ 40 year age group than in the 41–60 year age group (HR 2.69, 95% CI 1.72–4.23 and HR 2.95, 95% CI 1.78–4.90, respectively). Furthermore, significantly worse 5 year DFS and DMFS were also observed in Luminal A patients in the > 60 year age group (HR 1.82, 95% CI 1.34–2.47 and HR 1.90, 95% CI 1.33–2.70, respectively).
Table 3.
Survival by age group among different molecular subtypes
| Subtype/age (years) | Patients, N | 5 year DFS (%) | P value | HR (95% CI)a | 5 year DMFS (%) | P value | HR (95% CI)a |
|---|---|---|---|---|---|---|---|
| Luminal A | |||||||
| ≤ 40 years | 130 | 104 (80.0) | < 0.001 | 2.69 (1.72–4.23) | 109 (83.8) | < 0.001 | 2.95 (1.78–4.90) |
| 41–60 years | 946 | 867 (91.6) | 1.0 (REF) | 887 (93.8) | 1.0 (REF) | ||
| > 60 years | 817 | 707 (86.5) | 1.82 (1.34–2.47) | 731 (89.5) | 1.90 (1.33–2.70) | ||
| Luminal B (her2-negative) | |||||||
| ≤ 40 years | 60 | 54 (90.0) | 0.134 | 0.72 (0.30–1.73) | 54 (90.0) | 0.48 | 0.89 (0.37–2.17) |
| 41–60 years | 253 | 215 (84.9) | 1.0 (REF) | 220 (86.9) | 1.0 (REF) | ||
| > 60 years | 152 | 121 (79.6) | 1.28 (0.75–2.16) | 128 (84.2) | 1.17 (0.64–2.14) | ||
| Luminal B (her2-positive) | |||||||
| ≤ 40 years | 76 | 60 (78.9) | 0.503 | 1.11 (0.60–2.07) | 60 (78.9) | 0.139 | 1.50 (0.79–2.85) |
| 41–60 years | 215 | 181 (84.2) | 1.0 (REF) | 188 (87.4) | 1.0 (REF) | ||
| > 60 years | 116 | 97 (83.6) | 1.12 (0.59–2.15) | 98 (84.5) | 1.63 (0.82–3.24) | ||
| Her2 | |||||||
| ≤ 40 years | 35 | 25 (71.4) | 0.783 | 1.41 (0.66–3.01) | 27 (77.1) | 0.959 | 1.21 (0.53–2.78) |
| 41–60 years | 122 | 95 (77.9) | 1.0 (REF) | 98 (80.3) | 1.0 (REF) | ||
| > 60 years | 57 | 43 (75.4) | 1.01 (0.52–1.97) | 45 (78.9) | 0.97 (0.47–1.99) | ||
| Triple Negative | |||||||
| ≤ 40 years | 94 | 62 (65.9) | 0.319 | 1.18 (0.79–1.78) | 66 (70.2) | 0.604 | 1.11 (0.72–1.72) |
| 41–60 years | 302 | 205 (67.9) | 1.0 (REF) | 215 (71.2) | 1.0 (REF) | ||
| > 60 years | 149 | 109 (73.2) | 0.77 (0.52–1.13) | 111 (74.5) | 0.83 (0.56–1.24) | ||
Adjusted for tumor stage, histological grade, tumor size, lymph node status, chemotherapy, hormone therapy, radiation therapy, race
Fig. 1.

Kaplan–Meier curve for 5 year DFS for Luminal A (a), Luminal B (her2-negative) (b), Luminal B (her2-positive) (c), Her2 (d), Triple Negative (e) breast cancer in young patients (≤ 40 years: blue curve), middle age patients (41–60 years: red curve) and old patients (> 60 years: green curve). P value was calculated by Log-rank tests. Numbers of patients at risk and number of patients censored over time are listed under each plot
Differences in 5 year DFS and DMFS among the three age groups in Luminal B-HER2 negative, Luminal B-HER2 positive, HER2 over-expression, and Triple Negative subtypes (Table 3) were not statistically significant.
Relative importance of prognostic factors in predicting DFS and DMFS
We used the variable importance score from a survival random forest model to quantify the importance of the various prognostic factors in predicting outcome (Table 4; Fig. 2). Stage was the strongest predictor in all but the Her2 subtype. Age was the third most important factor to predict 5 year DFS and 5 year DMFS in the Luminal A subtype, but only a weak predictor in the other subtypes (Fig. 2; Table 4). Tumor grade was predictive for DFS in the Luminal B-HER2 negative, Her2, and Triple Negative subtypes, but less so for DMFS, while Ki67 was predictive only for DFS in the Her2 subtype.
Table 4.
Relative importance of prognostic factors to 5 year DFS and DMFS from Random Forest Analysis
| Subtype | Grade | ER | PR | Her2 | Age | Stage | Ki67 | Race | Endo | Radio | Chemo |
|---|---|---|---|---|---|---|---|---|---|---|---|
| Relative importance of prognostic factors to predict 5 year DFS in breast cancer patients with different subtypes by Random Forest Analysis | |||||||||||
| Luminal A | −0.39 | 0.01 | −0.14 | 0.00 | 0.54 | 1.00 | 0.00 | −0.51 | 0.17 | 0.69 | −0.26 |
| Luminal B (her2-negative) | 0.32 | 0.01 | 0.08 | 0.00 | 0.12 | 1.00 | 0.00 | 0.12 | 0.17 | 0.17 | 0.09 |
| Luminal B (her2-positive) | 0.03 | −0.01 | 0.07 | 0.00 | 0.14 | 1.00 | −0.07 | −0.03 | 0.06 | −0.02 | −0.10 |
| HER2 | 0.21 | 0.00 | 0.00 | 0.00 | −1.00 | −0.66 | 0.42 | −0.30 | 0.00 | −0.40 | −0.31 |
| Triple Negative | 0.23 | 0.00 | 0.00 | 0.00 | −0.09 | 1.00 | −0.26 | 0.09 | 0.00 | −0.18 | 0.05 |
| Relative importance of prognostic factors to predict 5 year DMFS in breast cancer patients with different subtypes by Random Forest Analysis | |||||||||||
| Luminal A | −0.06 | 0.04 | −0.01 | 0.00 | 0.25 | 1.00 | 0.00 | 0.04 | 0.31 | 0.58 | −0.52 |
| Luminal B (her2-negative) | 0.19 | 0.00 | 0.02 | 0.00 | 0.01 | 1.00 | 0.00 | 0.02 | 0.03 | 0.08 | −0.01 |
| Luminal B (her2-positive) | −0.03 | −0.1 | 0.12 | 0.00 | 0.12 | 1.00 | −0.11 | −0.08 | 0.10 | 0.02 | −0.001 |
| Her2 | −0.08 | 0.00 | 0.00 | 0.00 | −1.0 | −0.05 | −0.34 | −0.29 | 0.00 | −0.76 | −0.31 |
| Triple Negative | 0.17 | 0.00 | 0.00 | 0.00 | −0.17 | 1.00 | −0.18 | −0.03 | 0.00 | −0.18 | 0.001 |
LN lymph node, Endo endocrine therapy. Radio radiation therapy, Chemo chemotherapy
Fig. 2.

Heatmap for the relative importance of prognostic factors to 5 year DFS (a) and 5 year DMFS (b) for breast cancer patients. The relative importance value score is calculated by permutation for each predictive variable included in the model with Random Forest method. Red color stands for high value score and blue color stands for low value score. TriN Triple Negative, LumBhp Luminal B (her2-positive), LumBhn Luminal B (her2-negative), LumA Luminal A, Endo endocrine therapy, Radio Radiation therapy, Chemo chemo-therapy
Breast cancer risk factors among different age groups by molecular subtype
To better understand the apparent association between age and risk for Luminal A breast cancer, we next tested whether age was associated with any other known prognostic factors in breast cancer. Based on previous reports, we identified African American race [24], positive lymph node status, tumor size > 2 cm [25], and tumor grade 2–3 [26] as potential risk factors associated with worse DFS and DMFS. As seen in Table 5, young women with Luminal A breast cancer are more likely to be node positive and have higher tumor grade than are older women. No statistically significant associations with race or tumor size were observed in young Luminal A patients, and no significant differences were observed between young age and other risk factors in the remaining molecular subtypes.
Table 5.
Race, node status, tumor size and tumor grade among tumor subtypes by age cohort
| Race (black) | Positive node | Size > 2 cm | Grade 2–3 | |||||||||||||
|---|---|---|---|---|---|---|---|---|---|---|---|---|---|---|---|---|
| Yes | No | P | OR | Yes | No | P | OR | Yes | No | P | OR | Yes | No | P | OR | |
| Luminal A | ||||||||||||||||
| Age ≤ 40 years | 18 | 112 | 1.00 | 1.01 | 59 | 71 | < 0.05 | 1.87 | 40 | 90 | 0.53 | 1.16 | 110 | 20 | 0.05 | 1.67 |
| 40 years < age ≤ 60 years | 130 | 816 | 290 | 656 | 262 | 684 | 725 | 221 | ||||||||
| Age > 60 years | 144 | 673 | 0.03 | 1.34 | 185 | 632 | < 0.05 | 0.66 | 187 | 630 | 0.02 | 0.77 | 599 | 218 | 0.12 | 0.83 |
| Luminal B (her2-negative) | ||||||||||||||||
| Age ≤ 40 years | 7 | 53 | 0.10 | 0.46 | 32 | 28 | 0.09 | 1.71 | 24 | 36 | 0.89 | 1.09 | 56 | 4 | 0.08 | 0.24 |
| 40 years < age ≤ 60 years | 56 | 197 | 101 | 152 | 96 | 157 | 239 | 4 | ||||||||
| Age > 60 year | 39 | 113 | 0.49 | 1.21 | 50 | 102 | 0.19 | 0.73 | 65 | 87 | 0.39 | 1.22 | 148 | 4 | 0.75 | 0.62 |
| Luminal B (her2-positive) | ||||||||||||||||
| Age ≤ 40 years | 20 | 56 | 0.21 | 1.56 | 42 | 34 | 0.29 | 1.31 | 33 | 43 | 0.35 | 1.29 | 73 | 3 | 0.68 | 1.56 |
| 40 years < age ≤ 60 years | 40 | 175 | 103 | 112 | 80 | 135 | 202 | 13 | ||||||||
| Age > 60 years | 22 | 94 | 1.00 | 1.02 | 42 | 74 | 0.05 | 0.62 | 36 | 80 | 0.32 | 0.76 | 102 | 14 | 0.09 | 0.47 |
| Her2 | ||||||||||||||||
| Age ≤ 40 years | 6 | 29 | 0.43 | 0.61 | 18 | 17 | 0.24 | 1.68 | 13 | 22 | 0.99 | 1.08 | 34 | 1 | 0.68 | 2.37 |
| 40 years < age ≤ 60 years | 31 | 91 | 47 | 75 | 43 | 79 | 114 | 8 | ||||||||
| Age > 60 years | 11 | 46 | 0.48 | 0.70 | 24 | 33 | 0.77 | 1.16 | 28 | 29 | 0.11 | 1.76 | 53 | 4 | 1.00 | 0.93 |
| Triple Negative | ||||||||||||||||
| Age ≤ 40 years | 28 | 66 | 0.29 | 0.74 | 40 | 54 | 0.76 | 1.11 | 43 | 51 | 0.35 | 0.77 | 90 | 4 | 1.00 | 0.93 |
| 40 year s < age ≤ 60 years | 110 | 192 | 121 | 181 | 157 | 145 | 290 | 12 | ||||||||
| Age > 60 years | 52 | 97 | 0.83 | 0.94 | 53 | 96 | 0.41 | 0.83 | 65 | 84 | 0.12 | 0.72 | 144 | 5 | 0.84 | 1.19 |
Middle aged patients are reference group
OR odds ratio
Differently expressed genes (DEG) between young and old age groups by BCA subtype
To explore possible reasons why age may play different roles among BCA subtypes, we performed a DEG analysis using the breast TCGA dataset [15]. As shown in Fig. 3, 176 genes were upregulated and 198 genes downregulated (Benjamini-Hochberg-adjusted p value < 0.05) between young and old Luminal A BCA patients (n = 491, including 36 under 40 years of age). The top ten differentially expressed genes are listed in Table 6. There were no statistically significant DEG between young and old groups of any of the non-Luminal A BCA patients (n = 364, including 38 under 40 years of age).
Fig. 3.
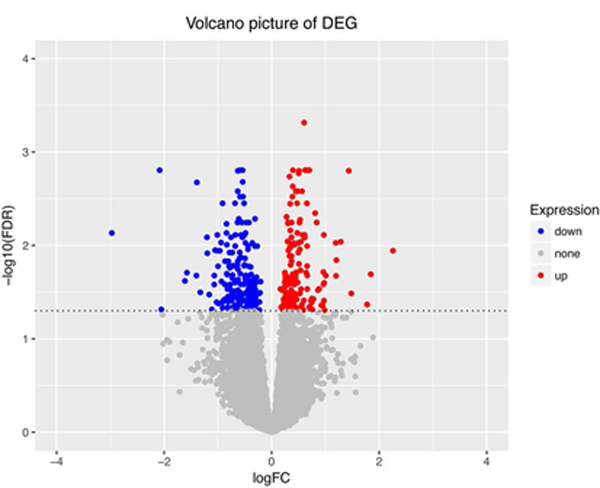
Volcano plot for the DEG between two groups. Each dot on the plot stands for a single gene. Horizontal axis: logFC (fold change); Vertical axis: - log10(FDR) (false discovery rate). Color coding is based on Benjamini-Hochberg-adjusted P value. up: genes upregulated and P < 0.05 (red color). down: genes downregulated and P< 0.05 (blue color). none: P> 0.05 (grey color)
Table 6.
Ten most differently expressed genes between young and old groups
| SYMBOL | logFC | AveExpr | t | P value | Adj. P val | B |
|---|---|---|---|---|---|---|
| KIR3DL3 | 0.89 | 5.68 | 6.39 | < 0.00001 | 0.00001 | 12.43 |
| GNA13 | 0.61 | 7.07 | 5.49 | < 0.00001 | 0.00049 | 7.73 |
| LRRC59 | 0.62 | 7.83 | 5.18 | < 0.00001 | 0.00157 | 6.27 |
| NICN1 | − 0.54 | 4.34 | 5.10 | < 0.00001 | 0.00157 | 5.92 |
| SLC25A16 | − 0.59 | 4.27 | 5.04 | < 0.00001 | 0.00157 | 5.66 |
| CLTC | 0.66 | 9.73 | 4.99 | < 0.00001 | 0.00157 | 5.42 |
| CYP4×1 | − 2.08 | 5.01 | − 4.97 | < 0.00001 | 0.00157 | 5.33 |
| MED13 | 0.70 | 7.07 | 4.97 | < 0.00001 | 0.00157 | 5.32 |
| KIAA0391 | 0.40 | 5.48 | 4.96 | < 0.00001 | 0.00157 | 5.30 |
| NOL11 | 0.51 | 6.21 | 4.92 | < 0.00001 | 0.00159 | 5.10 |
Similarity between expression profiles of the young, Luminal A pattern and other BCA subtypes
In order to determine how similar the expression of the 374 identified DEG (176 upregulated + 198 downregulated) characteristic of young Luminal A subtype breast cancer was in other BCA subtypes, we calculated the mean expression value of the DEG set in the other BCA subtypes, and calculated their correlation with young Luminal A subset. As shown in Fig. 4, we found only young Luminal B BCA to have a high correlation with young Luminal A BCA expression pattern. None of the other BCA subtypes or age cohorts express the 374 genes similarly.
Fig. 4.

Similarity between expression profiles of primary tumors and the young, Luminal A pattern. Each dot in the plot stands for correlation value of the DEG expression of each patient with the DEG expression of young Luminal A patients. Horizontal axis: four subtypes of breast cancer (Luminal A, Luminal B, Her2, Triple negative). Each breast cancer subtype was divided into three subgroups, young age group (red color), middle age group (green color) and old age group (blue color). Vertical axis: the correlation value
Gene set enrichment analysis (GSEA) of DEG between young and old Luminal A BCA
We performed a GSEA to analyze the 176 upregulated genes and 198 downregulated genes we identified in young and old groups of Luminal A breast cancer patients in the TCGA dataset. Pathway enrichment for the DEGs was analyzed within the MsigDB Hallmark gene sets [27], which consist of curated 50 gene sets representing well-defined biological states or processes displaying coherent expression. Using a False Discovery Rate (FDR) cutoff q value of 0.05, we identified seven enriched pathways, listed in Table 7. We performed the same analysis on the non-Luminal A breast cancer patients and found that the “MYC_TARGETS_V1” pathway was enriched regardless of BCA subtype, whereas the other six identified age-associated pathways (see Table 7) were specific to the Luminal A subtype.
Table 7.
Pathways enriched in DEG between young and old Luminal A breast cancer patients and non-Luminal A breast cancer patients
| Enriched pathway in hallmark gene set | Luminal A subtype | Non-Luminal A subtype | ||
|---|---|---|---|---|
| ES | FDR q value | ES | FDR q value | |
| MYC_TARGETS_V1 | 0.40 | 0.0000 | 0.39 | 0.0088 |
| E2F_TARGETS | 0.37 | 0.0038 | 0.30 | 0.1896 |
| G2M_CHECKPOINT | 0.36 | 0.0064 | 0.31 | 0.2606 |
| MITOTIC_SPINDLE | 0.34 | 0.0091 | − 0.24 | 0.5395 |
| EPITHELIAL_MESENCHYMAL_TRANSITION | 0.32 | 0.257 | 0.23 | 0.8400 |
| TGF_BETA_SIGNALING | 0.42 | 0.0246 | 0.21 | 0.8566 |
| PROTEIN_SECRETION | 0.35 | 0.0332 | − 0.36 | 0.0427 |
ES GSEA analysis enrichment score, FDR false discovery rate
Weighted gene co-expression network analysis (WGCNA) of DEG between young and old Luminal A BCA
In order to identify possible driver genes among these DEG, we constructed a gene co-expression network. Using the default parameters for the WGCNA algorithm [28], we conducted factor clustering to check for the presence of outliers, and optimized the soft threshold values. Unsigned coexpression networks were constructed using the blockwise module function in the WGCNA package for R [28], selecting a soft threshold power of 6, estimated using functions included in the package. As shown in a cluster dendrogram in SFigure 2, 2 modules reached the minimum threshold of 30, containing 178 DEGs (turquoise cluster) and 101 DEGs (blue cluster), respectively. The list of hub genes reaching the threshold of 0.8 are listed in Table 8. We then visualized the co-expression network for genes in the two module with Cytoscape [29]. Network A (turquoise, SFigure 3A) contains 103 nodes and 533 edges, and network B (blue, SFigure 3B) contains 57 nodes and 366 edges.
Table 8.
Hub genes in the identified blue and turquoise modules in SFigure 3
| Module | Hub genes |
|---|---|
| Blue | MST1, AHSA2, NSUN5P2, APBB3, MST1P2, AGAP4, LOC338799, NCRNA00105, NSUN5P1 |
| Turquoise | MED13, BPTF, HELZ, GNA13, CLTC, INTS2 |
Discussion
The past decade has seen important advances in our understanding of the biology of BCA. We now know that hormone receptor-positive and -negative BCA are distinct diseases, with characteristic epidemiological and clinical features, as well as prognoses and event horizons, which can be as different as cancers arising in different organs. In spite of these advances, BCA subtypes remain heterogeneous in outcome, with an ongoing need to better risk stratify individual patients. In light of the molecular heterogeneity of BCA, evaluation of clinical factors in conjunction with molecular information may improve our management of this disease.
To the best of the authors’ knowledge, our study represents the second largest cohort in the literature to analyze the prognostic value of age stratified by BCA molecular subtype. Moreover, this study is the first to evaluate the relative importance of age as a predictor of survival among female BCA patients and is the first to explore possible biological reasons why age may play different roles among subtypes.
In our study, after disease stage and radiation therapy, age at diagnosis was the most important prognostic factor, but only in the Luminal A subtype. In our stratified analysis, we can also report that, when controlling for tumor size among Luminal A patients, lymph node metastasis and high grade BCA is significantly more common in the young age group patients than in that of the middle age group (P < 0.05).
A younger age at diagnosis has been reported as a poor prognostic factor in BCA and associated with more aggressive disease [21, 30], and recent studies have sought to investigate age at diagnosis as a prognostic factor according to different molecular subtypes [22, 23]. Similar to our analysis, it has been reported that patients less than 40 years were associated with a significant increase in risk of breast cancer-specific death from Luminal A and Luminal B subtype compared with older patients [23]. Moreover, age ≤ 40 years was an independent prognosis factor for BCA patients only in the Luminal A and Luminal B-HER2 negative subtypes [22]. While we did not observe a statistically significant association of age with outcome in the Luminal B subtypes, we did find higher recurrence rates in our Luminal B, HER2-negative subset.
Despite several studies reporting age at diagnosis as a prognostic factor for Luminal A subtype BCA, the reason for this relationship remains unclear. Using a recently developed a prediction model nomogram based on clinicopathological variables for the Oncotype DX recurrence score (ODXRS) [31], a gene expression classification (GEC) test for hormone positive BCA, age was the third most important predictor of low-risk and high-risk ODXRS, after tumor grade and PR status. The authors concluded that younger patients were more likely to have a high-risk score [31]. These results may be explained by variable 21-gene expression among Luminal subtype breast cancer at different patient ages.
In agreement with the above results, it was reported that patients aged less than 40 had a significantly increased proportion of high-risk ODX score (55.9%), in comparison to patients aged 40–50 years (29%), 50–60 years (25%) and greater than 60 years (21%) [32]. Another report observed that among 295 patients using MammaPrint, another GEC test predominantly used for hormone positive BCA, a significant number of younger patients were classified as high-risk compared to older patients [33]. Fifty-two out of 63 (82.5%) patients < 40 years were classified as high-risk, while 32 out of 49 (65%) patients > 50 years were classified as high-risk.
A pooled gene expression analysis evaluated the association between patient age and 54 genes that were identified as related to early BCA using two datasets of 1188 and 2334 BCA patients [10]. Results from the first dataset (n = 1,188, ≤ 40 years = 191) showed that patients ≤ 40 years patients had a higher expression of RANK-ligand (P < 0.0001), c-kit (P < 0.001), mammary stem cell markers (P < 0.0001), luminal progenitor markers, and BRCA1 mutation signatures (P=0.007), independent of tumor subtype, grade, and stage. Moreover, a disruption of the mitogen-activated protein kinase and PI3K pathways (P < 0.0001) and lower expression of BRCA1 (P = 0.003) and several apoptosis-related genes, particularly FAS (P = 0.03) was observed. Furthermore, it was reported that the expression of p53 is significantly higher in patients ≤ 40 years than those ≥ 50 years old only among luminal breast cancer subtypes [34].
Other explanations of why younger age at diagnosis is a prognostic factor for worse survival outcomes in Luminal A subtypes have been proposed. Younger patients have a lower incidence and shorter duration of chemotherapy-induced amenorrhea, which may result in a worse prognosis for hormone receptor-positive breast cancer [35]. In agreement with this, SOFT and TEXT randomized phase III trials have shown that more intensive anti-hormonal therapy can improve the survival among young luminal subtype patients [36].
Our biological exploration for the reason why age plays different roles among subtypes showed that 374 genes were differently expressed between young and old Luminal A breast cancer patients, and they are enriched in seven path-ways, six of which only in the Luminal A subtype. Among these pathways, the epithelial to mesenchymal transition (EMT) is a cellular program that plays a key role in cancer progression and metastasis [37], including in BCA [38–40].
The contribution of transforming growth factor (TGF)p to breast cancer has been studied from many perspectives since seminal studies more than two decades ago. Although the action of TGFβ as a canonical tumor suppressor in breast is well established, TGFβ also regulates the DNA damage response, which may impede cancer therapy [41], and TGF-β signaling has been shown to regulate EMT [42].
When we constructed a co-expression network for the DEG between young and old Luminal A BCA, we found two main modules of co-expressed genes. All six hub genes in the 178 gene module are upregulated in young Luminal A breast cancer patients. MED13 is a transcriptional regulator that mediates several carcinogenic pathways and the chemotherapy-induced tumor-supporting paracrine network in a complex with CDK8, CCNC, and MED12. It has been reported that higher MED13 expression is associated with shorter recurrence-free survival in BCA [43]. BPTF, also known as Bromodomain PHD Finger Transcription Factor, promotes tumor growth and predicts poor prognosis in lung adenocarcinomas [44]. GNA13 (G Protein Subunit Alpha 13) is highly expressed in aggressive breast and prostate cancer cell lines, and GNA13 expression promotes drug resistance and tumor-initiating phenotypes in squamous cell cancers [45, 46].
The nine hub genes in the 101 gene module are all downregulated in young Luminal BCA patients. Mst1 is a major inhibitor of cell proliferation, and is involved in apoptosis and tumor suppression. BCA patients with low expression of Mst1 had poor overall survival [47].
Our study has several limitations. An inherent weakness in this study is its retrospective nature. Furthermore, our data does not include socioeconomic status, education status, body mass index, patient comorbidity, and the detailed information on patient treatment regimen. For this reason, calculation of a frailty index was not possible, although increased frailty would be expected to affect the older age groups more than the younger age group. Moreover, due to the format of our dataset regarding treatment, our definition of ‘chemotherapy’ included anti-HER2 therapy. Despite these limitations, our results support the growing evidence that the relationship between age at diagnosis and breast-cancer-specific survival varies by tumor subtype.
In conclusion, our results show that age at diagnosis is strong prognostic factor in female patients with Luminal A type breast cancer. Our pathway and hub gene analyses based on the TCGA dataset may provide some insights into the underlying biology, and certainly underscores differences in the role of age-related factors between BCA subtypes. Prospective studies will be needed to determine the true prognostic value of age in this subset of BCA patients. Age at diagnosis may have the potential as an important cofactor to classify breast cancer patients to better predict patient prognosis and enhance personalized therapy.
Supplementary Material
Acknowledgements
We would like to thank all who participated in the annotation of the JH Integrated Breast Cancer Database that made this study possible.
Funding This work was supported, in part, by a DOD Grant (W81XWH-14–1-0080) to CBU and by funding from the Qingdao Municipal Hospital, China to ZL. Funding had no role in the design of the study nor in collection, analysis, and interpretation of data or in writing the manuscript.
Abbreviations
- BCA
Breast cancer
- DEG
Differentially expressed genes
- DFS
Disease free survival
- DMFS
Distant metastasis-free survival
- Her2
Human epidermal growth factor receptor 2
- ER
Estrogen receptor
- PR
Progesterone receptor
- GSEA
Gene set enrichment analysis
- IHC
Immunohistochemistry
- VIMP
Variable importance score
- WGCNA
Weighted gene co-expression network analysis
- HR
Hazard ratio
- ODXRS
Oncotype DX recurrence score
- GEC
Gene expression classification
- EMT
Epithelial to mesenchymal transition
- TGF
Transforming growth factor
- GNA13
G protein subunit alpha 13
Footnotes
Data availability The datasets used and/or analyzed during the current study are available from the corresponding author on reasonable request.
Compliance with ethical standards
Conflict of interest The authors declare that they have no conflict of interest.
Ethical approval For the institutional cohorts, de-identified data were extracted from the Johns Hopkins Institutional Review Board-approved Integrated Breast Cancer Database (NA00022703). This article does not contain any studies with human participants performed by any of the authors.
Informed consent For this type of study formal consent is not required.
Electronic supplementary material The online version of this article (https://doi.org/10.1007/s10549-018-4950-4) contains supplementary material, which is available to authorized users.
References
- 1.Siegel RL, Miller KD, Jemal A (2018) Cancer statistics, 2018. CA Cancer J Clin 68(1):7–30. 10.3322/caac.21442 [DOI] [PubMed] [Google Scholar]
- 2.Sorlie T, Perou CM, Tibshirani R, Aas T, Geisler S, Johnsen H, Hastie T, Eisen MB, van de Rijn M, Jeffrey SS, Thorsen T, Quist H, Matese JC, Brown PO, Botstein D, Eystein Lonning P, Borresen-Dale AL (2001) Gene expression patterns of breast carcinomas distinguish tumor subclasses with clinical implications. Proc Natl Acad Sci USA 98(19):10869–10874 [DOI] [PMC free article] [PubMed] [Google Scholar]
- 3.Goldhirsch A, Winer EP, Coates AS, Gelber RD, Piccart-Gebhart M, Thurlimann B, Senn HJ, Panel m (2013) Personalizing the treatment of women with early breast cancer: highlights of the St Gallen International Expert Consensus on the Primary Therapy of Early Breast Cancer 2013. Ann Oncol 24(9):2206–2223. 10.1093/annonc/mdt303 [DOI] [PMC free article] [PubMed] [Google Scholar]
- 4.Carey LA, Perou CM, Livasy CA, Dressler LG, Cowan D, Conway K, Karaca G, Troester MA, Tse CK, Edmiston S, Deming SL, Geradts J, Cheang MC, Nielsen TO, Moorman PG, Earp HS, Millikan RC (2006) Race, breast cancer subtypes, and survival in the Carolina Breast Cancer Study. JAMA 295(21):2492–2502. 10.1001/jama.295.21.2492 [DOI] [PubMed] [Google Scholar]
- 5.Engstrom MJ, Opdahl S, Hagen AI, Romundstad PR, Akslen LA, Haugen OA, Vatten LJ, Bofin AM (2013) Molecular subtypes, histopathological grade and survival in a historic cohort of breast cancer patients. Breast Cancer Res Treat 140(3):463–473. 10.1007/s10549-013-2647-2 [DOI] [PMC free article] [PubMed] [Google Scholar]
- 6.Kennecke H, Yerushalmi R, Woods R, Cheang MC, Voduc D, Speers CH, Nielsen TO, Gelmon K (2010) Metastatic behavior of breast cancer subtypes. J Clin Oncol 28(20):3271–3277. 10.1200/JCO.2009.25.9820 [DOI] [PubMed] [Google Scholar]
- 7.Sorlie T, Tibshirani R, Parker J, Hastie T, Marron JS, Nobel A, Deng S, Johnsen H, Pesich R, Geisler S, Demeter J, Perou CM, Lonning PE, Brown PO, Borresen-Dale AL, Botstein D (2003) Repeated observation of breast tumor subtypes in independent gene expression data sets. Proc Natl Acad Sci USA 100(14):8418–8423 [DOI] [PMC free article] [PubMed] [Google Scholar]
- 8.Voduc KD, Cheang MC, Tyldesley S, Gelmon K, Nielsen TO, Kennecke H (2010) Breast cancer subtypes and the risk of local and regional relapse. J Clin Oncol 28(10):1684–1691 [DOI] [PubMed] [Google Scholar]
- 9.Alieldin NH, Abo-Elazm OM, Bilal D, Salem SE, Gouda E, Elmongy M, Ibrahim AS (2014) Age at diagnosis in women with non-metastatic breast cancer: is it related to prognosis? J Egypt Natl Cancer Inst 26(1):23–30. 10.1016/j.jnci.2013.08.005 [DOI] [PubMed] [Google Scholar]
- 10.Azim HA Jr, Michiels S, Bedard PL, Singhal SK, Criscitiello C, Ignatiadis M, Haibe-Kains B, Piccart MJ, Sotiriou C, Loi S (2012) Elucidating prognosis and biology of breast cancer arising in young women using gene expression profiling. Clin Cancer Res 18(5):1341–1351. 10.1158/1078-0432.CCR-11-2599 [DOI] [PubMed] [Google Scholar]
- 11.Ferguson NL, Bell J, Heidel R, Lee S, Vanmeter S, Duncan L, Munsey B, Panella T, Orucevic A (2013) Prognostic value of breast cancer subtypes, Ki-67 proliferation index, age, and pathologic tumor characteristics on breast cancer survival in Caucasian women. Breast J 19(1):22–30. 10.1111/tbj.12059 [DOI] [PubMed] [Google Scholar]
- 12.Liedtke C, Rody A, Gluz O, Baumann K, Beyer D, Kohls EB, Lausen K, Hanker L, Holtrich U, Becker S, Karn T (2015) The prognostic impact of age in different molecular subtypes of breast cancer. Breast Cancer Res Treat 152(3):667–673. 10.1007/s10549-015-3491-3 [DOI] [PubMed] [Google Scholar]
- 13.van de Water W, Markopoulos C, van de Velde CJ, Seynaeve C, Hasenburg A, Rea D, Putter H, Nortier JW, de Craen AJ, Hille ET, Bastiaannet E, Hadji P, Westendorp RG, Liefers GJ, Jones SE (2012) Association between age at diagnosis and disease-specific mortality among postmenopausal women with hormone receptor-positive breast cancer. JAMA 307(6):590–597. 10.1001/jama.2012.84 [DOI] [PubMed] [Google Scholar]
- 14.Wray CJ, Phatak UR, Robinson EK, Wiatek RL, Rieber AG, Gonzalez A, Ko TC, Kao LS (2013) The effect of age on race-related breast cancer survival disparities. Ann Surg Oncol 20(8):2541–2547. 10.1245/s10434-013-2913-x [DOI] [PubMed] [Google Scholar]
- 15.Network TCGAR (2012) Comprehensive molecular portraits of human breast tumours. Nature 490(7418):61–70. 10.1038/nature11412 [DOI] [PMC free article] [PubMed] [Google Scholar]
- 16.Hammond ME, Hayes DF, Dowsett M, Allred DC, Hagerty KL, Badve S, Fitzgibbons PL, Francis G, Goldstein NS, Hayes M, Hicks DG, Lester S, Love R, Mangu PB, McShane L, Miller K, Osborne CK, Paik S, Perlmutter J, Rhodes A, Sasano H, Schwartz JN, Sweep FC, Taube S, Torlakovic EE, Valenstein P, Viale G, Visscher D, Wheeler T, Williams RB, Wittliff JL, Wolff AC (2010) American Society of Clinical Oncology/College Of American Pathologists guideline recommendations for immunohistochemical testing of estrogen and progesterone receptors in breast cancer. J Clin Oncol 28(16):2784–2795 [DOI] [PMC free article] [PubMed] [Google Scholar]
- 17.Wolff AC, Hammond MEH, Allison KH, Harvey BE, Mangu PB, Bartlett JMS, Bilous M, Ellis IO, Fitzgibbons P, Hanna W, Jenkins RB, Press MF, Spears PA, Vance GH, Viale G, McShane LM, Dowsett M (2018) Human epidermal growth factor receptor 2 testing in breast cancer: American Society of Clinical Oncology/College of American Pathologists Clinical Practice Guideline Focused Update. Arch Pathol Lab Med. 10.5858/arpa.2018-0902-SA [DOI] [PubMed] [Google Scholar]
- 18.Ignatiadis M, Buyse M, Sotiriou C (2015) St Gallen International Expert Consensus on the primary therapy of early breast cancer: an invaluable tool for physicians and scientists. Ann Oncol 26(8):1519–1520. 10.1093/annonc/mdv259 [DOI] [PubMed] [Google Scholar]
- 19.Breiman L (2001) Random forests. Mach Learn 45(1):5–32. 10.1023/A:101093340 [DOI] [Google Scholar]
- 20.Gentleman RC, Carey VJ, Bates DM, Bolstad B, Dettling M, Dudoit S, Ellis B, Gautier L, Ge Y, Gentry J, Hornik K, Hothorn T, Huber W, Iacus S, Irizarry R, Leisch F, Li C, Maechler M, Rossini AJ, Sawitzki G, Smith C, Smyth G, Tierney L, Yang JY, Zhang J (2004) Bioconductor: open software development for computational biology and bioinformatics. Genome Biol 5(10):R80. [DOI] [PMC free article] [PubMed] [Google Scholar]
- 21.He XM, Zou DH (2017) The association of young age with local recurrence in women with early-stage breast cancer after breast-conserving therapy: a meta-analysis. Sci Rep 7(1):11058 10.1038/s41598-017-10729-9 [DOI] [PMC free article] [PubMed] [Google Scholar]
- 22.Lian W, Fu F, Lin Y, Lu M, Chen B, Yang P, Zeng B, Huang M, Wang C (2017) The impact of young age for prognosis by subtype in women with early breast cancer. Sci Rep 7(1):11625 10.1038/s41598-017-10414-x [DOI] [PMC free article] [PubMed] [Google Scholar]
- 23.Partridge AH, Hughes ME, Warner ET, Ottesen RA, Wong YN, Edge SB, Theriault RL, Blayney DW, Niland JC, Winer EP, Weeks JC, Tamimi RM (2016) Subtype-dependent relationship between young age at diagnosis and breast cancer survival. J Clin Oncol 34(27):3308–3314. 10.1200/JCO.2015.65.8013 [DOI] [PubMed] [Google Scholar]
- 24.Tammemagi CM, Nerenz D, Neslund-Dudas C, Feldkamp C, Nathanson D (2005) Comorbidity and survival disparities among black and white patients with breast cancer. JAMA 294(14):1765–1772. 10.1001/jama.294.14.1765 [DOI] [PubMed] [Google Scholar]
- 25.Carter CL, Allen C, Henson DE (1989) Relation of tumor size, lymph node status, and survival in 24,740 breast cancer cases. Cancer 63(1):181–187 [DOI] [PubMed] [Google Scholar]
- 26.Ehinger A, Malmstrom P, Bendahl PO, Elston CW, Falck AK, Forsare C, Grabau D, Ryden L, Stal O, Ferno M, South, South-East Swedish Breast Cancer G (2017) Histological grade provides significant prognostic information in addition to breast cancer subtypes defined according to St Gallen 2013. Acta Oncol 56(1):68–74. 10.1080/0284186X.2016.1237778 [DOI] [PubMed] [Google Scholar]
- 27.Liberzon A, Birger C, Thorvaldsdottir H, Ghandi M, Mesirov JP, Tamayo P (2015) The Molecular Signatures Database (MSigDB) hallmark gene set collection. Cell Syst 1(6):417–425. 10.1016/j.cels.2015.12.004 [DOI] [PMC free article] [PubMed] [Google Scholar]
- 28.Langfelder P, Horvath S (2008) WGCNA: an R package for weighted correlation network analysis. BMC Bioinform 9:559 10.1186/1471-2105-9-559 [DOI] [PMC free article] [PubMed] [Google Scholar]
- 29.Shannon P, Markiel A, Ozier O, Baliga NS, Wang JT, Ramage D, Amin N, Schwikowski B, Ideker T (2003) Cytoscape: a software environment for integrated models of biomolecular interaction networks. Genome Res 13(11):2498–2504. 10.1101/gr.1239303 [DOI] [PMC free article] [PubMed] [Google Scholar]
- 30.Fowble BL, Schultz DJ, Overmoyer B, Solin LJ, Fox K, Jardines L, Orel S, Glick JH (1994) The influence of young age on outcome in early stage breast cancer. Int J Radiat Oncol Biol Phys 30(1):23–33 [DOI] [PubMed] [Google Scholar]
- 31.Orucevic A, Bell JL, McNabb AP, Heidel RE (2017) Oncotype DX breast cancer recurrence score can be predicted with a novel nomogram using clinicopathologic data. Breast Cancer Res Treat 163(1):51–61. 10.1007/s10549-017-4170-3 [DOI] [PMC free article] [PubMed] [Google Scholar]
- 32.Paik S, Shak S, Tang G, Kim C, Baker J, Cronin M, Baehner FL, Walker MG, Watson D, Park T, Hiller W, Fisher ER, Wickerham DL, Bryant J, Wolmark N (2004) A multigene assay to predict recurrence of tamoxifen-treated, node-negative breast cancer. N Engl J Med 351(27):2817–2826 [DOI] [PubMed] [Google Scholar]
- 33.van de Vijver MJ, He YD, van’t Veer LJ, Dai H, Hart AA, Voskuil DW, Schreiber GJ, Peterse JL, Roberts C, Marton MJ, Parrish M, Atsma D, Witteveen A, Glas A, Delahaye L, van der Velde T, Bartelink H, Rodenhuis S, Rutgers ET, Friend SH, Bernards R (2002) A gene-expression signature as a predictor of survival in breast cancer. N Engl J Med 347(25):1999–2009 [DOI] [PubMed] [Google Scholar]
- 34.Morrison DH, Rahardja D, King E, Peng Y, Sarode VR (2012) Tumour biomarker expression relative to age and molecular subtypes of invasive breast cancer. Br J Cancer 107(2):382–387. 10.1038/bjc.2012.219 [DOI] [PMC free article] [PubMed] [Google Scholar]
- 35.Perez-Fidalgo JA, Rosello S, Garcia-Garre E, Jorda E, Martin-Martorell P, Bermejo B, Chirivella I, Guzman C, Lluch A (2010) Incidence of chemotherapy-induced amenorrhea in hormone-sensitive breast cancer patients: the impact of addition of taxanes to anthracycline-based regimens. Breast Cancer Res Treat 120(1):245–251. 10.1007/s10549-009-0426-x [DOI] [PubMed] [Google Scholar]
- 36.Saha P, Regan MM, Pagani O, Francis PA, Walley BA, Ribi K, Bernhard J, Luo W, Gomez HL, Burstein HJ, Parmar V, Torres R, Stewart J, Bellet M, Perello A, Dane F, Moreira A, Vorobiof D, Nottage M, Price KN, Coates AS, Goldhirsch A, Gelber RD, Colleoni M, Fleming GF, Soft, Investigators T, International Breast Cancer Study G (2017) Treatment efficacy, adherence, and quality of life among women younger than 35 years in the International Breast Cancer Study Group TEXT and SOFT Adjuvant Endocrine Therapy Trials. J Clin Oncol 35(27):3113–3122. 10.1200/JCO.2016.72.0946 [DOI] [PMC free article] [PubMed] [Google Scholar]
- 37.Hanahan D, Weinberg RA (2000) The hallmarks of cancer. Cell 100(1):57–70 [DOI] [PubMed] [Google Scholar]
- 38.Wang Y, Zhou BP (2013) Epithelial-mesenchymal transition—a hallmark of breast cancer metastasis. Cancer Hallmarks 1(1):38–49. 10.1166/ch.2013.1004 [DOI] [PMC free article] [PubMed] [Google Scholar]
- 39.Radisky ES, Radisky DC (2010) Matrix metalloproteinase-induced epithelial-mesenchymal transition in breast cancer. J Mamm Gland Biol Neoplasia 15(2):201–212. 10.1007/s10911-010-9177-x [DOI] [PMC free article] [PubMed] [Google Scholar]
- 40.Cichon MA, Nelson CM, Radisky DC (2015) Regulation of epithelial-mesenchymal transition in breast cancer cells by cell contact and adhesion. Cancer Inform 14(Suppl 3):1–13. 10.4137/CIN.S18965 [DOI] [PMC free article] [PubMed] [Google Scholar]
- 41.Barcellos-Hoff MH, Akhurst RJ (2009) Transforming growth factor-beta in breast cancer: too much, too late. Breast Cancer Res 11(1):202 10.1186/bcr2224 [DOI] [PMC free article] [PubMed] [Google Scholar]
- 42.Xu J, Lamouille S, Derynck R (2009) TGF-beta-induced epithelial to mesenchymal transition. Cell Res 19(2):156–172. 10.1038/cr.2009.5 [DOI] [PMC free article] [PubMed] [Google Scholar]
- 43.Broude EV, Gyorffy B, Chumanevich AA, Chen M, McDermott MS, Shtutman M, Catroppo JF, Roninson IB (2015) Expression of CDK8 and CDK8-interacting Genes as Potential Biomarkers in Breast Cancer. Curr Cancer Drug Targets 15(8):739–749 [DOI] [PMC free article] [PubMed] [Google Scholar]
- 44.Dai M, Lu JJ, Guo W, Yu W, Wang Q, Tang R, Tang Z, Xiao Y, Li Z, Sun W, Sun X, Qin Y, Huang W, Deng WG, Wu T (2015) BPTF promotes tumor growth and predicts poor prognosis in lung adenocarcinomas. Oncotarget 6(32):33878–33892. 10.18632/oncotarget.5302 [DOI] [PMC free article] [PubMed] [Google Scholar]
- 45.Rasheed SA, Teo CR, Beillard EJ, Voorhoeve PM, Zhou W, Ghosh S, Casey PJ (2015) MicroRNA-31 controls G protein alpha-13 (GNA13) expression and cell invasion in breast cancer cells. Mol Cancer 14:67 10.1186/s12943-015-0337-x [DOI] [PMC free article] [PubMed] [Google Scholar]
- 46.Rasheed SAK, Leong HS, Lakshmanan M, Raju A, Dadlani D, Chong FT, Shannon NB, Rajarethinam R, Skanthakumar T, Tan EY, Hwang JSG, Lim KH, Tan DS, Ceppi P, Wang M, Tergaonkar V, Casey PJ, Iyer NG (2018) GNA13 expression promotes drug resistance and tumor-initiating phenotypes in squamous cell cancers. Oncogene 37(10):1340–1353. 10.1038/s41388-017-0038-6 [DOI] [PMC free article] [PubMed] [Google Scholar]
- 47.Lin XY, Cai FF, Wang MH, Pan X, Wang F, Cai L, Cui RR, Chen S, Biskup E (2017) Mammalian sterile 20-like kinase 1 expression and its prognostic significance in patients with breast cancer. Oncol Lett 14(5):5457–5463. 10.3892/ol.2017.6852 [DOI] [PMC free article] [PubMed] [Google Scholar]
Associated Data
This section collects any data citations, data availability statements, or supplementary materials included in this article.