

Abstract
This paper provides up to date prevalence estimates of mental disorders in Germany derived from a national survey (German Health Interview and Examination Survey for Adults, Mental Health Module [DEGS1‐MH]). A nationally representative sample (N = 5318) of the adult (18–79) population was examined by clinically trained interviewers with a modified version of the Composite International Diagnostic Interview (DEGS‐CIDI) to assess symptoms, syndromes and diagnoses according to DSM‐IV‐TR (25 diagnoses covered). Of the participants 27.7% met criteria for at least one mental disorder during the past 12 months, among them 44% with more than one disorder and 22% with three or more diagnoses. Most frequent were anxiety (15.3%), mood (9.3%) and substance use disorders (5.7%). Overall rates for mental disorders were substantially higher in women (33% versus 22% in men), younger age group (18–34: 37% versus 20% in age group 65–79), when living without a partner (37% versus 26% with partnership) or with low (38%) versus high socio‐economic status (22%). High degree of urbanization (> 500,000 inhabitants versus < 20,000) was associated with elevated rates of psychotic (5.2% versus 2.5%) and mood disorders (13.9% versus 7.8%). The findings confirm that almost one third of the general population is affected by mental disorders and inform about subsets in the population who are particularly affected. Copyright © 2014 John Wiley & Sons, Ltd.
Keywords: mental disorders, prevalence, comorbidity
Introduction
It is well documented that mental disorders are widespread and are jointly responsible for the highest burden in terms of years lived with disability (YLD) in most European countries (Wittchen et al., 2011). Consistent with earlier findings from community surveys, it is estimated that at least one fourth of the adult population in Western countries meet criteria of at least one mental disorder during a 12 month time period (ESEMeD/MHEDEA 2000 Investigators, 2004; Kessler et al., 2012; de Graaf et al., 2010, 2012; Slade et al., 2009; Wittchen and Jacobi, 2005). These estimates were largely derived from studies conducted at least about 10 years ago and have prompted a number of initiatives (e.g. European Commission, 2005) to reduce the burden of mental disorders particularly by focusing on depression.
For Germany, nationally representative, sufficiently powered and comprehensive prevalence estimates of mental disorders according to the Diagnostic and Statistical Manual of Mental Disorders, Fourth Edition (DSM‐IV) became available from the German National Health Interview and Examination Survey (GNHIES‐98; Bellach et al., 1998; Robert‐Koch‐Institut, 2002) with its Mental Health Supplement (GHS‐MHS; Jacobi et al., 2002; Jacobi et al., 2004a). This study was conducted between 1997 and 1999 and estimated the 12‐month prevalence among persons aged 18–65 to be 31.1%. It revealed that the prevalence of mental disorders has been widely underestimated, that most mental disorders remain undiagnosed and untreated, and that they are associated with a high degree of disability and costs (Gustavsson et al., 2011; Wittchen, 2004; Wittchen and Jacobi, 2005; Wittchen et al., 2011). Further, the study examined associations with and interactions between mental and somatic health (Goodwin et al., 2003; Härter et al., 2007; Goodwin et al., 2012; Ratcliffe et al., 2009; Sareen et al., 2006) and associated impairments and help‐seeking (Wittchen and Jacobi, 2001; Jacobi et al., 2004b).
In response to the need for improved and up‐to‐date nationally representative data on morbidity the German Ministry of Health commissioned recently the German National Health Interview and Examination Survey for Adults (DEGS), which is part of a national health monitoring system conducted by the Robert Koch Institute (RKI). The first data collection wave of DEGS (DEGS1) was carried out from November 2008 to December 2011 (Scheidt‐Nave et al., 2012; Kamtsiuris et al., 2013; Kurth et al., 2012) and was – similar to the previous GNHIES/GHS‐MHS – supplemented by a separate mental health module (DEGS1‐MH). This new mental health survey, carried out from September 2009 to March 2012, was commissioned to maintain comparability to the previous GHS‐MHS study while providing a diagnostically even more comprehensive description of the size and burden of mental disorders, for example covering post‐traumatic stress disorder (PTSD) as well as cognitive impairment. When designing the new DEGS1 survey, the availability of the previous GNHIES‐98 and GMS‐MHS also prompted the development of a complex sampling scheme with the goal to define a national representative sample of the adult general population aged 18–79 years, enriched by participants of the previous 1998 survey. This allows for cross‐sectional analyses with cohort and trend analyses, as well as prospective risk factors examinations (see for details: Jacobi et al., 2013; Scheidt‐Nave et al., 2012; Kamtsiuris et al., 2013).
Aims
This paper reports about (a) the overall 12‐month prevalence of any mental disorder in Germany, (b) the prevalence of specific forms of mental disorders and (c) their comorbidity, emphasizing the frequency and distribution patterns by sex and age group and selected social strata of the population across the age span for a wide range of mental disorders.
Methods
The DEGS1‐MH study design and sampling within the DEGS1 survey has been presented in detail in previous publications (Jacobi et al., 2013; Kamtsiuris et al., 2013; Scheidt‐Nave et al., 2012) and will be only briefly described later. The study proposal, field procedures, and information for respondents of DEGS1 were approved by the Medical Ethics Review Committees responsible for DEGS1 (Charité, Berlin) and for DEGS1‐MH by the Ethics Board of the Technische Universität Dresden, respectively.
Sampling and response rate
A random sample of persons aged 18 to 79 years stratified for sex, age and geographical location was drawn from local population registries. First, among all German municipal communities, 180 study sample points were determined. Second, participants were randomly selected from local population registries covering the 180 sample points, supplemented by former participants of the predecessor GNHIES‐98 study, who had neither died nor moved abroad and who had agreed to renewed contact. Gross sample for DEGS1‐MH was a total of N = 7116 DEGS1 participants aged 18–79 years with complete assessment (interview and examinations). In DEGS1, the response rate was 62% for the former participants of the GNHIES‐98 study and 42% for the new DEGS1 participants (Kamtsiuris et al., 2013). For the mental health survey (DEGS1‐MH), DEGS1 participants were defined as eligible when meeting the following criteria: (a) age 18–79, (b) complete DEGS1 assessment consisting of the medical interview and examination, laboratory tests and self‐report scales, (c) informed consent to be re‐contacted by the independent DEGS1‐MH study team for the mental health supplement, (d) sufficient language skills to complete the mental health assessment and (e) availability during the assessment period. Persons who were institutionalized during the whole assessment period were thus not included. A total of 1088 DEGS1 participants were not eligible (986 provided no informed consent to be re‐contacted, 37 had insufficient language skills, 14 were long‐term hospitalized, six had died since the DEGS1 main survey, and for 45 no valid address for contact was available.
Of the DEGS1 participants N = 6028 were eligible for the mental health supplement (100%); 513/6028 (8.5%) refused participation, 125/6028 (2.1%) were willing to participate but the interview never took place, and 72/6028 (1.2%) could never be contacted despite considerable efforts. The remaining N = 5318/6028 persons form the final DEGS1‐MH sample yielding a conditional response rate of 88.2%.
Imputations
Out of the 5318 participants N = 4484 completed the full DEGS1‐MH assessment. The others, N = 834, completed only the core diagnostic part of the assessment package, based on the Composite International Diagnostic Interview (CIDI) stem screening questions (CID‐S; Wittchen et al., 1999), because of time constraints (N = 450), health problems (N = 49), and other reasons (N = 335). The statistical estimation of prevalence in this paper is based on the 4484 persons with a full data set and the 834 persons for which missing diagnostic information was imputed (see later), resulting in the total sample of N = 5318. We also imputed missing diagnostic information in a few cases among those with a full assessment (missing data by diagnostic section varied between N = 62/4484 to 156/4484; for full details of imputations, see Jacobi et al., 2013).
Imputation method
Model‐based estimates of probabilities for diagnoses were filled in to avoid selection bias due to those who did not complete the full CIDI and to enhance statistical precision for prevalence estimation and subsequent analyses. The use of CIDI screening items to predict missing values in diagnoses with (logistic) regressions is well‐established (Kessler et al., 2006). Basic covariates for predicting these probabilities were age, sex, their interaction, five dummy variables for the number of CIDI stem questions endorsed as well as, if they had additional predictive value, specific stem questions (among them a combined backward and forward selection was conducted, alpha for exclusion = 0.05, alpha for inclusion = 0.01). Also, quadratic and cubic terms for the age effect were added if necessary. For disorders with particularly low prevalence, where empty cells occurred, this procedure was simplified by choosing only age (linear term) and the dimensional number of stem items endorsed as basic covariates. In the present paper, prevalences are reported for the N = 5318 sample; tables for the N = 4484 with full assessment are provided as supplemental online material.
Weighting
Due to the complex sampling strategy of the survey, multiple weighting steps were required. Adopting the DEGS1 design, sample and attrition weights of the DEGS1 main survey respondents, post‐stratification weights were calculated for the DEGS1‐MH respondents to account for potential bias due to non‐eligibility (N = 1088/7116), non‐participation (N = 710/6028), and screening‐only (N = 834/5318). This was done (a) for the sample of N = 5318 and (b) for the sample of N = 4484. The resulting weighted distributions of both DEGS1‐MH samples fit the demographic distribution of the German population very well (Jacobi et al., 2013).
General conventions of the DEGS1 study program usually include the sample point as an additional design factor in the analyses (SVY procedures of Stata) but in the present analyses only the weighting (without sample point) was used because this yielded only marginal differences in the confidence intervals (CIs) and p‐values (point estimates are not affected).
Assessment
Within the comprehensive DEGS1‐MH assessment platform, the DEGS Composite International Diagnostic Interview (DIA‐X/M‐CIDI) was the main component. This fully structured algorithm‐ and computer‐based interview (Lachner et al., 1998; Reed et al., 1998; Wittchen et al., 1991; Wittchen, 1994; Wittchen and Pfister, 1997) is a modified version of the World Health Organization CIDI (Kessler and Üstün, 2004; Haro et al., 2006). Symptoms and syndromes according to the criteria of DSM‐IV‐TR (with its compatible International Classification of Diseases, 10th revision, [ICD‐10] codes) are reliably assessed for different time frames (four‐week, 12‐month, and lifetime for selected disorders), along with information about onset, duration, and severity of threshold and subthreshold conditions. Several adaptations were made to address the research questions in an optimal and efficient way, including:
The CIDI sections for substance use disorders were limited to nicotine dependence and alcohol and medication abuse and dependence. Illegal drug use disorders were not assessed because of the associated time burden and previous evidence of low base rates, which were insufficient for detailed analyses. Furthermore, several regular and specialized drug use surveys already exist in Germany (Kraus et al., 2010).
The use of CIDI skip‐rules in almost all diagnostic sections were minimized, to allow for the assessment of subthreshold conditions (conditions falling short of mandatory DSM‐IV‐TR diagnostic criteria), and to improve the dimensional description within the diagnostic status description.
Also, analyses with updated criteria of DSM‐5 are possible for some diagnoses.
It should be noted that different to the procedures in some other CIDI versions, all diagnostic sections were regularly administered (and not only if the key questions from the screening section were answered positively).
The DEGS‐CIDI covers the following groups of mental disorders: mental disorder due to general medical conditions or substance induced disorders, substance use disorders (nicotine dependence, alcohol and medication abuse and dependence), possible psychotic disorders (screening without further differential diagnosis, including both primary and secondary psychotic disorders), mood disorders (major depression, dysthymia, bipolar disorder I and II), anxiety disorders (panic disorder, agoraphobia, generalized anxiety disorder, social phobia, specific phobias), obsessive‐compulsive disorder, PTSD, somatoform disorders (pain disorder and undifferentiated somatoform disorder as measured by the Somatic Symptom Index, SSI4,6; Escobar et al., 1989), and eating disorders (anorexia nervosa, bulimia nervosa, binge eating disorder).
The interviews (computer‐assisted personal interviewing, CAPI) were usually performed 2–8 weeks after the main DEGS1 examination (time lag: median = six weeks; 55% < six weeks, 12% 6–12 weeks, 33% > 12 weeks). The assessment was conducted by clinically trained interviewers at the respondent's place of residence either at home (N = 1020), at local study centers that had been already used in the main survey assessment (N = 2715), or at another place of the participant's choice if neither home or study center were suitable (e.g. café, workplace; N = 187). Some, N = 562 (12.5%) interviews were conducted via telephone (computer‐assisted telephone interviewing, CATI). Interview duration (mean = 66.3 minutes; standard deviation [SD] = 27.7) varied depending on age and diagnostic status and could go up to several hours.
Correlates
Socio‐economic status (SES) was defined as an aggregate of educational level, current job position and income (Lampert et al., 2013) and divided into three categories (20% high – 60% medium – 20% low). Two regional variables were analyzed with regard to the distribution of mental disorders in the community: (a) urbanization was defined as size of municipality (using the official administrative municipal code) and was categorized in the present analyses into the following groups: < 20,000 inhabitants, 20,000–100,000, 100,000–500,000, > 500,000; and (b) former West versus East (including Berlin) Germany.
Analytic strategy
All prevalence estimates (N, weighted %, 95% CIs) were calculated using weighted data (see earlier and Jacobi et al., 2013) in order to address different sampling probabilities and systematic non‐participation. Since the data were not simple binary (0/1 coded) variables but also included the earlier mentioned imputed probabilities (ranging between zero and one), we used generalized linear models (Bernoulli regression with logit link which equals logistic regressions but values between zero and one are accepted unlike in the LOGIT procedure of Stata) and included only the intercept parameter to calculate confidence intervals. This resembles the common method based on logistic regression to calculate confidence intervals in case of simple 0/1 variables (as the case in the TABULATE procedure of Stata). Applying the logit link yields non‐symmetric confidence intervals reflecting the fact that prevalences are downward limited by zero. After calculating the confidence intervals for logit(p) (where p is an unknown prevalence) the results were re‐transformed to the prevalence scale.
Logistic regression models (odds ratios and 95% CIs) were used to quantify the associations between mental disorders and their correlates among N = 4484 with complete CIDI. Negative binomial regression with the log‐link was used to analyze differences in the number of met diagnoses and quantify them as mean ratios (MRs). Reference group was always the most frequent occurrence of the respective variable in order to yield maximum stability of the results. Age group and sex were adjusted for in each analysis to control for different base distributions of prevalence and comorbidity within the sample.
Comorbidity was defined as the presence of more than one disorder in the past 12‐month and was calculated by using the earlier mentioned 25 diagnoses within the N = 4484 sample. We also determined the most frequent combinations among the comorbid cases with more than one specific diagnosis. We restricted this analysis to (a) comorbidity only within anxiety disorders and (b) comorbidity between nine major groups of disorders (mental disorders due to general medical condition or substance induced disorders, substance use disorders without nicotine dependence, possible psychotic disorders, mood disorders, anxiety disorders, obsessive‐compulsive disorder, PTSD, somatoform disorders, eating disorders). We report only comorbid combinations that occurred in more of 3% of all comorbid cases.
To account for the weighting scheme, statistical inference (confidence intervals and p‐values) were based on the robust Huber–White sandwich estimator of variance (Royall, 1986) using sampling weights in STATA (option “pweight”; the survey prefix SVY might also be used yielding equal standard errors and minimally different confidence intervals). For all analyses the Stata software package, release 12.1 (StataCorp, 2012) was used.
Results
Twelve‐month prevalence
Table 1 shows CIDI/DSM‐IV‐TR 12‐month prevalence estimates for mental disorders with the corresponding 95%‐CIs and differentiated by gender and age group for the total sample (N = 5318) (supplementary online material with age specific prevalences by gender and subsets of data for the N=4484 are available; online e‐Tables 1, 2 and 3). Overall, 27.7% (95% CI: 26.3–29.2) of the respondents met criteria for one or more mental disorder in the 12 months preceding the interview. When including nicotine dependence, the overall prevalence was 34.4%.
Table 1.
Twelve‐month prevalences of mental disorders (M‐CIDI/DSM‐IV‐TR) in the general population (DEGS1‐MH; N = 5318)a
| s | Total | Men | Women | 18–34 | 35–49 | 50–64 | 65–79 | |||||||||||||||||||||
|---|---|---|---|---|---|---|---|---|---|---|---|---|---|---|---|---|---|---|---|---|---|---|---|---|---|---|---|---|
| N | %w | 95%CI | N | %w | 95%CI | N | %w | 95%CI | N | %w | 95%CI | N | %w | 95%CI | N | %w | 95%CI | N | %w | 95%CI | ||||||||
| Any mental disorder due to general medical condition or substance induced disorders (F06) | 56 | 1.2 | 0.9 | 1.6 | 28 | 1.2 | 0.8 | 1.8 | 28 | 1.2 | 0.8 | 1.9 | 11 | 1.7 | 0.9 | 3.2 | 10 | 0.7 | 0.4 | 1.3 | 19 | 1.3 | 0.8 | 2.1 | 16 | 1.2 | 0.7 | 2.2 |
| Any substance use disorder (F1)b | 767 | 16.6 | 15.4 | 17.9 | 424 | 19.4 | 17.5 | 21.3 | 343 | 13.9 | 12.4 | 15.6 | 221 | 23.4 | 20.5 | 26.6 | 240 | 19.4 | 17.0 | 22.0 | 220 | 15.4 | 13.3 | 17.7 | 85 | 6.1 | 4.8 | 7.7 |
| Any substance use disorder (without nicotine dependence) | 259 | 5.7 | 5.0 | 6.6 | 170 | 7.9 | 6.7 | 9.4 | 89 | 3.5 | 2.8 | 4.5 | 77 | 8.4 | 6.6 | 10.6 | 66 | 5.9 | 4.5 | 7.8 | 78 | 5.5 | 4.2 | 7.2 | 38 | 2.5 | 1.7 | 3.5 |
| Alcohol abuse | 80 | 1.8 | 1.4 | 2.3 | 71 | 3.1 | 2.4 | 4.1 | 9 | 0.4 | 0.2 | 0.9 | 35 | 3.4 | 2.4 | 4.8 | 23 | 2.0 | 1.2 | 3.1 | 15 | 1.0 | 0.5 | 2.0 | 7 | 0.4 | 0.2 | 0.8 |
| Alcohol dependence | 137 | 3.0 | 2.5 | 3.6 | 96 | 4.4 | 3.5 | 5.5 | 41 | 1.6 | 1.1 | 2.2 | 43 | 4.8 | 3.5 | 6.5 | 36 | 2.6 | 1.8 | 3.7 | 45 | 3.4 | 2.4 | 4.8 | 13 | 0.8 | 0.5 | 1.4 |
| Medication abuse | 70 | 1.6 | 1.2 | 2.0 | 29 | 1.5 | 1.0 | 2.2 | 41 | 1.7 | 1.1 | 2.4 | 13 | 1.5 | 0.9 | 2.7 | 19 | 2.1 | 1.2 | 3.5 | 23 | 1.4 | 0.9 | 2.2 | 15 | 1.0 | 0.6 | 1.8 |
| Medication dependence | 20 | 0.5 | 0.3 | 0.8 | 6 | 0.3 | 0.1 | 0.6 | 14 | 0.7 | 0.4 | 1.2 | 3 | 0.5 | 0.1 | 1.5 | 4 | 0.4 | 0.2 | 1.1 | 6 | 0.6 | 0.3 | 1.3 | 7 | 0.5 | 0.2 | 1.2 |
| Nicotine dependence | 598 | 13.1 | 12.1 | 14.3 | 316 | 14.6 | 13.0 | 16.3 | 282 | 11.7 | 10.3 | 13.3 | 177 | 18.9 | 16.2 | 21.8 | 204 | 15.9 | 13.8 | 18.2 | 163 | 11.7 | 9.9 | 13.9 | 53 | 4.0 | 3.0 | 5.4 |
| Possible psychotic disorder (F2 and other groups of psychotic disorders)c | 114 | 2.6 | 2.1 | 3.2 | 47 | 2.1 | 1.5 | 2.8 | 67 | 3.1 | 2.3 | 4.1 | 36 | 4.2 | 2.9 | 6.2 | 31 | 2.2 | 1.5 | 3.2 | 31 | 2.5 | 1.6 | 3.7 | 16 | 1.3 | 0.7 | 2.4 |
| Any mood disorder (F3) | 457 | 9.3 | 8.3 | 10.3 | 150 | 6.1 | 5.1 | 7.2 | 307 | 12.4 | 10.9 | 14.1 | 130 | 14.7 | 12.2 | 17.6 | 128 | 9.7 | 8.0 | 11.6 | 124 | 6.6 | 5.5 | 8.0 | 74 | 5.4 | 4.1 | 7.1 |
| Unipolar depression | 390 | 7.7 | 6.9 | 8.6 | 124 | 4.8 | 4.0 | 5.7 | 266 | 10.6 | 9.2 | 12.2 | 97 | 11.3 | 9.1 | 14.0 | 106 | 7.9 | 6.4 | 9.6 | 112 | 5.9 | 4.8 | 7.2 | 74 | 5.4 | 4.1 | 7.1 |
| Any bipolar disorder | 66 | 1.5 | 1.1 | 2.0 | 26 | 1.3 | 0.8 | 2.0 | 40 | 1.7 | 1.2 | 2.5 | 33 | 3.3 | 2.2 | 4.8 | 21 | 1.7 | 1.0 | 2.8 | 11 | 0.7 | 0.4 | 1.4 | 1 | 0.1 | 0.0 | 0.2 |
| Major depressive disorder | 300 | 6.0 | 5.2 | 6.8 | 92 | 3.4 | 2.8 | 4.3 | 208 | 8.4 | 7.2 | 9.9 | 78 | 9.0 | 7.0 | 11.5 | 87 | 6.5 | 5.1 | 8.2 | 84 | 4.3 | 3.4 | 5.4 | 50 | 3.7 | 2.6 | 5.2 |
| Dysthymia | 99 | 2.0 | 1.6 | 2.4 | 34 | 1.4 | 1.0 | 2.0 | 65 | 2.5 | 1.9 | 3.2 | 22 | 2.7 | 1.8 | 4.0 | 22 | 1.6 | 1.0 | 2.4 | 29 | 1.7 | 1.1 | 2.6 | 26 | 1.9 | 1.2 | 2.9 |
| Bipolar I disorder | 45 | 1.0 | 0.7 | 1.4 | 17 | 0.9 | 0.5 | 1.5 | 28 | 1.1 | 0.7 | 1.6 | 20 | 1.9 | 1.2 | 3.0 | 13 | 1.1 | 0.6 | 2.0 | 10 | 0.7 | 0.4 | 1.4 | 1 | 0.1 | 0.0 | 0.2 |
| Bipolar II disorder | 23 | 0.6 | 0.4 | 1.0 | 10 | 0.5 | 0.2 | 1.1 | 13 | 0.7 | 0.4 | 1.3 | 14 | 1.6 | 0.9 | 2.9 | 9 | 0.7 | 0.3 | 1.6 | 1 | 0.0 | 0.0 | 0.1 | 0 | 0.0 | 0.0 | 0.0 |
| Any anxiety disorder (F40, F41) | 762 | 15.3 | 14.2 | 16.6 | 224 | 9.3 | 8.0 | 10.8 | 538 | 21.3 | 19.4 | 23.2 | 177 | 18.0 | 15.4 | 21.0 | 214 | 16.2 | 14.0 | 18.7 | 227 | 15.3 | 13.2 | 17.5 | 144 | 11.0 | 9.0 | 13.4 |
| Panic disorderd | 105 | 2.0 | 1.6 | 2.5 | 27 | 1.2 | 0.8 | 1.8 | 78 | 2.8 | 2.2 | 3.6 | 19 | 1.5 | 0.9 | 2.3 | 38 | 2.9 | 2.0 | 4.2 | 34 | 2.5 | 1.7 | 3.7 | 14 | 0.8 | 0.4 | 1.5 |
| Agoraphobia | 192 | 4.0 | 3.4 | 4.7 | 59 | 2.3 | 1.7 | 3.1 | 133 | 5.6 | 4.6 | 6.8 | 40 | 4.1 | 2.9 | 5.9 | 57 | 4.1 | 3.0 | 5.5 | 61 | 4.1 | 3.1 | 5.5 | 34 | 3.5 | 2.2 | 5.3 |
| Social phobia | 113 | 2.7 | 2.2 | 3.4 | 44 | 1.9 | 1.4 | 2.5 | 68 | 3.6 | 2.7 | 4.8 | 37 | 4.6 | 3.2 | 6.6 | 35 | 3.1 | 2.1 | 4.6 | 32 | 2.1 | 1.4 | 3.2 | 9 | 0.7 | 0.3 | 1.5 |
| Generalized anxiety disorder | 103 | 2.2 | 1.8 | 2.8 | 37 | 1.5 | 1.1 | 2.2 | 66 | 2.9 | 2.2 | 4.0 | 22 | 3.3 | 2.0 | 5.2 | 29 | 2.0 | 1.4 | 2.9 | 35 | 2.3 | 1.6 | 3.3 | 17 | 1.3 | 0.7 | 2.6 |
| Specific phobiase | 507 | 10.3 | 9.3 | 11.3 | 125 | 5.1 | 4.2 | 6.2 | 382 | 15.4 | 13.8 | 17.2 | 120 | 12.3 | 10.1 | 14.9 | 128 | 9.5 | 7.9 | 11.5 | 156 | 10.8 | 9.1 | 12.9 | 103 | 8.3 | 6.6 | 10.5 |
| Obsessive compulsive disorder (F42) | 155 | 3.6 | 3.1 | 4.4 | 65 | 3.3 | 2.6 | 4.3 | 90 | 4.0 | 3.1 | 5.1 | 61 | 7.4 | 5.6 | 9.6 | 44 | 3.6 | 2.6 | 4.9 | 33 | 2.2 | 1.5 | 3.1 | 17 | 1.1 | 0.7 | 1.9 |
| Post‐traumatic stress disorder (F43) | 108 | 2.3 | 1.8 | 2.8 | 22 | 0.9 | 0.6 | 1.5 | 85.0 | 3.6 | 2.8 | 4.6 | 32 | 3.7 | 2.5 | 5.5 | 30 | 2.5 | 1.7 | 3.8 | 20 | 1.0 | 0.6 | 1.5 | 25 | 1.8 | 1.2 | 2.8 |
| Any somatoform disorder/syndrome (F45)f | 186 | 3.5 | 2.9 | 4.1 | 48 | 1.7 | 1.3 | 2.4 | 138 | 5.2 | 4.3 | 6.4 | 45 | 4.2 | 3.0 | 5.9 | 54 | 3.8 | 2.8 | 5.2 | 57 | 3.6 | 2.6 | 5.0 | 30 | 2.0 | 1.3 | 3.1 |
| SSI4,6 | 37 | 0.8 | 0.5 | 1.1 | 17 | 0.6 | 0.4 | 1.0 | 20 | 0.9 | 0.6 | 1.6 | 7 | 0.9 | 0.4 | 1.9 | 8 | 0.6 | 0.3 | 1.3 | 14 | 0.9 | 0.5 | 1.5 | 8 | 0.8 | 0.3 | 1.9 |
| Pain disorder | 165 | 3.2 | 2.6 | 3.8 | 35 | 1.3 | 0.9 | 1.8 | 130 | 5.0 | 4.1 | 6.2 | 41 | 3.9 | 2.8 | 5.5 | 53 | 3.7 | 2.8 | 5.1 | 46 | 3.0 | 2.1 | 4.4 | 25 | 1.6 | 1.0 | 2.5 |
| Any eating disorder (F50)g | 45 | 0.9 | 0.7 | 1.3 | 11 | 0.5 | 0.3 | 0.9 | 35 | 1.4 | 0.9 | 2.1 | 23 | 2.3 | 1.4 | 3.7 | 7 | 0.5 | 0.2 | 0.9 | 9 | 0.6 | 0.3 | 1.3 | 7 | 0.4 | 0.1 | 1.1 |
| Anorexia nervosa | 32 | 0.7 | 0.5 | 1.1 | 6 | 0.3 | 0.2 | 0.8 | 25 | 1.1 | 0.7 | 1.8 | 18 | 2.0 | 1.1 | 3.4 | 5 | 0.4 | 0.2 | 0.9 | 3 | 0.3 | 0.1 | 1.0 | 6 | 0.4 | 0.1 | 1.1 |
| Bulimia Nervosa | 12 | 0.2 | 0.1 | 0.3 | 2 | 0.1 | 0.0 | 0.3 | 10 | 0.3 | 0.2 | 0.5 | 5 | 0.4 | 0.2 | 0.8 | 2 | 0.1 | 0.0 | 0.2 | 4 | 0.3 | 0.1 | 0.7 | 0 | 0.0 | 0.0 | 0.0 |
| Binge eating disorder | 6 | 0.1 | 0.0 | 0.2 | 3 | 0.1 | 0.0 | 0.2 | 3 | 0.1 | 0.0 | 0.4 | 1 | 0.1 | 0.0 | 0.6 | 2 | 0.1 | 0.0 | 0.5 | 2 | 0.1 | 0.0 | 0.4 | 0 | 0.0 | 0.0 | 0.0 |
| Any of the above | 1713 | 34.4 | 32.9 | 36.0 | 705 | 30.2 | 28.1 | 32.4 | 1008 | 38.6 | 36.4 | 40.8 | 427 | 44.0 | 40.5 | 47.5 | 477 | 36.3 | 33.4 | 39.4 | 506 | 32.7 | 29.9 | 35.5 | 302 | 22.4 | 19.8 | 25.3 |
| Any of the above (without nicotine dependence) | 1401 | 27.7 | 26.3 | 29.2 | 525 | 22.0 | 20.1 | 24.1 | 875 | 33.3 | 31.2 | 35.5 | 348 | 35.8 | 32.5 | 39.3 | 371 | 28.0 | 25.2 | 30.9 | 415 | 26.2 | 23.7 | 28.9 | 266 | 19.5 | 17.0 | 22.2 |
Weighted data; cell counts sometimes do not add up to total counts because missings in the diagnostic variable were imputed; DSM‐IV hierarchy rules were dropped.
Without illicit drug abuse/dependence (not assessed).
Screening for schizophrenia and other psychotic disorders without further differential diagnosis; includes psychotic features occurring as part of mood disorders and psychotic disorders due to general medical conditions.
With or without agoraphobia.
Animal, natural environment, blood‐injection‐injury, and situational type.
Somatic Symptom Index (SSI4,6), pain disorder.
Anorexia nervosa, atypical anorexia nervosa, bulimia nervosa, atypical bulimia nervosa, binge eating disorder
Table 2.
Comorbidity among the DEGS1‐MH cases with at least one 12‐month diagnosis (DEGS1‐MH data from N = 4484 with full diagnostic information)a
| Total | Men | Women | ||||||||||||||
|---|---|---|---|---|---|---|---|---|---|---|---|---|---|---|---|---|
| Number dx | N | %w | 95% CI | N | %w | 95% CI | N | %w | 95% CI | |||||||
| One | 709 | 55.6 | 51.9 | 59.2 | 292 | 64.0 | 58.2 | 69.5 | 417 | 50.2 | 45.5 | 54.9 | ||||
| Two | 250 | 22.1 | 19.1 | 25.4 | 94 | 21.7 | 17.1 | 27.1 | 156 | 22.3 | 18.6 | 26.6 | ||||
| Three | 106 | 9.6 | 7.7 | 12.0 | 26 | 6.3 | 4.0 | 9.6 | 80 | 11.7 | 9.0 | 15.1 | ||||
| Four | 61 | 5.6 | 4.1 | 7.5 | 17 | 3.4 | 2.0 | 5.8 | 44 | 7.0 | 4.8 | 9.9 | ||||
| Five+ | 69 | 7.2 | 5.3 | 9.6 | 20 | 4.7 | 2.8 | 7.8 | 49 | 8.8 | 6.1 | 12.4 | ||||
| 18–34 | 35–49 | 50–64 | 65–79 | |||||||||||||
| Number dx | N | %w | 95% CI | N | %w | 95% CI | N | %w | 95% CI | N | %w | 95% CI | ||||
| One | 155 | 50.8 | 43.6 | 58.0 | 175 | 54.7 | 47.6 | 61.6 | 224 | 57.5 | 50.9 | 63.9 | 155 | 63.6 | 54.7 | 72.0 |
| Two | 61 | 22.8 | 17.2 | 29.5 | 65 | 22.5 | 17.3 | 29.0 | 70 | 20.0 | 15.2 | 26.1 | 54 | 23.3 | 16.1 | 31.8 |
| Three | 29 | 9.3 | 6.1 | 14.2 | 37 | 11.9 | 7.9 | 17.5 | 31 | 10.8 | 7.2 | 15.5 | 9 | 3.8 | 1.8 | 7.8 |
| Four | 21 | 7.3 | 4.5 | 12.1 | 12 | 3.6 | 1.9 | 6.7 | 19 | 5.9 | 3.5 | 9.7 | 9 | 5.0 | 1.8 | 13.3 |
| Five+ | 21 | 9.8 | 5.7 | 15.7 | 20 | 7.3 | 4.2 | 12.4 | 20 | 5.8 | 3.4 | 10.0 | 8 | 4.3 | 1.9 | 9.3 |
From the total sample (N = 5318), among N = 1401 estimated cases with any diagnosis (without nicotine dependence) 206 cannot be evaluated with regard to comorbid proportions because they result from adding up imputed probabilities < 1. Among the remaining N = 1195 cases with at least one diagnosis, a total of 2198 diagnoses (unweighted) were assigned (male 12‐month cases: M = 1.73, SD = 1.45; female 12‐month cases: M = 2.14, SD = 1.71; weighted).
Table 3.
Socio‐demographic correlates of major diagnostic subgroups (12‐month; DEGS1‐MH weighted data from sample with full CIDI information; N = 4484)
| Distribution of correlate in sample | Twelve‐month prevalence if correlate present | ||||||||||||||||||||
|---|---|---|---|---|---|---|---|---|---|---|---|---|---|---|---|---|---|---|---|---|---|
| Any substance use disorder | Any possible psychotic disorder | Any mood disorder | Any anxiety disorder | Any somatoform disorder | |||||||||||||||||
| %w | %w | ORa | 95% CI | p‐Value | %w | ORa | 95% CI | p‐Value | %w | ORa | 95% CI | p‐Value | %w | ORa | 95% CI | p‐Value | %w | ORa | 95% CI | p‐Value | |
| Sex | |||||||||||||||||||||
| Men | 49.2 | 8.0 | ref. | 2.1 | ref. | 6.2 | ref. | 9.6 | ref. | 1.8 | ref. | ||||||||||
| Women | 50.8 | 3.6 | 0.4 | 0.3–0.6 | 0.000 | 3.2 | 1.5 | 0.9–2.5 | 0.118 | 12.8 | 2.2 | 1.7–2.9 | 0.000 | 22.1 | 2.7 | 2.1–3.4 | 0.000 | 5.5 | 3.2 | 2.0–4.9 | 0.000 |
| Age | |||||||||||||||||||||
| 18–34 | 24.4 | 8.0 | 1.4 | 0.9–2.2 | 0.202 | 4.5 | 2.1 | 1.1–4.1 | 0.028 | 15.3 | 1.7 | 1.2–2.4 | 0.028 | 18.8 | 1.1 | 0.8–1.5 | 0.441 | 4.4 | 1.1 | 0.6–1.9 | 0.777 |
| 35–49 | 29.5 | 6.1 | ref. | 2.2 | ref. | 9.7 | ref. | 16.9 | ref. | 4.0 | ref. | ||||||||||
| 50–64 | 25.4 | 5.9 | 1.0 | 0.6–1.5 | 0.874 | 2.6 | 1.2 | 0.6–2.4 | 0.568 | 6.7 | 0.7 | 0.5–0.9 | 0.019 | 16.1 | 0.9 | 0.7–1.2 | 0.644 | 3.8 | 0.9 | 0.5–1.6 | 0.805 |
| 65–79 | 20.7 | 2.5 | 0.4 | 0.2–0.7 | 0.001 | 1.4 | 0.6 | 0.3–1.5 | 0.306 | 5.9 | 0.6 | 0.4–0.9 | 0.006 | 11.2 | 0.6 | 0.4–0.8 | 0.003 | 2.1 | 0.5 | 0.3–0.9 | 0.028 |
| Marital status | |||||||||||||||||||||
| Married | 59.3 | 3.8 | ref. | 1.5 | ref. | 6.4 | ref. | 14.3 | ref. | 2.7 | ref. | ||||||||||
| Never married | 13.5 | 7.9 | 2.2 | 1.3–3.5 | 0.002 | 3.8 | 2.5 | 1.2–5.2 | 0.014 | 14.8 | 2.5 | 1.7–3.7 | 0.000 | 20.0 | 1.5 | 1.1–2.0 | 0.010 | 5.4 | 2.1 | 1.2–3.7 | 0.014 |
| Separated/divorced/widowed | 27.1 | 9.0 | 2.5 | 1.7–3.7 | 0.000 | 4.6 | 3.1 | 1.7–5.5 | 0.000 | 13.8 | 2.3 | 1.7–3.2 | 0.000 | 17.7 | 1.3 | 1.0–1.7 | 0.047 | 4.9 | 1.9 | 1.2–2.9 | 0.009 |
| Current partnership | |||||||||||||||||||||
| Yes | 73.7 | 4.9 | ref. | 2.0 | ref. | 7.1 | ref. | 15.2 | ref. | 3.3 | ref. | ||||||||||
| No | 26.2 | 8.1 | 1.7 | 1.2–2.5 | 0.004 | 4.6 | 2.4 | 1.4–4.0 | 0.001 | 16.3 | 2.5 | 1.9–3.4 | 0.000 | 18.0 | 1.2 | 1.0–1.6 | 0.102 | 4.7 | 1.5 | 0.9–2.3 | 0.090 |
| Educational level b | |||||||||||||||||||||
| Low | 34.0 | 6.5 | 1.1 | 0.8–1.6 | 0.598 | 3.0 | 1.1 | 0.6–2.0 | 0.735 | 8.5 | 0.8 | 0.6–1.1 | 0.122 | 16.8 | 1.0 | 0.8–1.3 | 0.871 | 3.1 | 0.6 | 0.4–1.0 | 0.063 |
| Medium | 52.1 | 5.9 | ref. | 2.7 | ref. | 10.7 | ref. | 16.5 | ref. | 4.7 | ref. | ||||||||||
| High | 13.9 | 3.4 | 0.6 | 0.3–1.0 | 0.063 | 2.1 | 0.8 | 0.4–1.5 | 0.488 | 7.4 | 0.7 | 0.5–1.0 | 0.035 | 12.2 | 0.7 | 0.5–1.0 | 0.022 | 1.0 | 0.2 | 0.1–0.4 | 0.000 |
| Socio‐economic status c | |||||||||||||||||||||
| Low | 19.5 | 9.7 | 2.3 | 1.5–3.5 | 0.000 | 4.6 | 1.9 | 1.0–3.6 | 0.041 | 14.0 | 1.6 | 1.2–2.3 | 0.005 | 21.3 | 1.4 | 1.1–1.9 | 0.017 | 3.6 | 0.9 | 0.5–1.6 | 0.730 |
| Medium | 60.2 | 4.6 | ref. | 2.4 | ref. | 9.1 | ref. | 16.0 | ref. | 4.0 | ref. | ||||||||||
| High | 20.3 | 5.4 | 1.2 | 0.8–1.9 | 0.454 | 1.6 | 0.7 | 0.4–1.2 | 0.200 | 6.3 | 0.7 | 0.5–0.9 | 0.020 | 11.0 | 0.7 | 0.5–0.9 | 0.002 | 2.5 | 0.6 | 0.4–1.1 | 0.086 |
| Employment | |||||||||||||||||||||
| Yes | 60.2 | 5.0 | ref. | 2.3 | ref. | 9.4 | ref. | 15.1 | ref. | 3.1 | ref. | ||||||||||
| Nod | 39.8 | 6.9 | 1.4 | 1.0–2.0 | 0.068 | 3.3 | 1.5 | 0.9–2.5 | 0.135 | 9.7 | 1.0 | 0.8–1.4 | 0.810 | 17.3 | 1.2 | 0.9–1.5 | 0.138 | 4.5 | 1.4 | 1.0–2.2 | 0.084 |
| Urbanization | |||||||||||||||||||||
| < 20,000 inhabitants | 39.2 | 5.8 | ref. | 2.5 | ref. | 7.8 | ref. | 15.2 | ref. | 2.8 | ref. | ||||||||||
| 20,000 to < 100,000 | 29.8 | 4.7 | 0.8 | 0.5–1.2 | 0.328 | 1.7 | 0.7 | 0.4–1.2 | 0.200 | 10.0 | 1.3 | 1.0–1.8 | 0.096 | 16.0 | 1.1 | 0.8–1.4 | 0.657 | 4.1 | 1.5 | 0.9–2.4 | 0.124 |
| 100,000 to < 500,000 | 15.2 | 6.2 | 1.1 | 0.6–1.8 | 0.790 | 2.7 | 1.1 | 0.5–2.4 | 0.855 | 8.3 | 1.1 | 0.7–1.6 | 0.737 | 14.1 | 0.9 | 0.7–1.3 | 0.606 | 3.7 | 1.3 | 0.7–2.4 | 0.363 |
| > 500,000 | 15.8 | 7.3 | 1.3 | 0.8–2.1 | 0.339 | 5.2 | 2.2 | 1.1–4.3 | 0.028 | 13.9 | 1.9 | 1.3–2.8 | 0.002 | 19.6 | 1.4 | 1.0–1.9 | 0.057 | 4.8 | 1.7 | 0.9–3.3 | 0.091 |
Odds ratios (OR) from logistic regression and 95% confidence intervals; marital status, partnership, educational level, socio‐economic status, employment and urbanization controlled for age and sex.
CASMIN classification.
Index of social class (Lampert et al., 2013) derived from information on education, income and current (job) position.
No: unemployed, retired, student.
Anxiety disorders, including panic disorder, agoraphobia, generalized anxiety disorder, social and specific phobia, were the most frequent group of mental disorders (15.3%), followed by unipolar depression (7.7%) and alcohol/medication use disorders (5.7%). Mental disorders due to a general medical condition or substance‐induced disorders according to the interview´s probe flow chart questions were considerably less frequent (1.2%) and ranked similar as eating disorders (anorexia, bulimia, binge eating) as the least frequent single diagnoses (0.9%).
There was a substantial degree of comorbidity; 56% of those with at least one DSM‐IV diagnosis had just one, 22% two and 22% three or more diagnoses (Table 2). Among the cases with more than one diagnoses we determined the most frequent combinations. Out of the N = 486 comorbid cases, 76 (weighted: 15.4%) had anxiety disorders only. Comorbidity between the nine major diagnostic groups occurred in 98 different diagnostic combinations of the possible 520 (29 – 1 + 9) in at least one case. Eighty‐three cases (17.2%) showed the combination anxiety‐affective disorders, 23 (4.8%) anxiety‐affective‐somatoform disorders, 22 (4.7%) anxiety‐substance use disorders. The remaining comorbid cases (n = 282, 57.9%) showed combinations that occurred only rarely (< 3%).
Comorbidity rates by diagnoses are presented in the supplementary material; online e‐Table 4).
Prevalence by age and gender
Prevalence rates differed substantially by age and gender. For example, rates of alcohol dependence were ten 10 times higher in men under 35 years as compared to women older than 64 years with 7.3% (95% CI: 5.1–10.5) versus 0.6% (95% CI: 0.3–1.3; see e‐Table 1, additional online material), rates of panic disorder in 50 to 64 year old women were substantially higher as compared to men under 35 years with 3.7% (95% CI: 2.4–5.7) versus 0.4% (95% CI: 0.2–0.9). Overall, except for substance use disorders (men: 6.7% versus women: 3.5%), women had a substantially higher rate of mental disorders than men (odds ratio [OR] =1.83, 95% CI: 1.53–2.19, controlled for age group). For the following mental disorders, no significant gender differences were found: mental disorders due to substance or general medical factors, psychotic disorders, and obsessive‐compulsive disorder. Women were more likely than men to suffer from comorbid mental disorders (50% versus 36%; Table 2); among the 12‐month cases, women had 23% more diagnoses, with a mean of 2.1 diagnoses (SD = 1.7) of mental disorders per person compared to men with a mean of 1.7 (SD = 1.5) diagnoses per person (MR = 1.58; 95% CI: 1.20–2.08; excess mean ratio from negative binomial regression, controlled for age group).
Compared to the most frequent age group in the sample (35–49), the younger age group (< 35) showed higher rates of substance use disorders, mood disorders, anxiety disorders (women only) and eating disorders, whereas the older age group (65–79) showed considerably lower rates in most diagnoses. Overall (Figure 1, upper left), compared to the 35–49 year‐old persons, the younger respondents (< 35) had a higher odds of a 12‐month diagnosis of a mental disorder (36.7% versus 28.5%; OR = 1.46, 95% CI: 1.14–1.87) and the older persons (65–79) had a lower odds (20.3% versus 28.5%; OR = 0.64, 95% CI: 0.50–0.83). In women, the higher odds in the youngest age group did not reach statistical significance (43% versus 35.6% in age group 35–49; OR = 1.37, 95% CI: 0.99–1.90, p < 0.060).
Figure 1.
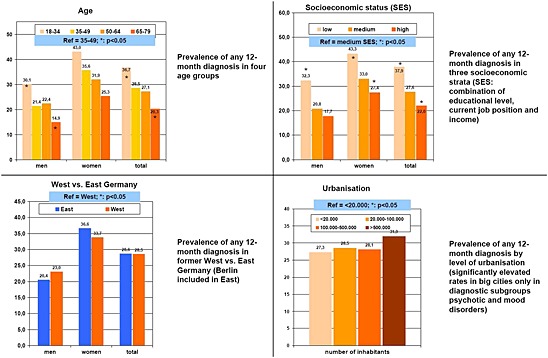
Twelve‐month prevalence of any mental disorder stratified by socio‐demographic factors (age, SES, West versus East Germany, urbanization); DEGS1‐MH weighted data from sample with full CIDI information (N = 4484); Ref: reference category (group with highest number of probands); *: significant (p < 0.05; controlled for age and sex) difference to reference category.
Socio‐demographic correlates and frequency of mental disorders in different strata of the population
As shown in Figure 1 (overall rate) and Table 3 (diagnostic level) mental disorders were not equally distributed in various socio‐demographic subsets of the population and the overall prevalence of mental disorders differed considerably in core demographic variables.
Lower compared to medium SES was significantly associated with elevated rates of any diagnosis (37.9% versus 27.6%; OR = 1.7, 95% CI: 1.3–2.2; Figure 1 upper right; all presented ORs are controlled for age and sex) as well as in most classes of specific diagnoses shown in Table 3. Higher compared to medium SES was associated with lower prevalences of any diagnosis (22.0 versus 27.3%; OR = 0.79, 95% CI: 0.63–0.97; Figure 1, upper right) which is also significant on a diagnostic level in the groups of mood and anxiety disorders, but not the other groups of specific mental disorders (Table 3).
Concerning the regional variables analyzed with regard to the distribution of mental disorders in Germany, the East/West analysis showed no association at all (28.6% versus 28.5%; Figure 1, lower left). Living in an urban environment (> 500,000 versus < 20,000 inhabitants) showed no significant association with the overall 12 month prevalence of mental disorders (31.9% versus 27.3%; OR = 1.2, 95% CI: 0.84–1.3; Figure 1, lower right), but was strongly associated with the diagnostic groups of possible psychotic disorders (5.2% versus 2.5%; OR = 2.2, 95% CI: 1.1–4.3) and mood disorders (13.9% versus 7.8%; OR = 1.9, 95% CI: 1.3–2.8; Table 3).
Further significant associations on a specific diagnostic level (Table 3) were found between having no current partnership and any substance use disorder (without nicotine dependence) (8.1% versus 4.9%; OR = 1.7, 95% CI: 1.2–2.5). These rates were also elevated in participants with legal status “divorced/separated/widowed” compared to “married” (9.0% versus 3.8%; OR = 2.5, 95% CI: 1.7–3.7) and “never married” (7.9% versus 3.8%; OR = 2.2, 95% CI: 1.3–3.5).
Discussion
This paper summarizes the prevalence findings for mental disorders of the most recent up‐to‐date nationwide general population study in Germany among 18 to 79 year olds. The prevalence findings are complemented by two associated publications covering impairment/disability (Mack et al., in preparation) and service use (Mack et al., 2014). The core findings regarding prevalence are:
One in three women and about one in four men aged 18–79 meets diagnostic criteria of at least one DSM‐IV‐TR disorder during the past 12 months before the clinical examination (overall 12‐month prevalence: 27.7%).
Most frequent groups of mental disorders were anxiety disorders (15.3%), mood disorders (9.3%) and substance use disorders (5.7%).
The prevalence of mental disorders differs substantially by SES and age. Highest prevalence rates were found for women and younger age groups and consistent with the risk factor exploration, among those not married, and not living in a partnership, those with a low SES and less consistently those living in urbanized, respectively metropolitan areas (increased odds only for psychotic and mood disorders).
Despite the still existing social disparities between former East and West Germany we find no significant differences in the prevalence rates of mental disorders.
Comorbidity of several mental disorders occurred in nearly half of all survey participants who had a mental disorder.
Although matched comparisons between previous German mental health surveys and DEGS1‐MH have not yet been performed, crude comparisons of the total prevalence between the preceding national survey (GHS‐MHS) 1998 and the DEGS1‐MH findings seem not to indicate major changes in the 12‐month prevalence rates of mental disorders.
Besides the fact that we provide improved and more comprehensive up‐to‐date estimates, we confirm previous estimations that mental disorders in Germany are widespread. More than 25% of the German population are affected by any of the mental disorders (within a given year) and the degree of comorbidity of mental disorders is high. Anxiety, mood and substance use disorders are the most frequent mental disorders. Men and women show in part remarkably different diagnostic patterns. We also confirm that rates of mental disorders are highest among the younger respondents and lowest among the elder persons (Wittchen et al., 2011; Volkert et al., 2013).
In comparison to the published estimates from our previous national German survey in 1998 (GHS‐MHS, Jacobi et al., 2004a), there seem to be no apparent indications for increased or lower rates. However, we caution at this point to simply compare the current and the past findings, because firm conclusions on this issue demand carefully matched comparisons that take into account as far as possible all differences between studies that might have an effect on prevalence. Such (potential) differences include sampling and design factors (e.g. a special two‐stage design and over‐sampling in East Germany in the GHS‐MHS, see Jacobi et al., 2002), changes in population parameters over the time period of around 15 years (e.g. demographic change), weighting (e.g. different variables included in GHS‐MHS and DESGS1‐MH weights), diagnostic coverage and definition (e.g. additional inclusion of PTSD in DEGS1‐MH, modified diagnostic algorithms in some diagnoses), modifications in the assessment instrument (e.g. possible sequence effects due to additional neuropsychological and questionnaire assessments embedded in the DEGS1‐MH CIDI) etc.
In comparison to recent European Union (EU)‐wide estimations, that are superficially suggestive of higher rates (38% across all EU studies, Wittchen et al., 2011) one needs to consider that the EU estimation included a wider set of diagnoses (e.g. autism, attention deficit hyperactivity disorder, personality disorders, sleep disorders, dementia) not covered in the current DEGS‐MH analysis.
Beyond the confirmation of previous estimates, this paper adds important information in at least two ways: (a) it reports for the first time German representative estimates of PTSD, bipolar I and II, binge eating and medication use disorders; (b) it draws attention to the considerable variation of prevalence by age, gender and other socio‐demographic variables, highlighting identifiable groups to adapt and target preventive, diagnostic and therapeutic measures.
Psychotic disorders
A considerable number of participants met the criteria of the Munich‐Composite International Diagnostic Interview (M‐CIDI) psychosis screen (2.6%). This count includes about equal proportions of persons with mood‐congruent or mood‐incongruent psychotic features occurring exclusively in the course of depressive or bipolar disorders, and persons reporting psychotic symptoms of varying duration occurring at other times. M‐CIDI syndrome information for psychotic disorders does not readily provide differential diagnoses of psychotic disorders, but ongoing analyses putting together information also from the somatic disorders parts of the survey and the additional instruments on hallucinatory (Launay Slade Hallucination Scale; Launay et al., 1981) and delusional (Peters Delusion Inventory; Peters, 2004) experiences will allow a further evaluation of these initial findings. An important question here will be to evaluate the course of symptoms over time and their association with other mental disorders, somatic disorders, substance use disorders, cognitive and socio‐economic factors.
Anxiety disorders
Although the overall rates for anxiety disorders in a stricter sense (thus excluding PTSD and obsessive‐compulsive disorder) are in the range of previous studies, it should be noted that we report, consistent with the new DSM‐5 criteria conventions, rates of agoraphobia without using the past diagnostic hierarchy rules that address the relation of agoraphobia and panic disorder. This does not affect rates for panic disorder, but results in higher rates for agoraphobia than those found, for example, for recent studies in the United States (National Comorbidity Survey Replication, NCS‐R; Kessler et al., 2005) and World Mental Health Survey (Kessler and Üstün, 2008). Further we confirm, consistent with previous German and EU studies, substantially lower rates of social anxiety disorder (social phobia) as compared with the United States (NCS and NCS‐R).
Post‐traumatic stress and obsessive‐compulsive disorders
DEGS1‐MH provides for the first time prevalence estimates for PTSD. The 12‐month prevalence of 2.3% corresponds well to other general population studies in the EU (reviewed in Wittchen et al., 2011). For obsessive‐compulsive disorders, our finding of a 3.8% was unexpected, given that the vast majority of previous epidemiological surveys (Weissman et al., 1994; Wittchen et al., 2011), including the previous GHS‐MHS, reported estimates in the range of 0.7 to 2%. Our current higher estimate seems to be related to a seemingly minor modification in the diagnostic algorithm of the assessment instrument, the CIDI. Unlike studies in the 1990s, the current algorithms require – consistent with the diagnostic criteria – impairment in social roles or distress. In older studies we always required impairment in social role as being mandatory. Further explorations and detailed analyses are needed to clarify this issue further.
Mood disorders
As suggested by various methodological studies (Knäuper and Wittchen, 1994; Andreas et al., 2013), the diagnostic interview in our study used a “sensitization section” upfront involving administration of the Patient Health Questionnaire (PHQ‐9, Kroenke et al., 2001) in order to increase the validity of depression assessment in the elderly. Even though we find – like most epidemiological studies (Volkert et al., 2013) – considerably lower rates of major depression in higher age as compared to younger ages.
Eating disorders
Compared to some other community studies (reviewed in Wittchen et al., 2011), the prevalence of bulimia nervosa appears low (especially when compared to anorexia nervosa). Besides the fact that comparative interpretations of prevalence with a low base rate (only N = 45 cases with eating disorders) have to be made with caution, this may be explained by the common inclusion of atypical anorexia and bulimia in other studies whereas in DGES1‐MH only cases with threshold diagnosis are reported.
Somatoform disorders
Prevalence of subthreshold somatization disorder as defined by the SSI4,6 (Escobar et al., 1989) with 0.8% as well as prevalence of pain disorder with 3.2% are remarkably low compared to the previous GHS‐MHS study. This result might be affected by changing conventions in the assessment instrument that have been implemented recently. This will be subject to further methodological explorations.
Substance use disorders
Unlike to the GHS‐MHS survey, DEGS1‐MH did not include a separate lengthy section of illicit drug use disorders because of reasons of feasibility and time, and because of the existence of separate surveys for this area (e.g. Kraus et al., 2010). The overall count for substance use disorder only includes alcohol and medication abuse and dependence. Thus, the overall prevalence of substance use disorder appears to be lower.
Limitations
Selection bias resulting from selective participation of healthier persons is a concern in any population‐based survey (Criqui et al., 1978). But, as Galea and Tracy (2007) point out, most studies have found little evidence for substantial bias as a result of non‐participation, and that extreme efforts to increase participation rates may introduce even more bias into the study if the added respondents are a special subgroup of all non‐respondents, or if they are less conscientious in the survey participation. Within DEGS1‐MH, comparisons of the sampled distribution of the participants with the true distribution in the population regarding a series of variables (like age, sex, education level) suggest that our findings in the mental health supplement reflect well the true distribution and could be regarded as representative for the German adult population in the age range 18–79 (Jacobi et al., 2013). The good conditional response rate of 88% for the DEGS1‐MH and the fact that the weighting procedures do not change the distribution substantially add further confirmation. An important potential limitation in DEGS1 might be the fact that certain high risk groups might not be appropriately covered, such as residents that are long‐term or permanently institutionalized, immigrants not speaking fluent German, and the homeless. A further standard limitation of studies of that sort is the fact that data were based on retrospective recall which can be a source of considerable bias in recording lifetime disorders resulting in conservative prevalence estimates, but this is less probable for 12‐month disorders (Moffitt et al., 2010).
Social correlates
National surveys of this sort are particularly informative when they provide information related to the question which groups of persons in the general population are particularly affected. At this point we have only examined some socio‐demographic factors that are significantly associated but did not make an attempt to further disentangle (e.g. differential contribution of education, job position, and income) or to combine these correlates (e.g. differential associations in younger women without partnership and from lower social class). Future analyses of the DEGS1 data should elaborate in greater detail which combinations are particularly critical.
The replication of a socio‐economic gradient in mental health and the finding that not living in a partnership and (in some diagnoses) urbanization are associated with the risk of having a mental disorder point to the importance of social determinants of health outcomes (Adler et al., 1994; van Oort et al., 2011). A major result of the present study is the confirmation of an association between urbanicity and the increased presence of psychotic disorders, which is in line with previous findings showing that growing up in an urban environment increases the odds for developing schizophrenia by a factor of two (reviewed by Vassos et al., 2012). Further analysis will address the question whether schizophrenia or other psychotic disorders are mainly involved in this association in Germany. Elevated rates were also found in mood disorders what is also in line with previous findings (Bijl et al., 1998) Interestingly, no differences seem to exist anymore in the prevalence of mental disorders between residents of the former Western and Eastern German states (around 20 years after reunification), while the previous GHS‐MHS had found a slightly higher prevalence in residents of former West German states at the end of the 1990s (Jacobi et al., 2004c). This topic will be subject to further more detailed analyses including adjustment for the still existing socio‐economic differences (e.g. unemployment rate in the year 2010: 11% versus 6%; Bundesagentur für Arbeit, 2013).
Findings on correlates of this kind (age, sex, SES, region of residence) may point to health inequity and groups that are particularly affected. However, risk factors of this sort are either not modifiable or not specific enough for developing intervention strategies (Kessler, 2000). Upcoming analyses will focus on the role of comorbidity as a potential risk factor for (further) mental disorders, impairment and reduced quality of life, because comorbidity may be a modifiable risk factor that can be more easily targeted than socio‐demographic correlates of mental morbidity.
The impact of mental disorders
Beyond reporting national prevalence and prevalence trends of mental disorders in one country, epidemiological data from representative large community studies can serve to explore the nature and impact of mental disorders in general. Mental disorders are associated with many health relevant outcomes such as impairments, health care utilization, general psychopathology, and risk‐factors for public health relevant somatic illness. During the past decade, increasingly stronger evidence has documented that mental disorders are not only much more frequent but also contribute to a greater burden of disease than previously thought. They should be considered as a top global health challenge of the twenty‐first century, especially in Western high income countries (Collins et al., 2011; Murray et al., 2013; Prince et al., 2007; Vos et al., 2013; Wittchen and Jacobi, 2005; Wittchen et al., 2011). Basic information from DEGS1‐MH on the burden associated with mental disorders is given by [Link], 2014 showing that current mental disorders (12‐month diagnosis) are strongly associated with days out of role due to mental and also due to physical health problems. Also, current mental disorders are associated with both poor mental and physical health related quality of life compared to persons with lifetime diagnosis but no 12‐month diagnosis or people who never met criteria for a diagnosis. Another important aspect is the high degree of comorbidity of mental disorders in our study. Current research suggests that several mental disorders may be sequentially linked or may determine progression from less severe to more severe illness manifestations of each other. Also, the analysis of the interrelationship and modeling of multiple mental and somatic comorbidities are necessary to gain a holistic picture for designing preventive or therapeutic strategies (reviewed by Cerdá et al., 2008; Borsboom et al., 2011; Cramer et al., 2010). Given the high prevalence of comorbidity in our study, population‐based research on the risk factors for comorbidity is necessary to elucidate the relevant risk factors and identify new potentials for prevention and treatment. Further analyses will therefore address the comorbidity between mental and somatic disorders and unspecific disabling symptoms as well as within mental disorders both cross‐sectionally and prospectively (comparison GNIES‐98/GHS‐MHS versus DEGS1/DEGS1‐MH, and longitudinal analyses in future waves of the DEGS1 cohort). This directs toward the crucial importance of mental disorders within a comprehensive bio‐psycho‐social health concept and will be a major subject of the future DEGS1 study program.
Declaration of interest statement
The authors have no competing interest.
Supporting information
Supporting info item
Acknowledgments
DEGS1 and DEGS1‐MH are projects by the Robert Koch Institute (Berlin, Germany; head of the Department of Epidemiology and Health Monitoring: Dr Bärbel‐Maria Kurth) funded primarily by the German Ministry of Health (BMG). Supplementary funding is provided by the Technische Universität Dresden, and by the Stiftung Seelische Gesundheit inaugurated by the German Association for Psychiatry and Psychotherapy (DGPPN) for implementation of the neurocognitive assessment and for extending the psychosis section (Prof. Dr Wolfgang Maier, Prof. Dr Wolfgang Gaebel). The authors would like to acknowledge the support of all Robert Koch Institute staff in the fieldwork of the project, in particular Dr Heike Hölling, and the responsible Robert Koch Institute project officer for DEGS1‐MH, Michael Lange. The authors also thank the many staff members and interviewers of DEGS1‐MH at Technische Universität Dresden, in particular Lisa Beyer, Ariane Bürkner, Marlen Gehrke, Gerry Gwozdz, Esther Lochmann, Doreen Opitz, Stephanie Preiß, Kristina Schäfer, Kathrin Spitzer, Yuliya Stankevich and Anke Vogel for their exceptional contributions during the field phase of DEGS1‐MH. Above all, the authors wish to thank all the DEGS1‐MH study participants.
Jacobi F., Höfler M., Siegert J., Mack S., Gerschler A., Scholl L., Busch M. A., Hapke U., Maske U., Seiffert I., Gaebel W., Maier W., Wagner M., Zielasek J. and Wittchen H.‐U. (2014), Twelve‐month prevalence, comorbidity and correlates of mental disorders in Germany: the Mental Health Module of the German Health Interview and Examination Survey for Adults (DEGS1‐MH), International Journal of Methods in Psychiatric Research, 23, pages 304–319, doi: 10.1002/mpr.1439
References
- Adler N.E., Boyce T., Chesney M.A., Cohen S., Folkman S., Kahn R.L., Syme S.L. (1994) Socioeconomic status and health: the challenge of the gradient. American Psychologist, 49(1), 15–24. [DOI] [PubMed] [Google Scholar]
- Andreas S., Härter M., Volkert J., Hausberg M., Sehner S., Wegscheider K., Rabung S., Ausin B., Canuto A., Da Ronch C., Grassi L., Hershkovitz Y., Lelliott P., Munoz M., Quirk A., Rotenstein O., Santos‐Olmo A. B., Shalev A. Y., Siegert J., Weber K., Wittchen H.‐U., Koch U., Schulz H. (2013) The MentDis_ICF65+ study protocol: prevalence, 1‐year incidence and symptom severity of mental disorders in the elderly and their relationship to impairment, functioning (ICF) and service utilisation. BMC Psychiatry, 13(62) DOI: 10.1186/1471-244X-13-62. [DOI] [PMC free article] [PubMed] [Google Scholar]
- Bellach B.M., Knopf H., Thefeld W. (1998) The German Health Survey 1997/98 (in German). Gesundheitswesen, 60(2), 59–68. [PubMed] [Google Scholar]
- Bijl R.V., van Zessen G., Ravelli A. (1998) Prevalence of psychiatric disorder in the general population: results of the Netherlands Mental Health Survey and Incidence Study (NEMESIS). Social Psychiatry and Psychiatric Epidemiology, 33(12), 587–595. [DOI] [PubMed] [Google Scholar]
- Borsboom D., Cramer A.O., Schmittmann V.D., Epskamp S., Waldorp L.J. (2011) The small world of psychopathology. PLoS One, 6(11), e27407. [DOI] [PMC free article] [PubMed] [Google Scholar]
- Bundesagentur für Arbeit (2013) Statistik nach Regionen. http://statistik.arbeitsagentur.de/Navigation/Statistik/Statistik-nach-Regionen/Politische-Gebietsstruktur-Nav.html?year_month=201305
- Cerdá M., Sagdeo A., Galea S. (2008) Comorbid forms of psychopathology: key patterns and future research directions. Epidemiology Review, 30, 155–177. [DOI] [PubMed] [Google Scholar]
- Collins P.Y., Patel V., Joestl S.S., March D., Insel T.R., Daar A.S. (2011) Grand challenges in global mental health. Nature, 475(7354), 27–30. [DOI] [PMC free article] [PubMed] [Google Scholar]
- Cramer A.O., Waldorp L.J., van der Maas H.L., Borsboom D. (2010) Comorbidity: a network perspective. Behavioral and Brain Science, 33(2–3), 137–150; discussion 150–93. [DOI] [PubMed] [Google Scholar]
- Criqui M., Barrett‐Connor E., Austin M. (1978) Differences between respondents and nonrespondents in a population‐based cardiovascular disease study. American Journal of Epidemiology, 108, 367–372. [DOI] [PubMed] [Google Scholar]
- de Graaf R., Ten Have M., Van D. S. (2010) The Netherlands Mental Health Survey and Incidence Study‐2 (NEMESIS): design and methods. International Journal of Methods in Psychiatric Research, 19(3), 125–141. DOI: 10.1002/mpr.317 [DOI] [PMC free article] [PubMed] [Google Scholar]
- de Graaf R., Ten Have M., van Gool C., van Dorsselaer S. (2012) Prevalence of mental disorders and trends from 1996 to 2009. Results from the Netherlands Mental Health Survey and Incidence Study‐2. Social Psychiatry and Psychiatric Epidemiology, 47(2), 203–213. [DOI] [PubMed] [Google Scholar]
- Escobar J.I., Rubio Stipec M., Canino G., Karno M. (1989) Somatic Symptom Index (SSI): A new and abridged somatisation construct: prevalence and epidemiological correlates in two large community samples. Journal of Nervous and Mental Disease, 177, 140–146. [DOI] [PubMed] [Google Scholar]
- ESEMeD/MHEDEA 2000 Investigators (2004) Prevalence of mental disorders in Europe: results from the European Study of the Epidemiology of Mental Disorders (ESEMeD) project. Acta Psychiatrica Scandinavica, 109, 21–27. [DOI] [PubMed] [Google Scholar]
- European Commission (2005) Green Paper. Improving the mental health of the population: towards a strategy on mental health for the European Union. http://ec.europa.eu/health/ph_determinants/life_style/mental/green_paper/mental_gp_en.pdf [1 March 2013].
- Galea S., Tracy M. (2007) Participation rates in epidemiologic studies. Annals of Epidemiology, 17, 643–653. [DOI] [PubMed] [Google Scholar]
- Goodwin R., Jacobi F., Thefeld W. (2003) Mental disorders and asthma in the community. Archives of General Psychiatry, 60, 1125–1130. [DOI] [PubMed] [Google Scholar]
- Goodwin R.D., Galea S., Perzanowski M., Jacobi F. (2012) Impact of allergy treatment on the association between allergies and mood and anxiety in a population sample. Clinical and Experimental Allergy, 42, 1765–1771. [DOI] [PMC free article] [PubMed] [Google Scholar]
- Gustavsson A., Svensson M., Jacobi F., Allgulander C., Alonso J., Beghi E., Dodel R., Ekman M., Faravelli C., Fratiglioni L., Gannon B., Jones D.H., Jennum P., Jordanova A., Jönsson L., Karampampa K., Knapp M., Kobelt G., Kurth T., Lieb R., Linde M., Ljungcrantz C., Maercker A., Melin B., Moscarelli M., Musayev A., Norwood F., Preisig M., Pugliatti M., Rehm J., Salvador‐Carulla L., Schlehofer B., Simon R., Steinhausen H.C., Stovner L.J., Vallat J.M., Van den Bergh P., van Os J., Vos P., Xu W., Wittchen H.‐U., Jönsson B., Olesen J. (2011) Cost of disorders of the brain in Europe 2010. European Neuropsychopharmacology, 21, 718–779. [DOI] [PubMed] [Google Scholar]
- Haro J.M., Arbabzadeh‐Bouchez S., Brugha T.S., De Girolamo G., Guyer M.E., Jin R., Lepine J.P., Mazzi F., Reneses B., Vilagut G., Sampson N.A., Kessler R.C. (2006) Concordance of the Composite International Diagnostic Interview Version 3.0 (CIDI 3.0) with standardized clinical assessments in the WHO World Mental Health Surveys. International Journal of Methods in Psychiatric Research, 15, 167–180. [DOI] [PMC free article] [PubMed] [Google Scholar]
- Härter M., Baumeister H., Reuter K., Jacobi F., Höfler M., Bengel J., Wittchen H.‐U. (2007) Increased 12‐month prevalence rates of mental disorders in patients with chronic somatic diseases. Psychotherapy & Psychosomatics, 76, 354–360. [DOI] [PubMed] [Google Scholar]
- Jacobi F., Mack S., Gerschler A., Scholl L., Höfler M., Siegert J., Bürkner A., Preiss S., Spitzer K., Busch M., Hapke U., Gaebel W., Maier W., Wagner M., Zielasek J., Wittchen H.–U. (2013) The design and methods of the mental health module in the German Health Interview and Examination Survey for Adults (DEGS1‐MH). International Journal of Methods in Psychiatric Research, 22(2), 83–99. [DOI] [PMC free article] [PubMed] [Google Scholar]
- Jacobi F., Hoyer J., Wittchen H.‐U. (2004a) Seelische Gesundheit in Ost und West: Analysen auf der Grundlage des Bundesgesundheitssurveys. Zeitschrift für Klinische Psychologie, 33(4), 251–260. [Google Scholar]
- Jacobi F., Klose K., Wittchen H.‐U. (2004b) Psychische Störungen in der deutschen Allgemeinbevölkerung: Inanspruchnahme von Gesundheitsleistungen und Ausfalltage. Bundesgesundheitsblatt, 47, 736–744. [DOI] [PubMed] [Google Scholar]
- Jacobi F., Wittchen H.‐U., Hölting C., Höfler M., Pfister H., Müller N., Lieb R. (2004c) Prevalence, co‐morbidity and correlates of mental disorders in the general population: results from the German Health Interview and Examination Survey (GHS). Psychological Medicine, 34, 1–15. DOI: 10.1017/S0033291703001399 [DOI] [PubMed] [Google Scholar]
- Jacobi F., Wittchen H.‐U., Müller N., Hölting C., Sommer S., Lieb R., Höfler M., Pfister H. (2002) Estimating the prevalence of mental and somatic disorders in the community: aims and methods of the German National Health Interview and Examination Survey. International Journal of Methods in Psychiatric Research, 11(1), 1–19. [DOI] [PMC free article] [PubMed] [Google Scholar]
- Kamtsiuris P., Lange M., Hoffmann R., Schaffrath Rosario A., Dahm S., Kurth B.‐M. (2013) The first wave of the German Health Interview and Examination Survey for Adults (DEGS1): sampling, design, response, weighting, and representativeness. Bundesgesundheitsbl, 56(5/6), 620–630. [DOI] [PubMed] [Google Scholar]
- Kessler R.C. (2000) Psychiatric epidemiology: selected recent advances and future directions. Bulletin of the World Health Organization, 78(4), 464–474. [PMC free article] [PubMed] [Google Scholar]
- Kessler R.C., Adler L., Barkley R., Biederman J., Conners C.K., Demler O., Faraone S.V., Greenhill L.L., Howes M.J., Secnik K., Spencer T., Ustun T.B., Walters E.E., Zaslavsky A.M. (2006) The prevalence and correlates of adult ADHD in the United States: results from the National Comorbidity Survey Replication. American Journal of Psychiatry, 163(4), 716–723. [DOI] [PMC free article] [PubMed] [Google Scholar]
- Kessler R.C., Chiu W.T., Demler O., Walters E.E. (2005) Prevalence, severity, and comorbidity of 12‐month DSM‐IV disorders in the National Comorbidity Survey Replication. Archives of General Psychiatry, 62, 617–627. [DOI] [PMC free article] [PubMed] [Google Scholar]
- Kessler R., Petukhova M., Sampson N., Zaslavsky A., Wittchen H.‐U. (2012) Prevalence and morbid risk of anxiety and mood disorders in the US. International Journal of Methods in Psychiatric Research, 21(3), 169–184. [DOI] [PMC free article] [PubMed] [Google Scholar]
- Kessler R.C., Üstün T.B. (2004) The World Mental Health (WMH) Survey Initiative Version of the World Health Organization (WHO) Composite International Diagnostic Interview (CIDI). International Journal of Methods in Psychiatric Research, 13, 93–121. [DOI] [PMC free article] [PubMed] [Google Scholar]
- Kessler R.C., Üstün T.B. (2008) The World Health Organization Composite International Diagnostic Interview In Kessler R.C., Üstün T.B. (eds) The WHO World Mental Health Surveys: Global Perspectives on the Epidemiology of Mental Disorders, pp. 58–90, Cambridge, Cambridge University Press. [Google Scholar]
- Knäuper B., Wittchen H.U. (1994) Diagnosing major depression in the elderly: evidence for response bias in standardized diagnostic interviews? Journal of Psychiatric Research, 28(2), 147–164. [DOI] [PubMed] [Google Scholar]
- Kraus L., Pabst A., Piontek D., Müller S. (2010) Trends des Substanzkonsums und substanzbezogener Störungen. Ergebnisse des Epidemiologischen Suchtsurveys 1995–2009. Sucht, 56(5), 337–348. [Google Scholar]
- Kroenke K., Spitzer R.L., Williams J. (2001) Validity of a Brief Depression Severity Measure. Journal of General Internal Medicine, 16(9), 606–613. [DOI] [PMC free article] [PubMed] [Google Scholar]
- Kurth B.M. (2012) First results of the German Health and Examination Interview for Adults (DEGS). Bundesgesundheitsblatt, 55(8), 980–990. [Google Scholar]
- Lachner G., Wittchen H.‐U., Perkonigg A., Holly A., Schuster P., Wunderlich U., Türk D., Garczynski E., Pfister H (1998) Structure, content and reliability of the Munich‐Composite International Diagnostic Interview (M‐CIDI). Substance use sections. European Addiction Research, 4, 28–41. [DOI] [PubMed] [Google Scholar]
- Lampert T., Kroll L., Müters S., Stolzenberg H. (2013) Measurement of the socioeconomic status in the German Health and Examination Interview for Adults (DEGS1). Bundesgesundheitsbl, 56(5/6), 631–636. [DOI] [PubMed] [Google Scholar]
- Launay G., Slade P. (1981) The measurement of hallucinatory predisposition in male and female prisoners. Personality and Individual Differences, 2(3), 221–234. [Google Scholar]
- Mack S., Gerschler A., Jacobi F., Siegert J., et al (in preparation) Disability and quality of life impact of mental disorders: results from the German Health Interview and Examination Survey, Module Mental Health (DEGS1‐MH).
- Mack S., Jacobi F., Gerschler A., Strehle J., Höfler M., Busch M.A., Maske U., Hapke U., Seiffert I., Gaebel W., Zielasek J., Maier W., Wittchen H.–U. (2014) Mental health service use among people with mental disorders in Germany. Epidemiological data from the German Health Interview and Examination Survey for Adults, Module Mental Health (DEGS1‐MH). International Journal of Methods in Psychiatric Research, DOI: 10.1002/mpr.1439 [DOI] [PMC free article] [PubMed] [Google Scholar]
- Moffitt T.E., Caspi A., Taylor A., Kokaue J., Milne B.J., Polanczyk G., Poulton R. (2010) How common are common mental disorders? Evidence that lifetime prevalence rates are doubled by prospective versus retrospective ascertainment. Psychological Medicine, 40, 899–909. [DOI] [PMC free article] [PubMed] [Google Scholar]
- Murray C.J., Vos T., Lozano R., et al (2013) Disability‐adjusted life years (DALYs) for 291 diseases and injuries in 21 regions, 1990–2010: a systematic analysis for the Global Burden of Disease Study 2010. Lancet, 380, 2197–2223. [DOI] [PubMed] [Google Scholar]
- Peters E. (2004) Measuring delusional ideation: the 21‐item Peters et al. Delusions inventory. Schizophrenia Bulletin, 30(4), 1005–1022. [DOI] [PubMed] [Google Scholar]
- Prince M., Patel V., Saxena S., Maj M., Maselko J., Phillips M.R., Rahmann A. (2007) Global mental health 1 – No health without mental health. Lancet, 370(9590), 859–877. [DOI] [PubMed] [Google Scholar]
- Ratcliffe G.E., Enns M.W., Jacobi F., Belik S.‐L., Sareen J. (2009) The relationship between migraine and mental disorders in a population‐based sample. General Hospital Psychiatry, 31(1), 14–19. [DOI] [PubMed] [Google Scholar]
- Reed V., Gander F., Pfister H., Steiger A., Sonntag H., Trenkwalder C., Hundt W., Wittchen H.‐U. (1998) To what degree the Composite International Diagnostic Interview (CIDI) correctly identifies DSM‐IV disorders? Testing validity issues in a clinical sample. International Journal of Methods in Psychiatric Research, 7, 142–155. [Google Scholar]
- Robert‐Koch‐Institut (ed.) (2002) The German National Health Interview and Examination Survey 1998 – the basis for health surveillance in German [German version only]. Beiträge zur Gesundheitsberichterstattung des Bundes. http://www.rki.de/EN/Content/Health_Monitoring/Health_Reporting/GBEDownloadsB/baustein_der_gesundheitssurveillance.html [31 January 2013].
- Royall R.M. (1986) Model robust confidence intervals using maximum likelihood estimators. International Statistical Review, 54, 221–226. [Google Scholar]
- Sareen J., Jacobi F., Cox B., Belik S.‐L., Clara I., Stein M.B. (2006) Disability and poor quality of life associated with comorbid anxiety disorders and physical conditions. Archives of Internal Medicine, 166, 2109–2116. [DOI] [PubMed] [Google Scholar]
- Scheidt‐Nave C., Kamtiuris P., Göβwald A., Hölling H., Lange M., Busch M.A., Dahm S., Dölle R., Ellert U., Fuchs J., Hapke U., Heidemann C., Knopf H., Laussmann D., Mensink G.B.M., Neuhauser H., Richter A., Sass A.‐C., Rosario A.S., Stolzenberg H., Thamm M., Kurth B.‐M. (2012) German health interview and examination survey for adults (DEGS) – design, objectives and implementation of the first data collection wave. BMC Public Health, 12, 730 DOI: 10.1186/1471-2458-12-730 [DOI] [PMC free article] [PubMed] [Google Scholar]
- Slade T., Johnston A., Oakley Browne M.A., Andrews G., Whiteford H. (2009) 2007 National Survey of Mental Health and Wellbeing: methods and findings. Australian and New Zealand Journal of Psychiatry, 43, 594–605. [DOI] [PubMed] [Google Scholar]
- StataCorp . (2012) Stata Statistical Software: Release 12.1, College Station, TX, StataCorp LP.
- Van Oort F.V.A., van der Ende J., Wadsworth M.E., Verhulst F.C, Achenbach T.M. (2011) Cross‐national comparison of the link between socioeconomic status and emotional and behavioral problems in youths. Social Psychiatry and Psychiatric Epidemiology, 46, 167–172. [DOI] [PMC free article] [PubMed] [Google Scholar]
- Vassos E., Pedersen C.B., Murray R.M., Collier D.A., Lewis C.M. (2012) Meta‐analysis of the association of urbanicity with schizophrenia. Schizophrenia Bulletin, 38(6), 1118–1123. [DOI] [PMC free article] [PubMed] [Google Scholar]
- Volkert J., Schulz H., Härter M., Wlodarczyk O., Andreas S. (2013) The prevalence of mental disorders in older people in Western countries: a meta‐analysis. Aging Research Reviews, 12, 339–353. [DOI] [PubMed] [Google Scholar]
- Vos T., Flaxman A.D., Naghavi M., et al (2013) Years lived with disability (YLDs) for 1160 sequelae of 289 diseases and injuries 1990–2010: a systematic analysis for the Global Burden of Disease Study 2010. Lancet, 380, 2163–2196. [DOI] [PMC free article] [PubMed] [Google Scholar]
- Weissman M.M., Bland R.C., Canino G.J., Greenwald S., Hwu H., Lee C.K., Newman S.C., Oakley‐Browne M.A., Rubio‐Stipec M., Wickramaratne P.J., Wittchen H.U., Yeh E.K. (1994) The Cross National Epidemiology of obsessive‐compulsive disorder. Journal of Clinical Psychiatry, 55(3), 5–10. [PubMed] [Google Scholar]
- Wittchen H.‐U. (1994) Reliability and validity studies of the WHO Composite International Diagnostic Interview (CIDI): a critical review. Journal of Psychiatric Research 28, 57–84. [DOI] [PubMed] [Google Scholar]
- Wittchen H.‐U. (2004) Continued needs for epidemiological studies of mental disorders in the community. Psychotherapy and Psychosomatics, 73, 197–206. [DOI] [PubMed] [Google Scholar]
- Wittchen H.‐U., Höfler M., Gander F., Pfister H., Storz S., Üstün T.B., Müller N., Kessler R.C. (1999) Screening for mental disorders: performance of the Composite International Diagnostic‐Screener (CID‐S). International Journal of Methods in Psychiatric Research, 8, 59–70. [Google Scholar]
- Wittchen H.‐U., Jacobi F. (2001) Die Versorgungssituation psychischer Störungen in Deutschland – Eine klinisch‐epidemiologische Abschätzung anhand des Bundesgesundheits surveys '98. Bundesgesundheitsblatt, 44, 993–1000. [Google Scholar]
- Wittchen H.‐U., Jacobi F. (2005) Size and burden of mental disorders in Europe – a critical review and appraisal of 27 studies. European Neuropsychopharmacology, 15(4), 357–376. [DOI] [PubMed] [Google Scholar]
- Wittchen H.‐U., Jacobi F., Rehm J., Gustavsson A., Svensson M., Jönsson B., Olesen J., Allgulander C., Alonso J., Faravelli C., Fratiglioni L., Jennum P., Lieb R., Maercker A., van Os J., Preisig M., Salvador‐Carulla L., Simon R., Steinhausen H.‐C. (2011) The size and burden of mental disorders and other disorders of the brain in Europe 2010. European Neuropsychopharmacology, 21, 655–679. [DOI] [PubMed] [Google Scholar]
- Wittchen H.‐U., Pfister H. (1997) DIA‐X‐Interviews: Manual für Screening‐Verfahren und Interview; Interviewheft Längsschnittuntersuchung (DIA‐X‐Lifetime); Ergänzungsheft (DIA‐X‐Lifetime);Interviewheft Querschnittuntersuchung (DIA‐X‐12 Monate); Ergänzungsheft (DIA‐X‐12Monate); PC‐Programm zur Durchführung des Interviews (Längs‐ und Querschnittuntersuchung); Auswertungsprogramm, Frankfurt, Swets & Zeitlinger. [Google Scholar]
- Wittchen H.‐U., Robins L.N., Cottler L., Sartorius N., Burke J., Regier D. (1991) Cross‐cultural feasibility, reliability and sources of variance of the Composite International Diagnostic Interview (CIDI) – results of the multicenter WHO/ADAMHA Field Trials (wave I). The British Journal of Psychiatry, 159, 645–653. [DOI] [PubMed] [Google Scholar]
Associated Data
This section collects any data citations, data availability statements, or supplementary materials included in this article.
Supplementary Materials
Supporting info item