Abstract
Childhood brain tumors have suspected prenatal origins. To identify vulnerable developmental states, we generated a single-cell transcriptome atlas of >65,000 cells from embryonal pons and forebrain, two major tumor locations. We derived signatures for 191 distinct cell populations and defined regional cellular diversity and differentiation dynamics. Projection of bulk tumor transcriptomes onto this dataset shows that WNT medulloblastomas match the rhombic lip-derived mossy fiber neuronal lineage, embryonal tumors with multilayered rosettes fully recapitulate a neuronal lineage, while Group 2a/b atypical teratoid/rhabdoid tumors may originate outside of the neuroectoderm. Importantly, single-cell tumor profiles reveal highly defined cell hierarchies mirroring transcriptional programs of the corresponding normal lineages. Our findings identify impaired differentiation of specific neural progenitors as a common mechanism underlying these pediatric cancers and provide a rational framework for future modeling and therapeutic interventions.
Brain tumors are the leading cause of cancer-related morbidity and mortality in children. Despite intensive multi-modal therapies, cure remains a rare exception for several subtypes, while for most, the long-lasting effects of life-saving therapies on the developing brain are devastating1. Childhood brain tumors and their driver mutations show a specific spatio-temporal distribution and are presumed to be tightly linked with development2–7. Embryonal tumors with multilayered rosettes (ETMRs), a lethal brain tumor of younger children8, are mostly supra-tentorial and largely driven by a fusion of the brain-specific TTYH1 promoter with the primate-specific C19MC microRNA cluster9, linked to the expression of a fetal neurodevelopmental program9. WNT-subtype medulloblastomas mostly occur in children between 7–10 years of age10,11 and, despite being considered cerebellar tumors, they are located in the midline, adherent to the posterior part of the brainstem from which they are thought to derive12. Pediatric high-grade gliomas (pHGG) also show a specific age and mutation distribution13,14. Midline gliomas are largely characterized by lysine-to-methionine substitution at position 27 in histone 3 (H3) variants (H3K27M)6,14,15 and localize in the pons of younger children (3–7 years) and upward in the thalamus in older children (7–12 years). HGGs occurring in patients 12–35 years of age are mostly located in the cerebral hemispheres (parietal lobes), and a portion uniquely harbor the driver initiating events glycine to arginine or valine mutations at position 34 in H3F3A (H3.3G34R/V)13–19. In contrast, atypical teratoid/rhabdoid tumors (ATRTs) are a rare exception regarding spatio-temporal patterns. These deadly embryonal brain tumors are characterized by homozygous loss-of-function alterations of SMARCB120, a key component of the SWI/SNF chromatin remodelling complex4,21. Molecularly indistinguishable rhabdoid tumors can arise in the brain and spine, but also in soft tissues including muscle and kidney4,21,22, leading us to hypothesize that they may originate from a non-neural restricted precursor.
Current evidence thus supports a common etiological model for these tumors, where genetic alterations in vulnerable cell types disrupt developmental gene expression programs, ultimately leading to oncogenesis. However, data to identify these vulnerable cell types are scarce. The fetal cerebral cortex has been investigated at limited time points or coverage in humans23–26 and mice27–29, whereas the prenatal pons has never been comprehensively profiled. Here, we report single-cell transcriptomic data for the developing mouse pons and forebrain (E12.5-P6) and for the prenatal human brainstem (17–19 post-conception weeks), and molecularly define the cell types and their differentiation dynamics in these regions. Using this reference dataset, we mapped bulk transcriptomes for 240 human samples and single-cell transcriptomes from human WNT medulloblastomas, ETMRs, and ATRTs to identify the neurodevelopmental programs disrupted in these tumors. Our findings reveal the exquisite developmental dependencies and origins of these tumors, providing a cornerstone for orienting accurate modeling and future therapies.
Results
A census of the developing pons and forebrain
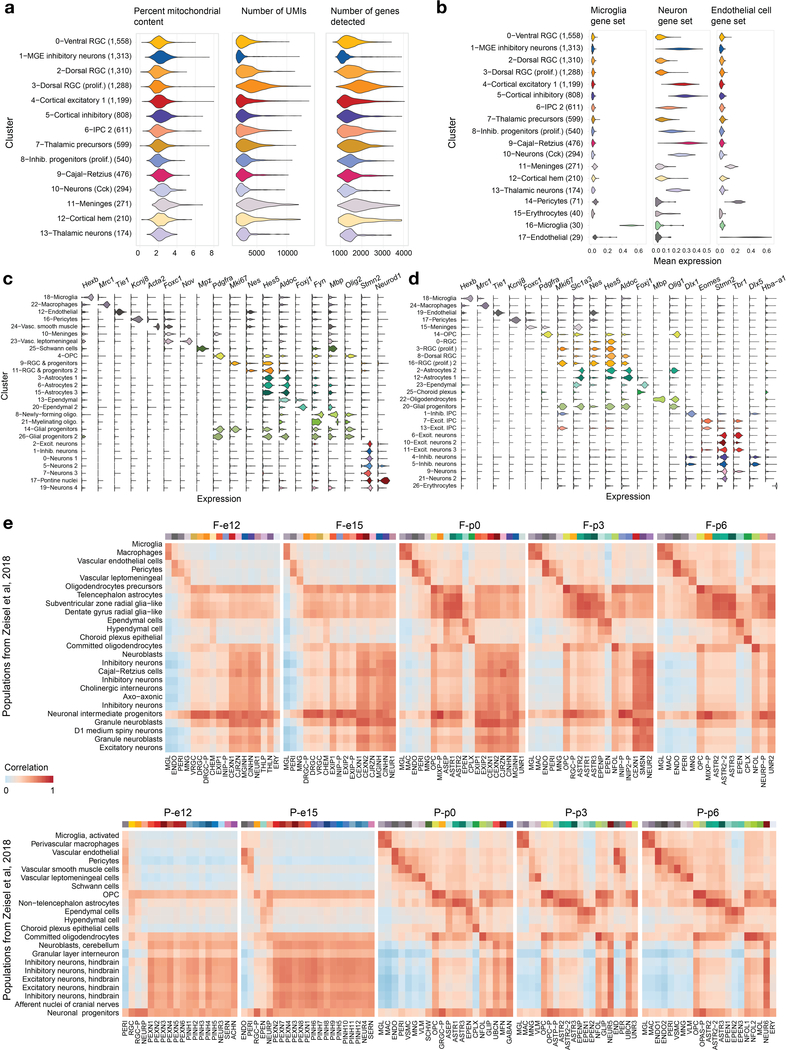
To define the normal developmental state of brain regions where a large proportion of high-grade embryonal and pediatric brain tumors arise, we isolated the brainstem of two human specimens aged 17–19 post-conception weeks (PCW), as well as the pons/hindbrain and the forebrain from mice at five time points (E12.5-P6, Extended Data Fig. 1). In total, we profiled >65,000 cells (61,595 mouse, 3,945 cryopreserved human cells). The extent of the mouse data permitted a three-tiered analysis: per sample, per brain structure, or a combined full dataset, to achieve different degrees of granularity and complementary analysis of transcriptional dynamics. We first defined cell populations using a shared nearest neighbor clustering algorithm30,31. We verified that common sources of variation in single-cell data (mitochondrial gene content, library size and cell cycle) did not drive this clustering (Extended Data Fig. 2a and Supplementary Note), and then defined the identity of the cell populations using a combination of computational and manual methods. These included mapping previously reported gene sets specific to the main neural cell classes32 (Supplementary Table 1a and Extended Data Fig. 2b) and individual canonical markers (Supplementary Table 1b and Extended Data Fig. 2c,d). We identified cluster-specific marker genes (Supplementary Table 2), which in many cases unambiguously defined known cell types. We then evaluated the effect of cryopreservation on cell populations and found that neuronal types were extremely sensitive to the procedure, while glial cells were mainly unaffected (Supplementary Note). Therefore, neurons and small clusters from the human brainstem were removed from analyses. Finally, to validate our cell-type identification strategies, we assessed the agreement of our cluster labels with a comprehensive atlas of the juvenile mouse nervous system33 (Extended Data Fig. 2e). Altogether, our transcriptomic atlas contains 191 cell populations defined at the sample level and 54 populations defined at the brain region level (Supplementary Table 2).
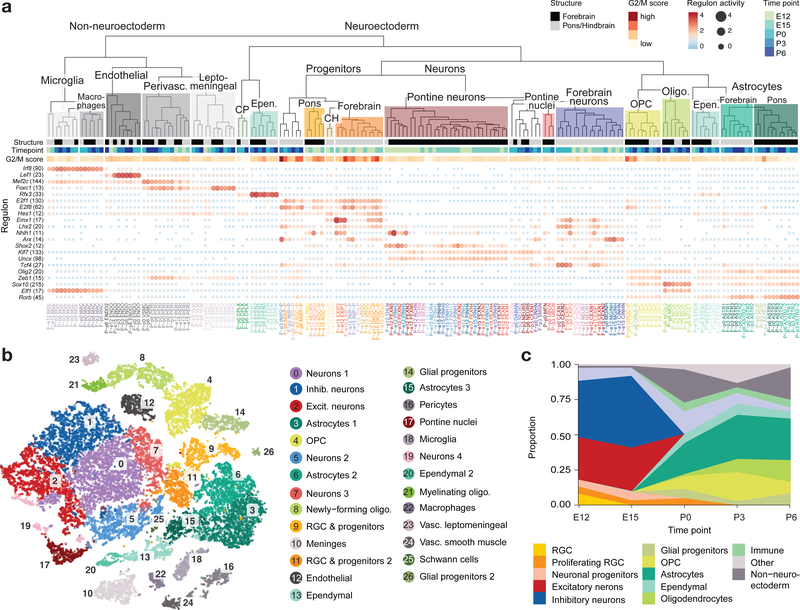
To understand the relationships between cell populations, we constructed a dendrogram of mouse cell types based on gene expression distance (Fig. 1a). Cells split first by developmental compartment of origin (neuroectoderm or mesoderm/others), and next by broad cell class, resulting in a molecularly defined cell taxonomy. Overall, we observed striking differences between the pons and forebrain for progenitors, astrocytes, and neurons in general. In contrast, other glial and mesodermal cell types showed more convergent transcriptional states between the two structures. Pontine progenitors and neurons were clearly distinct, segregating into separate subtrees. They also displayed low correlations with previously reported neuronal types and a dual match with neuroblasts and progenitor populations (Extended Data Fig. 2e), indicating an extensive cell diversity unique to the pons. Reconstruction of gene regulatory networks34 allowed us to identify transcription factors and their direct gene targets (regulons) underlying this molecular taxonomy (Fig. 1a and Supplementary Table 3).
Figure 1 |. Single-cell profiling of the developing mouse pons and forebrain.
a, Molecular taxonomy of all cell populations identified at the individual sample level, constructed based on pairwise correlations of gene expression (Spearman). Brain structure, time point, and G2/M score are indicated for each cluster. Select transcription factors with inferred active regulatory modules (regulons) are shown. The activity of each regulon, z-scored across clusters, is indicated by size and color of the bubbles, and the number of target genes in each regulon is indicated in parentheses. CP, choroid plexus; CH, cortical hem; IPC, intermediate progenitor cells; OPC, oligodendrocyte precursor cells; RGC, radial glial cells. b, Labeled tSNE embedding of the mouse pons (n = 27,954 cells; see Supplementary Table 2c). c, Proportion of cells from each major cell class in the pons over the time course.
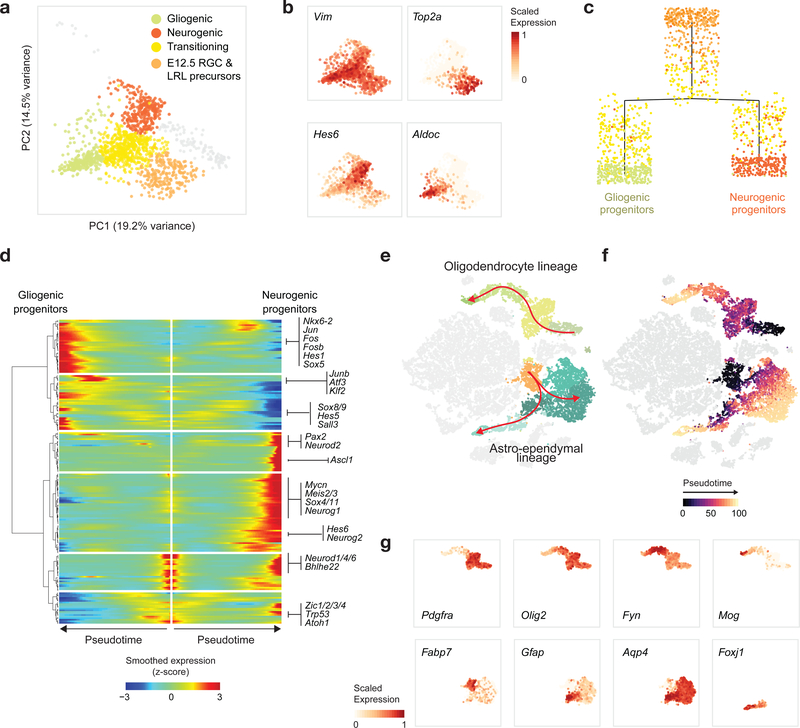
Temporally, we captured rich cellular dynamics reflecting differentiation. Early embryonic time points in both structures contained a substantial proportion of progenitors (Fig. 1b,c and Extended Data Fig. 1e,f), which were progressively depleted over time and, in the mouse, transitioned to gliogenesis by P0, when a glial expansion was evident. To identify the transcriptional networks induced in the pons during early differentiation, particularly during the switch from radial glial cells (RGCs) to gliogenic/neurogenic programs, we re-embedded the embryonic RGCs and progenitors. Principal component analysis (PCA) showed that the first two components, explaining 33% of the variance, were directly related to proliferation and a neurogenic/gliogenic differentiation path (Fig. 2a,b). We reconstructed this path using trajectory analysis35,36 (Fig. 2c), retrieving cells at various stages of lineage commitment. This allowed us to uncover the transcription factors associated with fate decision using branched expression analysis modeling (BEAM)36 and to characterize transitional states (Fig. 2d), identifying known but also novel markers of these states (Supplementary Table 3).
Figure 2 |. Patterning and differentiation dynamics during pontine neurogenesis and gliogenesis.
a, PCA of pontine progenitors from embryonic time points (n = 976 cells). Cells are colored by cluster assignment. RGC, radial glial cells; LRL, lower rhombic lip. b, Pontine progenitors colored by expression of selected canonical gene markers for progenitor-like (Vim), proliferating (Top2a), neurogenic (Hes6), or astrocytic (Aldoc) programs, in the PCA space as in a. c, Inferred differentiation trajectory36 of pontine progenitors. d, Expression of transcription factors associated with fate decisions along the pontine progenitor differentiation trajectory (Supplementary Table 3). e,f, tSNE plot of the mouse pons as in Figure 1b, with cells in oligodendrocyte (n = 3,800 cells) and astro-ependymal lineages (n = 6,276 cells) indicated (e), or colored by inferred pseudotime for those lineages (f). g, Expression of canonical genes marking oligodendrocyte (top), astrocytic (bottom, Fabp7, Gfap, Aqp4), or ependymal (bottom, Foxj1) differentiation, shown in cells from the respective lineages in tSNE embedding as in e and f.
Overall, the sampling of glial populations was quite extensive across species, developmental stages, and brain structures. We report gene signatures for 8 oligodendrocyte precursor cells (OPC), 8 oligodendrocyte, and 18 distinct astrocyte populations (Supplementary Table 2a). Most relevant to the biology of several tumors of focus, we detected transitional cell types along the full pontine oligodendrocyte path and the astro-ependymal lineage (Fig. 2e–g).
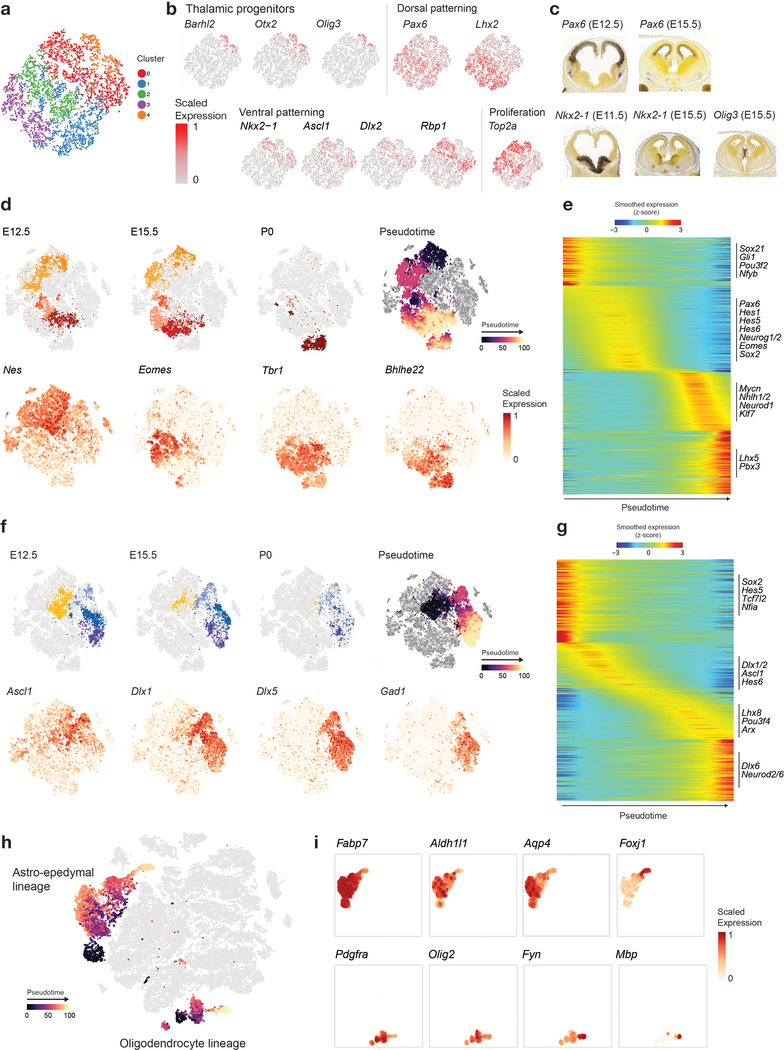
Neurogenesis was the dominant process in the forebrain. Isolation and re-embedding of the forebrain RGCs combined with a random forest approach identified discriminant gene markers and revealed dorsal-ventral patterning in these populations (Extended Data Fig. 3a–c). This defined the RGCs that give rise to cortical intermediate progenitor cells (IPC), the progenitors of the excitatory neurons (dorsal, Pax6+, Emx2+) and those that yield the migratory interneuron neuroblasts that eventually populate the cortex (ventrally-derived, Nkx2.1+, Olig2+). We also identified thalamic progenitors (Barhl2+, Otx2+, Olig3+), and small subpopulations from the cortical hem (Wnt8b+, Dkk3+), the organizing region in the medial forebrain neuroepithelium, which has not been profiled before. Altogether, this first transcriptomic survey of the developing pons, combined with a high-resolution profile of the forebrain, provides a molecular definition of 191 distinct cell populations (Supplementary Table 2), as well as a novel, extensive reference of cellular transitions occurring during differentiation of the main neural cell lineages (Supplementary Table 3).
Developmental signatures stratify tumor types
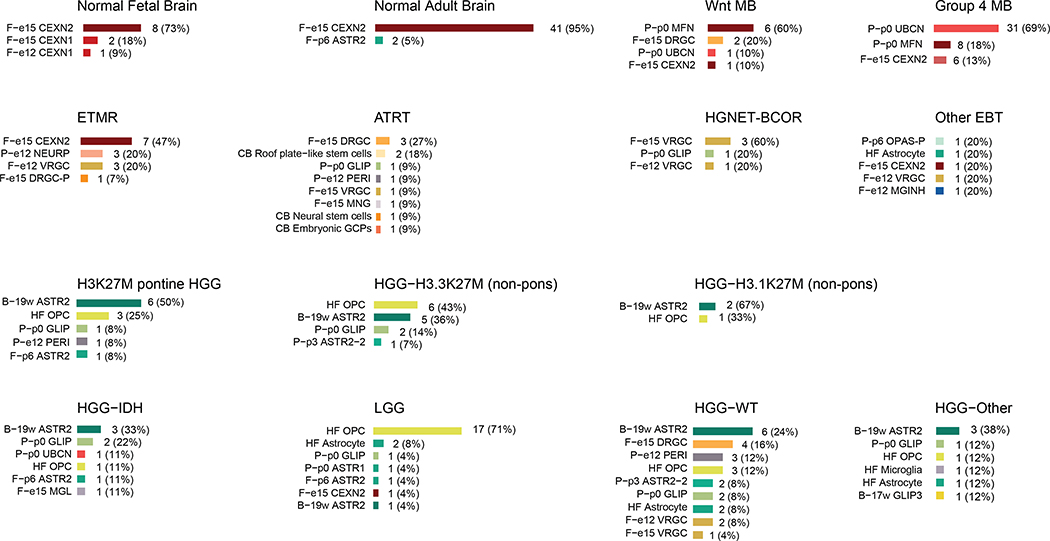
To identify developmental programs abnormally persistent in pediatric brain tumors, we first extracted gene signatures from each of the 191 cell populations (human and mouse) and projected them across 240 human bulk RNA-seq samples (186 patient-derived, 43 normal adult brain and 11 normal fetal brain samples, Supplementary Table 4) using single-sample Gene Set Enrichment Analysis37 (ssGSEA). In all cases, ssGSEA scores for human populations were extremely close to their mouse counterparts, indicating no major cross-species differences at this level of analysis. Dimensionality reduction based on this projection demonstrates that similarities to distinct developmental cell populations are sufficient to segregate tumors by type (Fig. 3a), indicating a specific developmental context at the core of each of these tumors. Notably, ETMRs clustered with early fetal brain (13–18 PCW) in all comparisons. We next asked which of the normal cell populations best matched a specific tumor type (Fig. 3b and Extended Data Fig. 4). Overall, each tumor type presented a distinct signature, indicating that ETMRs, WNT medulloblastomas, ATRTs and H3K27M HGGs have spatially and temporally distinct developmental origins.
Figure 3 |. Projection onto developmental lineages stratifies bulk patient samples.
a, tSNE visualization of bulk tumor and normal brain samples based on their ssGSEA projections to the developmental atlas segregates tumors by type. ssGSEA scores for the complete developmental dataset are used as features. Visualization is shown for normal fetal (n = 11) and adult (n = 43) brain, and tumor groups of focus. ETMR, embryonal tumor with multilayered rosettes (n = 14); HGG, high-grade glioma (n = 12); WNT MB, WNT-subtype medulloblastoma (n = 10); ATRT, atypical teratoid/rhabdoid tumors (n = 14). b, Best matching developmental populations for normal brain and tumor types of focus. Additional tumors are presented in Extended Data Figure 4. Only tumor samples (excluding cell lines and xenografts) are displayed. For select tumors, the cell type exhibiting the dominant match is indicated. Bar lengths represent number of samples within each tumor type.
WNT medulloblastomas match the rhombic lip-derived mossy fiber neuron lineage
Lower rhombic lip (LRL) progenitors in the embryonic dorsal brainstem (Zic1+, Pax6+, Olig3+) have been implicated as the potential cellular origin of WNT medulloblastoma12. However, the precise cell lineage has not yet been defined due to shared expression of markers between auditory LRL and pre-cerebellar LRL-derived lineages (including mossy fiber neurons and climbing fiber neurons).
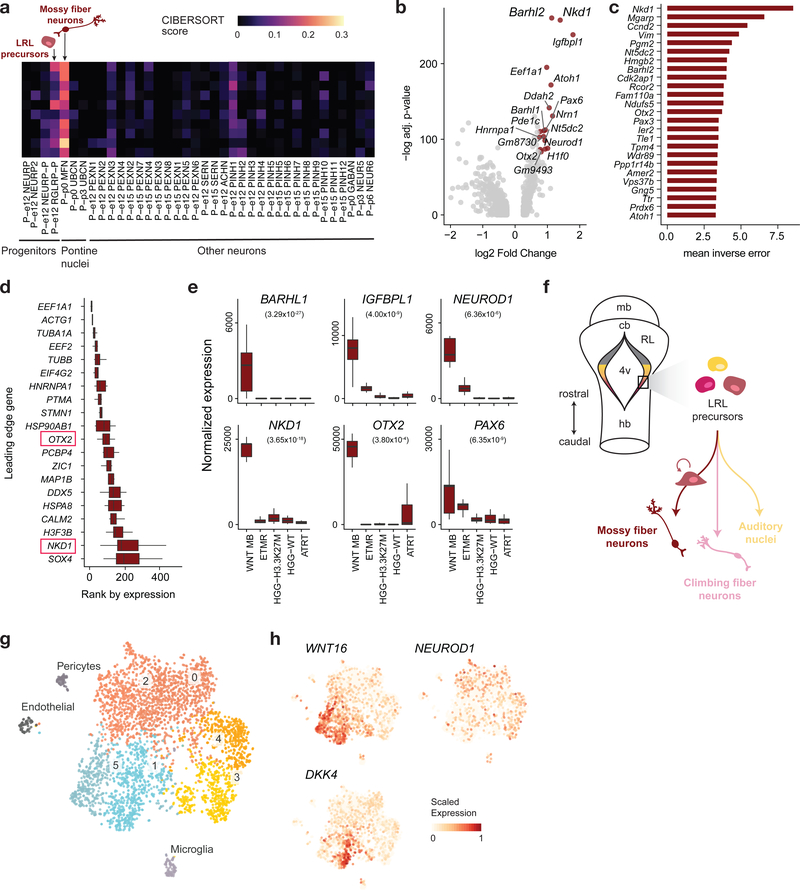
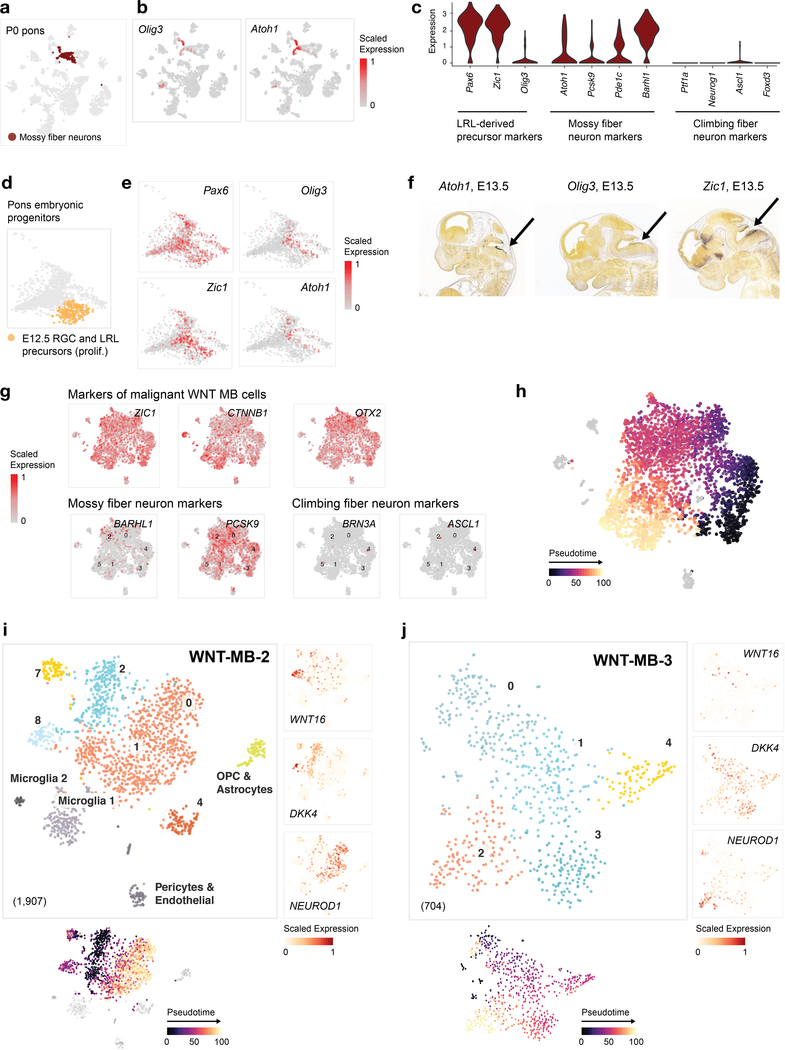
In our developmental atlas, co-expression of Zic1, Pax6, and Olig3 is restricted to a pontine mossy fiber neuron (MFN) population and to a subset of cells within the pontine LRL precursor cluster at E12.5 (see Extended Data Fig. 5 for a detailed characterization of these populations). Bulk transcriptomic mapping using ssGSEA (Fig. 3b), confirmed by deconvolution analysis (Fig. 4a), selected the MFN lineage as the best match for WNT medulloblastoma. This match, specific to WNT medulloblastoma, was not observed in any other tumor type, including Group 4 medulloblastoma, which predominantly mapped to unipolar brush cells (Extended Data Fig. 4) as previously reported38. We next identified the most discriminant MFN gene markers by two alternative methods (differential expression analysis and a machine learning approach, Fig. 4b,c). MFN-specific genes, such as Nkd1 that permitted classification of MFN with nearly 80% accuracy, were among the top 20 genes driving the tumor match (Fig. 4d). They were also significantly upregulated in WNT medulloblastoma bulk tumors (Fig. 4e). Importantly, a recent study of active medulloblastoma enhancers39 reports NKD1 as the top super-enhancer active in WNT medulloblastoma. In addition to NKD1, a negative regulator of the WNT signaling pathway, several enhancers of MFN markers were active in this tumor type, including ZIC1, PAX6, BARHL1, PDE1C, PCSK9, and OLIG3. Based on lack of enhancer activity for markers of the climbing fiber neurons (PTF1A, NEUROG1, ASCL1, FOXD3, BRN3A), this study also allowed us to exclude this lineage as the one at the origin of WNT medulloblastoma. Altogether, these results indicate that WNT medulloblastoma transcriptionally mirror cells within the LRL-derived mossy fiber neuron lineage, confirming the postulated progenitor source12, and resolving their specific cellular lineage (Fig. 4f).
Figure 4 |. WNT medulloblastomas mirror the lower rhombic lip-derived mossy fiber neurons.
a, Deconvolution analysis (CIBERSORT) of bulk WNT medulloblastoma (MB) patient samples (n = 10), using a panel of signatures comprising pontine neurons and refined progenitors from the mouse embryonic pons. b, Volcano plot for differential gene expression analysis between mossy fiber neurons (n = 198 cells) and all other postnatal pontine neuron clusters (n = 939 cells). P-values (two-sided Wilcoxon rank sum test) were adjusted for multiple testing using the Bonferroni correction. c, Genes discriminant of mossy fiber neurons, identified using a random forest-based approach (Supplementary Note), are ranked by their classification score. d, Top 20 genes contributing to the ssGSEA enrichment of the mossy fiber neuron signature in bulk WNT MB transcriptomes (n = 10), identified using a leading-edge analysis. Boxplots represent the rank of expression of each gene in bulk transcriptomes, and genes are sorted by their median rank of expression. Center line, median; box limits, upper and lower quartiles; whiskers, 1.5x interquartile range. Genes highly specific to mossy fiber neurons as identified in b and c are indicated by a red box. e, Boxplots of bulk RNA-seq expression of mossy fiber neuron lineage genes, which are significantly upregulated in WNT MB compared to other tumor types shown (WNT MB: n = 10; ETMR: n = 14; HGG-H3.3K27M: n = 12; HGG-WT: n = 24; ATRT: n = 10). P-values (two-sided Wald test) adjusted using the Benjamini-Hochberg correction are indicated in parentheses. Center line, median; box limits, upper and lower quartiles; whiskers, 1.5x interquartile range. f, Model of WNT medulloblastoma lineage of origin. mb, midbrain; cb, cerebellum; RL, rhombic lip; 4v, fourth ventricle; hb, hindbrain; LRL, lower rhombic lip. g,h, Visualization of a patient WNT medulloblastoma scRNA-seq sample (n = 3,875 cells). g, tSNE and clustering, with non-malignant clusters labeled by cell type, and malignant clusters labeled with numbers. h, Expression of marker genes of malignant tumor clusters. Complementary analysis for additional scRNA-seq samples is shown in Extended Data Figure 5.
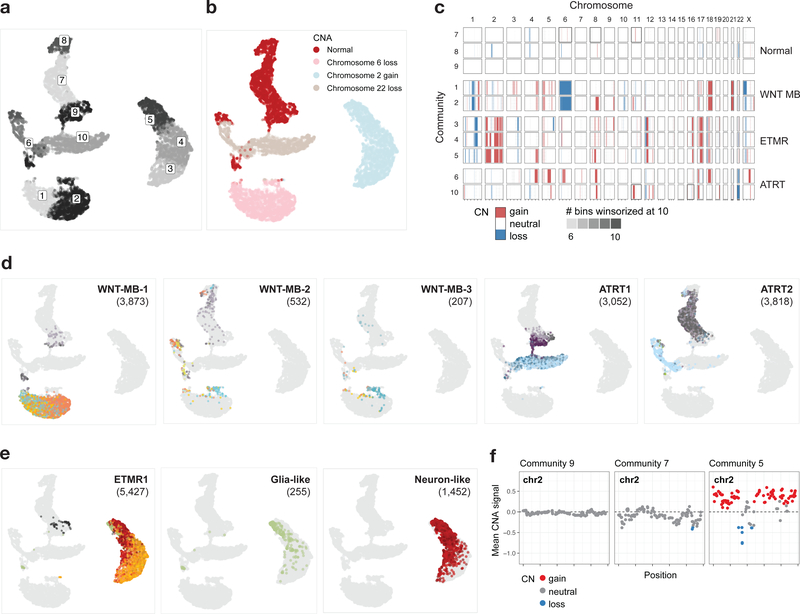
To further delineate the differentiation state of tumors, and investigate intra-tumor heterogeneity and cellular hierarchy, we performed scRNA-seq on three patient samples (Fig. 4g,h and Extended Data Fig. 5g–j). We first distinguished malignant and normal cells based on copy number aberration (CNA) analysis (Fig. 5a–d, monosomy 6, documented in WNT medulloblastoma40). Expression of ZIC1, OTX2 and CTNNB1 broadly marked the malignant cells (Extended Data Fig. 5g). Cell-type specific gene sets, on the other hand, unambiguously identified small clusters of microglia, OPCs, astrocytes and mesodermal cells. Among malignant cells, we found a consistent cellular structure across patient samples. Three major cell populations formed a continuous transcriptional gradient that could be reconstructed using trajectory analysis (Extended Data Fig. 5h). A first non-proliferating subpopulation expressed WNT16. A second non-proliferating population expressed the WNT signaling inhibitors Dikkopf proteins (DKK1/2/4+). DKK3, on the other hand, was absent, consistent with its frequent downregulation in WNT medulloblastoma41. These observations indicate that the WNT signalling pathway, which molecularly characterizes this tumor, exhibits at the single-cell level a gradient of activation. A third cellular population displayed an early neuronal-committed phenotype: non-migrating (DCX-), immature (RBFOX3-), and expressing NEUROD1 at high levels. The best match to normal developmental cell populations, using ssGSEA scores, remained the MFN. Moreover, malignant cells expressed MFN marker genes and lacked expression of climbing fiber neuron marker genes (Extended Data Fig. 5g). Altogether, these results indicate that WNT medulloblastomas share a common cellular origin in the pre-cerebellar LRL, and specifically the MFN lineage. The recurrent cellular structure at the single cell level and the persistent match to this specific brainstem population are consistent with a model of stalled differentiation, with oncogenic mutations entrapping tumor cells in a progenitor-like phenotype that retains features of the lineage of origin.
Figure 5 |. Copy number aberration (CNA) analysis on scRNA-seq tumor samples.
a, UMAP embedding of cells based on copy number signal, colored by community. Communities are defined based on copy number signal (n = 16,966 cells; Supplementary Note). b, UMAP embedding of cells colored by prominent copy number change. c, Copy number profile per community per chromosome. Copy number is called per community defined in a, with each community containing cells from one or more patient samples. d, UMAP embedding, with cells from each WNT and ATRT tumor sample colored by their cluster assignment in the individual sample space, and others in gray. Number of cells is indicated for each sample in parentheses. e,f, CNA calling for ETMR1 sample. e, ETMR1 cells in UMAP space, colored by cluster as in d (left) with similar plots for glia-like (middle) or neuron-like (right) tumor cells only. f, Binned copy number signal on chromosome 2, colored by segmentation from the HMM-based approach to call copy number, shown for communities 5, 7, and 9. Each point represents a genomic bin.
ETMRs recapitulate a neuronal lineage
ETMRs, driven by a fusion between the brain-specific TTYH1 gene and the oncogenic microRNA cluster C19MC9, have low inter-tumoral genetic heterogeneity. High LIN28A and low OLIG2 levels, gain of chromosome 242, and a very distinctive DNA methylation profile are hallmarks of ETMRs8,9. The cell of origin is unknown, although a Sox2+/Pax6+ apical radial glia of the cortical ventricular zone has been postulated as a potential source of ETMRs43.
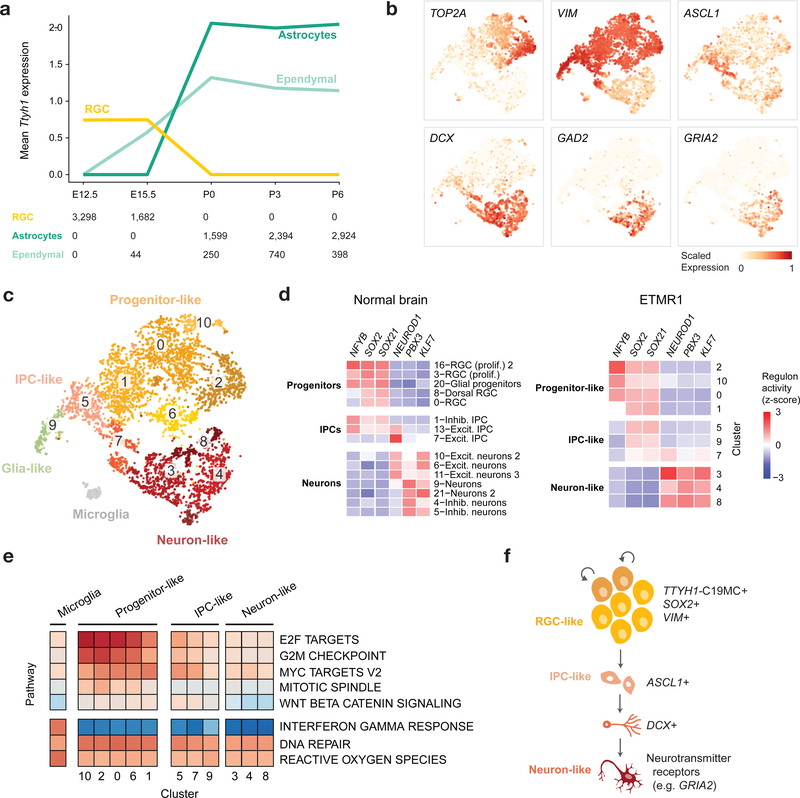
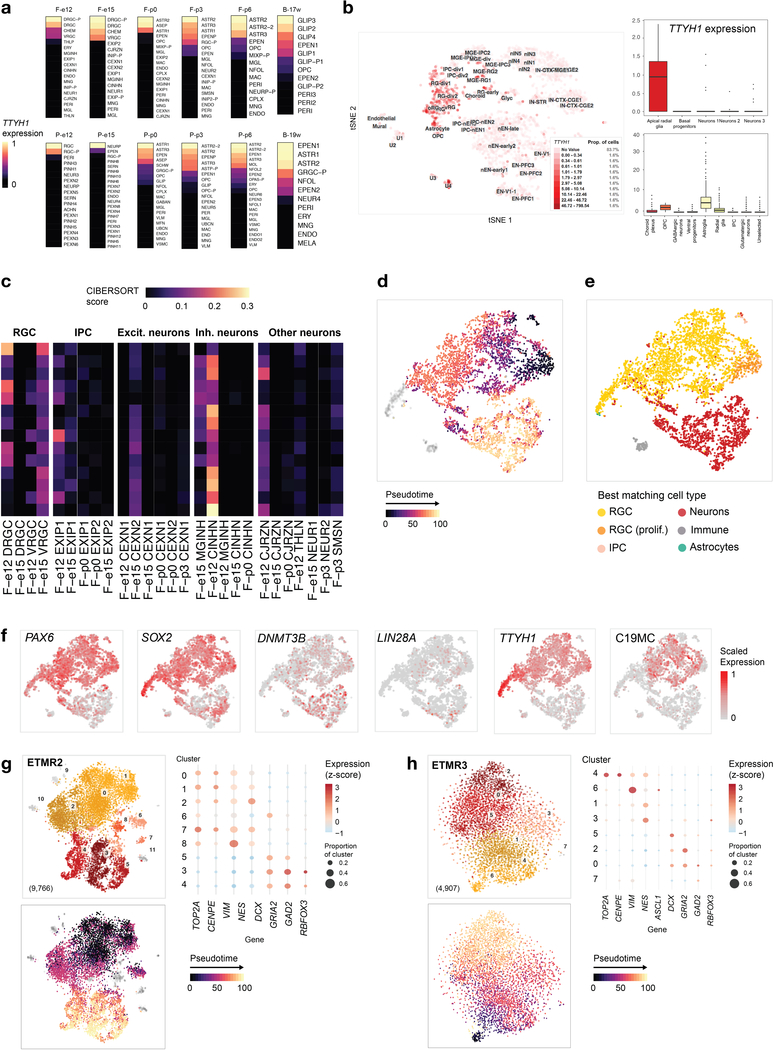
To define the cell of origin of ETMRs, we profiled expression of TTYH1 across the developmental atlas we generated, as well as three human fetal brain reference datasets24,44,45. TTYH1 followed a cell type-specific, temporally regulated expression pattern consistent across species and brain regions. Expressed prenatally in RGCs, TTYH1 switched postnatally mainly to the astro-ependymal lineage in both human and mouse (Fig. 6a and Extended Data Fig. 6a,b). Cell populations expressing TTYH1 uniquely have the potential for C19MC overexpression when harboring the TTYH1-C19MC fusion. Therefore, the precise expression pattern of TTYH1 throughout the brain nominates prenatal radial glia cells as the cell of origin of ETMRs.
Figure 6 |. ETMRs fully recapitulate a neuronal lineage.
a, Mean expression of Ttyh1 in the developing mouse brain. RGCs, astrocytes, and ependymal cells are shown, with number of cells for each type indicated at the bottom. Expression across the complete dataset is presented in Extended Data Figure 6. b-e, scRNA-seq profiling of an ETMR patient sample (n = 5,427 cells). Additional samples are shown in Extended Data Figure 6. b, Gene expression of representative markers from the neuronal differentiation path. Expression of each gene was scaled to [0, 1] for visualization. c, tSNE and clustering, with non-malignant cluster labeled by cell type and malignant clusters labeled with numbers only. d, Heatmap of inferred transcription factor regulon activation in the normal mouse forebrain (left) and clusters of the ETMR patient sample (right). e, Heatmap of ssGSEA enrichment of Hallmark biological pathways (rows) in clusters of the ETMR patient sample (columns). f, Model of ETMR tumor architecture, recapitulating a neuronal differentiation program.
Unexpectedly, ETMR bulk tumors mapped to a range of populations from the neuronal lineage when using ssGSEA projection (Fig. 3b) and deconvolution analysis (Extended Data Fig. 6c). Profiling three human tumor samples at the single cell/single nuclei level revealed the source of this heterogeneity (Fig. 6b–d and Extended Data Fig. 6d–h). Malignant cells (marked by a gain of chromosome 2; Fig. 5e,f) displayed a very defined cellular hierarchy along the neuronal lineage, with a small proportion of cells committing to the glial lineage, although maintaining a progenitor phenotype (cluster 9, VIM+, high ssGSEA score for RGC signatures). Pseudo-time reconstruction delineated a transcriptional gradient (Extended Data Fig. 6d) confirmed by the expression of canonical markers (Fig. 6b) and by ssGSEA projections (Extended Data Fig. 6e). On one end of this gradient, tumor cells displayed a progenitor-like phenotype (VIM+, NES+), which progressed towards a migrating (DCX+, cluster 3) and then to a more mature (GAD2+, GRIA2+, clusters 4, 8, 12) neuronal phenotype. We next reconstructed active gene regulatory networks34. In agreement with a complete recapitulation of the neuronal lineage within each tumor sample, RGC-specific regulons were active in the progenitor-like tumor compartment, while the neuron-like compartment shared regulatory modules with normal differentiated neurons (Fig. 6c,d).
The RGC-like tumor compartment expressed C19MC, driven by the promoter of the fused copy of TTYH1, which was silenced in the minority of malignant cells that were able to escape and progress in differentiation (Extended Data Fig. 6f). This compartment also displayed signatures related to the oncogenic process, with increased activation of proliferation-related pathways and high MYC signal (Fig. 6e). In sum, these findings support a model in which prenatal, neurogenic RGCs undergo oncogenic transformation, resulting in their abnormal persistence in the developing brain. In this tumor type, the progenitor-like cells are only able to progress to a limited extent along their programmed differentiation path (Fig. 6f), explaining the histology of these tumors, which resemble undifferentiated neural tubes.
Group 2a/b ATRTs originate outside the neuroectoderm
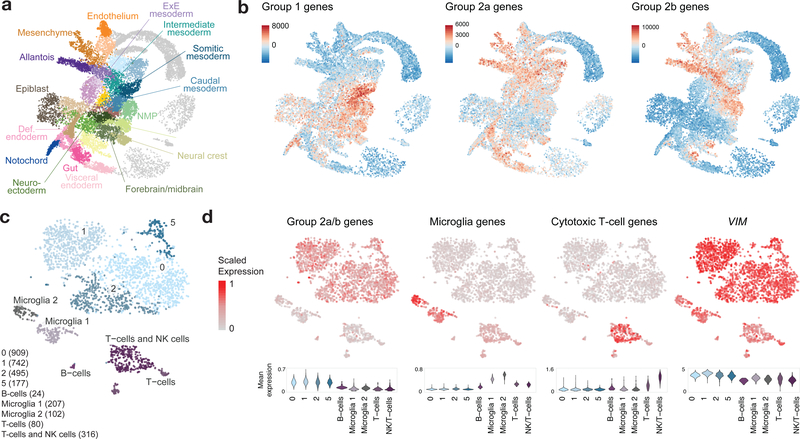
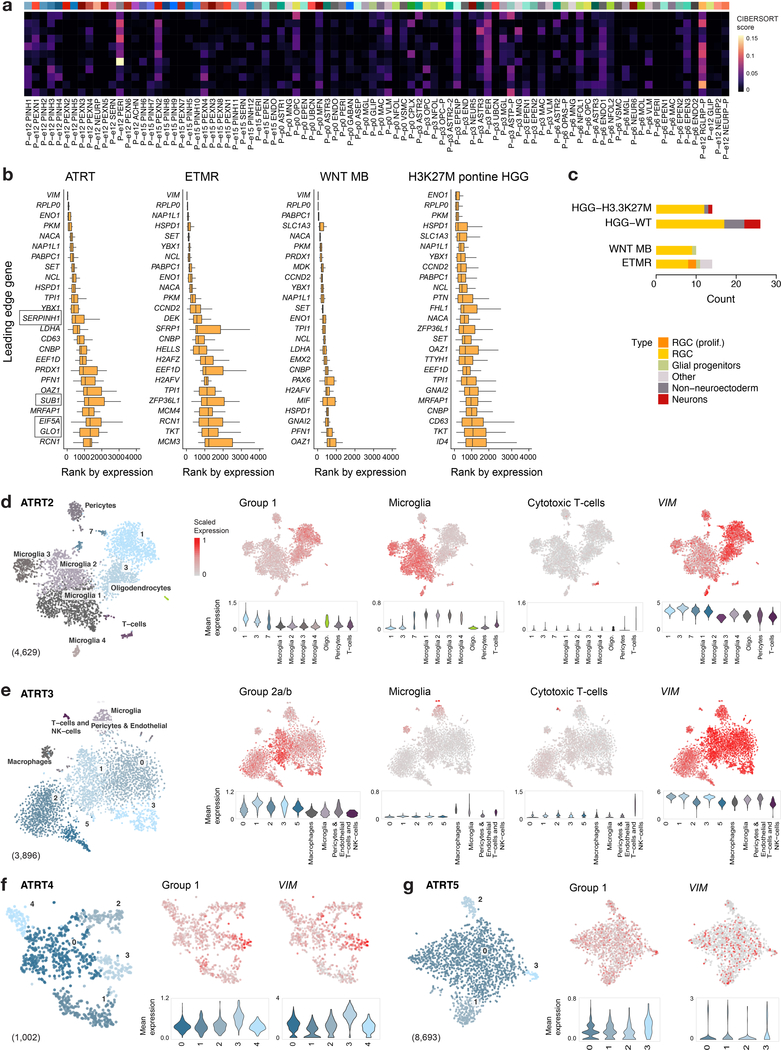
In contrast to ETMRs, WNT medulloblastomas, and pHGGs, ATRT bulk tumors mapped with low scores to a range of RGCs and mesodermal cell types (Fig. 3b and Extended Data Fig. 7a). The RGC match was driven by non-lineage specific genes (Extended Data Fig. 7b,c), suggesting that these tumors do not mirror any particular lineage within our atlas. Given the occurrence of some ATRTs in the cerebellum, we also mapped bulk tumors to developing cerebellar cell populations38 (E10-P14) (Extended Data Fig. 4). This analysis yielded similar results: ATRTs did not collectively resemble any specific cerebellar cell type. We thus expanded our reference beyond the developing neuroectoderm. We obtained a single-cell atlas of mouse gastrulation and early embryogenesis46 (E6.5-E8.5), covering the developmental window where inactivation of Smarcb1 led to intracranial tumors in ATRT mouse models47 (Fig. 7a). Gene signatures for the three ATRT subgroups4,21 (Group 1/SHH, Group 2a/TYR and Group 2b/MYC) had very distinct expression patterns in this dataset, with Group 2b genes21 (and, to a lesser extent, Group 2a) clearly silent in the neuroectodermal related structures, supporting our hypothesis of a non-neuroectodermal origin (Fig. 7b). Group 1 genes21, in contrast, while highly enriched in mesodermal populations, were also detected in the neuroectoderm, spinal cord and forebrain/midbrain, and thus a neuroectodermal origin cannot be ruled out for this subtype.
Figure 7 |. Group 2a/b ATRTs do not match neuroectodermal cell types.
a, UMAP visualization of a published atlas of mouse embryogenesis46 between E6.5-E8.5 (n = 18,140 cells). Def, definitive; ExE, extra-embryonic; NMP, neuromesodermal progenitors. b, ssGSEA scores of ATRT molecular subtype gene signatures (Supplementary Table 1a) in the embryogenesis atlas. c, scRNA-seq profiling of a patient ATRT sample: tSNE visualization and clustering, with non-malignant tumor clusters labeled by cell type, and malignant clusters labeled with numbers only. Number of cells in each cluster is indicated at bottom left in parentheses. Additional samples shown in Extended Data Figure 7. d, Mean expression of ATRT Group 2a/b, microglia, and cytotoxic T-cell gene signatures (Supplementary Table 1a), and expression of VIM, represented in the tSNE embedding (top) and violin plots (bottom). Violin plots display a kernel density estimate computed on the full range of the underlying data without removal of outliers. The tails of the resulting violins are trimmed to the range of the data. Violins are scaled to the same area.
To eliminate the confounding effects of tissue composition, we profiled five patient samples by sc/snRNA-seq (Fig. 7c,d and Extended Data Fig. 7d–g). Tumors were composed of a VIM+, malignant population expressing genes upregulated in the corresponding ATRT subtype4,21. Once again, malignant cells did not match any specific cell type in our atlas. Importantly, we detected a major vascular and immune infiltration component in tumors, corroborating the match to pericyte and mesoderm signatures observed for some bulk tumors (Extended Data Fig. 4). We observed distinct populations of microglia and immune cells including cytotoxic T-cells (CD8A+/CD8B+), natural killer cells (CD161/KLRB1+), and a small cluster of B cells (CD79A+), consistent with data indicating high immune infiltration in ATRTs48. Our results suggest that Group 1 ATRTs may arise from an earlier progenitor (prior to E12.5). In turn, Group 2a/b ATRTs, two genetically homogeneous but molecularly diverse subtypes, likely originate outside the neuroectodermal populations surveyed here. These data potentially explain why mouse models using neuronal drivers did not lead to ATRT formation, and only the inducible loss of Smarcb1 during a narrow embryonal window using a ubiquitous driver generated CNS but also extra-CNS tumors47.
A glial-committed progenitor in pontine H3K27M HGG
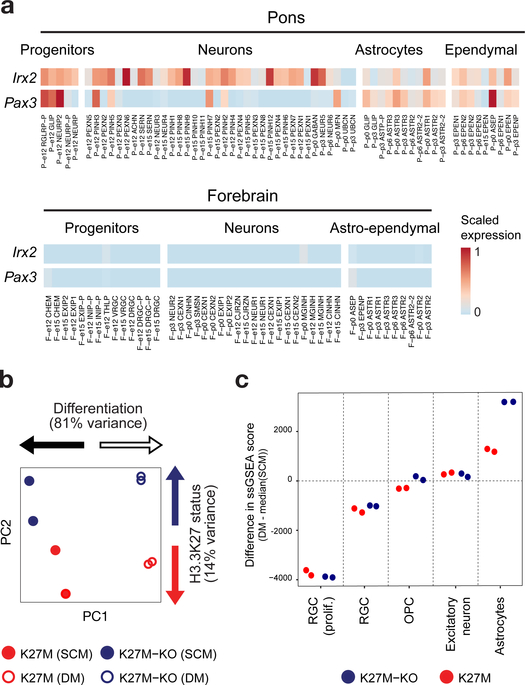
Neural precursor cells (NPCs) can be transformed by the driver H3K27M when combined with other mutations in vitro49, and in vivo only when introduced prenatally50. H3K27M HGGs have been proposed to consist of proliferating OPC-like cells that eventually progress towards an astrocyte-like or oligodendrocyte-like state51,52. We recently reported the super-enhancer landscape and core TF circuitry of H3K27M pHGG53. In our atlas, the top two core TFs detected in H3K27M HGGs, IRX2 and PAX3, are specifically expressed in the pons (Fig. 8a), consistent with the spatial occurrence of this mutation. By ssGSEA projections, bulk H3K27M pontine HGG transcriptomes predominantly matched human astrocyte and OPC signatures (Fig. 3b and Extended Data Fig. 8a,b).
Figure 8 |. Differentiation potential is impaired in H3K27M cells.
a, Heatmap of expression of Irx2 and Pax3, core transcription factors53 in H3K27M HGG, in the mouse atlas. Expression was normalized to a [0, 1] scale for visualization. b,c, RNA-seq from H3.3 K27M pontine HGG primary tumor-derived cell lines and isogenic K27M-KO lines maintained in stem cell media (SCM) or subjected to a differentiation protocol (DM). Experiment was performed for n = 2 biologically independent replicates per condition. b, PCA based on ssGSEA projections of bulk transcriptomes onto developmental cell populations. c, Change in ssGSEA score after differentiation protocol for each individual replicate, for select signatures. All neuroectodermal signatures are shown in Extended Data Figure 8.
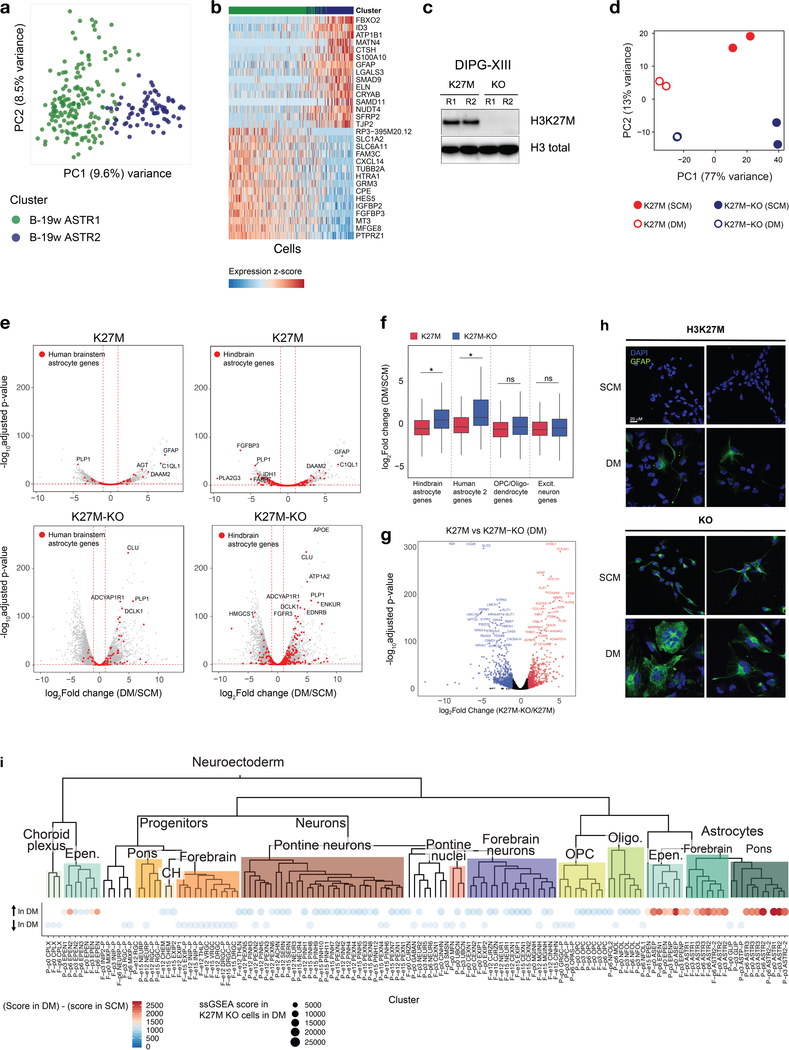
To assess whether H3K27M mutation directly impacts cellular differentiation potential, we introduced frameshift mutations in the H3F3A-mutant allele (encoding H3.3) in the tumor-derived primary cell line DIPGXIII using CRISPR/Cas9, which abolished mutant protein expression (described in Harutyunyan et al.54, Krug et al.53, and Extended Data Fig. 8c). Cells were maintained in stem cell media promoting neural stem cell self-renewal, or serum-containing differentiation media for two weeks, and gene expression was then assessed by RNA-seq. PCA based on ssGSEA projections (Fig. 8b) or gene expression (Extended Data Fig. 8d) showed that the differentiation protocol induced important transcriptional changes (PC1, 81% variance explained), which largely differed between H3.3K27M and H3.3K27M-KO cells (PC2, 14% variance explained). In differentiation media, cells adopted a less-proliferating, astrocyte-like state (Fig. 8c), consistent with the cellular match observed for bulk tumors. Importantly, cells progressed further along the astrocytic lineage after removal of H3.3K27M mutation (Fig. 8c and Extended Data Fig. 8e–i). Some H3.3K27M cells acquired diffuse GFAP expression upon differentiation. Knockout lines, in turn, expressed low GFAP amounts in stem cell media and greatly upregulated expression in differentiation media, in which GFAP formed the stereotypical cytoskeletal filaments found in mature astrocytes (Extended Data Fig. 8h). In sum, these results, together with data obtained on chromatin marks affected by this mutation53,54, indicate that a pontine glial-committed neural progenitor is at the root of H3.3K27M-mutant HGG and that this mutation prevents complete differentiation along glial lineages.
Discussion
Childhood brain tumors have a spatio-temporal distribution that mirrors cellular waves of brain development, and several of their known drivers have developmental roles. A major challenge in understanding, modeling, and treating these tumors has been the absence of a comprehensive blueprint of normal brain development and the lack of knowledge regarding their cell of origin. Modeling studies often involve labor-intensive scanning of developmental windows and cell types permissive to the driver mutations47,50,55. These limitations severely impact accurate modeling and the development of rational frameworks for therapeutic interventions, as molecular dependencies of specific progenitors’ states are unknown or under-appreciated. Our work addresses these gaps. We provide the first transcriptomic blueprint for the developing pons and expand recent data on forebrain development27–29. Our census uncovers progenitors and differentiation pathways unique to the pons, distinct from previously surveyed neural cell types33. Importantly, focusing our reference atlas on two main regions where pediatric tumors arise enabled us to characterize putative cells of origin and identify impaired development as a common mechanism at the origin of several brain tumor types.
Indeed, in WNT medulloblastoma, the absence of bona fide, fully differentiated cells in the scRNA-seq tumor data, together with the univocal match to a pontine pre-cerebellar cell population of the LRL-derived MFN lineage, suggest a strong differentiation block in this medulloblastoma subgroup. In ETMRs, the very young age at diagnosis, exquisite similarities with the fetal brain, and activation of pathways that can be precisely timed (TTYH1, DNMT3B) argue for a prenatal oncogenic event. Profiling cortical neurogenesis allowed us to capture how ETMRs arise in early neural progenitors and a large proportion of cells remain in this state, unable to fully differentiate. Tumor samples recapitulate the complete neuronal lineage, but C19MC expression specifically persists in the progenitor-like cells, which maintain the tumor supply (Extended Data Fig. 6f). In H3K27M pontine pHGG, our data support an origin within a glial-committed neural progenitor. Last, we show that Group2a/b ATRTs likely originate from cells outside of the neuroectoderm. This may explain the extra-CNS occurrence of rhabdoid tumors, including in mouse models47. Further studies of additional time points and developmental compartments not profiled here will be needed to elucidate the cell of origin of this entity.
Understanding the molecular mechanism underlying impaired differentiation, and the timing of the oncogenic event, which in many cases seems to be prenatal, can provide important clues for reversing its effects. Indeed, we show that removal of the oncogenic H3K27M mutation in pHGG tumor-derived cell lines directly promotes progression of differentiation along the glial lineage, despite the many associated genetic alterations (including TP53 mutations and/or MYC amplification) identified in these lines. This underlines the direct effect of H3K27M on the differentiation potential of pontine neural progenitors. It also shows that the effects of a differentiation blockade may be reversed, which can apply beyond pHGGs. The dependencies of each tumor cell of origin, necessary during development but not required after birth, could be targeted if better understood. To this effect, we provide a framework for modeling tumors and a more accurate read-out for therapeutic efficacy, as proliferation rates or migration potential, which have been generally used in the design of therapeutic interventions, are less relevant in these brain tumors. In summary, our data reveal a common theme across subtypes of pediatric brain tumors where genetic alterations impact restricted developmental windows during the differentiation of neural lineages, retaining cells in a self-renewing, progenitor-like phenotype. The possibility that tumors arise in more terminal cell types and undergo dedifferentiation is remote and will require additional in vivo lineage tracing experiments to be formally excluded. A deep understanding of the biology, timing and transitional states of the developmental hierarchies at the root of childhood brain tumors may allow for the rational design of pre-clinical models, an essential step towards improved tumor diagnostics and novel therapeutics.
Methods
Tissue handling and dissociation
Protocols for this study involving human samples were approved by the following: Research Ethics Board, McGill University and Affiliated Hospitals Research Institutes; Research Ethics Board, Hospital for Sick Children; Ethics Review Board, Douglas Mental Health University Institute; Comité d’éthique de la recherche du CIUSSS de l’Estrie – CHUS, Université de Sherbrooke. Animal protocols were approved by the following: Animal Compliance Office, McGill University and Affiliated Hospitals Research Institutes; Animal Care Committee of The Centre for Phenogenomics, Joseph and Wolf Lebovic Centre. We have complied with all relevant ethical regulations. Informed consent was obtained from human research participants.
Mouse embryonic and postnatal brain structures were dissected from the gestational time points E12.5 and E15.5 and from postnatal time points P0, P3 and P6. In the case of the brainstem, an incision was made between the midbrain and hindbrain boundary, as well as between the medullary hindbrain and spinal cord, in order to isolate rhombomeres 1 to 11 with the exception of the cerebellar structure that was removed. The mouse forebrain was isolated by a coronal slice as illustrated in Extended Data Figure 1b, generated using embryonic forceps. All mouse dissections were performed under a Leica stereoscope with a pair of Moria ultra fine forceps (Fine Science Tools), in a PBS solution. The tissue was transferred into ice-cold Leibovitz’s medium, followed by single cell dissociation with the Papain Dissociation System (Worthington Biochemical Corporation, NJ).
Fresh human brainstem tissue was obtained from two elective non-medically motivated pregnancy terminations at 17 and 19 post-conception weeks, with no evidence of developmental abnormalities. Brain cells were individualized using the Worthington Papain Dissociation System (Worthington Biochemical Corporation, NJ) and cryopreserved for later use. See Supplementary Note, section 1 for an analysis of cell type specific biases introduced by cryopreservation.
Fresh tumors collected after surgery were enzymatically digested and mechanically dissociated using the papain version of the Brain Tumor Dissociation Kit (Miltenyi Biotech) or a collagenase-based dissociation method as previously reported56 (Supplementary Table 6). PBS used to wash and resuspend the cell pellets was supplemented with 1% BSA (0.05% BSA in the case of collagenase-based dissociation). Red blood cells were lysed by ammonium chloride treatment for 5 min on ice. After counting the cells and verifying their viability with Trypan Blue (>60%), dissociated cells (10,000) were processed for library preparation, or cryopreserved in Cryostor CS10 (StemCell Technologies) for later use (Supplementary Table 6). For samples with low viability (<60%), dissociated cells were first enriched for live cells using the Dead Cell Removal kit (Miltenyi Biotech).
scRNA-seq library preparation
The concentration of the single cell suspension was assessed with a Trypan blue count. Approximately 10,000 cells per sample were loaded on the Chromium Single Cell 3’ (10X Genomics) system. GEM-RT, DynaBeads cleanup, PCR amplification and SPRIselect beads cleanup were performed using Chromium Single Cell 3’ Gel Bead kit. Indexed single cell libraries were generated using the Chromium Single Cell 3’ Library kit and the Chromium i7 Multiplex kit. Size, quality, concentration and purity of the cDNAs and the corresponding 10x library was evaluated by the Agilent 2100 Bioanalyzer system. The 10x libraries were sequenced in the Illumina 2500 sequencing platform.
snRNA-seq library preparation
Nuclei were prepared as previously described57. Frozen tissue (5–50 mg) was dounced in Lysis Buffer (10 mM Tris-HCl pH 7.4, 10 mM NaCl, 3 mM MgCl2, 0.05% NP-40). Wash and resuspension buffer (PBS, 5% BSA, 1 U/ml Rnase Inhibitor, 0.25% glycerol) was then added and nuclei were passed through a 30-μm cell strainer to remove clumps, centrifuged and resuspended in 1 ml of wash buffer. 25% iodixianol solution was prepared by mixing resuspended nuclei with 1 ml of Optiprep 50% (Optiprep + Solution B : 150 mM KCl, 5 mM MgCl2, 20 mM Tricine, pH7.8, v/v), layered on 29% Optiprep cushion and centrifuged at 10,000g for 30 min at 4 °C. The nuclei pellet was finally carefully resuspended in wash buffer to reach a concentration of 1,500 nuclei/μl. As nuclei capture appears to be about 30% less efficient than for cells57, we aimed to capture 14,000 nuclei per sample. The Chromium single cell 3’ (10X Genomics) protocol was strictly followed to prepare libraries.
RNA-seq library preparation
The RNeasy mini kit (Qiagen) was used to extract total RNA from cell pellets according to instructions from the manufacturer. Library preparation was performed with ribosomal RNA (rRNA) depletion according to instructions from the manufacturer (Epicentre or Ribo-Zero Gold kit, Illumina), with the exception of WNT medulloblastoma samples, where a stranded, poly(A)+ enriched library preparation protocol was followed as described58. Paired-end sequencing was performed on the Illumina HiSeq 2000, 2500 and 4000 platforms.
Cell culture
Tumor-derived cell lines cultured as glioma stem cells were maintained in Neucult NS-A proliferation media (StemCell Technologies) supplemented with bFGF (10 ng/mL) (StemCell Technologies), rhEGF (20 ng/mL) (StemCell Technologies) and heparin (0.0002%) (StemCell Technologies) on plates coated in poly-L-ornithine (0.01%) (Sigma) and laminin (0.01 mg/mL) (Sigma). Lines were cultured to become differentiated glioma cells by adaptation to media of DMEM (4.5 g/L glucose, with L-glutamine, sodium pyruvate and phenol red) (Wisent) supplemented with 10% fetal bovine serum (Wisent) for two weeks, while maintained on poly-L-ornithine and laminin coated plates. All lines tested negative for mycoplasma contamination, checked monthly using the MycoAlert Mycoplasma Detection Kit (Lonza). Tumor-derived cell lines were confirmed to match original samples by STR fingerprinting. We thank Michelle Monje for kindly sharing primary tumor cell lines established from patients with high-grade glioma.
Immunofluorescence
Cells were plated in Nunc Lab-Tek II Chamber slide system (8-well) (ThermoFischer Scientific). Slides were fixed with 4% paraformaldehyde in 2% bovine serum albumin (BSA) for 15 min at room temperature, followed by washing three times with PBS. Cells were permeabilized by 0.05% Triton X-100, 2% BSA, 5% normal goat serum (NGS) in PBS followed by 3 PBS washes. Slides were blocked with 2% BSA, 5% NGS in PBS for 1 hour, followed by overnight incubation with anti-GFAP rabbit monoclonal antibody (Cell Signalling #12389) at 1:200 dilution in blocking solution. Cells were washed 3 times with PBS and incubated for 1 hour with 1:500 dilution of Goat anti-rabbit IgG cross-adsorbed secondary antibody, Alexa Fluor 488 (ThermoFischer Scientific) in blocking solution. Slides were washed 3 times in PBS and Prolong Gold antifade reagent with DAPI (Invitrogen) was applied. Slides were photographed with Zeiss LSM780 Laser Scanning Confocal Microscope at 20X and 63X magnification.
Western blotting
Histone lysates were extracted using the Histone Extraction Kit (Abcam). Lysate protein concentration was determined with the Bradford assay reagent (Bio-Rad). Three micrograms of histone was separated on NuPAGE Bis-Tris 10% gels (ThermoFischer Scientific) and wet-transferred to a PVDF membrane (GE Healthcare). Membrane blocking was performed with 5% skim milk in Tris-buffered saline (50 mM Tris, 150 mM NaCl, 0.1% Tween 20, pH 7.4) (TBST) for 1 hour. Membranes were incubated overnight with primary antibody in 1% skim milk in TBST. Membranes were washed 3 times in TBST, and the secondary antibody (ECL anti-rabbit IgG Horseradish Peroxidase linked whole antibody) (GE Healthcare) was applied for 1 hour in 1% skim milk in TBST. Membranes were washed 3 times and the signal was resolved with Amersham ECL Prime Western Blotting Detection Reagent (GE Healthcare) and imaged on a ChemiDoc MP Imaging System (Bio-Rad). The antibodies and their concentrations are listed in the Life Sciences Reporting Summary.
Bulk RNA-seq data analysis
Initial processing and quality control
Adaptor sequences and the first four nucleotides of each read were removed from the read sets using Trimmomatic59 (v0.32). Reads were scanned from the 5’ end and truncated when the average quality of a 4-nucleotide sliding window fell below a threshold (phred33<30). Short reads after trimming (<30 bp) were discarded. Quality control metrics were obtained using FASTQC (v0.11.2), samtools60 (v0.1.19) and BEDtools61 (v2.17.0). High quality reads were aligned to the reference genome hg19 (GRCh37) with STAR62 (v2.3.0e), using default parameters. Multimapping reads (MAPQ<1) were discarded from downstream analyses.
Gene expression analysis
Gene expression levels were estimated by quantifying reads uniquely mapped to exonic regions defined by the ensGene annotation set from Ensembl (GRCh37; n = 60,234 genes) using featureCounts63 (v1.4.4). Normalization (mean-of-ratios), variance-stabilized transformations of the data, as well as differential expression analysis, were performed using DESeq264. Unless otherwise stated, all reported P-values have been adjusted for multiple testing using the Benjamini-Hochberg procedure. Global changes in expression levels were evaluated by hierarchical clustering of samples and principal component analysis (PCA) using normalized expression data coupled with variance-stabilized transformation64.
Analysis of scRNA-seq
Initial processing and quality control of sequencing data
Cell Ranger (10x Genomics) was used with default parameters to demultiplex and align sequencing reads, to distinguish cells from background, and to obtain gene read counts per cell. Alignment was performed using the hg19 reference genome build coupled with the Ensembl transcriptome version 75. In the case of ETMR samples, a genomic annotation for the C19MC cluster (chr19:54161588–54269814), absent in Ensembl annotations, was added to the reference. Intronic counts were included in the case of snRNA-seq samples. Cells were filtered based on the following quality control metrics (Supplementary Table 6): mitochondrial content (indicative of cell damage), number of genes and number of UMIs, using the R package Seurat, version 2.330,31. Thresholds for each sample were set based on the distribution of each metric within the sample, which varies with sequencing coverage and number of cells captured. In cases where a high mitochondrial content or low number of cells were observed in tumor samples (e.g. WNT-MB-3, ATRT2), interpretation of data was strictly restricted to validation of results obtained in higher quality samples; for analyses sensitive to these parameters (e.g. CNA calling, see Supplementary Note, section 3), a more stringent threshold was used to retain only a small subset of high quality cells from these samples. Cells with an outlier gene to UMI count ratio were filtered out as suspected multiplets. Libraries were scaled to 10,000 UMIs per cell and natural log normalized. These scaled log-transformed counts were used for differential expression analyses, computing correlations of gene expression, and assessing expression of specific genes and gene sets.
Identification of cell populations and their gene signatures
To allow for different degrees of granularity in our study, cells that passed quality control were analyzed at different levels, by pooling cells (i) from each brain structure (forebrain or pons), (ii) from each individual sample, or (iii) from defined subsets of cells. Human samples (fetal brainstems and tumors) were analyzed individually and never combined. Briefly, for each level, data were subjected to the following steps: normalization, selection of variant genes, regression of unwanted sources of variation, dimensionality reduction, clustering, assignment of cluster labels, extraction of gene signatures, and post-clustering quality control. Low quality clusters were filtered out. Clusters that showed internal structure unresolved by the initial clustering approach (e.g. embryonic progenitor populations) were extracted, re-embedded and re-clustered. Each one of these steps is detailed in the Supplementary Note, section 2.
For clusters not robustly defined (i.e. not robust to changing algorithm parameters, showing poor cluster validity metrics and not showing clear separation in the tSNE representation), a discrete clustering approach may not be optimal to represent the underlying cell population structure, which is better modeled as a mixture of cells linked by transitions along a continuum. In these cases, we isolated these cells and performed trajectory analysis to delineate differentiation states (see below).
Identification of active transcription factors (TF) and their regulatory modules
Active TFs and their gene targets in the dataset were inferred using SCENIC34. The SCENIC workflow implements the following steps. First, sets of genes (modules) co-expressed with TFs are identified. Second, modules for each TF are pruned based on motif support near the transcription start sites. Specifically, modules are retained if the TF motif is enriched among its targets, and target genes without direct motif support are removed. Third, the activity of the regulons is scored and binarized with AUCell34, which effectively determines whether the genes in each regulon are enriched in each cell using the distribution of regulon activity across all cells in the dataset. Finally, to compute regulon activity in clusters, we averaged the regulon activity across cells in each cluster. The input list of TFs was downloaded from the AnimalTFDB3.065 database. Inferred regulons and their activity across clusters in the mouse dataset are reported in Supplementary Table 3a,b.
Pseudotemporal ordering and trajectory reconstruction
The trajectory of cells within each lineage was inferred using the R package Monocle335,36,66 v2.8.0. Specific clusters included in each lineage are indicated in Supplementary Table 2a. Dimensionality reduction was performed using the Discriminative Dimensionality Reduction with Trees algorithm36, with the effect of the number of genes expressed and the mitochondrial percentage removed. The most variant genes were used to order cells along the tree. Cells were assigned a pseudotime according to their distance from the root state, which was manually selected. To display the relationship between cells in pseudotime, a minimum spanning tree was generated.
Identification of TFs differentially expressed across pseudotime
Genes differentially expressed across pseudotime were identified with Monocle, which models gene expression as a smooth, nonlinear function of pseudotime and then tests gene expression changes along this pseudotime. For branched lineages (astro-ependymal; pontine embryonic progenitors), genes differentially expressed between branches of a trajectory were identified using the branched expression analysis modeling (BEAM) algorithm36. This algorithm uses vector generalized linear models with splines to fit the non-linear gene expression dynamics as a function of pseudotime. The models for two branches are then compared with a likelihood ratio test for branch-dependent expression. TFs among the differentially expressed genes were identified using the AnimalTFDB3.065 database. Transcription factors with a q-value < 0.01 are represented in heatmaps and reported in Supplementary Table 3. Heatmaps were constructed based on expression levels of DE transcription factors across pseudotime (binned into 100 equal units of pseudotime), clustered by unsupervised hierarchical clustering using the Ward2 algorithm. Columns in heatmaps correspond to units of pseudotime.
Analysis of single-cell and single-nuclei tumor profiles
Analyses for characterization of copy number aberrations (CNA), pathway activation, cell cycle state and expression of tumor-specific gene sets are described in detail in Supplementary Note.
Integration of tumor data with the single-cell developmental atlas
Projection of bulk and single-cell transcriptomes onto scRNA-seq atlas
Human bulk RNA-seq transcriptomes were projected across the developmental populations using single sample Gene Set Enrichment Analysis (ssGSEA)37. Briefly, the ssGSEA score represents the degree of enrichment of a given gene signature in a sample: gene expression estimates for each sample are rank-normalized and empirical cumulative distribution functions (ECDF) of genes are computed. The final score integrates the difference between a weighted ECDF of genes in the signature and the ECDF of the remaining genes37. The GSVA R implementation from Bioconductor, version 1.27.067 provides this functionality with parameter method=“ssgsea”. The following additional parameters were used: mx.diff=FALSE, rnaseq=TRUE, ssgsea.norm=FALSE, tau=0.75. For mouse signatures, human gene orthologs were used, identified using the Ensembl Biomart database, version 7568.
To identify the specific genes driving the enrichment of a signature in a given tumor type, we derived and implemented a “leading edge” analysis, similar to the one developed for standard gene set enrichment analysis69. Briefly, for one signature and sample, we defined the leading edge gene set as the genes occurring in the rank-normalized gene list at or before the point at which the difference between the two ECDFs reaches its maximum. For each tumor type, we then extracted genes that were in the leading edge of all samples belonging to that type. For each gene, the median rank of expression across samples was computed, and we report the 20–25 genes with the smallest median rank, i.e. the highest rank-normalized expression.
ssGSEA scores for each signature (Supplementary Table 2a) for each bulk sample were computed and used as input for PCA, unsupervised clustering, or tSNE visualizations. tSNE was performed on the top 50 PCs of the score matrix, with theta = 0.5, 1,000 iterations, and perplexity = 15. We performed clustering analysis based on these projections for a range of datasets to verify that the scores were able to segregate distinct sample types. The scores distinguished, as expected, fetal from adult brain, tumors from cell lines, normal brain from tumor-adjacent brain, and different bulk samples from cell lines of diverse origin.
Human tumor scRNA-seq data was projected onto the developmental dataset at the level of clusters or single cells. At the cluster level, the mean expression of all detected genes was computed for each malignant cluster. ssGSEA scores were then computed for each cluster as described above.
Deconvolution analysis
CIBERSORT70 was used to perform deconvolution of bulk RNA-seq transcriptomes. The input signature matrix consisted of mean gene expression profiles for clusters in our developmental atlas. Genes appearing in any cluster’s gene signature were used as features. Quantile normalization was disabled, and CIBERSORT was run on relative mode with 100 permutations. We tested CIBERSORT in our setting using synthetic mixtures of mouse populations at varying proportions, representing different degrees of datasets imbalance, and verified that the expected relative ratios were correctly predicted.
Code availability
Our R package for analysis and visualization of single-cell RNA-seq data, cytobox, which was used to generate the figures presented here, is available on GitHub at https://github.com/fungenomics/cytobox under a GPL-3.0 license.
Data availability
Bulk and single-cell RNA sequencing data for normal human and patient tumor samples have been deposited in the European Genome-Phenome Archive under accession number EGAS00001003368. Single-cell RNA sequencing data for normal mouse samples have been deposited in NCBI GEO under accession number GSE133531. Bulk RNA sequencing data for human tumor derived cell lines have been previously deposited in NCBI GEO and are available under accession number GSE117446.
Extended Data
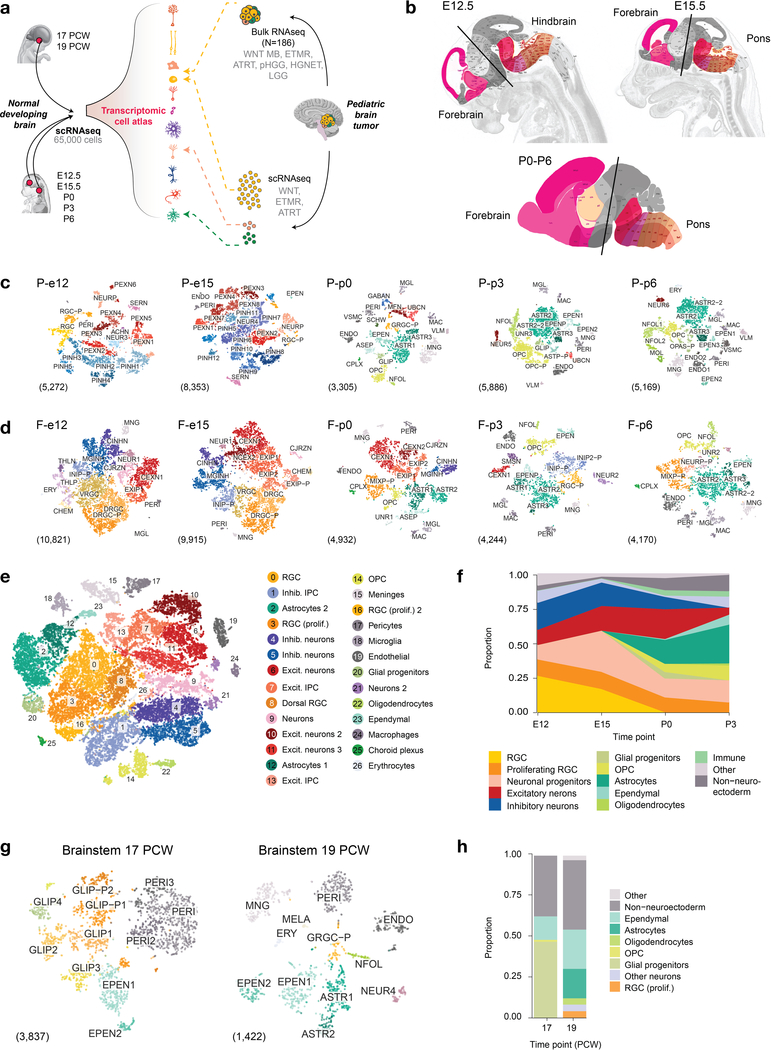
Extended Data Fig. 1. Overview of the single-cell transcriptomic atlas of the developing brain.
a, Overview of the approach. PCW, post-conception weeks. WNT MB, WNT-subtype medulloblastoma; ETMR, embryonal tumors with multilayered rosettes; ATRT, atypical teratoid/rhabdoid tumors; pHGG, pediatric high-grade gliomas; HGNET, high-grade neuroepithelial tumor; LGG, low-grade gliomas. b, Schematics of mouse brain regions included in dissections; figures adapted from the Allen Brain Atlas. At E12.5 and E15.5, the hindbrain (E12.5) and pons (E15.5) dissections included all of the rhombomere 1 structures with the exception of the cerebellar hemisphere, and all of the structures in rhombomeres 2–11. The forebrain dissections included parts of the dorsal pallium, central subpallium, subpallium, and septopallidal transition area. At P0, P3, and P6, the pons dissections included all of the rhombomere 1 structures with the exception of the prepontine hindbrain, and all of rhombomeres 2–11 with the exception of the roof plate structures in rhombomeres 1 to 6. The forebrain dissections included parts of the alar and roof plates of the telencephalon (including the dorsal pallium and medial pallium), and parts of the thalamus in prosomere 2, the prethalamus in prosomere 3, the preoptic alar plate, and the alar parts of the peduncular and terminal hypothalamus (original figures: © 2008 Allen Institute for Brain Science. Allen Developing Mouse Brain Atlas. Available from: developingmouse.brain-map.org). c, tSNE embeddings of individual mouse hindbrain/pons samples, colored by cluster. Number of cells in each sample is indicated in parentheses at bottom left; see Supplementary Table 2a for description of clusters. d, tSNE embeddings for mouse forebrain samples, as in (c). e, Labeled tSNE embedding of the joint mouse forebrain (n = 33,641 cells; Supplementary Table 2b). f, Proportion of cells from each major cell class in the forebrain over the timecourse. g-h, Overview of single-cell human fetal brainstem dataset. g, Labeled tSNE plots for each sample. Number of cells in each sample is indicated in parentheses at bottom left; see Supplementary Table 2a for description of clusters. h, Proportion of cells from each major cell class in human samples.
Extended Data Fig. 2. Quality control and cell type labeling strategies in scRNAseq atlas of the developing brain.
a, Distribution of quality control statistics for the E12.5 mouse forebrain. UMIs, unique molecular identifiers. Number of cells in each cluster is indicated in parentheses; clusters with >100 cells are shown. Violins are colored by cluster identity, and generated as in Figure 7. b, Illustration of quantification of cell-type specific gene sets (Supplementary Table 1a) to assign broad cell class. E12.5 mouse forebrain is shown. Number of cells in each cluster is indicated in parentheses. c-d, Gene expression distribution for selected cell type-specific canonical markers (Supplementary Table 1b) in clusters of the joint mouse pons (c) and forebrain (d). Number of cells in each cluster is indicated in Supplementary Table 2b–c. Violins are colored by cluster identity and generated as in Figure 7, with all violins scaled to the same width. e, Heatmaps of Spearman correlations of gene expression between clusters in the mouse dataset in this study (columns), and representative populations from a published atlas of the mouse central nervous system by Zeisel et al, 2018, Cell33 (rows). For populations within the Zeisel et al. dataset, a representative cluster was selected from each developmental compartment (see Supplementary Note for details). Color annotation on columns corresponds to cluster identity. Number of cells in each cluster is indicated in Supplementary Table 2a.
Extended Data Fig. 3. Patterning and differentiation dynamics during forebrain development.
a, Re-embedding of mouse forebrain progenitor populations from embryonic time points (n = 7,673 cells). Cells are colored by cluster assignment in the re-embedded tSNE space. b, tSNE embedding colored by expression of top discriminant gene markers for each cluster, identified using a random forest-based approach (Supplementary Note). c, In situ hybridization of selected discriminant marker genes, from the Allen Brain Atlas (© 2008 Allen Institute for Brain Science. Allen Developing Mouse Brain Atlas. Available from: developingmouse.brain-map.org) d, Visualization of forebrain cells from E12-P0 by tSNE (n = 25,668 cells). Top row, cell clusters are highlighted by age (left panels), or inferred pseudotime for the cortical excitatory neuron trajectory (right). Bottom row: expression of representative gene markers. Expression of each gene was normalized to a [0, 1] scale for visualization. e, Transcription factor activity along the inferred cortical excitatory neuron trajectory (Supplementary Table 3). f-g, Differentiation dynamics in the ventral forebrain inhibitory lineage as in (d-e). h, Cells in the joint forebrain atlas, as in Extended Data Figure 1e, colored by inferred pseudotime of astro-ependymal and oligodendrocyte (n = 1,354 cells) lineages (n = 4,496 cells). i, Expression of gene markers representative of astro-ependymal (top) and oligodendrocyte (bottom) differentiation, shown in cells from the respective lineages.
Extended Data Fig. 4. Mapping of bulk transcriptomes onto developmental populations.
Best matching signatures using ssGSEA for all samples within each tumor type. For ATRT tumors, populations from a recently published timecourse of the developing mouse cerebellum38 spanning E10-P14 were also included in the projections; cerebellar signatures are denoted by ‘CB’. HGNET-BCOR, high-grade neuroepithelial tumor with BCOR alteration; EBT, embryonal brain tumor; HGG-IDH, IDH-mutant high-grade gliomas; HGG-WT, High-grade gliomas wild-type for histone and IDH1/2 mutations; HF, signature from published scRNAseq human fetal brain dataset24 containing human cerebral cortex specimens spanning 5–37 PCW. Bars are colored by cluster from which signatures were derived.
Extended Data Fig. 5. Identification of pontine mossy fiber neurons and lower rhombic lip precursors, and analysis of WNT medulloblastoma scRNAseq.
a, Mossy fiber neuron cluster (n = 198 cells) highlighted in the tSNE embedding of the P0 mouse pons. b, Left: expression of Olig3, a molecular marker of the lower rhombic lip (LRL), the progenitor domain that gives rise to pre-cerebellar neuron populations including mossy fiber (MF) and climbing fiber (CF) neurons12,71,72. Right: expression of Atoh1, which identifies the MF lineage in the LRL72,73, and is required for their development74. c, Violin plots quantifying expression of genes used to determine cluster identity in the MF neuron population (n = 198 cells). Left: Pax6, Zic1 and Olig3, markers of LRL progenitors that give rise to MF neurons, identified by lineage tracing and loss of function experiments12,72,73,75. Pax6 regulates cell fate allocation in the LRL73, and Zic1 regulates MF neuron positioning and projections in the developing pons75. Middle: Atoh1, a marker of MF lineage in the LRL72,73,74. Pcsk9, a marker of the pontine nucleus, a prominent structure formed exclusively by MF neurons76. Barhl1 is required for the formation of MF nuclei, and is expressed in RL-derivatives except for the inferior olivary nucleus (ION, the structure formed by CF neurons, and the source of climbing fibers to the cerebellum)77. Right: Genes marking the climbing fiber neuron lineage72, which also originates from LRL precursors, are absent in the MF population, resolving the cluster identity (Ptf1a, Neurog1/Ngn1 and Ascl1/Mash1). Foxd3 is a marker of the mature ION78. Brn3a, which marks the ION throughout its maturation78, is undetected. Violin plots are generated as in Figure 7. d-e, PCA of re-clustered pontine progenitors as in Figure 2a, with cluster containing LRL precursors highlighted (d) (n = 393 cells), or cells colored by expression of selected gene markers for LRL precursors (e). Expression of each gene was normalized to a [0, 1] scale for visualization. f, In situ hybridization of selected markers in the E13.5 mouse from the Allen Brain Atlas illustrating expression patterns in the LRL. g, Expression of ZIC1, CTNNB1 and OTX2, mossy fiber neuron marker genes (BARHL1, PCSK9), and climbing fiber neuron marker genes (BRN3A, ASCL1) in the tSNE embedding of the WNT-MB-1 patient tumor sample (n = 3,975 cells). Expression of each gene was normalized to a [0, 1] scale for visualization. Similar expression patterns were observed in the other two patient samples. h, Inferred pseudotime reconstruction from the malignant cells, represented in the tSNE embedding of the WNT-MB-1 patient tumor sample. i-j, Characterization of two patient WNT medulloblastoma scRNAseq samples as in Figure 4. Top left: tSNE and clustering, with non-malignant clusters labeled, and number of cells indicated in parentheses. Top right: expression of marker genes of malignant tumor clusters. Bottom: cells in malignant tumor clusters colored by pseudotime inferred through trajectory analysis.
Extended Data Fig. 6. Profiling of TTYH1 expression and characterization of patient ETMR scRNA-seq and snRNA-seq samples.
a, Heatmaps of TTYH1 expression across developing mouse and human brain samples in this study. Expression was normalized to a [0, 1] scale within each sample for visualization. Number of cells in each cluster is indicated in Supplementary Table 2a. b, Expression of TTYH1 in the developing human brain in datasets from three published scRNA-seq studies which profiled 11 human cerebral cortex specimens spanning 5–37 PCW24 (left, n = 4,261 cells); progenitor and neuron cell populations from 12 and 13 PCW human neocortex specimens44 (top right, n = 226 cells); and human pluripotent stem-cell derived forebrain organoids45 (bottom right, n = 11,838 cells). RG, radial glia; oRG, outer radial glia; vRG, ventricular radial glia; IPC, intermediate progenitor cells; IN, inhibitory neuron; EN, excitatory neuron. Boxplots: center line, median; box limits, upper and lower quartiles; whiskers, 1.5x interquartile range; points, outliers. c, Deconvolution (CIBERSORT) analysis of bulk ETMR samples (n = 14), using a panel of signatures from the cortical neuronal lineage. d-f, tSNE embedding of ETMR1 tumor sample (n = 5,427 cells), with cells colored by inferred pseudotime trajectory (d), by best matching cell type when tumor cells were projected onto the developmental atlas using ssGSEA (e), or by expression of selected marker and diagnostic genes (f). Expression of each gene was normalized to a [0, 1] scale for visualization. g-h, Characterization of two additional patient ETMR samples profiled using single-nuclei RNA-sequencing as in Figure 6. Top left: tSNE embedding with cells colored by clustering, and number of cells indicated in parentheses. Bottom left: inferred pseudotime. Right: bubble plots of neuronal lineage markers in tumor clusters.
Extended Data Fig. 7. Characterization and mapping of ATRT patient samples.
a, Deconvolution analysis (CIBERSORT) of bulk ATRT patient samples (n = 11), using mouse developmental populations. b, Top 25 leading edge genes driving ssGSEA enrichment of F-e15 Dorsal RGC signature in bulk ATRT samples (n = 11), and other tumor types of focus (ETMR: n =14, WNT-MB: n = 10, HGG: n = 12). Genes which are specific to the leading edge of ATRT are indicated with boxes; all other genes appear in the leading edge for this signature in other tumors. Boxplots: center line, median; box limits, upper and lower quartiles; whiskers, 1.5x interquartile range. c, Best matching developmental populations for bulk tumors by ssGSEA, when the true lineage of origin (glial populations for HGG, and neuronal populations for WNT MB and ETMR) is removed, indicating that most tumors map non-specifically to RGCs in the absence of the lineage of origin. d-e, scRNAseq profiling of two additional patient ATRT samples as in Figure 7. Left: tSNE visualization and clustering, with non-malignant clusters labeled, and number of cells indicated in parentheses. Right panels: mean expression of inferred ATRT subtype, microglia, and cytotoxic T-cell gene signatures, and expression of VIM, represented in tSNE embedding (top) and violin plots generated as in Figure 7 (bottom). Expression of each gene set was normalized to a [0, 1] scale for visualization in tSNE embeddings. f-g, snRNAseq profiling of two additional patient ATRT samples as in (d-e).
Extended Data Fig. 8. Differentiation potential is impaired in H3K27M cells.
a-b, Characterization of the 19 PCW human brainstem astrocytes (n = 258 cells), a predominant best match to H3K27M HGG. a, By PCA, the first principal component separates the two populations. b, Heatmap of expression of genes most strongly positively and negatively correlated with PC1. c, Western blot of K27M-mutant H3 protein and total H3 protein confirms presence of mutation and knock-out in each replicate of K27M and KO lines respectively. d-g, Analysis of bulk RNAseq data for DIPG cell lines (n = 2 independent experiments per condition, biological replicates). d, PCA plot. SCM, stem cell media; DM, differentiation media. e, Volcano plots of differential expression analysis between cells in DM vs. SCM for K27M lines (top) and KO lines (bottom). Red color highlights differentially expressed genes present in the human brainstem astrocyte 2 gene signature (left), and any brainstem or pontine astrocyte gene signature (right). P-values (two-sided Wald test) were adjusted using the Benjamini-Hochberg correction. f, Boxplots of log2 fold change of expression for genes in selected developmental signatures, between cells in DM vs. SCM for K27M lines (red) and KO (blue). Statistical significance was assessed using a two-tailed Student’s t-test (p-values: Hindbrain astrocyte: 1.46×10⁻¹³; Human astrocyte: 6.85×10⁻⁵; OPC/Oligodendrocyte: 0.14; Excit. Neuron: 0.12; ns: not significant). Boxplots: center line, median; box limits, upper and lower quartiles; whiskers, 1.5x interquartile range. g, Volcano plot of differential expression analysis between K27M and K27M-KO cell lines in DM; differential expression analysis was performed as described above. h, Representative morphology of GFAP+ cells among cell lines at 60X magnification. Experiment was repeated, and images are shown, for n = 2 biologically independent replicates per condition. i, Bubbleplot of projection of K27M-KO cell lines onto developmental atlas using ssGSEA, shown for the neuroectodermal cell types. The color of the bubbles indicates the change in ssGSEA score for each signature between cell lines in SCM and DM, while the size of the bubbles indicates the ssGSEA score in DM. Cell types are stratified into two rows based on direction of change of the score, upon differentiation. No bubbles are shown for clusters with non-specific gene signatures.
Supplementary Material
Acknowledgements
This work was supported by funding from: a Large-Scale Applied Research Project grant from Genome Quebec, Genome Canada, the Government of Canada, and the Ministère de l’Économie, de la Science et de l’Innovation du Québec, with the support of the Ontario Research Fund through funding provided by the Government of Ontario to N.J., M.D.T., C.L.K., P.B.D., G.B., J.R., L.G.; the Canadian Institutes for Health Research (CIHR grant PJT-156086 to C.L.K., and MOP-286756 and FDN-154307 to N.J.); the US National Institutes of Health (NIH grant P01-CA196539 to N.J., R01CA148699 and R01CA159859 to M.D.T.); the Canadian Cancer Society (CCSRI grant 705182), NSERC (RGPIN-2016-04911) and the Fonds de Recherche du Québec en Santé (FRQS) salary award to C.L.K.; National Sciences and Engineering Research Council (NSERC-448167-2013) and FRQS (25348) to G.B.; CFI Leaders Opportunity Fund (32557 to J.R. and 33902 to C.L.K.), Genome Canada Science Technology Innovation Centre, Compute Canada Resource Allocation Project (WST-164-AB) and Genome Canada Genome Innovation Node (244819) to J.R.; and the Fondation Charles-Bruneau. Data analyses were enabled by compute and storage resources provided by Compute Canada and Calcul Québec. N.J. is a member of the Penny Cole Laboratory and the recipient of a Chercheur Boursier, Chaire de Recherche Award from the FRQS. This work was performed within the context of the International CHildhood Astrocytoma INtegrated Genomic and Epigenomic (ICHANGE) consortium, and the Stand Up to Cancer (SU2C) Canada Cancer Stem Cell Dream Team Research Funding (SU2C-AACR-DT-19-15 to M.D.T., N.J.) and SU2C St. Baldrick’s Pediatric Dream Team Translational Research Grant (SU2C-AACR-DT1113 to M.D.T.), with funding from Genome Canada and Genome Quebec. Stand Up to Cancer is a program of the Entertainment Industry Foundation administered by the American Association for Cancer Research. M.D.T. is supported by The Pediatric Brain Tumour Foundation, The Canadian Institutes of Health Research, The Cure Search Foundation, b.r.a.i.n.child, Meagan’s Walk, SWIFTY Foundation, Genome Canada, Genome BC, Genome Quebec, the Ontario Research Fund, Worldwide Cancer Research, V-Foundation for Cancer Research, Cancer Research UK Brain Tumour Award, Canadian Cancer Society Research Institute Impact grant and the Garron Family Chair in Childhood Cancer Research at the Hospital for Sick Children and the University of Toronto. S.J. is supported by a fellowship from CIHR. A.B.C. is supported by a fellowship from FRQS and TD/LDI. N.D.J. is a recipient of a fellowship from FRQS and RMGA. M.K.M. is funded by a CIHR Banting postdoctoral fellowship. We thank Koren Mann, Shalom Spira and Javier Di Noia for critical reading of manuscript, and Stacey Krumholtz for graphical editing of figures. We are especially grateful for the generous philanthropic donations of the Fondation Charles-Bruneau, and the Kat D-DIPG, Poppies for Irina and We Love You Connie Foundations.
Footnotes
Competing Interests Statement
The authors declare no competing interests
References
- 1.Kieran MW, Walker D, Frappaz D & Prados M Brain tumors: from childhood through adolescence into adulthood. J Clin Oncol 28, 4783–4789 (2010). [DOI] [PubMed] [Google Scholar]
- 2.Fontebasso AM et al. Epigenetic dysregulation: a novel pathway of oncogenesis in pediatric brain tumors. Acta neuropathologica 128, 615–627 (2014). [DOI] [PMC free article] [PubMed] [Google Scholar]
- 3.Jacob K et al. Genetic aberrations leading to MAPK pathway activation mediate oncogene-induced senescence in sporadic pilocytic astrocytomas. Clin. Cancer Res. 17, 4650–4660 (2011). [DOI] [PubMed] [Google Scholar]
- 4.Johann PD et al. Atypical teratoid/rhabdoid tumors are comprised of three epigenetic subgroups with distinct enhancer landscapes. Cancer Cell 29, 379–393 (2016). [DOI] [PubMed] [Google Scholar]
- 5.Northcott PA et al. The whole-genome landscape of medulloblastoma subtypes. Nature 547, 311–317 (2017). [DOI] [PMC free article] [PubMed] [Google Scholar]
- 6.Sturm D et al. Paediatric and adult glioblastoma: multiform (epi)genomic culprits emerge. Nat. Rev. Cancer 14, 92–107 (2014). [DOI] [PMC free article] [PubMed] [Google Scholar]
- 7.Sturm D et al. New brain tumor entities emerge from molecular classification of CNS-PNETs. Cell 164, 1060–1072 (2016). [DOI] [PMC free article] [PubMed] [Google Scholar]
- 8.Li M et al. Frequent amplification of a chr19q13.41 microRNA polycistron in aggressive primitive neuroectodermal brain tumors. Cancer Cell 16, 533–546 (2009). [DOI] [PMC free article] [PubMed] [Google Scholar]
- 9.Kleinman CL et al. Fusion of TTYH1 with the C19MC microRNA cluster drives expression of a brain-specific DNMT3B isoform in the embryonal brain tumor ETMR. Nat. Genet 46, 39–44 (2014). [DOI] [PubMed] [Google Scholar]
- 10.Kool M et al. Molecular subgroups of medulloblastoma: an international meta-analysis of transcriptome, genetic aberrations, and clinical data of WNT, SHH, Group 3, and Group 4 medulloblastomas. Acta Neuropathologica 123, 473–484 (2012). [DOI] [PMC free article] [PubMed] [Google Scholar]
- 11.Northcott PA, Korshunov A, Pfister SM & Taylor MD The clinical implications of medulloblastoma subgroups. Nat. Rev. Neurol 8, 340–351 (2012). [DOI] [PubMed] [Google Scholar]
- 12.Gibson P et al. Subtypes of medulloblastoma have distinct developmental origins. Nature 468, 1095–1099 (2010). [DOI] [PMC free article] [PubMed] [Google Scholar]
- 13.Fontebasso AM et al. Recurrent somatic mutations in ACVR1 in pediatric midline high-grade astrocytoma. Nat. Genet 46, 462–466 (2014). [DOI] [PMC free article] [PubMed] [Google Scholar]
- 14.Khuong-Quang DA et al. K27M mutation in histone H3.3 defines clinically and biologically distinct subgroups of pediatric diffuse intrinsic pontine gliomas. Acta Neuropathologica 124, 439–447 (2012). [DOI] [PMC free article] [PubMed] [Google Scholar]
- 15.Wu G et al. Somatic histone H3 alterations in pediatric diffuse intrinsic pontine gliomas and non-brainstem glioblastomas. Nat. Genet 44, 251–253 (2012). [DOI] [PMC free article] [PubMed] [Google Scholar]
- 16.Mackay A et al. Integrated molecular meta-analysis of 1,000 pediatric high-grade and diffuse intrinsic pontine glioma. Cancer Cell 32, 520–537 (2017). [DOI] [PMC free article] [PubMed] [Google Scholar]
- 17.Sturm D et al. Hotspot mutations in H3F3A and IDH1 define distinct epigenetic and biological subgroups of glioblastoma. Cancer Cell 22, 425–437 (2012). [DOI] [PubMed] [Google Scholar]
- 18.Wu G et al. The genomic landscape of diffuse intrinsic pontine glioma and pediatric non-brainstem high-grade glioma. Nat. Genet 46, 444–450 (2014). [DOI] [PMC free article] [PubMed] [Google Scholar]
- 19.Schwartzentruber J et al. Driver mutations in histone H3.3 and chromatin remodelling genes in paediatric glioblastoma. Nature 482, 226–231 (2012). [DOI] [PubMed] [Google Scholar]
- 20.Versteege I et al. Truncating mutations of hSNF5/INI1 in aggressive paediatric cancer. Nature 394, 203–206 (1998). [DOI] [PubMed] [Google Scholar]
- 21.Torchia J et al. Integrated (epi)-genomic analyses identify subgroup-specific therapeutic targets in CNS rhabdoid tumors. Cancer Cell 30, 891–908 (2016). [DOI] [PMC free article] [PubMed] [Google Scholar]
- 22.Chun HE et al. Genome-wide profiles of extra-cranial malignant rhabdoid tumors reveal heterogeneity and dysregulated developmental pathways. Cancer Cell 29, 394–406 (2016). [DOI] [PMC free article] [PubMed] [Google Scholar]
- 23.Fan X et al. Spatial transcriptomic survey of human embryonic cerebral cortex by single-cell RNA-seq analysis. Cell Res. 28, 730–745 (2018). [DOI] [PMC free article] [PubMed] [Google Scholar]
- 24.Nowakowski TJ et al. Spatiotemporal gene expression trajectories reveal developmental hierarchies of the human cortex. Science 358, 1318–1323 (2017). [DOI] [PMC free article] [PubMed] [Google Scholar]
- 25.Pollen AA et al. Molecular identity of human outer radial glia during cortical development. Cell 163, 55–67 (2015). [DOI] [PMC free article] [PubMed] [Google Scholar]
- 26.Zhong S et al. A single-cell RNA-seq survey of the developmental landscape of the human prefrontal cortex. Nature 555, 524–528 (2018). [DOI] [PubMed] [Google Scholar]
- 27.Mayer C et al. Developmental diversification of cortical inhibitory interneurons. Nature 555, 457–462 (2018). [DOI] [PMC free article] [PubMed] [Google Scholar]
- 28.Mi D et al. Early emergence of cortical interneuron diversity in the mouse embryo. Science 360, 81–85 (2018). [DOI] [PMC free article] [PubMed] [Google Scholar]
- 29.Yuzwa SA et al. Developmental emergence of adult neural stem cells as revealed by single-cell transcriptional profiling. Cell Rep. 21, 3970–3986 (2017). [DOI] [PubMed] [Google Scholar]
- 30.Butler A, Hoffman P, Smibert P, Papalexi E & Satija R Integrating single-cell transcriptomic data across different conditions, technologies, and species. Nat. Biotechnol 36, 411–420 (2018). [DOI] [PMC free article] [PubMed] [Google Scholar]
- 31.Stuart T et al. Comprehensive integration of single-cell data. Cell 177, 1888–1902 (2019). [DOI] [PMC free article] [PubMed] [Google Scholar]
- 32.Zhang Y et al. An RNA-sequencing transcriptome and splicing database of glia, neurons, and vascular cells of the cerebral cortex. J. Neurosci 34, 11929–11947 (2014). [DOI] [PMC free article] [PubMed] [Google Scholar]
- 33.Zeisel A et al. Molecular architecture of the mouse nervous system. Cell 174, 999–1014 (2018). [DOI] [PMC free article] [PubMed] [Google Scholar]
- 34.Aibar S et al. SCENIC: single-cell regulatory network inference and clustering. Nat. Methods 14, 1083–1086 (2017). [DOI] [PMC free article] [PubMed] [Google Scholar]
- 35.Qiu X et al. Single-cell mRNA quantification and differential analysis with Census. Nat. Methods 14, 309–315 (2017). [DOI] [PMC free article] [PubMed] [Google Scholar]
- 36.Qiu X et al. Reversed graph embedding resolves complex single-cell trajectories. Nat. Methods 14, 979–982 (2017). [DOI] [PMC free article] [PubMed] [Google Scholar]
- 37.Barbie DA et al. Systematic RNA interference reveals that oncogenic KRAS-driven cancers require TBK1. Nature 462, 108–112 (2009). [DOI] [PMC free article] [PubMed] [Google Scholar]
- 38.Vladoiu MC et al. Childhood cerebellar tumours mirror conserved fetal transcriptional programs. Nature 572, 67–73 (2019). [DOI] [PMC free article] [PubMed] [Google Scholar]
- 39.Lin CY et al. Active medulloblastoma enhancers reveal subgroup-specific cellular origins. Nature 530, 57–62 (2016). [DOI] [PMC free article] [PubMed] [Google Scholar]
- 40.Clifford SC et al. Wnt/Wingless pathway activation and chromosome 6 loss characterize a distinct molecular sub-group of medulloblastomas associated with a favorable prognosis. Cell Cycle 5, 2666–2670 (2006). [DOI] [PubMed] [Google Scholar]
- 41.Valdora F et al. Epigenetic silencing of DKK3 in medulloblastoma. Int. J. Mol. Sci 14, 7492–7505 (2013). [DOI] [PMC free article] [PubMed] [Google Scholar]
- 42.Korshunov A et al. Embryonal tumor with abundant neuropil and true rosettes (ETANTR), ependymoblastoma, and medulloepithelioma share molecular similarity and comprise a single clinicopathological entity. Acta Neuropathologica 128, 279–289 (2014). [DOI] [PMC free article] [PubMed] [Google Scholar]
- 43.Neumann JE et al. A mouse model for embryonal tumors with multilayered rosettes uncovers the therapeutic potential of Sonic-hedgehog inhibitors. Nat. Med 23, 1191–1202 (2017). [DOI] [PubMed] [Google Scholar]
- 44.Camp JG et al. Human cerebral organoids recapitulate gene expression programs of fetal neocortex development. Proc. Natl. Acad. Sci. USA 112, 15672–15677 (2015). [DOI] [PMC free article] [PubMed] [Google Scholar]
- 45.Birey F et al. Assembly of functionally integrated human forebrain spheroids. Nature 545, 54–59 (2017). [DOI] [PMC free article] [PubMed] [Google Scholar]
- 46.Pijuan-Sala B et al. A single-cell molecular map of mouse gastrulation and early organogenesis. Nature 566, 490–495 (2019). [DOI] [PMC free article] [PubMed] [Google Scholar]
- 47.Han ZY et al. The occurrence of intracranial rhabdoid tumours in mice depends on temporal control of Smarcb1 inactivation. Nat. Commun 7, 10421 (2016). [DOI] [PMC free article] [PubMed] [Google Scholar]
- 48.Lu JQ, Wilson BA, Yong VW, Pugh J & Mehta V Immune cell infiltrates in atypical teratoid/rhabdoid tumors. Can. J. Neurol. Sci 39, 605–612 (2012). [DOI] [PubMed] [Google Scholar]
- 49.Funato K, Major T, Lewis PW, Allis CD & Tabar V Use of human embryonic stem cells to model pediatric gliomas with H3.3K27M histone mutation. Science 346, 1529–1533 (2014). [DOI] [PMC free article] [PubMed] [Google Scholar]
- 50.Pathania M et al. H3.3(K27M) cooperates with Trp53 loss and PDGFRA gain in mouse embryonic neural progenitor cells to induce invasive high-grade gliomas. Cancer Cell 32, 684–700.e689 (2017). [DOI] [PMC free article] [PubMed] [Google Scholar]
- 51.Monje M et al. Hedgehog-responsive candidate cell of origin for diffuse intrinsic pontine glioma. Proc. Natl. Acad. Sci. USA 108, 4453–4458 (2011). [DOI] [PMC free article] [PubMed] [Google Scholar]
- 52.Filbin MG et al. Developmental and oncogenic programs in H3K27M gliomas dissected by single-cell RNA-seq. Science 360, 331–335 (2018). [DOI] [PMC free article] [PubMed] [Google Scholar]
- 53.Krug B et al. Pervasive H3K27 acetylation leads to ERV expression and a therapeutic vulnerability in H3K27M Gliomas. Cancer Cell 35, 782–797.e788 (2019). [DOI] [PMC free article] [PubMed] [Google Scholar]
- 54.Harutyunyan AS et al. H3K27M induces defective chromatin spread of PRC2-mediated repressive H3K27me2/me3 and is essential for glioma tumorigenesis. Nat. Commun 10, 1262 (2019). [DOI] [PMC free article] [PubMed] [Google Scholar]
- 55.Vitte J, Gao F, Coppola G, Judkins AR & Giovannini M Timing of Smarcb1 and Nf2 inactivation determines schwannoma versus rhabdoid tumor development. Nat. Commun 8, 300 (2017). [DOI] [PMC free article] [PubMed] [Google Scholar]
Methods-only references
- 56.Nguyen QH et al. Profiling human breast epithelial cells using single cell RNA sequencing identifies cell diversity. Nat. Commun 9, 2028 (2018). [DOI] [PMC free article] [PubMed] [Google Scholar]
- 57.Nagy C et al. Single-nucleus RNA sequencing shows convergent evidence from different cell types for altered synaptic plasticity in major depressive disorder. bioRxiv, 384479, doi: 10.1101/384479 (2019). [DOI] [Google Scholar]
- 58.Morrissy AS et al. Divergent clonal selection dominates medulloblastoma at recurrence. Nature 529, 351–357 (2016). [DOI] [PMC free article] [PubMed] [Google Scholar]
- 59.Bolger AM, Lohse M & Usadel B Trimmomatic: a flexible trimmer for Illumina sequence data. Bioinformatics 30, 2114–2120 (2014). [DOI] [PMC free article] [PubMed] [Google Scholar]
- 60.Li H et al. The Sequence Alignment/Map format and SAMtools. Bioinformatics 25, 2078–2079 (2009). [DOI] [PMC free article] [PubMed] [Google Scholar]
- 61.Quinlan AR & Hall IM BEDTools: a flexible suite of utilities for comparing genomic features. Bioinformatics 26, 841–842 (2010). [DOI] [PMC free article] [PubMed] [Google Scholar]
- 62.Dobin A et al. STAR: ultrafast universal RNA-seq aligner. Bioinformatics 29, 15–21 (2013). [DOI] [PMC free article] [PubMed] [Google Scholar]
- 63.Liao Y, Smyth GK & Shi W featureCounts: an efficient general purpose program for assigning sequence reads to genomic features. Bioinformatics 30, 923–930 (2014). [DOI] [PubMed] [Google Scholar]
- 64.Love MI, Huber W & Anders S Moderated estimation of fold change and dispersion for RNA-seq data with DESeq2. Genome Biol.15, 550 (2014). [DOI] [PMC free article] [PubMed] [Google Scholar]
- 65.Hu H et al. AnimalTFDB 3.0: a comprehensive resource for annotation and prediction of animal transcription factors. Nucleic Acids Res. 47, D33–D38 (2019). [DOI] [PMC free article] [PubMed] [Google Scholar]
- 66.Trapnell C et al. The dynamics and regulators of cell fate decisions are revealed by pseudotemporal ordering of single cells. Nat. Biotechnol 32, 381–386 (2014). [DOI] [PMC free article] [PubMed] [Google Scholar]
- 67.Hanzelmann S, Castelo R & Guinney J GSVA: gene set variation analysis for microarray and RNA-seq data. BMC Bioinformatics 14, 7 (2013). [DOI] [PMC free article] [PubMed] [Google Scholar]
- 68.Kinsella RJ et al. Ensembl BioMarts: a hub for data retrieval across taxonomic space. Database (Oxford) 2011, bar030 (2011). [DOI] [PMC free article] [PubMed] [Google Scholar]
- 69.Subramanian A et al. Gene set enrichment analysis: a knowledge-based approach for interpreting genome-wide expression profiles. Proc. Natl. Acad. Sci. USA 102, 15545–15550 (2005). [DOI] [PMC free article] [PubMed] [Google Scholar]
- 70.Newman AM et al. Robust enumeration of cell subsets from tissue expression profiles. Nat. Methods 12, 453 (2015). [DOI] [PMC free article] [PubMed] [Google Scholar]
- 71.Storm R et al. The bHLH transcription factor Olig3 marks the dorsal neuroepithelium of the hindbrain and is essential for the development of brainstem nuclei. Development 136, 295–305 (2009). [DOI] [PubMed] [Google Scholar]
- 72.Ray RS & Dymecki SM Rautenlippe Redux -- toward a unified view of the precerebellar rhombic lip. Curr. Opin. Cell Biol 21, 741–747 (2009). [DOI] [PMC free article] [PubMed] [Google Scholar]
- 73.Landsberg RL et al. Hindbrain rhombic lip is comprised of discrete progenitor cell populations allocated by Pax6. Neuron 48, 933–947 (2005). [DOI] [PubMed] [Google Scholar]
- 74.Wang VY, Rose MF & Zoghbi HY Math1 expression redefines the rhombic lip derivatives and reveals novel lineages within the brainstem and cerebellum. Neuron 48, 31–43 (2005). [DOI] [PubMed] [Google Scholar]
- 75.Dipietrantonio HJ & Dymecki SM Zic1 levels regulate mossy fiber neuron position and axon laterality choice in the ventral brain stem. Neuroscience 162, 560–573 (2009). [DOI] [PMC free article] [PubMed] [Google Scholar]
- 76.Morales D & Hatten ME Molecular markers of neuronal progenitors in the embryonic cerebellar anlage. J. Neurosci 26, 12226–12236 (2006). [DOI] [PMC free article] [PubMed] [Google Scholar]
- 77.Li S, Qiu F, Xu A, Price SM & Xiang M Barhl1 regulates migration and survival of cerebellar granule cells by controlling expression of the neurotrophin-3 gene. J. Neurosci 24, 3104–3114 (2004). [DOI] [PMC free article] [PubMed] [Google Scholar]
- 78.Hidalgo-Sanchez M, Backer S, Puelles L & Bloch-Gallego E Origin and plasticity of the subdivisions of the inferior olivary complex. Dev. Biol 371, 215–226 (2012). [DOI] [PubMed] [Google Scholar]
Associated Data
This section collects any data citations, data availability statements, or supplementary materials included in this article.
Supplementary Materials
Data Availability Statement
Bulk and single-cell RNA sequencing data for normal human and patient tumor samples have been deposited in the European Genome-Phenome Archive under accession number EGAS00001003368. Single-cell RNA sequencing data for normal mouse samples have been deposited in NCBI GEO under accession number GSE133531. Bulk RNA sequencing data for human tumor derived cell lines have been previously deposited in NCBI GEO and are available under accession number GSE117446.


