

Abstract
Parkinson's disease (PD) is neurodegenerative movement disorder characterized by degeneration of midbrain‐type dopamine (mDA) neurons in the substantia nigra (SN). The RNA‐binding protein Lin28 plays a role in neuronal stem cell development and neuronal differentiation. In this study, we reveal that Lin28 conditional knockout (cKO) mice show degeneration of mDA neurons in the SN, as well as PD‐related behavioral deficits. We identify a loss‐of‐function variant of LIN28A (R192G substitution) in two early‐onset PD patients. Using an isogenic human embryonic stem cell (hESC)/human induced pluripotent stem cell (hiPSC)‐based disease model, we find that the Lin28 R192G variant leads to developmental defects and PD‐related phenotypes in mDA neuronal cells that can be rescued by expression of wild‐type Lin28A. Cell transplantation experiments in PD model rats show that correction of the LIN28A variant in the donor patient (pt)‐hiPSCs leads to improved behavioral phenotypes. Our data link LIN28A to PD pathogenesis and suggest future personalized medicine targeting this variant in patients.
Keywords: human disease model, human pluripotent stem cells, Lin28, loss‐of‐function mutation, Parkinson's disease
Subject Categories: Molecular Biology of Disease, Neuroscience
The RNA‐binding protein Lin28 regulates midbrain dopaminergic neuron development and its loss of function is associated with Parkinson's disease in mice and human patients.

Introduction
Parkinson's disease (PD) is an insidious movement disorder characterized by degeneration of midbrain‐type dopamine (mDA) neurons in the substantia nigra (SN) of the midbrain. Although genome‐wide association studies (GWAS) and analyses of familial forms of PD have contributed to the identification of genetic backgrounds and risk factors for this disorder, these account for a minority of disease cases (< 5 and < 30% of sporadic and familial PD patients, respectively) (Klein & Westenberger, 2012). To extend our understanding for PD etiologies and thus to develop efficient therapeutic tools, it is also valuable to analyze rare gene mutations that occur in single patients with PD, especially if possible associations between gene dysfunctions and PD pathogenesis have been suggested by pre‐existing studies in vitro and/or in vivo using animal models. Recent progress in stem cell research and gene‐editing techniques enable analyses using human disease modeling with patient‐derived cells and the feasible editing of affected genes.
PD is classically regarded as an age‐associated disorder. However, juvenile‐ or early‐onset PD cases are not easily explained by age‐related processes. Many PD‐associated genes (PARK) such as SCNA, PINK1, LRRK2, and VPS35 have been implicated in playing roles in neuronal developmental processes (reviewed in Le Grand et al, 2015). Consistently, a recent study using genome‐wide transcriptome analysis has shown RBFOX1, a gene linked to neurodevelopmental diseases, is the most consistently dysregulated gene in PD neurons harboring those PARK gene mutations (Lin et al, 2016). In addition, studies have demonstrated that developmental/perinatal exposure of pesticides or brain insults lead to the dysfunction of the midbrain DA neuron system in adult life, which ultimately causes the development of PD (Thiruchelvam et al, 2002; Richardson et al, 2006; Froudist‐Walsh et al, 2017). Thus, similar to Huntington's disease being regarded as a neurodevelopmental disorder (Humbert, 2010; Brennand, 2016), the involvement of developmental defects is suspected as a cause of PD, especially in young age‐onset PD cases (Schwamborn, 2018).
Lin28a (and its paralog Lin28b in vertebrates) is a highly conserved RNA‐binding protein, which is mainly expressed and acts during early embryonic and fetal development (Shyh‐Chang & Daley, 2013). Lin28a has been reported to function in neural stem/precursor cell (NSC) self‐renewal and neuronal differentiation in the developing brain (Balzer et al, 2010; Patterson et al, 2014; Yang et al, 2015). Forced re‐entry of this RNA‐binding protein expression in adult tissues enhances tissue repair (Shyh‐Chang et al, 2013), a critical molecular event of which is the generation of new tissue‐specific cells from stem cells of the tissues. Consistent with the Lin28a roles in stem cells during development and tissue repair, we have recently demonstrated that NSCs cultured from embryonic ventral midbrain (VM) lose their mDA neurogenic potential along with the loss of Lin28a expression (Rhee et al, 2016). In addition, mDA neurons yielded without Lin28a are more vulnerable in toxic environments, all of which are recovered by forced expression of Lin28a in the NSCs, indicating Lin28a functions are required to develop healthy mDA neurons.
In this study, to assess whether the loss of Lin28 function during brain development could cause PD, we analyzed the conditional Lin28 deletion in mice. In addition, we detected a loss‐of‐function variant of LIN28A from two early‐onset PD patients and assessed the pathogenic contribution of this variant to the patients’ disease by analyzing isogenic human embryonic stem cells (ESCs) and human induced pluripotent stem cells (hiPSCs) derived from the patients (pt‐hiPSCs), in which the variant was inserted or corrected using CRISPR‐CAS9‐mediated gene editing. Lastly, we show a transplantation study using patient‐derived cells in a PD animal model, which suggests a necessity for correction of the variant gene in future personalized cell therapy targeting these patients.
Results
Reduced mDA neurons along with pathologic axonal sprouting in Nestin‐Cre/Lin28 cKO mice
Our previous in vitro study (Rhee et al, 2016) suggested that Lin28a expression/function in NSCs cultured from embryonic VM tissues is critical for the generation of healthy mDA neurons. These findings prompted us to assume that a Lin28 deletion/dysfunction in NSCs during development causes a developmental defect in generating mDA neurons resistant against toxic insults and thus ultimately leads to PD‐like behaviors with mDA neuronal loss in adult life. To prove the hypothesis, we generated double Lin28a/b conditional knockout (cKO) mice (because Lin28a and Lin28b can compensate for the loss of each other), in which these genes are knocked out in NSCs, by crossing Lin28a/b flox/flox mice with Nestin‐Cre heterozygous transgenic mice.
Consistent with Lin28 function in NSC self‐renewal in developing cortices (Yang et al, 2015), the brain size of Lin28 cKO mice after birth was smaller than their wild‐type (WT) littermates by 8% (Appendix Fig S1A). Along with smaller brain size, previous studies have shown that the fractions of cells that had exited the cell cycles (BrdU+/Ki67−) were greater, with a significant reduction of total proliferating cells (BrdU+/Ki67+) and without the change in TUNEL+ cell numbers in the ventricular/subventricular zone of Lin28 KO brains, indicating that reduced brain size in Lin28 KO mice is caused by early cell cycle exit without alteration of cell death (Yang et al, 2015; Herrlinger et al, 2019). In the VM during early development (embryonic day 10.5, E10.5), mRNA expressions of the early developmental genes such as Otx2 (rostral brain patterning) and PLZF (primitive neuroepithelial cell formation) were not altered in Lin28a cKO mice (Appendix Fig S1B). By contrast, expression of the proneural bHLH factors neurogenin 2 (Ngn2) and Mash1, whose expression commences upon neuronal differentiation, was greater in Lin28a/b cKO mice at E10.5–11.5 (Appendix Fig S1B). Afterward, in later embryonic days (E12.5), the proneural factor expression was significantly lower in the cKO VM than in that of their WT littermates (Appendix Fig S1C and D), consistent with the previous finding of premature neuronal differentiation by Lin28a/b deletion. Since NSC differentiation concurs with cell cycle exit, the premature neuronal differentiation and early cell cycle exit observed are likely to be closely linked. Midbrain DA neurons arise from floorplate‐like progenitor cells expressing Foxa2 and Lmx1a in the developing midbrain (Ono et al, 2007; Bonilla et al, 2008). We have previously shown that Lin28a positively regulates the mDA‐specific developmental gene expressions (Rhee et al, 2016). Consistently, expression of the VM floor plate markers (especially, Lmx1a) was greatly reduced in the Lin28a/b cKO VMs, which was accompanied by a decrease in Nurr1 expression, a transcription factor critical for DA phenotype gene expression (Fig 1A–C). Accordingly, the number of mDA neurons (tyrosine hydroxylase‐positive; TH+) generated in the cKO VM was 76% of the WT littermates at embryonic stage (Fig 1D). Collectively, these findings indicate that Lin28 KO during brain development causes premature cell cycle exit and differentiation, defective mDA neurogenesis, and reduced expression of the critical mDA developmental genes. The number of DA neurons in the SN of adult cKO mice was also lower than the WT counterparts, and the reduction was more severe at old ages [(% reduction compared to the WT values: 14% at young age (2–7 months) versus 22% at old age (14–15 months)] (Fig 1E).
Figure 1. Developmental defects associated with the pathogenesis of Parkinson's disease (PD) in Nestin‐Cre/Lin28a/b conditional knockout (cKO) mice.

-
A–CDefects in midbrain‐type dopamine (mDA) neuron‐specific developmental factor expressions in the ventral midbrain (VM) of Lin28a/b cKO embryos. Embryonic VM sections from 3 WT and cKO animals each were immunofluorescent stained for the midbrain‐specific markers in parallel, and mean fluorescent intensities (MFI) were measured. n = 20 cells for each group. ***P < 0.0001, t‐test.
-
D, EReduced mDA neurons in the embryonic VM (E12.5) and adult SN at 2–7 months (young age) and at 14–18 months (old age) of the Lin28a/b cKO mice. *P < 0.05, **P < 0.005, ***P < 0.0001, t‐test. n = 4 each wild‐type (WT) and cKO embryos, and 9 (WT) and 8 (cKO) in adult mice. Scale bars, 100 μm.
-
F, GEnhanced DA transporter (DAT)+ and TH+ fiber intensities of Lin28a/b cKO adult mice (age: 4–7 months). Striatal sections of WT and cKO mice (3 animals for each group) were subjected to immunofluorescent staining against DAT and TH in parallel, and MFI was measured from 101 microscopic fields of dorsolateral striatum. Scale bars, 200 μm. ***P < 0.0001, t‐test.
-
HDA uptakes assessed by nanoScanPET/MRI analysis using [18F]FP‐CIT. Arrows indicate substantia nigra. n = 9 (WT), 8 (cKO). *P < 0.05, ***P < 0.001, t‐test.
-
I–MEnhanced susceptibility of Lin28a/b cKO mice to the parkinsonian toxin MPTP. WT and cKO mice were injected with MPTP (20 mg/kg, i.p) for 5 days, and behaviors of the animals were assessed for 1 month after the MPTP injection (I–K). The mouse brains at 1 month after initial MPTP exposure were subjected to immunohistochemical analyses for TH+ mDA neuron counts at SN (L) and DAT MFI at striatum (M). Dotted line denotes corticostriatal boundary (M). n = 8–13 (WT), 5–9 (cKO). *P < 0.05, **P < 0.01, ***P < 0.0001, t‐test. Scale bars, 200 μm.
This decrease of mDA neuron numbers in Lin28 cKO mice did not cause behavioral deficits associated with PD at least until 15 months of age (Fig 1H–J and data now shown). However, it is of note that the DA transporter (DAT) + and (TH) + fiber intensities in striatum, the target site of mDA neurons in the SN, were significantly greater in the Lin28a/b cKO, compared to their WT littermates (Fig 1F and G), suggesting compensatory “pathologic axonal sprouting” detected in early stages of PD (reviewed in Arkadir et al, 2014). This early PD phenotype in Lin28a/b cKO mice was further confirmed by the increase of striatal DA uptake in a nanoScanPET/MRI analyses (Fig 1H). The pathologic sprouting is associated with increased mDA neuron susceptibility to toxic insults because DA neurotransmitters and DAergic neurotoxins are overloaded in mDA neurons by being transported through increased levels of DAT proteins (axon terminals) per mDA neuron. Consistently, exposure to MPTP, a parkinsonian toxin, led to a more severe loss of mDA neurons in the SN of the Lin28a/b cKO mice (Fig 1L), with reduction in TH and DAT staining at striatum, suggestive of reduced nigro‐striatal DA innervation in Lin28/b cKO than WT (Fig 1M). Ultimately, profound behavioral deficits associated with PD were manifested in Lin28a/b cKO mice by the toxin exposure (Fig 1I–K). Taken together, these findings indicate that Lin28 dysfunction during brain development contributes to the genetic risk factor of developing PD by the increased susceptibility of mDA neurons to toxic insult in the adult midbrain.
A loss‐of‐function variant of LIN28A detected in early‐onset PD patients
An author of this study (HS Lee, male) was diagnosed with typical PD at age 27 in 2003 with reduced DA uptake, especially in the left posterior putamen, in an [18F]‐FP‐CIT PET scan (Appendix Fig S2A). The patient has been being treated with levodopa since 2006. He developed “on‐off symptoms”, exhibiting resting tremor, hypokinetic movements, and rigidity during “off” periods, and only mild parkinsonian symptoms during “on” periods. To control motor complications, he has been receiving liquid levodopa–carbidopa therapy (Yang et al, 2017) since 2013 at Seoul National University Hospital (Seoul, Korea). He has had good L‐dopa responsiveness without cognitive decline or other features suggestive of Parkinson‐plus.
The patient described above has been conducting research as a biologic researcher for the last decade to find out the possible causes of his disease. Whole‐exome sequencing (WES) of DNA extracted from his blood identified 145 rare variants after filtering based on variant quality, population frequency, and functional annotation. None of these variants have been detected in genes directly associated with PD pathogenesis (PARK genes). It was very coincident to detect a variant of LIN28A [arginine changed to glycine at amino acid position 192 (aa192); LIN28A(R192G), heterozygous] (Appendix Fig S2B). We detected the same heterozygous LIN28A(R192G) mutation in one more PD patient (male, age: 63, onset age: 49), who was receiving medical treatment at Asan Medical Center, Seoul, Korea.
The arginine residue at position 192 (R192) in the LIN28A protein is located in the C‐terminal domain, distal to an RNA‐binding Zn‐knuckle domain (residues 138–176) (Appendix Fig S2B, upper). The sequence alteration from a charged polar amino acid (R) to an uncharged non‐polar amino acid (G), with a large difference between hydropathy indices (4.1), might well cause structural changes in the protein (Appendix Fig S2C) that affect LIN28A function. Coincidently, the same R‐to‐G mutation was detected in the C‐terminal region of DNAJC6 (PARK19) among juvenile‐onset PD patients (Olgiati et al, 2016).
LIN28A(R192G) is identified as a loss‐of‐function mutation in the analyses of isogenic hESCs carrying the variant
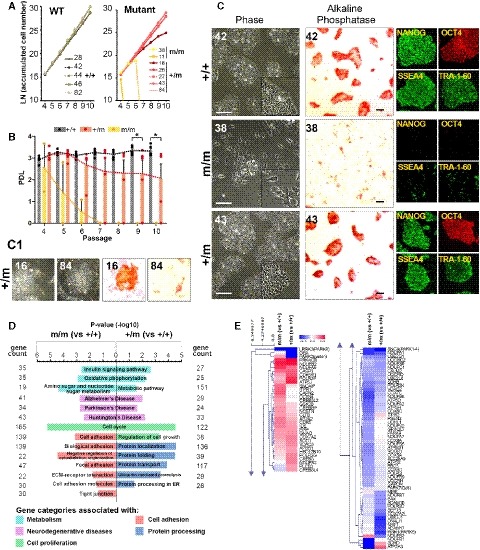
As an in vitro human disease model to assess the role of the LIN28A variant (mutation), we established a line of human embryonic stem cells (hESCs) in which the LIN28A sequence was modified to encode the R192G mutation by using a CRISPR‐CAS9 nuclease, but they were otherwise isogenic with the parent hESCs. After co‐transfecting hESCs (H9) with a single‐stranded oligodeoxynucleotide (ssODN) encoding the mutation, a plasmid encoding CAS9, and a single guide RNA (sgRNA) targeting the LIN28A mutation locus, single cell‐derived colonies were obtained and analyzed (Appendix Fig S3). Among 84 colonies obtained, 8 harbored the mono‐allelic mutation (heterozygous, +/m) and 2 contained bi‐allelic mutations (homozygous, m/m). Because of the possible variability in cellular properties even among colonies with the same genotypes, both homozygous (m/m), 5 heterozygous (+/m), and 5 unedited wild‐type (WT, +/+) colonies, picked from the same dishes in which the CRISPR‐CAS9 reactions took place, were analyzed in parallel. The WT and mutant hESC colonies were serially passaged on 96‐well (passage 1, P1) and 24‐well (P2) plates, and then 6‐cm (P3 onward) dishes. The hESCs harboring the bi‐allelic R192G mutations (m/m) were expanded up to P4 (clone number 11: c11) or P6 (c38) without conspicuous changes in cell shape or growth, but afterward, rapidly underwent replicative senescence (Fig 2A and B) and displayed morphologic changes; these cells were scattered and did not form compact clusters (Fig 2C). Furthermore, the expression of markers specific for undifferentiated hESCs was lost (Fig 2C). The heterozygous +/m mutants exhibited similar but less severe defects, and defect severity was different depending on the heterozygous cell lines and passage numbers: The heterozygous +/m mutants c16 and c84 exhibited defects from earlier cell passages (> P6), while c26, c27, and c43 exhibited a cell growth and cell shape that was indistinguishable from those of WT hESCs, at least up to P9 (Fig 2B and C). Considering that LIN28A functions to maintain hESC self‐renewal and associated phenotypes, these findings collectively suggest that Lin28R192G is a loss‐of‐function mutation. To further confirm this, the heterozygous mutants c43 and c27 were transduced with lentiviruses expressing GFP‐labeled WT LIN28A at P10, and LIN28A‐transduced (GFP+) and LIN28A‐untransduced cells (GFP‐) were sorted using FACS (Appendix Fig S4A). At P12, GFP‐ mutant cells began to show defects in cell viability, authentic hESC morphology, and marker expressions (Appendix Fig S4B–D). The defects were significantly blocked by the forced expression of LIN28A (in GFP+ LIN28A− transduced cells), confirming the loss‐of‐function property of LIN28A(R192G) mutation.
Figure 2. Human embryonic stem cells (hESCs) carrying the LIN28A(R192G) mutation exhibit defects in self‐renewal, shape, and phenotype.
-
A, BCell growth and population doubling levels (PDLs) during passaging. In (B), dots represent individual PDLs, and boxes and bars represent mean ± SE of PDL values of 5 (+/+), 5 (+/m), and 2 (m/m) lines tested. Significantly different from control with *P < 0.05, ANOVA, followed by Tukey post‐hoc test.
-
CPhase‐contrast (left), alkaline phosphatase‐stained (middle), and immunocytochemical images stained with pluripotent cell markers (right). Images were taken at cell passage P8 (+/+, +/m) or P6 (m/m). Scale bars, 100 μm. (C1) Representative images from +/m c16 and c84 mutants at passage 6.
-
DEnriched GO and KEGG pathways of differentially expressed genes (DEGs) in the mutant cells (m/m c38 and +/m c43) versus +/+ (C42) (extended data in Appendix Fig S3).
-
EUnsupervised hierarchical clustering heatmap of the gene expression (ratios of mutant/WT) categorized in “neurodegenerative disorders” (“Parkinson's disease”, “Alzheimer's disease”, and “Huntington's disease”).
In RNA sequencing (RNA‐seq) analysis, we detected differentially expressed genes (DEGs) between homozygous mutant (m/m, c38) and WT hESCs (+/+, c42) that were enriched in the gene ontology (GO) categories “cytoskeleton organization”, “cell adhesion”, and “cell cycle” (Fig 2D and Appendix Fig S5C), consistent with the defects in cell/colony shape, cell‐cell contact, and growth retardation observed in hESC m/m cultures. It is of note that the RNA‐seq analysis was done before the defects manifested in the mutant hESCs (P5), indicating gene expression changes precede cellular defects. Consistent with LIN28 functioning to control glucose and energy metabolism (Zhu et al, 2011), a KEGG analysis revealed that genes in the hESC m/m gene set were annotated as “oxidative phosphorylation”, “sugar metabolism”, and “insulin signaling pathway” (Fig 2D and Appendix Fig S5E). Intriguingly, pathways associated with neurodegenerative conditions such as Parkinson's, Alzheimer's, and Huntington's diseases were included in the top hits (Fig 2D and E, and Appendix Fig S5E). Similarly, DEGs between WT (c42) and a heterologous +/m mutant (c26) were enriched in the ontology and KEGG categories associated with neurodegenerative disorders, metabolic pathways, protein processing, and intracellular trafficking (Fig 2D and E, and Appendix Fig S5D and F), defects in which are the earliest pathologic manifestations in PD (Hunn et al, 2015). These findings collectively indicate that undifferentiated cells harboring the LIN28A mutation are already poised to develop the disorder. These data are consistent with reports demonstrating disease phenotypes and perturbed expression of disease‐associated genes in iPSCs and NSCs derived from Huntington's disease patients (An et al, 2012; Camnasio et al, 2012; Ring et al, 2015). All of these findings suggest that the first steps in disease pathogenesis of adult‐onset neurodegenerative diseases may occur during embryonic development (Humbert, 2010; Brennand, 2016).
Defects in mDA neuron development from the hESCs carrying LIN28A(R192G)
We next induced differentiation of the WT and mutant hESCs toward NSC and mDA neuronal phenotypes using two different protocols. Similar to results with WT hESCs, neural colonies containing PLZF+ neuroepithelial cell structures (neural rosettes) were efficiently generated from +/m (c26, c27, c43, c16) cells by co‐culturing them on the feeder layer of an MS5 stromal cell culture (Fig 3A; Rhee et al, 2011). However, neural induction was not attained from either the two homozygous m/m cell lines or heterozygous +/m c84 cells (Fig 3A), which had exhibited defects from the undifferentiated hESC stage (Fig 2A–C), excluding them from further analyses. To examine VM patterning during mDA neuron development, we adopted a chemically defined method (Kriks et al, 2011) with modifications, in which hESCs differentiate into neural lineages as they sequentially acquire VM‐specific markers. FOXA2, LMX1A (VM‐specific floor plate), PLZF, and HES1 (neuroepithelial cells/NSC) expression gradually increased during the in vitro differentiation of WT and heterozygous mutant hESCs. However, consistent with the in vivo Lin28 cKO animal data shown in Appendix Fig S1B–D, it is of note that in the mutant hESC cultures, the maximal expression levels of these genes were reached earlier and were then significantly lower on the last day tested compared to the expression of the same genes in WT cells (Fig 3B), indicating premature development/patterning. In addition, the expression of MASH1, NGN2, and NURR1, which are induced by the interaction of FOXA2 and LMX1A in a late stage of mDA neuron development, were less efficiently induced in differentiating mutant hESCs (Fig 3B). When NSCs were prepared from colonies of WT neuroepithelial cells, they were highly proliferative during multiple cell passages in the presence of basic fibroblast growth factor (bFGF), a mitogen for NSCs; the proliferative capacities of the 4 cell lines tested were not significantly different (Fig 3C; Rhee et al, 2011). In contrast, NSCs derived from the heterozygous mutant hESCs, except for those derived from C43, underwent replicative senescence during later NSC passages (Fig 3C).
Figure 3. Neural induction of wild‐type (WT) and mutant (LIN28A(R192G)) human embryonic stem cells (hESCs).

-
ANeural differentiation of hESCs was induced on a feeder layer of MS5 stromal cells. Representative colonies differentiated from the WT (+/+, c42) and homozygous mutant (m/m, c38) hESCs are shown (left). Neural induction efficiencies were estimated by % neuroepithelial colonies out of total colonies (n = 5–7 dishes for each group). Neuroepithelial cell colonies were identified by neuroepithelial cell structure (neural rosettes) and by staining of markers specific for primitive neuroepithelial cells (PLZF, N‐CADHERIN, and SOX2) and rostral embryonic brain (OTX2). Scale bars, 100 μm.
-
B1–B9Ventral midbrain (VM) patterning was assessed during 24 days of +/+ and +/m hESC differentiation (chemically defined protocol). Each dot represents mRNA expression detected by qPCR; boxes and bars represent means and SEs of +/+ and +/m lines. The gene expression levels of +/+ and +/m at day 24 are compared in the last graph, B9 (n = 4, *P < 0.05 or **P < 0.001, t‐test).
-
CNeural stem cell (NSC) expansion estimated by cell growth curve and PDL during NSC passages (n = 4, *P < 0.001, t‐test). NSCs were derived from neuroepithelial cell colonies (shown in A).
PD‐related pathologic phenotypes in mDA neurons differentiated from the hESCs carrying LIN28A(R192G)
When terminal differentiation of heterozygous +/m c16 and c26 cells was induced, cell death occurred during early differentiation periods (data not shown), so further analyses of differentiated mDA neuronal cells were not possible. In contrast, heterozygous mutants c27 and c43 differentiated toward authentic mDA neurons expressing TH after terminal differentiation in a similar way to WT +/+ (c42, c44) cells (Appendix Fig S6), but with significantly reduced TH+mDA neuron yields (Appendix Fig S7A and B). During mDA neuron differentiation in the LIN28A mutant, a dramatic reduction of Otx2 expression (Fig 3B), which is responsible for the specification of the A10 (ventral tegmental area, VTA) mDA neuronal subtype (Panman et al, 2014), suggests more a severe defect in A10 mDA neuron differentiation in the mutant cultures. However, % TH+ mDA neurons co‐expressing CALBINDIN‐D28K, a marker specific to A10 mDA neurons (Appendix Fig S7C and D), and the protein levels of the CALBINDIN‐D28K and the A9 SN‐specific marker SOX6 were indistinguishable between the differentiated WT and mutant cultures (Appendix Fig S7E). We further detected a significant decrease in GABAergic neurons, another major neuronal population in the adult midbrain (Fields et al, 2007; Kala et al, 2009), in the cultures differentiated from the hESC‐NSCs carrying the LIN28A mutant (c27, c43) (Appendix Fig S7F and G). Based on the non‐DA component was affected, it is suggested that LIN28A defect may be involved in atypical Parkinsonism.
In EdU pulse chase assays, total EdU‐labeled proliferating cells, compared to the WT (c42), were more rapidly reduced during the period of DA neuron differentiation from the mutant NSCs (c43)(Appendix Fig S7J and K), indicating earlier cell cycle exit in the mutant NSCs. Consistently, the numbers of EdU+, TH+ DA neuron precursors at early differentiation (day 2) were significantly greater in the mutant cultures than the WT controls (Appendix Fig S7J and L). The counts of EdU+, TH+ proliferating precursors, however, were reversed at a later differentiation day (days 5 and 7) and then followed by reduced TH+ DA neurons from the mutant cultures (day 10) (Appendix Fig S7A and B). These findings, combined with the data from the Lin28a/b cKO mouse (Appendix Fig S1), suggest that loss of Lin28 functions causes early cell cycle exit and premature differentiation, which result in reduced DA neuron yield. On the other hand, the LIN28A mutant cells underwent more severe apoptotic cell death during the differentiation period (Appendix Fig S7M), along with significantly greater activated caspase 3+ and TH+ cells co‐expressing activated caspase 3 in the mutant cultures than the WT at differentiation day 7 (Appendix Fig S7N), indicating selective cell death also contributed to reduced DA neuron yield in the mutant cultures.
In the differentiated mDA neuron cultures, along with increased general cell death (% EtHD+ of DAPI+ cells, Fig 4A), larger proportions of the neuronal cells derived from the mutants underwent cell apoptosis (% cleaved caspase 3+ of TuJ1+ cells, Fig 4B), senescence (β‐galactosidase activity, Fig 4C), and DNA damage (% cells with > 4 γH2AX+ foci of DAPI+ cells, Fig 4D) after prolonged culturing. Mitochondrial dysfunction is a common PD pathologic manifestation (Subramaniam & Chesselet, 2013; Ryan et al, 2015). Increased mitochondrial ROS levels (MitoSox, Fig 4E), as well as decreased mitochondrial membrane potentials (MitoID, Fig 4F), were manifested in the differentiated cultures derived from the mutants. In accordance with the involvement of mitochondrial dysfunction, PD is considered to be a disorder of cell metabolism (reviewed in Anandhan et al, 2017). Seahorse analyses showed reduced glycolysis (ECAR) and oxidative phosphorylation (OCR) in mutant cultures (Fig 4G). Consistently, it has been reported that deletion of Lin28a/b during early fetal development results in a life‐long defect in glucose metabolism (Shinoda et al, 2013). Endoplasmic reticulum (ER) stress as a driver of mDA neuron degeneration is another salient molecular signature of PD (Mercado et al, 2016; Michel et al, 2016). Levels of ER stress marker proteins were greater in differentiated +/m mutant cultures, compared to those of +/+ cultures (Fig 4H). We further estimated mDA neuron resistance against various mitochondrial toxins in the WT and mutant cultures. In experiments treated with all the toxins tested, the percentages of TH+ DA neurons that survived the toxins were significantly lower in the mutant cultures than those of the WT (Fig 4I). These findings collectively indicate that neuronal cells (mDA neurons) carrying the LIN28A mutant easily undergo cell death in hostile environments with PD‐specific pathologic manifestations.
Figure 4. Parkinson's disease (PD) manifestations in terminally differentiated neuron cultures.

- General cell survival (calcein‐AM)/death (EthD‐1). ***P < 0.01, n = 3, two‐way ANOVA.
- Cleaved caspase‐3+ apoptotic cell death. ***P < 0.01***, n = 3, two‐way ANOVA.
- Cellular senescence (β‐gal staining). ***P < 0.01, n = 3, two‐way ANOVA.
- DNA damage estimated by γH2AX staining. Cells with > 4 γH2AX foci in the nucleus were counted. ***P < 0.01, n = 3, two‐way ANOVA.
- Mitochondrial ROS (MitoSox). ***P < 0.01, n = 3, two‐way ANOVA.
- Mitochondrial membrane potential (MitoID). ***P < 0.01, n = 3, two‐way ANOVA.
- Seahorse test. Terminal differentiation of neural stem cells (NSCs) was induced, and the oxygen consumption rate (OCR) and extracellular acidification rate (ECAR) were analyzed on the NSCs at differentiation day 4. *P < 0.001, n = 7 (WT), 10 (mutant), t‐test. Two‐way ANOVA.
- Western blot analyses for ER stress marker proteins.
- Resistance of mDA neurons against mitochondrial toxins. Differentiated mDA neurons were exposed to the toxins indicated for 1 h, and viable TH+ mDA neurons were counted. Data are expressed as % TH+ cells relative to untreated. Three cultures were analyzed for each cell line. N = 3 independent experiments, significance at *P < 0.05.
Correction of the LIN28A mutation in patient‐derived hiPSCs rescues the developmental defects and PD manifestations of mDA neurons
To further characterize the pathogenic contribution of LIN28A(R192G), hiPSCs were generated from skin fibroblasts isolated from the PD patient (HS Lee, pt‐hiPSCs) (Appendix Fig S8). The pt‐hiPSCs carrying the heterozygous LIN28A(R192G) mutation had a strong tendency to lose their authentic undifferentiated ESC/iPSC morphologies during culturing. A stable pt‐hiPSC line was ultimately established by continuously picking undifferentiated colonies during multiple passages. The LIN28A mutation in the pt‐hiPSCs was corrected with CRISPR‐CAS9 (Appendix Fig S9), and differentiation and characteristics of mDA neuronal cells from the corrected pt‐hiPSCs were compared side‐by‐side with those of the mutant‐carrying hiPSCs. NSCs differentiated from the pt‐hiPSCs harboring the heterozygous LIN28A(R192G) mutation were less proliferative (data not shown) and yielded lower numbers of TH+ DA neurons than those differentiated from the corrected iPSCs (Fig 5D). Midbrain DA neurons derived from the mutant pt‐hiPSCs exhibited immature neuronal shapes with short/blunted neurites and spare synaptic densities (Fig 5A–F) and were functionally immature in the capacity of presynaptic DA release (Fig 5G). Similarly, a recent study has shown reduction in neurite outgrowths of the mDA neurons differentiated from PD patient‐derived iPSCs harboring LRRK2 and SNCA mutations, along with altered expression of RBFOX1, a gene linked to neurodevelopmental diseases (Lin et al, 2016). The mDA neuronal yield and neuronal immaturity were rescued in the cultures differentiated from the corrected pt‐hiPSCs (Fig 5A–G). Midbrain‐type DA neuronal identity of the TH+ cells rescued in the cultures differentiated from the corrected pt‐hiPSCs was confirmed by their co‐expression of the marker specific for mature neurons (TUJ1, MAP2), DA homeostasis (VMAT2), and mDA neurons (FOXA2, LMX1A, NURR1, EN1) (Appendix Fig S10). Consistently, RNA‐seq analysis detected enrichment of genes related to “dopamine regulation”, “neurotransmission”, and “neural development” in DEGs between the cells differentiated from the mutant and the corrected iPSCs (Fig 5M and Appendix Fig S13). Similar defects in neuronal development and neurite outgrowths have been shown in vitro and in vivo in animal models deficient in the PD‐associated genes NURR1, PITX3, SCNA, PINK, LRRK2, and VPS35 (reviewed in Le Grand et al, 2015). Consistent with the isogenic hESC cultures (Appendix Fig S7F and G), decrease in GABAergic neuronal yields was also observed in the cultures differentiated from the mutant pt‐hiPSCs, compared to the corrected pt‐hiPSCs (Appendix Fig S11).
Figure 5. Developmental defects and Parkinson's disease (PD) manifestation in midbrain‐type dopamine (mDA) neurons derived from patient (pt)‐human induced pluripotent stem cells (hiPSCs) are rescued by correction of the LIN28A mutation in the pt‐hiPSCs.

-
A–CRepresentative in vitro phase‐contrast (A), TH/DAPI or TH (insets) (B), and TH/SYNAPSIN‐stained (C) images in the cultures terminally differentiated from mutant (c13, c19) and corrected hiPSCs (c22, c59). Arrows indicate representative TH+ neurons, highlighted in the lower subpanel images. Scale bars, 50 μm (A, B), 20 μm (C). Also, see related Appendix Fig S14.
-
D–GDA neuron differentiation, morphological, synaptical, and functional maturation of DA neurons were assessed by DA neuronal yields (D), TH+ fiber lengths (E), synaptic puncta densities (F), and presynaptic DA neuron releases (G), respectively. DA levels were measured in the media conditioned in the differentiated cultures for 24 h (D15) and evoked by KCl‐mediated depolarization for 30 min. Significance at *P < 0.05 (E–G; t‐test) or ***P < 0.001 (D; two‐way ANOVA). Data are presented as mean ± SE.
-
HDNA breaks estimated by γH2AX staining. Cells with > 4 γH2AX foci in the nucleus were counted. Significance at ***P < 0.001 (two‐way ANOVA). Data are presented as mean ± SE.
-
ISA‐β‐gal staining was performed for cellular senescence analysis. Significance at ***P < 0.001 (two‐way ANOVA). Data are presented as mean ± SE.
-
J, KMitochondrial ROS (MitoSox) (J) and mitochondrial membrane potential (MitoID) (K) were analyzed after terminal differentiation. Representative images for (H–K) are shown in Appendix Fig S12. Significance at ***P < 0.001 (two‐way ANOVA). Data are presented as mean ± SE.
-
LAccumulation of α‐synuclein oligomers analyzed by Western blotting. The mutant (c13) and corrected (c22) neural stem cells (NSCs) were transduced with α‐synuclein‐expressing lentiviruses. At 6 days after differentiation, cells were extracted and fractionated to Triton X‐100 (1%)‐soluble and insoluble fractions. Shown is the representative WB image of three independent experiments. α‐Synuclein oligomers are indicated with a bracket, while monomer bands are marked with an arrowhead.
-
MClueGO/cytoscape for GO biological process upregulated in NSCs differentiated from the corrected iPSCs, c22 (versus the mutant pt‐hiPSCs, c19). Term enrichment significance is represented by node size (Kappa score > 0.4). Most significant GO terms are numbered and listed.
Source data are available online for this figure.
Consistent with our observations of differentiated isogenic hESC cultures (Fig 4), mDA neurons differentiated from the pt‐hiPSCs easily underwent apoptotic cell death and senescence as well as manifesting DNA and mitochondrial damage (Fig 5H–K and Appendix Fig S12). The pathologic manifestations were significantly improved by correcting the LIN28A mutation. Notably, along with enrichment of genes related to “cell stress regulation and cell death” in the DEGs (Fig 5M and Appendix Fig S13), those of ubiquitination and autophagy were among the set of regulated genes in the cultures derived from the corrected iPSCs, indicating that the LIN28A(R192G) mutation (loss of LIN28A functions) might result in neuronal cell defects to clean up pathologic protein aggregates (proteostasis), which is a common feature of neurodegenerative disorders and aging. Indeed, in WB analysis, the pathologic α‐synuclein oligomers accumulated in the mDA neuron cultures from the mutant pt‐hiPSCs were greatly reduced in the cultures derived from the corrected pt‐hiPSCs (Fig 5L).
Cell transplantation in PD rats using pt‐hiPSCs with or without the mutant gene correction
hESC/iPSC‐based cell therapies are now a real therapeutic horizon for PD (Barker et al, 2017) and patient‐derived hiPSC‐based autologous transplantation would be an ideal and ultimate goal in cell replacement therapies. As a pilot test to foretell whether correction of the mutation is required for personalized cell therapy, cells differentiated from the mutant and corrected pt‐hiPSCs were transplanted into PD model rats. In contrast to the animals grafted with unedited mutant pt‐hiPSC‐derived cells, a significant improvement in amphetamine‐induced rotation scores was observed in the rats grafted with corrected cells (Fig 6A). In a non‐invasive measurement for cell engraftment at 1 month post‐transplantation, the corrected pt‐hiPSC‐derived cells yielded larger grafts than those of the mutant pt‐hiPSCs (Fig 6B). Histologic analyses at 2 months post‐transplantation showed a clear difference in hNCAM+/TH+ DA neuron enrichments in the animals transplanted with corrected and uncorrected pt‐hiPSC‐derived cells (Fig 6C). The mDA neuron‐specific markers FOXA2, LMX1A, NURR1, and DAT were co‐localized in portions of TH+ DA neurons in corrected hiPSC grafts (Fig 6E). We failed to obtain images for TH+ DA neurons co‐expressing OTX2, EN1 and PITX3.
Figure 6. Behavioral and histologic assays of Parkinson's disease (PD) rats grafted with differentiated cells from mutant and corrected patient (pt)‐human induced pluripotent stem cells (hiPSCs).

-
AAmphetamine‐induced rotation scores. The ipsilateral net rotation values (% of pre‐transplanted) of individual animals transplanted with differentiated mutant (n = 7) and corrected (n = 6) pt‐hiPSCs are depicted. Significant differences from the mutant cell‐transplanted at each post‐transplantation time point are at *P < 0.05 or **P < 0.001, t‐test.
-
BCell engraftments measured by the integrated fluorescent intensities in the animals grafted with DiR‐labeled pt and corrected hiPSCs. *P < 0.05, t‐test.
-
COverviews of hNCAM+/TH+ cell grafts at 8 weeks post‐transplantation. Insets, TH+ (red) DA neuron morphology in grafts shown with high magnification. Scale bars, 200 μm.
-
DTotal number of TH+ cells in the graft (TH+ numbers/mm3) per animal. Significance at **P < 0.001, t‐test.
-
ECo‐expression of the mDA neuron‐specific FOXA2, LMX1A, NURR1, DAT in TH+ DA cells generated by the corrected pt‐hiPSC transplantation. Scale bars, 20 μm.
Loss‐of‐function mechanisms of the LIN28A(R192G) mutation
When the expression of WT‐LIN28A and LIN28A(R192G) was induced in identical transfection conditions, levels of ectopically expressed LIN28A(R192G) were always lower than WT‐LIN28A (Fig 7A and data not shown). In a protein stability assay using cycloheximide (CHX), a translation blocker, the WT‐LIN28A protein was quite stable for 24 h, but a rapid protein degradation manifested in the LIN28A(R192G) protein (Fig 7A). Treatment with MG132, a proteasome inhibitor, enhanced LIN28A(R192G) protein level, suggesting proteasome‐mediated protein degradation is involved in the instability of the LIN28A mutant protein (Fig 7B). This indicated that the reduced expression level of the LIN28A mutant was due to its low protein stability. Recent studies have shown that methylation at K135 (Kim et al, 2014) and phosphorylation at S200 (Tsanov et al, 2017) enhance LIN28A protein stability; increased nuclear localization is the mechanism responsible for the increased stability of K135 methylated LIN28A. However, mass spectrometry reveals that R192 in LIN28A is rarely phosphorylated, methylated, or oxidized (Fig 7C). Similar to the WT protein, the LIN28A(R192G) protein mainly localizes to the cytoplasm (Fig 7D). Further studies are required to unveil the mechanism involving the role of R192 in LIN28A protein stability.
Figure 7. Loss‐of‐function mechanisms of LIN28A(R192G) mutation.

-
ALIN28A protein stability assays. HEK293 cells were transfected with pFLAG‐WT‐LIN28A and pFLAG‐LIN28A R192G. Protein samples were prepared during 24 h of cycloheximide (50 μg/ml) treatment. Representative Western blot data for LIN28A protein level changes normalized to β‐actin protein levels (upper) or with normalization based on initial (0 h) LIN28A protein levels (lower). Band intensities were quantified using ImageJ, and normalized values are depicted (right graph) (n = 5).
-
BThe proteasome inhibitor MG132 treatment increases LIN28A(R192G) protein level. After serum starvation for 3 h, HEK293T cells expressing LIN28A(R912G) were treated with or without MG132 (0.1–10 μM) for 30 min, and then followed by WB analyses. Right bar graph is the densitometry analysis of Lin28.
-
CLC‐MS/MS analysis. Immunoprecipitated FLAG‐LIN28A WT was loaded on an SDS gel (upper). Bold red sequences indicate peptides matching LIN28A (lower). Middle, LC‐MS/MS spectra of WT LIN28A.
-
DCytoplasmic localization of WT LIN28A and LIN28A(R192G) proteins. HeLa cells transfected with pFLAG‐WT‐LIN28 and pFLAG‐LIN28A(R192G) were stained with FLAG antibody and counterstained with DAPI.
-
ELET‐7 microRNA regulatory activity of LIN28A. HeLa cells were transfected with plasmids expressing FLAG‐tagged WT‐LIN28A, LIN28AR192G, or mock pFLAG vector (control), and Let‐7a, b, and c levels were quantified by RT–qPCR. The level of RNA was normalized to that of U6 snRNA. *P < 0.05, n = 26 from 6 independent experiments, ns = not significant, ANOVA.
-
FAffinity of LIN28A protein binding to its cognate mRNA 3′UTR region. Upper: schematic for pmirGLO‐LIN28A used in this assay, a bicistronic Firefly/Renilla luciferase (FLuc/RLuc) plasmid containing the part of the LIN28A 3′UTR containing the putative LIN28A protein binding sites (black dots) (Wilbert et al, 2012). Lower: HeLa cells were transiently co‐transfected with pmirGLO‐LIN28A 3′UTR along with pFLAG‐WT‐LIN28A, pFLAG‐LIN28A R192G, or mock pFLAG control. LIN28A protein‐mRNA binding activities were determined by relative luciferase activity levels of FLuc normalized to those of RLuc. *P < 0.05, n = 18 from 6 independent experiments.
-
GLIN28A‐RHA co‐IP assays in HEK293 cells transfected with pFLAG‐WT‐LIN28A and pFLAG‐LIN28A R192G.
Source data are available online for this figure.
Inhibition of LET‐7 microRNAs is the most well‐defined action of LIN28 (reviewed in Huang, 2012; Shyh‐Chang & Daley, 2013). Levels of LET‐7a, b, and c were significantly reduced by the forced expression of WT‐LIN28A (Fig 7E). The LIN28A(R192G) mutant‐mediated decrease of LET‐7 levels was less dramatic in identical experimental conditions (data not shown). Because the LIN28A(R192G) expression level is lower than the WT (Fig 7A) and this could be the main cause for the reduced LET‐7 regulatory function, transfection conditions in all the following experiments were adjusted to attain similar levels of mutant and WT‐LIN28A expression (by using a 2–5 times higher dose of LIN28A(R192G) vector) and normalization of the resulting data was based on the LIN28A level. In these LIN28A level‐based normalized conditions, the levels of LET‐7 microRNAs were not significantly different in HeLa cells transfected with mutant versus WT LIN28A (Fig 7E). In addition, the binding of the LIN28A protein to its own mRNA, which is required for LIN28A mRNA stability (Wilbert et al, 2012), was not significantly altered in the mutant (Fig 7F).
LIN28A also exerts biological effects to facilitate protein translation (reviewed in Huang, 2012; Shyh‐Chang & Daley, 2013). The LIN28A function to stimulate translation of its target mRNAs requires interaction with RNA helicase A (RHA) which is capable of facilitating RNP remodeling during the process of translation (Jin et al, 2011). The C‐terminal region of LIN28A, which includes R192, has been reported as being responsible for the RHA interaction (Jin et al, 2011). Of note, mutant LIN28A‐RHA binding was greatly reduced in a co‐immunoprecipitation assay (Fig 7G), indicating that the R192G mutation possibly causes a drastic 3D structural change in the C‐terminal region that affects LIN28A‐RHA binding affinity and thus a defect of LIN28A activity to stimulate translation of its target mRNAs. Collectively, these findings suggest that loss of LIN28A(R192G) function is mediated by reduced protein stability as well as defective RHA binding required for the LIN28A activity to promote protein translation.
Discussion
In this study, we suggest that the loss of LIN28 function contributes to PD pathogenesis by analyzing a human isogenic disease model derived from early‐onset PD patients carrying a LIN28A loss‐of‐function mutation as well as an animal model with Lin28 cKO mice. Compared to the animal model demonstrating early PD phenotype and definite behavioral deficits only after MPTP toxin exposure, the PD symptoms of patients and LIN28A dysfunction effects in the isogenic hESC/iPSC‐based disease model were more severe. This may be due to a limitation in recapitulating the true PD pathophysiology in animal models that express mutated versions of PD genes (< 50% of PD gene KO animal models) (reviewed in Potashkin et al, 2010). In addition, in order to know the effect of the Lin28 deletion during brain development on PD pathogenesis, the animal model that we tested in this study was mice in which Lin28 is conditionally deleted only in NSCs. Thus, this animal model does not reflect the Lin28 deletion effect during early embryonic development before definite NSC appearance. Consistently, expressions of early developmental genes associated with rostral brain patterning (Otx2) and primitive neuroepithelial tube formation (PLZF) were not affected in the Lin28 cKO mouse model (Appendix Fig S1B), but were severely decreased from early developmental stages of LIN28A(R192G) hESCs (Fig 3). The early developmental defects may contribute to the PD symptoms in the patients and the human disease model analyzed in this study. In addition, loss of LIN28A in extra‐CNS tissues could also contribute to the PD symptoms in the patients, since mice with constitutive Lin28a KO underwent life‐long aberrations in glucose metabolism (Shinoda et al, 2013), which is another important pathogenic factor for PD (reviewer in Zhang & Tian, 2014). On the other hand, although the pathologic features of DA neurons derived from the pt‐hiPSCs were dramatically recovered in the corrected hiPSCs by correcting the LIN28 mutation, the yield, maturity, and viability of the mDA neurons derived from the corrected pt‐hiPSCs did not reach the levels in WT hiPSCs derived from a healthy individual (Appendix Fig S14). These findings suggest the possibility that other pathogenic factors may exist that contribute or aggravate the disease in the patient and the disease phenotypes observed in the pt‐hiPSCs.
The LIN28A mutation described in this study was detected in two young age‐onset PD patients including an author of this study. In the ExAC browser (beta) database (Exome Aggregation Consortium, URL: http://exac.broadinstitute.org) (Lek et al, 2016), the same LIN28A(R192G) variant is detected among East Asian populations with a prevalence of 6/8654 (allele count/allele number), Freq. 0.0006933. Another LIN28A point mutation at the identical site (arginine to alanine; LIN28A(R192A)) was detected among Europeans: 7/66692 (Finnish) and 1/6614 (non‐Finnish) (dbSNP rs558060339). However, the LIN28A mutation among PD patients has not been reported in GWAS and analyses of familial forms of PD. Thus, our findings in this study should be supported in future by large‐scale population genetic studies to confirm a role of LIN28A in PD. Nevertheless, our data may have broad implications for understanding the disease pathogenesis, and for improving the diagnostic work‐up and the genetic counseling of early‐onset PD. In addition, this study encourages personalized cell therapy with pathologic mutation correction in donor cells, not only for the patients described in this study but also for other patients with pathogenic gene mutations.
Materials and Methods
Study approval
Studies using human tissues were approved by the Institutional Review Board (IRB) at Hanyang University (Seoul, Korea) under protocol number HYI‐14‐136‐4, and were carried out based on international ethical standards and the guidelines of the International Society of Stem Cell Research (ISSCR). Mice were used in accordance with protocols approved by the Institutional Animal Care and Use Committee (IACUC) at Hanyang College of Medicine (approval number, 2017‐0056).
Animal study
Animals
Lin28a/b double‐conditional knockout mice were produced by crossing heterozygous Lin28a and Lin28b floxed mouse (Lin28a tm2.1Gqda Lin28b tm2.1Gqda, Jackson stock No. 023915) to Nestin‐Cre heterozygous transgenic mice (Tg‐(Nes‐cre)1Kln, Jackson stock No. 003771). Animals were housed in a specific pathogen‐free barrier facility with a 12‐h light/dark cycle and maintained on standard chow (5053 PicoLabR Rodent Diet 20).
PET‐MRI imaging
PET‐MRI fused imaging was performed using a nanoScanPET/MRI system (1T, Mediso, Hungary). While continuing to keep the mice warm, FP‐CIT 0.3 ± 0.1 MBq in 0.2 ml was administered intravenously via the tail vein under anesthesia (1.5% isoflurane in 100% O2 gas). MR brain imaging obtained T1 weighted with gradient‐echo (GRE) 3D sequence (TR = 25 ms, TEeff = 3.4, FOV = 50 mm, matrix = 256 × 256) and T2 weighted with fast spin echo (FSE) 3D sequence (TR = 2,400 ms, TEeff = 110, FOV = 50 mm, matrix = 256 × 256) images, which were acquired during the FP‐CIT uptake period. Twenty minutes of static PET images were acquired in a 1–3 coincident in a single field of view of the MRI range. These PET images were reconstructed by Tera‐Tomo 3D, in full detector mode, with all the corrections on, high regularization, and 8 iterations. A three‐dimensional volume of interest (VOI) analysis of the reconstructed images was performed using the InterView Fusion software package (Mediso) and by applying standard uptake value (SUV) analysis.
MPTP treatment
Mice received a single injection (i.p) of MPTP (20 mg/kg) or saline once a day for 5 days and were perfused 25 days after the last injection.
Behavioral assessments
Behaviors of WT and Lin28a/b cKO mice were assessed before and after MPTP treatment. Total locomotor activity was measured in a plastic box (50 × 50 × 20 cm) using an ANY‐maze video tracking system (Stoelting Co., IL). For the pole test, mice were placed head upwards on top of a vertical wooden pole (50 cm in length, 1 cm in diameter). Once placed on the pole, mice oriented themselves downward and descended the length of the pole back into their home cage. All of the animals received 2 days of training that consisted of five trials for each session. On the test day, animals received five trials, and the time to orient downward was measured. Motor performance was measured with a novel beam test adapted from traditional beam‐walking tests. Briefly, the beam (1 m length) started at a width of 3.5 cm and gradually narrowed to 0.5 cm in 1‐cm increments. Animals were trained to traverse the length of the beam, starting at the widest section and ending at the narrowest section for 2 days before real testing. Times required for the animals to traverse the beam were measured.
Cell culture
Fibroblasts were cultured from skin taken from the back of the patient (HS Lee). The pt‐hiPSC line was established by transfecting the fibroblasts with episomal vectors for expression of human Oct3/4, Sox2, Klf4, and shp53 (pCXLE‐hOct3/4‐shp53, pCXLE‐hSox2‐hKlf4) (Okita et al, 2011). A wild‐type (WT) hiPSC line (Epi‐iPS) was also established from the skin fibroblasts of a healthy individual (female, age 21, purchased from JCRB cell bank, Japan) with the same method. Undifferentiated hESCs (H9, WA09, WiCell), pt‐hiPSCs, and WT‐iPSCs were cultured on Matrigel™ (BD Biosciences, Franklin Lakes, NJ, USA) in mTeSR1 medium (Stemcell Technologies Inc., Vancouver, BC, Canada) supplemented with doxycycline (1 μg/ml), which has been reported to improve hESC/hiPSC self‐renewal and survival (Chang et al, 2014). Cells were maintained by subculturing weekly using Accutase (Stemcell Technologies Inc.) for cell dissociation. Isogenic hESCs and pt‐hiPSCs that underwent the CRISPR‐CAS9 reaction were differentiated into NSCs and mDA neurons either by co‐culturing on feeder layers of MS5 stromal cells (Rhee et al, 2011) or by using a chemically defined protocol (Kriks et al, 2011). The chemically defined protocol was substantially modified to improve the stability and reproducibility of the method. Most importantly, medium conditioned in primary mouse VM‐type astrocyte cultures (astrocyte conditioned medium) were treated to promote cell survival and midbrain‐specific factor expression of mDA neurons during the procedure of cell dissociation and plating. NSCs derived from hESCs/pt‐hiPSCs were expanded with bFGF (20 ng/ml) in ITSA medium (Rhee et al, 2011) and subcultured weekly for long‐term expansion. Terminal differentiation of hNSCs was induced in the absence of bFGF and in the presence of brain‐derived neurotrophic factor (BDNF, 20 ng/ml; R&D Systems Inc., Minneapolis, MN), glial cell line‐derived neurotrophic factor (GDNF, 20 ng/ml; R&D Systems Inc.), or dibutyryl cAMP (0.5 mM; Sigma‐Aldrich, St. Louis, MO, USA).
CRISPR/CAS9 gene editing
Cells were co‐transfected with single strand donor oligonucleotide (ssODN), plasmids encoding a puromycin‐resistant gene, CAS9, and sgRNA targeting the locus near the site of the R129G mutation in LIN28A using electroporation (NEPA21, Nepagene, Japan). Sequence information for the sgRNA and ssODN is shown in Appendix Table S1. Cells were plated onto Matrigel‐coated 60‐mm dishes in doxycycline‐supplemented mTeSR1 medium as a clonal cell density and well‐isolated single cells were marked with a 3 mm circle marker (Nikon, Tokyo, Japan). One day after transfection, cells were subjected to puromycin selection (2 μg/ml) for 6 h. Colonies derived from single cells were picked and plated onto 96‐well plates and cultured until cells became confluent (10–14 days). Half of the cells were passaged in 24‐well plates and the remaining half were used for genomic DNA isolation. The edited nucleotide sequence was detected by PCR amplification of genomic DNA using the primers specified in Appendix Table S1, followed by restriction fragment length polymorphism (RFLP) analysis using restriction enzyme Snab1 (New England Biolabs INC., Ipswich, MA, USA). The PCR‐amplified fragment was cloned in a TA‐cloning vector and subjected to Sanger sequencing to confirm the edited nucleotide sequence. For sequencing, 10 TA‐cloned plasmids were picked from each edited‐hESC colony.
PD manifestation in differentiated mDA neuron cultures
Cell death/survival and DNA damage were estimated using ethidium heterodimer 1 (EthD1)/calcein‐AM (Invitrogen Molecular Probes, Waltham, MA, USA) and γH2AX staining, respectively. Cell apoptosis was determined by immunofluorescent staining for activated (cleaved) caspase‐3. Cell senescence was assessed using a β‐Gal Staining Kit (Abcam, Cambridge, UK). Mitochondrial ROS and membrane potential were estimated by MitoSox (Thermo Scientific Inc., Waltham, MA, USA) and MitoID (Enzo Life Sciences Inc., Farmingdale, NJ, USA). ER stress was determined by Western blot analyses for the ER stress‐specific markers BiP, calnexin, CHOP, and IRE1α.
Morphologic and functional maturation of DA neurons
To estimate morphological maturation, total fiber lengths emanating from TH+ DA neuronal cells were measured. The presynaptic activity of DA neurons was determined by measuring levels of DA neurotransmitter released in differentiated ventral midbrain (VM)‐NSC cultures. Media incubated for 24 h (differentiation day 15) were collected and used in DA level determinations using an ELISA kit (BAE‐5300, LDN, Nordhorn, Germany). DA release evoked by membrane depolarization was estimated by incubating cultures at differentiation day 15 in fresh ITSA media in the presence or absence of 56 mM KCl for 30 min. Evoked DA release was calculated as the difference between DA levels with and without KCl.
High‐throughput whole‐transcriptome RNA sequencing
For LIN28A +/+, +/m, and m/m RNAs, total RNA was isolated using TRIzol reagent (Invitrogen) followed by rRNA removal with a Ribo‐Zero Magnetic Kit (Epicentre Inc., Madison, WI, USA). Library construction was performed using a SENSE mRNA‐Seq Library Prep Kit (Lexogen Inc., Vienna, Austria). High‐throughput sequencing was performed as paired‐end 100 sequencing using HiSeq 2000 (Illumina, San Diego, CA, USA). RNA‐seq reads were mapped using TopHat software to obtain the bam alignment file. Read counts mapped on transcript regions were extracted from the alignment file using BEDTools (v2.25.0) and R/Bioconductor (version 3.2.2; R Development Core Team, 2011). The alignment file was used for assembling transcripts, estimating their abundances, and detecting differential expression of genes, linc RNAs, or isoforms. We used FPKM (fragments per kb of exon per million fragments) to determine the expression level of gene regions. Global normalization was used for comparison between samples. Gene classification was based on searches submitted to DAVID (http://david.abcc.ncifcrf.gov/). Cytoscape (version 3.5.1 + JAVA 1.8, provided by NIGMS), an open source bioinformatics platform, was used to construct network diagrams. GO and KEGG pathway analyses were performed using DAVID Bioinformatics Resources version 6.8, ClueGO version 2.3.3, Reactome version 6.1.1 and WikiPathways version 2.3.1. (cytoscape.org). Enriched categories of GO and KEGG pathway analyses were presented up to a P‐value of 0.05.
Transplantation and histology
All procedures for animal transplantation experiments were approved by the IACUC at Hanyang College of Medicine (approval number 2014‐0212A). Experiments were performed in accordance with National Institutes of Health (NIH) guidelines. Hemiparkinsonism was induced in adult female Sprague Dawley rats (220–250 g) by unilateral stereotactic injection of 3 μl of 6‐hydroxydopamine (6‐OHDA, 8 μg/μl; Sigma‐Aldrich) into the right side of the substantia nigra (AP, −4.8 mm; ML, 1.5 mm; V, 8.2 mm) and the median forebrain bundle (AP, −1.8 mm; ML, 1.8 mm; V, 8.0 mm). The incisor bar was set at −3.5 mm, and AP and ML coordinates are given relative to the bregma. Animal behaviors were assessed using an amphetamine‐induced rotation test (Rhee et al, 2011). Rats with 300 turns/h ipsilateral to the lesion in an amphetamine‐induced rotation test were selected. For transplantation, pt‐hiPSCs with or without the R192G correction were differentiated for 24 days based on the chemically defined protocol (Kriks et al, 2011), and 3 μl of single cell dissociates (1.5 × 10⁵ cells/μl) were injected over a 10‐min period into each of two sites in the striatum (coordinates in AP, ML, and V relative to the bregma and dura: (i) 0.07, −0.30, and −0.55; (ii) −0.10, −0.40, and −0.50; incisor bar set at 3.5 mm below zero) under anesthesia induced by Zoletil 100 μl/100 g (50 mg/ml) mixed with Rompun 100 μl/100 g (23.32 mg/ml). The needle (22 gauge) was left in place for 5 min after each injection. Rats received daily injections of cyclosporine A (10 mg/kg, i.p.) starting 1 day before the grafting and continuing for 1 month thereafter, followed by a reduced dose (5 mg/kg) for the remaining time. Eight weeks after transplantation, animals were anesthetized and perfused transcardially with 4% paraformaldehyde. Brains were removed and immersed in 30% sucrose in PBS overnight, frozen in Tissue‐Tek® (Sakura Finetek USA, Inc., Torrance, CA, USA), and then sliced using a cryostat (Leica CM1850, Leica Biosystems Inc., Buffalo Grove, IL, USA). Free‐floating brain sections (30 μm thick) were subjected to immunohistochemistry as described above, and images were obtained with a confocal microscope (Leica TSP SP5). Donor cells were labeled with DiR fluorescence (Invitrogen), and graft volume was measured and analyzed by integrated fluorescence intensity using an imaging system (FOBI, NeoSicence, Suwon, Korea).
Cell counting and statistical analysis
Immunostained cells were counted in 10–20 random areas of each culture coverslip using an eyepiece grid at a magnification of 200×. Data are expressed as the mean ± SEM of 3–8 independent cultures. Statistical comparisons were made using Student's t‐test (unpaired) or one‐way ANOVA followed by Tukey's post hoc analysis using SPSS Statistics 21 (IBM Inc. Armonk, NY, USA). The relevant n, P‐values, and statistical analysis methods are indicated in each figure legend.
Author contributions
M‐YC, BO, and J‐EC designed and performed most experiments; H‐JW, JYK, and E‐HK helped with ES cell studies; AJ, SWK, and J‐JS helped with animal experiments; JP, O‐CK, Y‐HK, and MJL helped with molecular and metabolic studies; ML, MC, and SJC helped with genetic analysis; YAS and M‐YC performed experiments for the loss‐of‐function mechanism of the LIN28A mutation; YAS, JH, JYK, HK, JYH, and SJC helped with manuscript discussion; H‐SL (Patient/Author) initiated and designed this study with exome sequencing on his blood, performed RNA‐seq analyses; S‐HL designed this study; and wrote the manuscript with contribution from M‐YC, H‐SL, and S‐HL.
Conflict of interest
The authors declare that they have no conflict of interest.
Supporting information
Appendix
Review Process File
Source Data for Figure 4
Source Data for Figure 5
Source Data for Figure 7
Acknowledgements
We thank Dr. Beomseok Jeon [physician in charge of the patient described in this paper (HS Lee) in the Department of Neurology, Seoul National University Hospital] for descriptions of the patient's disease status. We thank the PETcore facility (Convergence Medicine Research Center, Asan Medical Center) for the technical support to acquire nanoScanPET/MRI images and analysis. This work was supported by grants from the Medical Research Center (2017R1A5A2015395), 2017M3A9B4062401, NRF‐2017R1A2B2002220, and NRF‐2016R1A2B4016342, funded by the National Research Foundation of Korea (NRF) of the Ministry of Science and ICT, Republic of Korea.
The EMBO Journal (2019) 38: e101196
Contributor Information
Hyun‐Seob Lee, Email: hyunseob-lee@snuh.org.
Sang‐Hun Lee, Email: leesh@hanyang.ac.kr.
Data availability
Raw data of the RNA‐seq are accessible through GEO: GSE135996.
References
- An MC, Zhang N, Scott G, Montoro D, Wittkop T, Mooney S, Melov S, Ellerby LM (2012) Genetic correction of Huntington's disease phenotypes in induced pluripotent stem cells. Cell Stem Cell 11: 253–263 [DOI] [PMC free article] [PubMed] [Google Scholar]
- Anandhan A, Jacome MS, Lei S, Hernandez‐Franco P, Pappa A, Panayiotidis MI, Powers R, Franco R (2017) Metabolic dysfunction in Parkinson's disease: bioenergetics, redox homeostasis and central carbon metabolism. Brain Res Bull 133: 12–30 [DOI] [PMC free article] [PubMed] [Google Scholar]
- Arkadir D, Bergman H, Fahn S (2014) Redundant dopaminergic activity may enable compensatory axonal sprouting in Parkinson disease. Neurology 82: 1093–1098 [DOI] [PubMed] [Google Scholar]
- Balzer E, Heine C, Jiang Q, Lee VM, Moss EG (2010) LIN28 alters cell fate succession and acts independently of the let‐7 microRNA during neurogliogenesis in vitro . Development 137: 891–900 [DOI] [PubMed] [Google Scholar]
- Barker RA, Parmar M, Studer L, Takahashi J (2017) Human trials of stem cell‐derived dopamine neurons for Parkinson's disease: dawn of a new era. Cell Stem Cell 21: 569–573 [DOI] [PubMed] [Google Scholar]
- Bonilla S, Hall AC, Pinto L, Attardo A, Gotz M, Huttner WB, Arenas E (2008) Identification of midbrain floor plate radial glia‐like cells as dopaminergic progenitors. Glia 56: 809–820 [DOI] [PubMed] [Google Scholar]
- Brennand K (2016) Is Huntington's disease a neurodevelopmental disorder? Sci Transl Med 8: 320ec1 [Google Scholar]
- Camnasio S, Delli Carri A, Lombardo A, Grad I, Mariotti C, Castucci A, Rozell B, Lo Riso P, Castiglioni V, Zuccato C et al (2012) The first reported generation of several induced pluripotent stem cell lines from homozygous and heterozygous Huntington's disease patients demonstrates mutation related enhanced lysosomal activity. Neurobiol Dis 46: 41–51 [DOI] [PubMed] [Google Scholar]
- Chang MY, Rhee YH, Yi SH, Lee SJ, Kim RK, Kim H, Park CH, Lee SH (2014) Doxycycline enhances survival and self‐renewal of human pluripotent stem cells. Stem Cell Rep 3: 353–364 [DOI] [PMC free article] [PubMed] [Google Scholar]
- Fields HL, Hjelmstad GO, Margolis EB, Nicola SM (2007) Ventral tegmental area neurons in learned appetitive behavior and positive reinforcement. Annu Rev Neurosci 30: 289–316 [DOI] [PubMed] [Google Scholar]
- Froudist‐Walsh S, Bloomfield MA, Veronese M, Kroll J, Karolis VR, Jauhar S, Bonoldi I, McGuire PK, Kapur S, Murray RM et al (2017) The effect of perinatal brain injury on dopaminergic function and hippocampal volume in adult life. Elife 6: e29088 [DOI] [PMC free article] [PubMed] [Google Scholar]
- Herrlinger S, Shao Q, Yang M, Chang Q, Liu Y, Pan X, Yin H, Xie LW, Chen JF (2019) Lin28‐mediated temporal promotion of protein synthesis is crucial for neural progenitor cell maintenance and brain development in mice. Development 146: dev173765 [DOI] [PMC free article] [PubMed] [Google Scholar]
- Huang Y (2012) A mirror of two faces: Lin28 as a master regulator of both miRNA and mRNA. Wiley Interdiscip Rev RNA 3: 483–494 [DOI] [PubMed] [Google Scholar]
- Humbert S (2010) Is Huntington disease a developmental disorder? EMBO Rep 11: 899 [DOI] [PMC free article] [PubMed] [Google Scholar]
- Hunn BH, Cragg SJ, Bolam JP, Spillantini MG, Wade‐Martins R (2015) Impaired intracellular trafficking defines early Parkinson's disease. Trends Neurosci 38: 178–188 [DOI] [PMC free article] [PubMed] [Google Scholar]
- Jin J, Jing W, Lei XX, Feng C, Peng S, Boris‐Lawrie K, Huang Y (2011) Evidence that Lin28 stimulates translation by recruiting RNA helicase A to polysomes. Nucleic Acids Res 39: 3724–3734 [DOI] [PMC free article] [PubMed] [Google Scholar]
- Kala K, Haugas M, Lillevali K, Guimera J, Wurst W, Salminen M, Partanen J (2009) Gata2 is a tissue‐specific post‐mitotic selector gene for midbrain GABAergic neurons. Development 136: 253–262 [DOI] [PubMed] [Google Scholar]
- Kim SK, Lee H, Han K, Kim SC, Choi Y, Park SW, Bak G, Lee Y, Choi JK, Kim TK et al (2014) SET7/9 methylation of the pluripotency factor LIN28A is a nucleolar localization mechanism that blocks let‐7 biogenesis in human ESCs. Cell Stem Cell 15: 735–749 [DOI] [PMC free article] [PubMed] [Google Scholar]
- Klein C, Westenberger A (2012) Genetics of Parkinson's disease. Cold Spring Harb Perspect Med 2: a008888 [DOI] [PMC free article] [PubMed] [Google Scholar]
- Kriks S, Shim JW, Piao J, Ganat YM, Wakeman DR, Xie Z, Carrillo‐Reid L, Auyeung G, Antonacci C, Buch A et al (2011) Dopamine neurons derived from human ES cells efficiently engraft in animal models of Parkinson's disease. Nature 480: 547–551 [DOI] [PMC free article] [PubMed] [Google Scholar]
- Le Grand JN, Gonzalez‐Cano L, Pavlou MA, Schwamborn JC (2015) Neural stem cells in Parkinson's disease: a role for neurogenesis defects in onset and progression. Cell Mol Life Sci 72: 773–797 [DOI] [PMC free article] [PubMed] [Google Scholar]
- Lek M, Karczewski KJ, Minikel EV, Samocha KE, Banks E, Fennell T, O'Donnell‐Luria AH, Ware JS, Hill AJ, Cummings BB et al (2016) Analysis of protein‐coding genetic variation in 60,706 humans. Nature 536: 285–291 [DOI] [PMC free article] [PubMed] [Google Scholar]
- Lin L, Goke J, Cukuroglu E, Dranias MR, VanDongen AM, Stanton LW (2016) Molecular features underlying neurodegeneration identified through in vitro modeling of genetically diverse Parkinson's disease patients. Cell Rep 15: 2411–2426 [DOI] [PubMed] [Google Scholar]
- Mercado G, Castillo V, Soto P, Sidhu A (2016) ER stress and Parkinson's disease: pathological inputs that converge into the secretory pathway. Brain Res 1648: 626–632 [DOI] [PubMed] [Google Scholar]
- Michel PP, Hirsch EC, Hunot S (2016) Understanding dopaminergic cell death pathways in Parkinson disease. Neuron 90: 675–691 [DOI] [PubMed] [Google Scholar]
- Okita K, Matsumura Y, Sato Y, Okada A, Morizane A, Okamoto S, Hong H, Nakagawa M, Tanabe K, Tezuka K et al (2011) A more efficient method to generate integration‐free human iPS cells. Nat Methods 8: 409–412 [DOI] [PubMed] [Google Scholar]
- Olgiati S, Quadri M, Fang M, Rood JP, Saute JA, Chien HF, Bouwkamp CG, Graafland J, Minneboo M, Breedveld GJ et al (2016) DNAJC6 mutations associated with early‐onset Parkinson's disease. Ann Neurol 79: 244–256 [DOI] [PubMed] [Google Scholar]
- Ono Y, Nakatani T, Sakamoto Y, Mizuhara E, Minaki Y, Kumai M, Hamaguchi A, Nishimura M, Inoue Y, Hayashi H et al (2007) Differences in neurogenic potential in floor plate cells along an anteroposterior location: midbrain dopaminergic neurons originate from mesencephalic floor plate cells. Development 134: 3213–3225 [DOI] [PubMed] [Google Scholar]
- Panman L, Papathanou M, Laguna A, Oosterveen T, Volakakis N, Acampora D, Kurtsdotter I, Yoshitake T, Kehr J, Joodmardi E et al (2014) Sox6 and Otx2 control the specification of substantia nigra and ventral tegmental area dopamine neurons. Cell Rep 8: 1018–1025 [DOI] [PubMed] [Google Scholar]
- Patterson M, Gaeta X, Loo K, Edwards M, Smale S, Cinkornpumin J, Xie Y, Listgarten J, Azghadi S, Douglass SM et al (2014) let‐7 miRNAs can act through notch to regulate human gliogenesis. Stem Cell Rep 3: 758–773 [DOI] [PMC free article] [PubMed] [Google Scholar]
- Potashkin JA, Blume SR, Runkle NK (2010) Limitations of animal models of Parkinson's disease. Parkinsons Dis 2011: 658083 [DOI] [PMC free article] [PubMed] [Google Scholar]
- Rhee YH, Ko JY, Chang MY, Yi SH, Kim D, Kim CH, Shim JW, Jo AY, Kim BW, Lee H et al (2011) Protein‐based human iPS cells efficiently generate functional dopamine neurons and can treat a rat model of Parkinson disease. J Clin Invest 121: 2326–2335 [DOI] [PMC free article] [PubMed] [Google Scholar]
- Rhee YH, Kim TH, Jo AY, Chang MY, Park CH, Kim SM, Song JJ, Oh SM, Yi SH, Kim HH et al (2016) LIN28A enhances the therapeutic potential of cultured neural stem cells in a Parkinson's disease model. Brain 139: 2722–2739 [DOI] [PubMed] [Google Scholar]
- Richardson JR, Caudle WM, Wang M, Dean ED, Pennell KD, Miller GW (2006) Developmental exposure to the pesticide dieldrin alters the dopamine system and increases neurotoxicity in an animal model of Parkinson's disease. FASEB J 20: 1695–1697 [DOI] [PubMed] [Google Scholar]
- Ring KL, An MC, Zhang N, O'Brien RN, Ramos EM, Gao F, Atwood R, Bailus BJ, Melov S, Mooney SD et al (2015) Genomic analysis reveals disruption of striatal neuronal development and therapeutic targets in human Huntington's disease neural stem cells. Stem Cell Rep 5: 1023–1038 [DOI] [PMC free article] [PubMed] [Google Scholar]
- Ryan BJ, Hoek S, Fon EA, Wade‐Martins R (2015) Mitochondrial dysfunction and mitophagy in Parkinson's: from familial to sporadic disease. Trends Biochem Sci 40: 200–210 [DOI] [PubMed] [Google Scholar]
- Schwamborn JC (2018) Is Parkinson's disease a neurodevelopmental disorder and will brain organoids help us to understand it? Stem Cells Dev 27: 968–975 [DOI] [PubMed] [Google Scholar]
- Shinoda G, Shyh‐Chang N, Soysa TY, Zhu H, Seligson MT, Shah SP, Abo‐Sido N, Yabuuchi A, Hagan JP, Gregory RI et al (2013) Fetal deficiency of lin28 programs life‐long aberrations in growth and glucose metabolism. Stem Cells 31: 1563–1573 [DOI] [PMC free article] [PubMed] [Google Scholar]
- Shyh‐Chang N, Daley GQ (2013) Lin28: primal regulator of growth and metabolism in stem cells. Cell Stem Cell 12: 395–406 [DOI] [PMC free article] [PubMed] [Google Scholar]
- Shyh‐Chang N, Zhu H, Yvanka de Soysa T, Shinoda G, Seligson MT, Tsanov KM, Nguyen L, Asara JM, Cantley LC, Daley GQ (2013) Lin28 enhances tissue repair by reprogramming cellular metabolism. Cell 155: 778–792 [DOI] [PMC free article] [PubMed] [Google Scholar]
- Subramaniam SR, Chesselet MF (2013) Mitochondrial dysfunction and oxidative stress in Parkinson's disease. Prog Neurobiol 106–107: 17–32 [DOI] [PMC free article] [PubMed] [Google Scholar]
- Thiruchelvam M, Richfield EK, Goodman BM, Baggs RB, Cory‐Slechta DA (2002) Developmental exposure to the pesticides paraquat and maneb and the Parkinson's disease phenotype. Neurotoxicology 23: 621–633 [DOI] [PubMed] [Google Scholar]
- Tsanov KM, Pearson DS, Wu Z, Han A, Triboulet R, Seligson MT, Powers JT, Osborne JK, Kane S, Gygi SP et al (2017) LIN28 phosphorylation by MAPK/ERK couples signalling to the post‐transcriptional control of pluripotency. Nat Cell Biol 19: 60–67 [DOI] [PMC free article] [PubMed] [Google Scholar]
- Wilbert ML, Huelga SC, Kapeli K, Stark TJ, Liang TY, Chen SX, Yan BY, Nathanson JL, Hutt KR, Lovci MT et al (2012) LIN28 binds messenger RNAs at GGAGA motifs and regulates splicing factor abundance. Mol Cell 48: 195–206 [DOI] [PMC free article] [PubMed] [Google Scholar]
- Yang M, Yang SL, Herrlinger S, Liang C, Dzieciatkowska M, Hansen KC, Desai R, Nagy A, Niswander L, Moss EG et al (2015) Lin28 promotes the proliferative capacity of neural progenitor cells in brain development. Development 142: 1616–1627 [DOI] [PMC free article] [PubMed] [Google Scholar]
- Yang HJ, Ehm G, Kim YE, Yun JY, Lee WW, Kim A, Kim HJ, Jeon B (2017) Liquid levodopa‐carbidopa in advanced Parkinson's disease with motor complications. J Neurol Sci 377: 6–11 [DOI] [PubMed] [Google Scholar]
- Zhang P, Tian B (2014) Metabolic syndrome: an important risk factor for Parkinson's disease. Oxid Med Cell Longev 2014: 729194 [DOI] [PMC free article] [PubMed] [Google Scholar]
- Zhu H, Shyh‐Chang N, Segre AV, Shinoda G, Shah SP, Einhorn WS, Takeuchi A, Engreitz JM, Hagan JP, Kharas MG et al (2011) The Lin28/let‐7 axis regulates glucose metabolism. Cell 147: 81–94 [DOI] [PMC free article] [PubMed] [Google Scholar]
Associated Data
This section collects any data citations, data availability statements, or supplementary materials included in this article.
Supplementary Materials
Appendix
Review Process File
Source Data for Figure 4
Source Data for Figure 5
Source Data for Figure 7
Data Availability Statement
Raw data of the RNA‐seq are accessible through GEO: GSE135996.