

Abstract
Objectives:
This study reviewed the use of fractal analysis (FA) in dental images.
Methods:
A search was performed using PubMed, MEDLINE, LILACS, Web of Science and SCOPUS databases. The inclusion criteria were human studies in the English language, with no date restriction.
Results:
78 articles were found in which FA was applied to panoramic radiographs (34), periapical radiographs (21), bitewing radiographs (4), cephalometric radiograph (1), cone beam CT (15), micro-CT (3), sialography (2), and ultrasound (2). Low bone mineral density (21) and systemic or local diseases (22) around the bone of dental implants were the main subjects of the study of FA. Various sizes and sites of the regions of interest were used to evaluate the bone structure. Different ways were used to treat the image and to calculate FA. FA of 43 articles showed significant differences in the comparison of groups, mainly between healthy and sick patients.
Conclusions:
FA in Dentistry has been widely applied to the study of images. Panoramic and periapical radiographs were those most frequently used. The Image J software and the box-counting method were extensively adopted in the studies reviewed herein. Further studies are encouraged to improve clarification of the parameters that directly influence FA.
Keywords: fractal, dentistry, dental radiography, panoramic, jaws
Introduction
Fractal analysis (FA) is a mathematical method by which irregular and complex body structures may be evaluated. The quantitative outcome of this method is defined as the fractal dimension (FD).1,2 Since 1875, when du Bois Reimond first introduced the concept of continuous non-distinguishable functions, FA has been further improved and used by researchers.3 Mandelbrot published information on sets of mathematical functions used to describe complex geometrical structures and the term “fractal” was consolidated.3–5 Fractal is derived from the Latin “fractus” which means “fractured” or “broken.” The fractal method is different from conventional geometry and is used to evaluate similar forms on various scales.6 True fractals go beyond physical form; they can be temporal or spatial on infinite scales and repeated pattern. Digital images are limited by screen resolution. They are not true fractals in a strict sense, but approximations of these fractals. In a magnified image with N structures, a greater number of details is observed, but the number of structures remains the same. To measure the complexity of these structures, it is necessary to count the number of parts on a well-defined scale. Then, the FD formula considers the number of parts and a magnification scale. Mathematically, it is expressed by D = log n/log ε, where N is the number of parts and ε is the defined scale.7,8
Medicine and its allied specialties have adopted FA since it can be broadly applied to the analysis of image examinations. In dentistry, the assessment of the bone pattern of the jaws in dental radiographs is the main outcome evaluated using FA. Researchers who investigate bone mineral density (BMD) have also benefited from this method for the quantitative assessment of trabecular bone. However, in recent years, the fractal method has been employed in several studies in which bone structures have been explored.9–12
Fractals may be calculated from digitalized images, but pre-processing of these images is necessary. Based on medical images, White and Rudolph13 described a computer program that measures the morphologic features of trabecular bone. In their study, the authors detailed the steps of image standardization to highlight trabecular bone. The public domain software ImageJ (available at https://imagej.nih.gov/ij/) was used. After image acquisition, high-resolution and compressed images were saved to prevent variations. The sequence included cropping of the regions of interest (ROI), duplication of the ROI and removal of large-scale variations in brightness with a blurred Gaussian filter (sigma = 35 pixels, kernel size = 33×33). The subtraction of ROI from the original image, the addition of 128 grey values to each pixel location, binarization, erosion, dilatation, inversion and skeletonization were also events in this sequence.
After image preparation, some methods of FD calculation, such as power spectral density, triangular prism surface area, the blanket method, and intensity difference scaling or the variogram can be used.5 The box-counting algorithm, considered to be easily accessible, was the method most frequently used.14–16 Among the methods of morphological description of the trabecular architecture, FD is a mathematical tool that allows the radiologist to predict the quality of bone tissue.15 This technological advance facilitates access to high-standard images; the digital images are a high-precision image modality available for the quantitative evaluation of the bone microarchitecture.11
In dental clinical practice, radiographic images are often ordered by the healthcare provider as complementary exams. Methods such as FA, that objectively quantify changes in bone pattern arising from a disease or the progression of treatment, are important and indispensable for clinical and scientific investigations. In this scoping review, we aimed to present studies describing the applications of FA to different types of dental images and their main findings. However, no review summarizing the body of evidence about FA has been conducted thus far. A review of this topic would be helpful by updating the practitioner regarding the use of FA in dentistry. Therefore, with this scoping review, we aimed to present studies describing the applicability and the usefulness of FA as a tool for the evaluation of bone structures in dental images and to illustrate the methods and results obtained in the included articles.
Methods and materials
The reporting of this review was in agreement, wherever possible, with the Preferred Reporting Items for Systematic Reviews and Meta-Analysis.17
Eligibility criteria
Original research articles in which FA was used as an evaluation tool for texture analysis in dental images were eligible for this scoping review. Only studies published in English were included. There was no publication date restriction.
Articles on FA applied to areas other than dentistry, letters to the editor, case reports and literature reviews were excluded. Studies conducted on animals, dry mandibles, bone models, cadavers and studies in which other materials such as tissue fragments or histological slices had been used were also excluded. A summary of the inclusion and exclusion criteria is provided in Table 1.
Table 1.
Inclusion and exclusion criteria of the studies
| Inclusion criteria | Exclusion criteria | |
|---|---|---|
| Study design | Observational studies, clinical trials and accuracy studies | Letters to the editor, case reports and literature reviews |
| Area of interest | Dentistry | Areas other than Dentistry |
| Method evaluated | Fractal analysis | Other analysis |
| Language | English | Other languages |
| Publication date | No restrictions | - |
| Participants | Humans | Animals, dry mandibles, bone models, cadavers and studies in which other materials, such as fragments or histological tissues were used |
Information sources and search strategy
Electronic searches were undertaken using PubMed, MEDLINE, LILACS, Web of Science and SCOPUS databases from their date of inception until the second week of June/2018. An update was conducted in December 2018. The search strategies used in the electronic databases are displayed in Table 2. The references retrieved from each database were exported to the Reference Manager software (Reference Manager, Thomson ISI, Thomson Reuters, Toronto, Canada). Duplicate hits were removed upon identification.
Table 2.
Search strategy for each each electronic database
| Database | Keywords | Results | |
|---|---|---|---|
| Search 1a | Updated Searchb | ||
| Pubmed | Fractal AND radiology OR image OR imaging OR periapical OR panoramic OR CBCT OR tomography OR X-ray OR X-ray OR microtomography OR micro-CT OR cone beam computed tomography OR cone beam tomography OR “radiograph” OR radiography OR “bite wing” OR bitewing OR bite-wing OR cephalometry OR ultrasound OR doppler AND dentistry OR dental OR maxillofacial OR oral OR jaw OR mandible OR maxilla OR mandibular OR odontology |
166 | 14 |
| Medline | Fractal AND radiology OR image OR imaging OR periapical OR panoramic OR CBCT OR tomography OR X-ray OR X-ray OR microtomography OR micro-CT OR cone beam computed tomography OR cone beam tomography OR radiograph OR radiography OR bite wing OR bitewing OR bite-wing OR cephalometry OR ultrasound OR doppler AND dentistry OR dental OR maxillofacial OR oral OR jaw OR mandible OR maxilla OR mandibular OR odontology |
135 | 6 |
| Scopus | Fractal AND radiology OR image OR imaging OR periapical OR panoramic OR CBCT OR tomography OR X-ray OR “X-ray” OR microtomography OR “micro-CT” OR “cone beam computed tomography” OR “cone beam tomography” OR radiograph OR radiography OR “bite wing” OR bitewing OR bite-wing OR cephalometry OR ultrasound OR doppler AND dentistry OR dental OR maxillofacial OR oral OR jaw OR mandible OR maxilla OR mandibular OR odontology |
207 | 13 |
| LILACS | Same as Pubmed | 25 | 5 |
| Web of Science | Same as Pubmed | 170 | 7 |
| Total | 703 | 45 | |
CBCT, cone beam CT.
Up to the second week of June 2018
From the third week of June 2018 to the first week of December 2018
Study selection
Two review investigators (oral and maxillofacial radiologists) assessed the title and abstract of each article in the first screening. The articles with titles and abstracts that met the eligibility criteria were included. The full texts of publications with titles and abstracts with insufficient information for a decision about inclusion or exclusion were retrieved for a second screening. In the second screening, the full texts retrieved were evaluated taking into account the same eligibility criteria as those considered in the first screening. Those that met the eligibility criteria were also included. During the study selection, disagreements between review investigators were resolved by means of a discussion until a consensus was met. If no consensus was met, a third review investigator (a senior lecturer in Oral and Maxillofacial Radiology) was consulted and provided the final decision regarding inclusion or exclusion.
Data extraction and data items
Data were extracted independently by the same two review investigators using a predesigned Word data form. The following data were extracted from each study: first author’s last name, year of publication, objective of the study, dental exam, sample size, ROI (shape, size and site), method for FA calculation, FD values, and the main results regarding FD. Any discrepancy was resolved by discussion between the two review investigators.
Results
Study selection
The searches retrieved 748 references identified across the five electronic databases. After the removal of 454 duplicates, 293 titles and abstracts were screened. Of the 293 references evaluated during the study selection, 78 met the eligibility criteria and were included in this review. The flow chart (Figure 1) displays the process of study selection in its entirety. A summary of the studies with the FA of three most common dental images and their main findings are described in Table 3. Data of the 78 included articles are summarized in the Supplementary table.
Figure 1.

Flow diagram and results of the literature review in the PubMed database on the use of fractal analysis in dental images.
Table 3.
Main findings of the included articles according to the three most commons dental images assessed by fractal analyses
| Exam | Panoramic radiograph | Periapical radiograph | CBCT |
|---|---|---|---|
| Number of studies | 34 | 21 | 15 |
| Year of publication | 1995–2018 | 1998–2018 | 2011–2018 |
| Type of studies (n) | |||
| Accuracy | 04 | 02 | 02 |
| Cross-sectional studies | 21 | 13 | 10 |
| Follow-up | 09 | 06 | 02 |
| Clinical trial | - | - | 01 |
| Objective | |||
| Bone mineral density | 15 | 4 | 5 |
| Diseases | 8 | 5 | 4 |
| Implant | 7 | 4 | 1 |
| Others | 4 | 8 | 5 |
| Sample size (n) | 10–1047 | 9–600 | 3–165 |
| ROI | |||
| Shape | |||
| Rectangular | 16 | 08 | 01 |
| Square | 13 | 11 | 06 |
| Anatomic | 05 | 02 | 04 |
| Others | - | - | 04 |
| Size (pixels) | 10–300 | 23–400 | 20–128 |
| Site | |||
| Trabecular | 29 | 21 | 15 |
| Cortical | 05 | - | - |
| Method of calculation | |||
| Software | |||
| Image J | 26 | 12 | 11 |
| Others | 04 | 04 | 02 |
| Not described | 04 | 05 | 02 |
| Image format | |||
| Tiff | 07 | 01 | - |
| Jpeg | 05 | 01 | 02 |
| Bitmap | 02 | 05 | - |
| Not informed | 20 | 14 | 13 |
| Box-counting | 30 | 15 | 14 |
| Others | 04 | 06 | 01 |
| FD values (Box-counting) | 0.7768–2.7931 | 0.7768–1.8360 | 0.9100–2.4000 |
| Main results (n studies) | |||
| FD different between groups evaluated | 23 | 12 | 08 |
| FD similar between groups evaluated | 05 | 05 | 03 |
| FD showed correlation with other measures | 05 | 02 | 02 |
| FD had no correlation with other measures | - | 01 | 01 |
| Accuracy | >0.70 | >0.75 | >0.63 |
CBCT, cone beam computed tomography; FD, fractal dimension; N, number; ROI, region of interest.
Study characteristics
The first article using the FA method was published in 1991.18 Most articles (n = 51) were published after 2011 (Figure 2). Regarding the type of study, most were observation studies (n = 68), 36 of which included a comparison group, 13 were cross-sectional studies and 19 follow-up studies. Eight accuracy studies and two clinical trials were also found. Low BMD (21 articles) and other systemic or local diseases (22 articles) were the main issues evaluated in these studies (Figure 3). The exams most used for FA were panoramic radiographs (34 articles),10–12,15,16,19–47 periapical radiographs (21 articles),2,5,45–63 and cone beam CT (CBCT) (15 articles).1,64–77 Bitewing radiography,63,78–80 micro-CT,81–83 ultrasound,84,85 sialography,18,86 and lateral cephalometric radiography87 were also found in this review (Figure 4).
Figure 2.
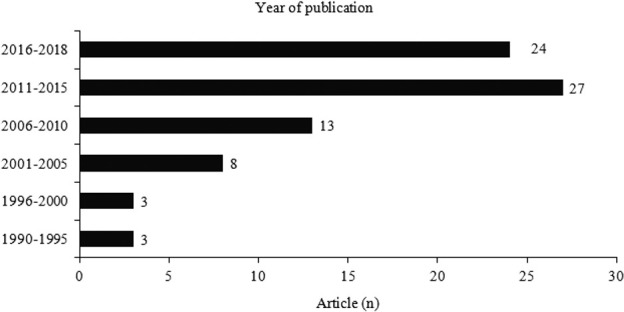
Distribution of the included articles on fractal analysis in dental images according to year of publication.
Figure 3.
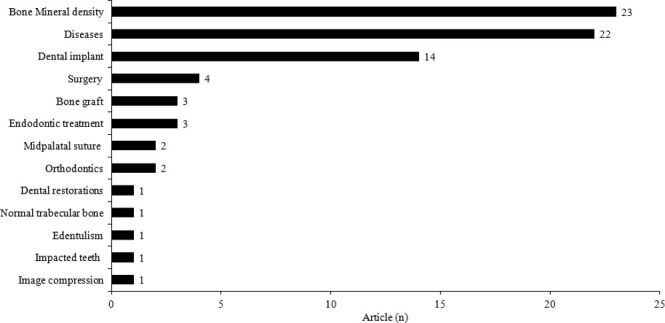
Distribution of the included articles on fractal analysis in dental images according to the objectives of the studies.
Figure 4.
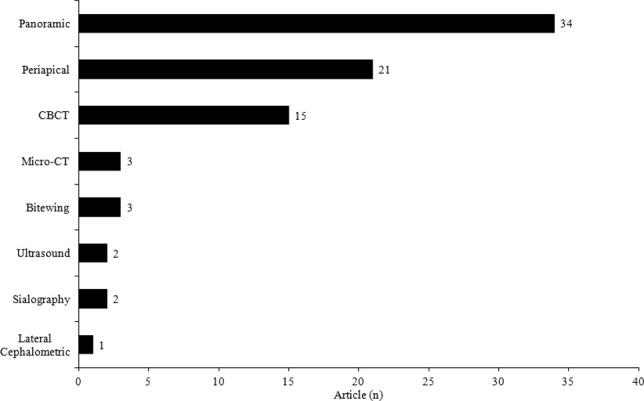
Distribution of the included articles according to the types of dental images that were evaluated by fractal analysis.
The included studies showed different sample sizes. The smallest sample size was three individuals and the largest consisted of 1047 individuals. Most studies had 20–60 participants. Square ROIs of 64 × 64 pixels within trabecular bone were commonly used. FA using the box-counting method was conducted in 62 of the 78 articles included. Most studies (n = 51) used the public domain software Image J (https://imagej.nih.gov/ij/) for the application of the method, while 13 studies used other types of software and 14 articles did not describe details about the software used for the analyses. Other aspects identified in the studies were a wide variety in the standardization of the images (Tiff, JPEG or Bitmap file format) and the lack of detailed information on image processing. 11 articles (7 studies with panoramic radiographs, 3 with periapical radiographs, and 1 with CBCT) carefully followed all the image processing stages proposed by White and Rudolph.13 An example of the White and Rudolph13 sequence of image preparation for the measurement of FD found in this review is detailed in Figures 5–7. In other studies, image processing varied in terms of the filters used and the manner of FD calculation.
Figure 5.
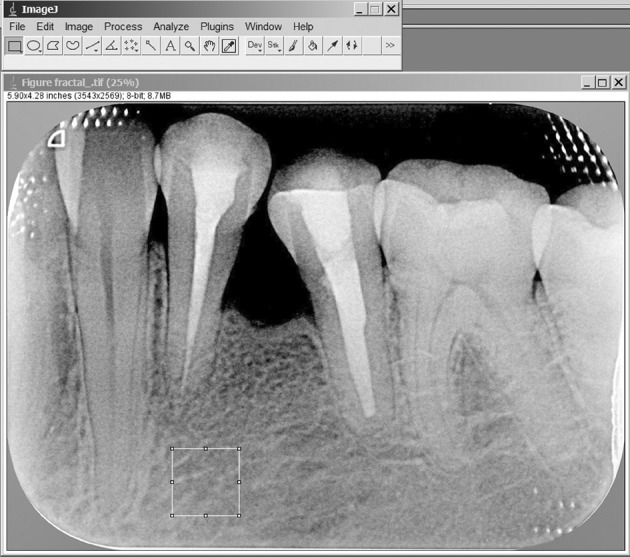
Example of selection of the region of interest in a periapical radiograph using ImageJ software. Periapical radiograph with a region of interest of 64 × 64 pixels in the trabecular bone.
Figure 6. .
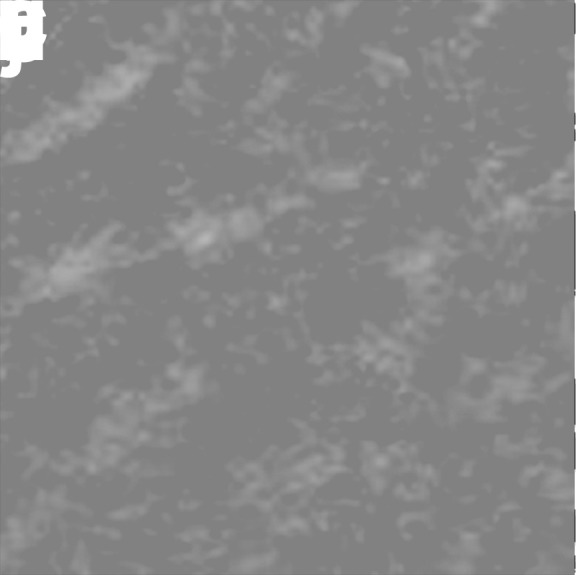
Sequence of image preparation for the measurement of fractal dimension, a: region of interest; b: duplication of the image of the region of interest; c: application of the gray filter (sigma 35); d: subtraction of the original image; e: resulting image with added greyscale value of 128; f: binary image; g: eroded image; h: dilated image; i: inverted image, and j: skeletonized image from which the fractal value is obtained.
Figure 7.
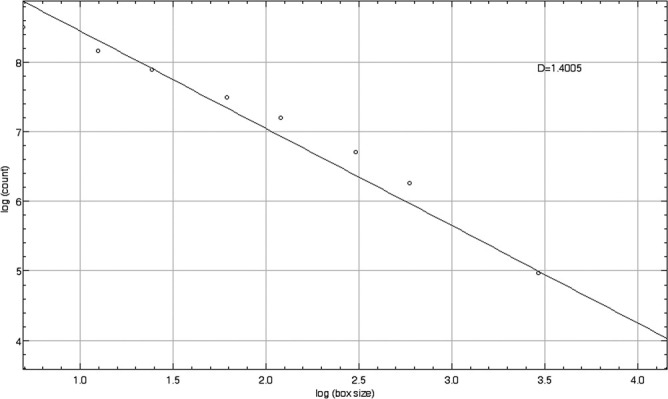
Graphic results of fractal analysis that provide a final value (D) called the fractal dimension (1.4513).
Discussion
This scoping review illustrates the use of FA in dental images. We found studies on panoramic, periapical, bitewing and cephalometric radiographs and CBCT, as well as exams less commonly used in dentistry, such as micro-CT, ultrasound and sialography. The choice of the type of exam included in the method of each study was due to the availability of retrospective data or the advantages of each technique. Panoramic radiographic images were analyzed in different areas: trabecular mandibular bone, cortical mandibular bone, and condyle bone, while periapical radiographs and bitewing exams measured FD in bone crest, trabecular bone or periapical areas. Most studies evaluated periapical and panoramic radiographs, which are exams often used in clinical practice. More recently, FA on the CBCT images has been explored, but the number of studies is still limited. The main advantage of three-dimensional and high-resolution images is the feasibility of accurate evaluation of bone quality. Considering the low dose of radiation, minimized distortion and the possibility of real size images, cephalometric radiographs have advantages when compared to panoramic radiographs. But only one study, in this review, used this type of exam.87
In the conventional radiographic projections, panoramic, periapical, bitewing, and cephalometric images represent a set of structures that absorb the X-ray in a focal area, and generally result in overlaps, blurring and some degree of distortion of the bone structures. In contrast, CBCT and micro-CT images have a higher spatial resolution of hard tissue by means of multiplanar reconstructions that allow one to visualize structures in three dimensions with minimal distortion and without overlapping.88 Voxel size may have an influence on FD values.89 On the other hand, the acquisition of ultrasound images is entirely different from the acquisition of radiographs. A transducer dynamically captures the echoes generated by the reflections of the structures of the organism and transforms them into images.90 In two studies included in this scoping review, FA was applied to ultrasound images for the evaluation of salivary glands in two-dimensional (2D) images.84,85 The method of image acquisition is important in FA since the structures are measured in their projections of pixels of 2D images.
BMD investigation was the main aim of most of the studies included evaluating FA on panoramic and periapical radiographs. Studies have suggested that FD values have a positive correlation with BMD,28,29 but differences between normal and osteoporotic groups have not been found elsewhere.22,30,51 Some authors still observed increased FD values in groups with osteoporosis.20,45 These authors have advocated that when there is a loss of BMD the trabecular structure becomes more complex and therefore, a greater number of fractals takes place. Controversies among studies may be associated with different methodologies,14 but FA seems to be useful for the screening of patients with low BMD in dental images. Clinicians should not focus their analysis only on dental outcomes, because some characteristics of systemic alterations such as bone loss may be observed in dental exams.
Another benefit of using FA on panoramic radiographs is the primary stability of dental implants. Panoramic radiographs have been chosen because of their low radiation exposure and the need to perform exams pre- and post-implant.15 The ROIs included mesial, distal and apical areas of different sizes. The follow-up period ranged from 6 months to 8 years.10,19 A positive linear correlation between FD and implant stability quotient was observed.15 High FD (range 1.34–2.659) values can predict the prognosis of osseointegration.15,19,26,41 Although an increase in FD value has been observed in most studies, Zeytinoğlu et al10 stated otherwise. They found a reduction in FD values in the ROIs of 76 implants, with a significant difference between baseline and a 6 month follow-up. Conversely, the study of Onem et al31 evaluated fractals on panoramic radiographs of patients with implants placed after 2–3 months and detected no difference between the area around the implant and the alveolar bone around a premolar tooth on the contralateral side. Osteointegration should be followed up with clinical and radiographic exams. In this respect, FA may assist the practitioner in the quantitative evaluation of radiographic images as a screening tool for primary stability of dental implants.
Systemic or local disorders such as imperfect osteogenesis,38 chronic renal failure,40 renal osteodystrophy,46 sickle cell anaemia,24 diabetes mellitus,43 periodontitis,2,48,54 hypodontia27 and temporomandibular disorders16 were also analyzed with FA in panoramic and/or periapical radiographs. Sjögren Syndrome and salivary gland tumors were observed by ultrasound84,85 and sialography.18,86 Most studies compared groups with and without disease. There was a difference among all the groups compared, except for diabetes mellitus43 and hypodontia.27 In general, FD has been used in several other dental specialties such as endodontics,49,55,56 orthodontics67 and oral and maxillofacial surgery.5,21,25 Several studies can be conducted with FA to assess the patterns of bone complexity. A tool that calculates FD should be incorporated into the imaging program to facilitate access and allow the practitioner to further explore this methodology.
The advent of CBCT has brought great advances in dentistry. This diagnostic method uses three-dimensional imaging, a reliable tool for the evaluation and planning of dental implants,65 investigation of sickle cell anaemia,70 Type 2 diabetes mellitus,74 temporomandibular osteoarthritis,75 orthodontic tooth movement,67 bone repair surgery,76 impacted canines,77 mid-palatal suture fusion,71,73 and prediction of low BMD.1,72 Similar to panoramic radiographs, FA on a CBCT slice can be helpful in the differentiation of groups of patients with low BMD.1,69 However, other authors found no significant difference in FD values between postmenopausal females with and without osteoporosis. Instead, a significant negative correlation was observed between FD and lumbar spine BMD measured by DXA.66,72 CBCT slices represent a small part of the real structure of trabecular bone, but the images saved in order to perform FA are of low resolution This suggests that the saved images are unsuitable for FA,91 although more studies should be carried out to support this statement.
Micro-CT is considered to be the gold-standard for the evaluation of bone morphology, allowing the provider to thoroughly analyze structures of a few micrometers.82,92 FD was also used on micro-CT images to evaluate the effect of porous titanium granules and bone graft materials in patients undergoing maxillary sinus lifting. No differences in FD values were found between micro-CTs of bone biopsies before grafting and after 6 months of follow-up.83 In addition, FD on micro-CT was used to evaluate the relationship between systemic bone turnover and the microstructure of alveolar bone81 and also to assess BMD at dental implant recipient sites.82 Both studies observed positive and negative correlations of FD values and other parameters evaluated such as histomorphometric analysis and radiographic bone density. Despite the high quality of micro-CT, few studies using this exam were identified. The high cost, dose of radiation and the necessity of a bone sample preclude the use of micro-CT.
The greatest advantage of FA is that it is a noninvasive technique. Robust results of evaluations of FD and other radiomorphometric parameters have been provided.1,11,35,38 Accuracy studies have shown a satisfactory performance of FD values when compared to the test for BMD screening measured on panoramic radiographs.11,28,39 However, FA is performed by means of the quantitative analysis of processed images. The images can be acquired from either analogic or digital equipment, which may change the FD values. Some authors have been actively engaged in studying image parameters of periapical and panoramic radiographs. The exposure time, resolution and compression of the images may interfere with FD results in 2D images, but this does not make their use unfeasible. Focus on the standardization of images is important.9,33 An experimental study with CBCT images showed that, in contrast to exposure time, the variation of voxel size significantly changed FD values. Larger voxels appear to have lower FD values.89 The standardization of these parameters would be important in order to obtain more robust results. Another recent analysis with dry human mandibles has suggested the use of panoramic radiographs instead of CBCT due to the low image resolution provided by the latter, in addition to the different radiation doses of the two exams.
In addition to Image J, other types of software were used to calculate FD, such as NRecon,83 Scion Image21,26 CTAn70 and TAS Plus.18,86 The box-counting method was the used method most frequently used for the calculation of FD, as previously observed in other reviews assessing FA.6,14 Caliper, power spectrum and Rényi entropy methods are not often used.20,27,34,78,79 A comparison of different algorithms for the calculation of FD identified different values for the same region. This is justified by the fact that each method has its own theoretical basis for acquisition. Therefore, one should standardize the method of evaluation, using a single method to compare the images and establishing an average value.5
The variety of shapes, sizes and sites of the ROIs in the included studies is remarkable. Overall, the trabecular bone region was the area predominantly chosen for the calculation of FD in the exams, although the mandibular bone cortex was included in the ROI in panoramic radiographs.11,22,23,37,38 The difference in the architecture of trabecular and cortical regions may justify the lack of consensus among data on FD values. In periapical and panoramic radiographs, most authors agree that high FD values correspond to more complex trabecular bone, as generally observed in healthy patients.2,28,30,35,54 However, these results were not observed by other authors,20,46 as also demonstrated for CBCT images. Two recent studies have shown different results for FD values as a method to quantify BMD.1,72 The images evaluated were similar in both studies (cross-sectional), but the size and site of the ROIs were different. Thus, studies with a standard size and site are encouraged.
The diversity of ROIs leads to the observation of differences in FD values. For trabecular bone, FD values calculated with box counting are generally between 1 and 2. Values closer to 1 represent simple structures with a lower number of fractals, while values closer to two indicate more complex bone structures.15 The suggested value for the FD of a normal or healthy trabecular bone of the jaws is approximately 1.5 in periapical images,59 but some studies with groups of healthy patients have detected a higher (1.74) or lower (1.05) FD value in the same exam.2,54 Similar variations are observed in the results of FD on panoramic radiograph images.11,12,22,37 In CBCT, FD values of 1.19 (osteoporosis) and 1.17 (healthy patients) were not significantly different. Different image parameters or differences of the ROI (size and site) in trabecular or cortical bone can justify such variations in values.
Noise and overlay removal images are treated in different manners in order to highlight the structure of trabecular bone. Authors16,23,43,77 who followed the proposal of White and Rudolph13 (crop of the ROI, duplication, Gaussian filter, subtraction, addition of 128 grey value, binarization, erosion, dilatation, inversion, and skeletonization) frequently found higher FD values than those who did not advocate image inversion prior to skeletonization.10,29 The binary, skeletonized or outline image for counting fractals results in different FD values.22,29,45 Reduction of noise with erosion and dilatation steps when performed three times can also result in elevated FD values in non-standardized periapical radiographs.59 These image processing steps interfere with the values found even when using a single fractal calculation method, such as box-counting.
Conclusion
The use of FA in Dentistry has increased substantially in the last years. Quantification of trabecular bone is required in several dental specialties, and the use of common dental images such as panoramic and periapical radiographs is preferred. Practitioners have at their disposal a free and easy handling system such as Image J, which allows them to analyze the image texture of their patients’ exams. However, the reviewed studies did not present method standardization. This scoping review strongly recommends that future studies describe a standardized methodology used in their analyses, allowing comparison among them. The description should include details of image type, resolution, size, as well as shape, size and site of the ROI. In CBCT images, information on voxel and slice thickness is also important. According to most included studies and their consistent results, the Image J software, the box-counting method and the White and Rudolph process image are suggested. Further studies are encouraged to improve clarification regarding the parameters that directly influence FA.
Footnotes
Funding: This work was supported by the National Council for Scientific and Technological Development of Brazil - CNPq [Grant No. 309322/2015-4]. This study was financed in part by the Coordenação de Aperfeiçoamento de Pessoal de Nível Superior - Brasil (CAPES) - Finance Code 001. Mesquita RA is research fellows at CNPq. Kato CNAO and Barra SG are the recipients of CAPES scholarships.
REFERENCES
- 1.Güngör E, Yildirim D, Çevik R. Evaluation of osteoporosis in jaw bones using cone beam CT and dual-energy X-ray absorptiometry. J Oral Sci 2016; 58: 185–94. doi: 10.2334/josnusd.15-0609 [DOI] [PubMed] [Google Scholar]
- 2.Sener E, Cinarcik S, Baksi BG. Use of fractal analysis for the discrimination of trabecular changes between individuals with healthy gingiva or moderate periodontitis. J Periodontol 2015; 86: 1364–9. doi: 10.1902/jop.2015.150004 [DOI] [PubMed] [Google Scholar]
- 3.Geraets WG, van der Stelt PF. Fractal properties of bone. Dentomaxillofac Radiol 2000; 29: 144–53. doi: 10.1038/sj.dmfr.4600524 [DOI] [PubMed] [Google Scholar]
- 4.Mandelbrot B. How long is the coast of Britain? statistical self-similarity and fractional dimension. Science 1967; 156: 636–8. doi: 10.1126/science.156.3775.636 [DOI] [PubMed] [Google Scholar]
- 5.Borowska M, Szarmach J, Oczeretko E. Fractal texture analysis of the healing process after bone loss. Comput Med Imaging Graph 2015; 46 Pt 2: 191–6. doi: 10.1016/j.compmedimag.2015.08.001 [DOI] [PubMed] [Google Scholar]
- 6.Sánchez I, Uzcátegui G. Fractals in dentistry. J Dent 2011; 39: 273–92. doi: 10.1016/j.jdent.2011.01.010 [DOI] [PubMed] [Google Scholar]
- 7.Fractal Dimensions [homepage on the Internet] Karperien A, Charles Sturt University, Australia/Canada, Earth 2007-2012. The FracLac Guide: Introduction. Available from: https://imagej.nih.gov/ij/plugins/fraclac/FLHelp/FractalDimension.htm.
- 8.Cross SS. Fractals in pathology. J Pathol 1997; 182: 1–8. doi: 10.1002/(SICI)1096-9896(199705)182:1<1::AID-PATH808>3.0.CO;2-B [DOI] [PubMed] [Google Scholar]
- 9.Baksi BG, Fidler A. Fractal analysis of periapical bone from lossy compressed radiographs: a comparison of two lossy compression methods. J Digit Imaging 2011; 24: 993–8. doi: 10.1007/s10278-011-9383-0 [DOI] [PMC free article] [PubMed] [Google Scholar]
- 10.Zeytinoğlu M, İlhan B, Dündar N, Boyacioğlu H. Fractal analysis for the assessment of trabecular peri-implant alveolar bone using panoramic radiographs. Clin Oral Investig 2015; 19: 519–24. doi: 10.1007/s00784-014-1245-y [DOI] [PubMed] [Google Scholar]
- 11.Kavitha MS, An S-Y, An C-H, Huh K-H, Yi W-J, Heo M-S, et al. Texture analysis of mandibular cortical bone on digital dental panoramic radiographs for the diagnosis of osteoporosis in Korean women. Oral Surg Oral Med Oral Pathol Oral Radiol 2015; 119: 346–56. doi: 10.1016/j.oooo.2014.11.009 [DOI] [PubMed] [Google Scholar]
- 12.Hwang JJ, Lee J-H, Han S-S, Kim YH, Jeong H-G, Choi YJ, et al. Strut analysis for osteoporosis detection model using dental panoramic radiography. Dentomaxillofac Radiol 2017; 46: 20170006–10. doi: 10.1259/dmfr.20170006 [DOI] [PMC free article] [PubMed] [Google Scholar]
- 13.White SC, Rudolph DJ. Alterations of the trabecular pattern of the jaws in patients with osteoporosis. Oral Surg Oral Med Oral Pathol Oral Radiol Endod 1999; 88: 628–35. doi: 10.1016/S1079-2104(99)70097-1 [DOI] [PubMed] [Google Scholar]
- 14.Leite AF, de Souza Figueiredo PT, Caracas H, Sindeaux R, Guimarães ATB, Lazarte L, et al. Systematic review with hierarchical clustering analysis for the fractal dimension in assessment of skeletal bone mineral density using dental radiographs. Oral Radiol 2015; 31: 1–13. doi: 10.1007/s11282-014-0188-y [DOI] [Google Scholar]
- 15.Suer BT, Yaman Z, Buyuksarac B. Correlation of fractal dimension values with implant insertion torque and resonance frequency values at implant recipient sites. Int J Oral Maxillofac Implants 2016; 31: 55–62. doi: 10.11607/jomi.3965 [DOI] [PubMed] [Google Scholar]
- 16.Arsan B, Köse TE, Çene E, Özcan İlknur, İ Özcan. Assessment of the trabecular structure of mandibular condyles in patients with temporomandibular disorders using fractal analysis. Oral Surg Oral Med Oral Pathol Oral Radiol 2017; 123: 382–91. doi: 10.1016/j.oooo.2016.11.005 [DOI] [PubMed] [Google Scholar]
- 17.Moher D, Liberati A, Tetzlaff J, Altman DG, .PRISMA Group . Preferred reporting items for systematic reviews and meta-analyses: the PRISMA statement. Ann Intern Med 2009; 151: 264–9. doi: 10.7326/0003-4819-151-4-200908180-00135 [DOI] [PubMed] [Google Scholar]
- 18.Honda E, Domon M, Sasaki T. A method for determination of fractal dimensions of sialographic images. Invest Radiol 1991; 26: 894–901. doi: 10.1097/00004424-199110000-00012 [DOI] [PubMed] [Google Scholar]
- 19.Wilding RJ, Slabbert JC, Kathree H, Owen CP, Crombie K, Delport P. The use of fractal analysis to reveal remodelling in human alveolar bone following the placement of dental implants. Arch Oral Biol 1995; 40: 61–72. doi: 10.1016/0003-9969(94)00138-2 [DOI] [PubMed] [Google Scholar]
- 20.Law AN, Bollen AM, Chen SK. Detecting osteoporosis using dental radiographs: a comparison of four methods. J Am Dent Assoc 1996; 127: 1734–42. doi: 10.14219/jada.archive.1996.0134 [DOI] [PubMed] [Google Scholar]
- 21.Heo M-S, Park K-S, Lee S-S, Choi S-C, Koak J-Y, Heo S-J, et al. Fractal analysis of mandibular bony healing after orthognathic surgery. Oral Surg Oral Med Oral Pathol Oral Radiol Endod 2002; 94: 763–7. doi: 10.1067/moe.2002.128972 [DOI] [PubMed] [Google Scholar]
- 22.Tosoni GM, Lurie AG, Cowan AE, Burleson JA. Pixel intensity and fractal analyses: detecting osteoporosis in perimenopausal and postmenopausal women by using digital panoramic images. Oral Surgery, Oral Medicine, Oral Pathology, Oral Radiology, and Endodontology 2006; 102: 235–41. doi: 10.1016/j.tripleo.2005.08.020 [DOI] [PubMed] [Google Scholar]
- 23.Yasar F, Akgunlu F. Evaluating mandibular cortical index quantitatively. Eur J Dent 2008; 2: 283–90. [PMC free article] [PubMed] [Google Scholar]
- 24.Demirbaş AK, Ergün S, Güneri P, Aktener BO, Boyacioğlu H. Mandibular bone changes in sickle cell anemia: fractal analysis. Oral Surg Oral Med Oral Pathol Oral Radiol Endod 2008; 106: e41–8. doi: 10.1016/j.tripleo.2008.03.007 [DOI] [PubMed] [Google Scholar]
- 25.Koca H, Ergün S, Güneri P, Boyacıoglu H. Evaluation of trabecular bone healing by fractal analysis and digital subtraction radiography on digitized panoramic radiographs: a preliminary study. Oral Radiol 2010; 26: 1–8. doi: 10.1007/s11282-009-0029-6 [DOI] [Google Scholar]
- 26.Lee D-H, Ku Y, Rhyu I-C, Hong J-U, Lee C-W, Heo M-S, et al. A clinical study of alveolar bone quality using the fractal dimension and the implant stability quotient. J Periodontal Implant Sci 2010; 40: 19–24. doi: 10.5051/jpis.2010.40.1.19 [DOI] [PMC free article] [PubMed] [Google Scholar]
- 27.Créton M, Geraets W, Verhoeven JW, van der Stelt PF, Verhey H, Cune M. Radiographic features of mandibular trabecular bone structure in hypodontia. Clin Implant Dent Relat Res 2012; 14: 241–9. doi: 10.1111/j.1708-8208.2009.00246.x [DOI] [PubMed] [Google Scholar]
- 28.Alman AC, Johnson LR, Calverley DC, Grunwald GK, Lezotte DC, Hokanson JE. Diagnostic capabilities of fractal dimension and mandibular cortical width to identify men and women with decreased bone mineral density. Osteoporos Int 2012; 23: 1631–6. doi: 10.1007/s00198-011-1678-y [DOI] [PubMed] [Google Scholar]
- 29.Koh K-J, Park H-N, Kim K-A. Prediction of age-related osteoporosis using fractal analysis on panoramic radiographs. Imaging Sci Dent 2012; 42: 231–5. doi: 10.5624/isd.2012.42.4.231 [DOI] [PMC free article] [PubMed] [Google Scholar]
- 30.Oliveira ML, Pedrosa EFNC, Cruz AD, Haiter-Neto F, Paula FJA, Watanabe PCA. Relationship between bone mineral density and trabecular bone pattern in postmenopausal osteoporotic Brazilian women. Clin Oral Investig 2013; 17: 1847–53. doi: 10.1007/s00784-012-0882-2 [DOI] [PubMed] [Google Scholar]
- 31.Önem E, Baksı BG, Sogur E. Changes in the fractal dimension, feret diameter, and lacunarity of mandibular alveolar bone during initial healing of dental implants. Int J Oral Maxillofac Implants 2012; 27: 1009–13. [PubMed] [Google Scholar]
- 32.Sansare K, Singh D, Karjodkar F. Changes in the fractal dimension on pre- and post-implant panoramic radiographs. Oral Radiol 2012; 28: 15–23. doi: 10.1007/s11282-011-0075-8 [DOI] [Google Scholar]
- 33.Yasar F, Apaydin B, Yilmaz HH. The effects of image compression on quantitative measurements of digital panoramic radiographs. Med Oral 2012; 17: e1074–81. doi: 10.4317/medoral.17912 [DOI] [PMC free article] [PubMed] [Google Scholar]
- 34.Roberts MG, Graham J, Devlin H. Image texture in dental panoramic radiographs as a potential biomarker of osteoporosis. IEEE Trans Biomed Eng 2013; 60: 2384–92. doi: 10.1109/TBME.2013.2256908 [DOI] [PubMed] [Google Scholar]
- 35.Sindeaux R, Figueiredo PTdeS, de Melo NS, Guimarães ATB, Lazarte L, Pereira FB, et al. Fractal dimension and mandibular cortical width in normal and osteoporotic men and women. Maturitas 2014; 77: 142–8. doi: 10.1016/j.maturitas.2013.10.011 [DOI] [PubMed] [Google Scholar]
- 36.de Molon RS, de Paula WN, Spin-Neto R, Verzola MHA, Tosoni GM, Lia RCC, et al. Correlation of fractal dimension with histomorphometry in maxillary sinus lifting using autogenous bone graft. Braz Dent J 2015; 26: 11–18. doi: 10.1590/0103-6440201300290 [DOI] [PubMed] [Google Scholar]
- 37.Kavitha MS, Park S-Y, Heo M-S, Chien S-I. Distributional variations in the quantitative cortical and trabecular bone radiographic measurements of mandible, between male and female populations of Korea, and its utilization. PLoS One 2016; 11: e0167992–13. doi: 10.1371/journal.pone.0167992 [DOI] [PMC free article] [PubMed] [Google Scholar]
- 38.Apolinário AC, Sindeaux R, de Souza Figueiredo PT, Guimarães ATB, Acevedo AC, Castro LC, et al. Dental panoramic indices and fractal dimension measurements in osteogenesis imperfecta children under pamidronate treatment. Dentomaxillofac Radiol 2016; 45: 20150400–9. doi: 10.1259/dmfr.20150400 [DOI] [PMC free article] [PubMed] [Google Scholar]
- 39.Camargo AJ, Cortes ARG, Aoki EM, Baladi MG, Arita ES, Watanabe PCA. Diagnostic performance of fractal dimension and radiomorphometric indices from digital panoramic radiographs for screening low bone mineral density. Braz J Oral Sci 2016; 15: 131–6. doi: 10.20396/bjos.v15i2.8648764 [DOI] [Google Scholar]
- 40.Gumussoy I, Miloglu O, Cankaya E, Bayrakdar IS. Fractal properties of the trabecular pattern of the mandible in chronic renal failure. Dentomaxillofac Radiol 2016; 45: 20150389. doi: 10.1259/dmfr.20150389 [DOI] [PMC free article] [PubMed] [Google Scholar]
- 41.Tözüm TF, Dursun E, Uysal S. Radiographic fractal and clinical resonance frequency analyses of posterior mandibular dental implants: their possible association with mandibular cortical index with 12-month follow-up. Implant Dent 2016; 25: 789–95. doi: 10.1097/ID.0000000000000496 [DOI] [PubMed] [Google Scholar]
- 42.Demiralp Kemal Özgür, Kurşun-Çakmak Emine Şebnem, Bayrak S, Akbulut N, Atakan C, Orhan K. Trabecular structure designation using fractal analysis technique on panoramic radiographs of patients with bisphosphonate intake: a preliminary study. Oral Radiol 2019; 35: 23–8. doi: 10.1007/s11282-018-0321-4 [DOI] [PubMed] [Google Scholar]
- 43.Kurşun-Çakmak Emine Şebnem, Bayrak S. Comparison of fractal dimension analysis and panoramic-based radiomorphometric indices in the assessment of mandibular bone changes in patients with type 1 and type 2 diabetes mellitus. Oral Surg Oral Med Oral Pathol Oral Radiol 2018; 126: 184–91. doi: 10.1016/j.oooo.2018.04.010 [DOI] [PubMed] [Google Scholar]
- 44.Göller Bulut D, Bayrak S, Uyeturk U, Ankarali H. Mandibular indexes and fractal properties on the panoramic radiographs of the patients using aromatase inhibitors. Br J Radiol 2018; 91: 20180442. doi: 10.1259/bjr.20180442 [DOI] [PMC free article] [PubMed] [Google Scholar]
- 45.Bollen AM, Taguchi A, Hujoel PP, Hollender LG. Fractal dimension on dental radiographs. Dentomaxillofac Radiol 2001; 30: 270–5. doi: 10.1038/sj.dmfr.4600630 [DOI] [PubMed] [Google Scholar]
- 46.Fernandes MA, Ribeiro Rosa EA, Johann ACBR, GRÉGIO ANAMT, Trevilatto PC, Azevedo-Alanis LR. Applicability of fractal dimension analysis in dental radiographs for the evaluation of renal osteodystrophy. Fractals 2016; 24: 1650010–8. doi: 10.1142/S0218348X16500109 [DOI] [Google Scholar]
- 47.Barngkgei I, Halboub E, Almashraqi A. Effect of bisphosphonate treatment on the jawbone: an exploratory study using periapical and panoramic radiographic evaluation. Oral Radiol 2019; 35: 159–70. doi: 10.1007/s11282-018-0358-4 [DOI] [PubMed] [Google Scholar]
- 48.Shrout MK, Roberson B, Potter BJ, Mailhot JM, Hildebolt CF. A comparison of 2 patient populations using fractal analysis. J Periodontol 1998; 69: 9–13. doi: 10.1902/jop.1998.69.1.9 [DOI] [PubMed] [Google Scholar]
- 49.Chen S-K, Oviir T, Lin C-H, Leu L-J, Cho B-H, Hollender L. Digital imaging analysis with mathematical morphology and fractal dimension for evaluation of periapical lesions following endodontic treatment. Oral Surg Oral Med Oral Pathol Oral Radiol Endod 2005; 100: 467–72. doi: 10.1016/j.tripleo.2005.05.075 [DOI] [PubMed] [Google Scholar]
- 50.Yasar F, Akgünlü F. Fractal dimension and lacunarity analysis of dental radiographs. Dentomaxillofac Radiol 2005; 34: 261–7. doi: 10.1259/dmfr/85149245 [DOI] [PubMed] [Google Scholar]
- 51.Yaşar F, Akgünlü F. The differences in panoramic mandibular indices and fractal dimension between patients with and without spinal osteoporosis. Dentomaxillofac Radiol 2006; 35: 1–9. doi: 10.1259/dmfr/97652136 [DOI] [PubMed] [Google Scholar]
- 52.Rothe LE, Bollen A-M, Little RM, Herring SW, Chaison JB, Chen CS-K, et al. Trabecular and cortical bone as risk factors for orthodontic relapse. Am J Orthod Dentofacial Orthop 2006; 130: 476–84. doi: 10.1016/j.ajodo.2005.03.023 [DOI] [PubMed] [Google Scholar]
- 53.Veltri M, Balleri P, Ferrari M. Damping factor for monitoring the bone interface at dental implants. Clin Oral Implants Res 2007; 18: 738–42. doi: 10.1111/j.1600-0501.2007.01412.x [DOI] [PubMed] [Google Scholar]
- 54.Updike SX, Nowzari H. Fractal analysis of dental radiographs to detect periodontitis-induced trabecular changes. J Periodontal Res 2008; 43: 658–64. doi: 10.1111/j.1600-0765.2007.01056.x [DOI] [PubMed] [Google Scholar]
- 55.Yu Y-Y, Chen H, Lin C-H, Chen C-M, Oviir T, Chen S-K, et al. Fractal dimension analysis of periapical reactive bone in response to root canal treatment. Oral Surg Oral Med Oral Pathol Oral Radiol Endod 2009; 107: 283–8. doi: 10.1016/j.tripleo.2008.05.047 [DOI] [PubMed] [Google Scholar]
- 56.Huang CC, Chen JC, Chang YC, Jeng JH, Chen CM. A fractal dimensional approach to successful evaluation of apical healing. Int Endod J 2013; 46: 523–9. doi: 10.1111/iej.12020 [DOI] [PubMed] [Google Scholar]
- 57.Kozakiewicz M, Chaberek S, Bogusiak K. Using fractal dimension to evaluate alveolar bone defects treated with various bone substitute materials. Open Medicine 2013; 8: 776–89. doi: 10.2478/s11536-013-0197-y [DOI] [Google Scholar]
- 58.Mu T-J, Lee D-W, Park K-H, Moon I-S. Changes in the fractal dimension of peri-implant trabecular bone after loading: a retrospective study. J Periodontal Implant Sci 2013; 43: 209–14. doi: 10.5051/jpis.2013.43.5.209 [DOI] [PMC free article] [PubMed] [Google Scholar]
- 59.Amer ME, Heo M-S, Brooks SL, Benavides E. Anatomical variations of trabecular bone structure in intraoral radiographs using fractal and particles count analyses. Imaging Sci Dent 2012; 42: 5–12. doi: 10.5624/isd.2012.42.1.5 [DOI] [PMC free article] [PubMed] [Google Scholar]
- 60.Abdulhameed EA, Al-Rawi NH, Uthman AT, Samsudin AR. Bone texture fractal dimension analysis of Ultrasound-Treated bone around implant site: a double-blind clinical trial. Int J Dent 2018; 2018: 1–10. doi: 10.1155/2018/2672659 [DOI] [PMC free article] [PubMed] [Google Scholar]
- 61.Vijayalakshmi K, Krithika CL, Raghuram PH, Kannan A. Fractal analysis of trabecular bone pattern in the mandible as an indicator of osteoporosis in women - A clinical study. Asian J Pharm Clin Res 2018; 11: 157–60. [Google Scholar]
- 62.Kulczyk T, Czajka-Jakubowska A, Przystańska A. A comparison between the implant stability quotient and the fractal dimension of alveolar bone at the implant site. Biomed Res Int 2018; 2018: 1–7. doi: 10.1155/2018/4357627 [DOI] [PMC free article] [PubMed] [Google Scholar]
- 63.Southard TE, Southard KA, Lee A. Alveolar process fractal dimension and postcranial bone density. Oral Surg Oral Med Oral Pathol Oral Radiol Endod 2001; 91: 486–91. doi: 10.1067/moe.2001.112598 [DOI] [PubMed] [Google Scholar]
- 64.Torres SR, Chen CSK, Leroux BG, Lee PP, Hollender LG, Schubert MM. Fractal dimension evaluation of cone beam computed tomography in patients with Bisphosphonate-associated osteonecrosis. Dentomaxillofac Radiol 2011; 40: 501–5. doi: 10.1259/dmfr/14636637 [DOI] [PMC free article] [PubMed] [Google Scholar]
- 65.González-Martín O, Lee EA, Veltri M. Cbct fractal dimension changes at the apex of immediate implants placed using Undersized drilling. Clin Oral Implants Res 2012; 23: 954–7. doi: 10.1111/j.1600-0501.2011.02246.x [DOI] [PubMed] [Google Scholar]
- 66.Gaalaas L, Henn L, Gaillard PR, Ahmad M, Islam MS. Analysis of trabecular bone using site-specific fractal values calculated from cone beam CT images. Oral Radiol 2014; 30: 179–85. doi: 10.1007/s11282-013-0163-z [DOI] [Google Scholar]
- 67.Chisari JR, McGorray SP, Nair M, Wheeler TT. Variables affecting orthodontic tooth movement with clear aligners. Am J Orthod Dentofacial Orthop 2014; 145(4 Suppl): S82–S91. doi: 10.1016/j.ajodo.2013.10.022 [DOI] [PubMed] [Google Scholar]
- 68.Ling H, Yang X, Li P, Megalooikonomou V, Xu Y, Yang J. Cross gender-age trabecular texture analysis in cone beam CT. Dentomaxillofac Radiol 2014; 43: 20130324–8. doi: 10.1259/dmfr.20130324 [DOI] [PMC free article] [PubMed] [Google Scholar]
- 69.Mochizuki N, Sugino N, Ninomiya T, Yoshinari N, Udagawa N, Taguchi A. Association of cortical shape of the mandible on panoramic radiographs with mandibular trabecular bone structure in Japanese adults: a cone-beam CT-image analysis. Oral Radiol 2014; 30: 160–7. doi: 10.1007/s11282-013-0155-z [DOI] [Google Scholar]
- 70.Avsever SH, Orhan K, Özen T, Ü K, Görgülü S. Evaluation of mandibular bone structure in sickle cell anemia patients. Gülhane Tip Derg 2015; 57: 11–15. [Google Scholar]
- 71.Kwak KH, Kim SS, Kim Y-I, Kim Y-D. Quantitative evaluation of midpalatal suture maturation via fractal analysis. Korean J Orthod 2016; 46: 323–30. doi: 10.4041/kjod.2016.46.5.323 [DOI] [PMC free article] [PubMed] [Google Scholar]
- 72.Mostafa RA, Arnout EA, Abo El-Fotouh MM. Feasibility of cone beam computed tomography radiomorphometric analysis and fractal dimension in assessment of postmenopausal osteoporosis in correlation with dual X-ray absorptiometry. Dentomaxillofac Radiol 2016; 45: 20160212–8. doi: 10.1259/dmfr.20160212 [DOI] [PMC free article] [PubMed] [Google Scholar]
- 73.Kang D, Kwak K-H, Kim S-S, Park S-B, Son W-S, Kim Y-I. Application of fractal analysis of the midpalatal suture for estimation of pubertal growth spurts. Oral Radiol 2017; 33: 199–203. doi: 10.1007/s11282-016-0266-4 [DOI] [Google Scholar]
- 74.Kayipmaz S, Akçay S, Sezgin Ömer Said, Sezgin OS. Osteoporotic mandibular changes caused by type 2 diabetes mellitus: a comparative study by cone beam computed tomography imaging. Oral Radiol 2017; 33: 108–16. doi: 10.1007/s11282-016-0252-x [DOI] [Google Scholar]
- 75.Kayipmaz S, Akçay S, Sezgin Ömer Said, Çandirli C. Trabecular structural changes in the mandibular condyle caused by degenerative osteoarthritis: a comparative study by cone-beam computed tomography imaging. Oral Radiol 2019; 35: 51–8. doi: 10.1007/s11282-018-0324-1 [DOI] [PubMed] [Google Scholar]
- 76.Alcântara CEP, Castro MAA, NORONHA MSde, Martins-Junior PA, MENDES RdeM, Caliari MV, et al. Hyaluronic acid accelerates bone repair in human dental sockets: a randomized triple-blind clinical trial. Braz Oral Res 2018; 32: 1–10. doi: 10.1590/1807-3107bor-2018.vol32.0084 [DOI] [PubMed] [Google Scholar]
- 77.Servais JA, Gaalaas L, Lunos S, Beiraghi S, Larson BE, Leon-Salazar V. Alternative cone-beam computed tomography method for the analysis of bone density around impacted maxillary canines. Am J Orthod Dentofacial Orthop 2018; 154: 442–9. doi: 10.1016/j.ajodo.2018.01.008 [DOI] [PubMed] [Google Scholar]
- 78.Shrout MK, Hildebolt CF, Potter BJ. The effect of varying the region of interest on calculations of fractal index. Dentomaxillofac Radiol 1997; 26: 295–8. doi: 10.1038/sj.dmfr.4600260 [DOI] [PubMed] [Google Scholar]
- 79.Lane N, Armitage GC, Loomer P, Hsieh S, Majumdar S, Wang H-Y, et al. Bisphosphonate therapy improves the outcome of conventional periodontal treatment: results of a 12-month, randomized, placebo-controlled study. J Periodontol 2005; 76: 1113–22. doi: 10.1902/jop.2005.76.7.1113 [DOI] [PubMed] [Google Scholar]
- 80.Yasar F, Yesilova E, Akgünlü F. Alveolar bone changes under overhanging restorations. Clin Oral Investig 2010; 14: 543–9. doi: 10.1007/s00784-009-0334-9 [DOI] [PubMed] [Google Scholar]
- 81.Arisaka R, Matsuo A, Chiba H, Takahashi H, Takeuchi S, Watanabe M, et al. Preliminary clinical study to evaluate the relationship between systemic bone turnover and the microstructure of the alveolar bone. Oral Science International 2009; 6: 27–35. doi: 10.1016/S1348-8643(09)80011-6 [DOI] [Google Scholar]
- 82.González-García R, Monje F. The reliability of cone-beam computed tomography to assess bone density at dental implant recipient sites: a histomorphometric analysis by micro-CT. Clin Oral Implants Res 2013; 24: 871–9. doi: 10.1111/j.1600-0501.2011.02390.x [DOI] [PubMed] [Google Scholar]
- 83.Dursun E, Dursun CK, Eratalay K, Orhan K, Celik HH, Tözüm TF. Do porous titanium granule grafts affect bone microarchitecture at augmented maxillary sinus sites? A pilot Split-Mouth human study. Implant Dent 2015; 24: 427–33. doi: 10.1097/ID.0000000000000275 [DOI] [PubMed] [Google Scholar]
- 84.Chikui T, Tokumori K, Yoshiura K, Oobu K, Nakamura S, Nakamura K. Sonographic texture characterization of salivary gland tumors by fractal analyses. Ultrasound Med Biol 2005; 31: 1297–304. doi: 10.1016/j.ultrasmedbio.2005.05.012 [DOI] [PubMed] [Google Scholar]
- 85.Chikui T, Shimizu M, Kawazu T, Okamura K, Shiraishi T, Yoshiura K. A quantitative analysis of sonographic images of the salivary gland: a comparison between sonographic and sialographic findings. Ultrasound Med Biol 2009; 35: 1257–64. doi: 10.1016/j.ultrasmedbio.2009.03.005 [DOI] [PubMed] [Google Scholar]
- 86.Honda E, Domon M, Sasaki T, Obayashi N, Ida M. Fractal dimensions of ductal patterns in the parotid glands of normal subjects and patients with Sjögren syndrome. Invest Radiol 1992; 27: 790–5. doi: 10.1097/00004424-199210000-00008 [DOI] [PubMed] [Google Scholar]
- 87.Otis LL, Hong JS-H, Tuncay OC. Bone structure effect on root resorption. Orthod Craniofac Res 2004; 7: 165–77. doi: 10.1111/j.1601-6343.2004.00282.x [DOI] [PubMed] [Google Scholar]
- 88.Kiljunen T, Kaasalainen T, Suomalainen A, Kortesniemi M. Dental cone beam CT: a review. Phys Med 2015; 31: 844–60. doi: 10.1016/j.ejmp.2015.09.004 [DOI] [PubMed] [Google Scholar]
- 89.Pauwels R, Faruangsaeng T, Charoenkarn T, Ngonphloy N, Panmekiate S. Effect of exposure parameters and voxel size on bone structure analysis in CBCT. Dentomaxillofac Radiol 2015; 44: 20150078–9. doi: 10.1259/dmfr.20150078 [DOI] [PMC free article] [PubMed] [Google Scholar]
- 90.Marotti J, Heger S, Tinschert J, Tortamano P, Chuembou F, Radermacher K, et al. Recent advances of ultrasound imaging in dentistry--a review of the literature. Oral Surg Oral Med Oral Pathol Oral Radiol 2013; 115: 819–32. doi: 10.1016/j.oooo.2013.03.012 [DOI] [PubMed] [Google Scholar]
- 91.Magat G, Ozcan Sener S. Evaluation of trabecular pattern of mandible using fractal dimension, bone area fraction, and gray scale value: comparison of cone-beam computed tomography and panoramic radiography. Oral Radiol 2019; 35: 35–42. doi: 10.1007/s11282-018-0316-1 [DOI] [PubMed] [Google Scholar]
- 92.Irie MS, Rabelo GD, Spin-Neto R, Dechichi P, Borges JS, Soares PBF. Use of Micro-Computed tomography for bone evaluation in dentistry. Braz Dent J 2018; 29: 227–38. doi: 10.1590/0103-6440201801979 [DOI] [PubMed] [Google Scholar]