

Abstract

S-Adenosyl-l-methionine (SAM) is the central cofactor in the radical SAM enzyme superfamily, responsible for a vast number of transformations in primary and secondary metabolism. In nearly all of these reactions, the reductive cleavage of SAM is proposed to produce a reactive species, 5′-deoxyadenosyl radical, which initiates catalysis. While the mechanistic details in many cases are well-understood, the reductive cleavage of SAM remains elusive. In this manuscript, we have measured the solution peak potential of SAM to be ∼−1.4 V (v SHE) and show that under controlled potential conditions, it undergoes irreversible fragmentation to the 5′-deoxyadenosyl radical. While the radical intermediate is not directly observed, its presence as an initial intermediate is inferred by the formation of 8,5′-cycloadenosine and by H atom incorporation into 5′-deoxyadenosine from solvent exchangeable site. Similarly, 2-aminobutyrate is also observed under electrolysis conditions. The implications of these results in the context of the reductive cleavage of SAM by radical SAM enzymes are discussed.
Introduction
S-Adenosyl-l-methionine (SAM) is most widely recognized for its role as the cellular methyl donor to a wide variety of acceptors. However, pioneering studies by Knappe, Frey, and colleagues in the 1980s demonstrated that SAM is the key cofactor in reactions that involve radical mediated transformations.1−3 Prior to the explosive growth of genome sequences, bioinformatic analysis using a conserved sequence motif, CX3CX2C,4 led to the discovery and classification of these enzymes into the radical SAM superfamily. More recent sequence-based analyses have revealed >100, 000 radical SAM enzymes in all domains of life,5,6 and mechanistic paradigms for many have been established.6,7 Since the cysteine signature sequence that is often associated with this class of enzymes is not always present,8−11 it is likely that more members will be discovered as more sophisticated bioinformatic methods are brought to the fore. Despite activation of SAM underpinning the function of all members of the radical SAM superfamily, it reamins underexplored.
The unifying property of nearly all radical SAM enzymes is the coordination of a [4Fe-4S] site-differentiated cluster, which binds SAM and activates it for reductive cleavage12−14 (reviewed in ref (15)). This complex serves as the starting point for activating SAM for a wide variety of radical-mediated reactions. Usually the reductive cleavage of SAM, mediated by the cluster, is thought to generate a 5′-deoxyadenosyl radical (dAdo•) to initiate the catalytic cycle. While dAdo• nearly always abstracts an H atom to form 5′-deoxyadenosine (dAdo), alternative outcomes for both SAM and dAdo• have been documented. In Dph2, cleavage of SAM produces the 2-aminobutyrate (2-AB) radical, which undergoes addition to a His residue in elongation factor-2 (EF-2) to generate diphthamide.16,17 In a cobalamin-independent glycerol dehydratase (GD), the GD-activating enzyme harnesses the 2-AB that is formed from reductive cleavage of SAM to form a glycyl radical on GD to support catalysis.18 In the biogenesis of futalosine19,20 and peptidylnucleoside antibiotics21 dAdo• instead adds to the substrate generating a dAdo-containing product. In yet another variation, in a subset of radical SAM enzymes the cluster neither binds nor reductively cleaves SAM.22 These notable exceptions notwithstanding, formation of dAdo• is key to reactivity of majority of the radical SAM enzymes discovered to date.
In the earliest models of activation, the reduction of the iron–sulfur cluster from the resting +2 to the catalytic +1 oxidation state is followed by reductive fragmentation of SAM to generate dAdo• and methionine (Met).1−3,23−25 Many lines of evidence support this model. First, the reduction of the cluster to the +1 state is required for catalytic activity.26,27 Second, SAM interacts directly with the unique iron atom of the cluster through its amino and carboxylate moieties.14 This unique coordination was first observed with pyruvate formate-lyase activating enzyme (PFL-AE)12,13,28 and has since been shown to be a common feature of nearly all radical SAM enzymes. Third, in lysine 2,3-aminomutase (LAM), spectroscopic studies with a selenium analog in place of sulfur in SAM have shown that the Se atom of Met remains within 2.7 Å of the unique iron in the cluster.14,29 Finally, large numbers of structural studies across the superfamily place the abstracted H atom within a van der Waals radius of the 5′-position of SAM.9,10,30−46 All of these observations suggest an intimate role for the cluster in reductive activation of the cofactor.
While all biochemical and structural studies suggest that SAM undergoes a process that ultimately produces dAdo•, the reduction of SAM is associated with significant thermodynamic mismatch. Aryl sulfonium salts display cathodic peak potentials (Epc) that approach −0.150 V versus the standard hydrogen electrode (SHE).47 Based on polarographic studies by Colichman et al. in 1953, it is widely accepted that the peak potentials of trimethylsulfonium salts are significantly lower (∼−1.6 V), which pose a significant challenge for radical SAM enzymes where midpoint potentials (Ep) of the cluster responsible for activating SAM, the so-called radical SAM cluster, falls within the range of −0.450 to −0.550 V.22,48−53 While Frey and colleagues have demonstrated that, in LAM,51 the reduction potential of the iron–sulfur cluster trends more negative as the enzyme binds the substrate/substrate analog and becomes poised for catalysis, a substantial thermodynamic mismatch still remains.
The mechanism by which SAM is reductively cleaved in radical SAM enzymes is not well understood. Moreover, to our knowledge, no solution measurements of the redox properties of SAM are available. In this manuscript, we carried out voltammetric and amperometric studies to measure the peak potential of SAM under aqueous conditions. We demonstrate that under controlled potential conditions, the cleavage of SAM is a one electron process that leads ultimately to the formation of dAdo and 2-AB. The implications of these results to understanding the mechanism of cleavage of SAM by radical SAM enzymes in the context of the current mechanistic imperatives are discussed.
Experimental Procedures
Enzymatic Preparation of SAM
Synthesis and purification of SAM was performed as previously described.54
Cyclic Voltammetry of SAM
All solvents were cycled into a Coy anoxic chamber (maintained at 95% N2/5% H2) and deoxygenated overnight. The reaction mixtures were prepared by combining an aliquot (50 μL) from an aqueous stock solution of SAM (Sigma) with an equal volume of a 2 M solution of KI. The solution was vigorously stirred before adding 0.45 mL of solvent. For the reactions performed in acetonitrile or ethanol, it was necessary to include 50 μL of water to solubilize SAM and KI. Prior to each scan, a 3 mm glassy-carbon working electrode (CH Instruments) was polished with 0.05 μm alumina. Next, the working, calomel reference (CH Instruments) and platinum counter electrodes (Pine Research) were submerged into the solution. Voltammetry was performed using a Model 1200C hand-held potentiostat (CH Instruments), with a scan window of −0.05 to −1.6 or −1.85 V. Following each set of CV scans, a 0.2 mM aqueous solution of methyl viologen (MV) containing 0.1 M KCl was scanned at a rate of 100 mV/s as a control. All voltammetric measurements were corrected to the standard hydrogen electrode potential (SHE).
Controlled Potential Electrolysis of SAM
The reaction mixtures contained 5 mM SAM, 50 mM PIPES·NAOH (pH 7.4), and 0.2 M KI in a total volume of 1 mL. The solution was stirred to mix the components. Prior to initiating the reaction, mixing was stopped and prepolished 3 mm glassy carbon working, calomel reference, and platinum counter electrodes were submerged in the solution. An aliquot of the solution (70 μL) was withdrawn as a pre-electrolysis standard, and the reaction was initiated by poising the cell at the desired potential. An aliquot (70 μL) of the mixture was withdrawn at various times after initiating the reaction. The solution was stirred after each withdrawal, but the stirring was off during the electrolysis. All aliquots from the reaction were frozen at the end of the experiment. For the reactions performed in D2O all components were dissolved in D2O except the 1 M PIPES·NaOH (pH 7.4) stock solution. The final D2O content of the reaction mixture was ∼95%.
Analysis of Products of Controlled Potential Electrolysis of SAM
An aliquot (30 μL) of each of the time points was analyzed with a Vanquish UHPLC (Thermo Fisher) with a diode array detector, which had been interfaced to a Q-Exactive mass spectrometer to obtain in-line mass spectrometric data of all species. The separation of hydrophobic products was performed on a Hypersil Gold C-18 column (2.1 × 150 mm, 1.9 μm particle size) column with a 11.5 min gradient of 0–30% acetonitrile in 0.1% aqueous TFA. The dAdo was quantified by comparing the peak area to dAdo standards. Detection and quantification of the 2-aminobutyrate product was achieved by mixing an aliquot (20 μL) with 80 μL of acetonitrile and analyzed on a SeQuant Zic-cHILIC column (2.1 × 100 mm, 3 μm particle size) over a 30 min gradient from 20% Buffer B to 67% Buffer B in Buffer A (Buffer A 90% ACN, 10% 25 mM ammonium acetate; Buffer B 10% ACN, 90% 25 mM ammonium acetate). 2-AB was quantified by comparing the EIC peak area to those obtained from a standard curve. All MS measurements were performed in the positive ion mode with a resolution setting of 100 000 and m/z range of 50 to 650. MS/MS was performed by fragmentation in the high-energy collisional dissociation (HCD) cell of the instrument at various power settings, as noted in the results.
Analysis of Homolysis of 5′-Deoxyadenosylcobalamin (AdoCbl)
An aqueous 0.1 mM solution of 5′-deoxyadenosylcobalamin was prepared in the anoxic chamber. The solution was transferred to an anaerobic cuvette and removed from the chamber. A UV–visible spectrum was recorded using an Agilent 8453 diode array spectrometer and homolysis was initiated using a table top lamp. Spectra of the sample were recorded at several points during photolysis. A sample was withdrawn at the end of 30 min, at which point homolysis was complete. The LC-MS/MS analysis of the pre- and posthomolysis samples was carried out as described above for the controlled potential experiments.
Results
Cyclic Voltammetry of Bulk SAM
Anaerobic cyclic voltammetry of SAM was carried out using a three-electrode configuration with a glassy-carbon working electrode in deoxygenated solvents spanning a wide range of dielectric constants (ε) to investigate environmental influences on the Epc of SAM. Representative scans are shown in Figure 1. In each case, scans in the cathodic direction show an Epc of ∼−1.4 to −1.52 V which, at the lower limit, is over 0.2 V more oxidative than the aqueous reduction of trimethyl sulfonium salts.55 However, regardless of the solvent, all scans in the anodic direction are featureless, indicating that the reduction of SAM is irreversible and correlates with previous observations of sulfonium salt reduction47,56−59 and related sulfonamides.60
Figure 1.
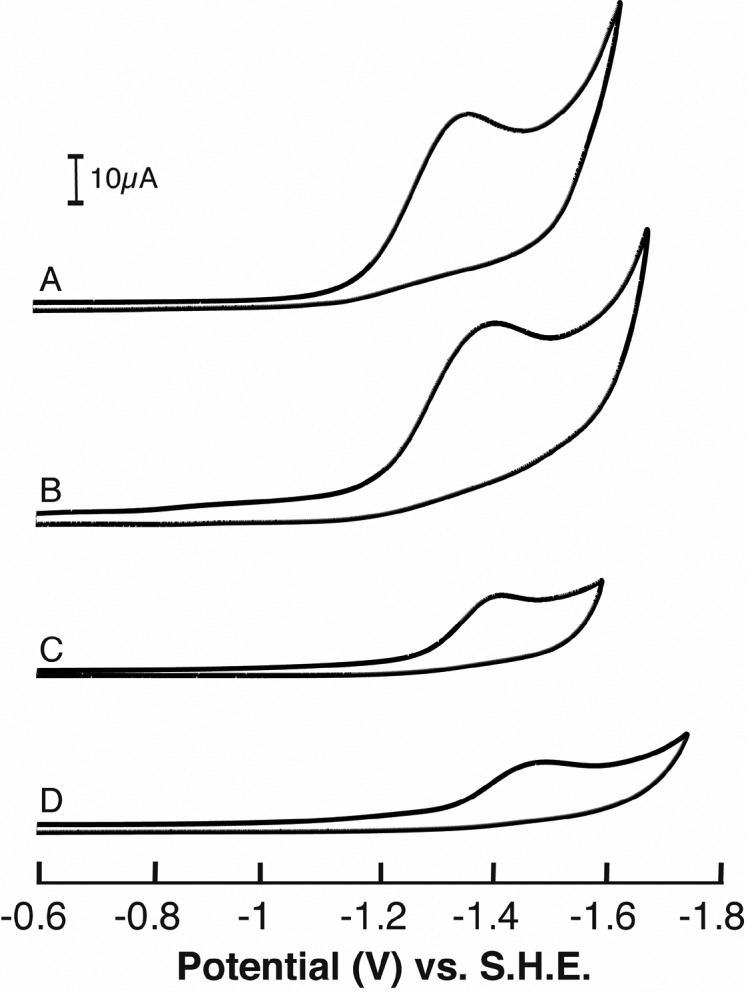
Cyclic voltammograms of SAM in (a) water at 120 mV/s, (b) acetonitrile at 110 mV/s, (c) ethanol at 85 mV/s, and (d) tetrahydrofuran at 100 mV/s.
In control experiments we find a linear relationship between the height of the peak current (ip) and the square root of scan rate (see Figures S1 and S2), indicating that the reduction of SAM is limited by diffusion. To ensure the small solvent-dependent differences in the peak potentials are significant, after each set of scans, a CV of methyl viologen (Figure S3) was obtained following numerous scans at various scan rates (such as those shown in Figure S1). These controls show that the midpoint potentials and peak separation values of the methyl viologen controls remain internally consistent. Finally, the reductive peak potential of SAM is not sensitive to the identity of the counterion (KBr, KCl, or KI), or to the source of SAM (synthetic or commercial (Figure S4). The CV profiles and peak potentials are independent of the supporting counterion or the stock of SAM. Therefore, in all subsequent experiments, we employ KI as the supporting counterion and commercially obtained SAM.
Previous electrochemical studies of sulfonium59 and iodinium61 salts demonstrated that covalent functionalization of the glassy carbon electrode can occur upon reductive cleavage. To determine if covalent attachment to the surface was occurring, a solution of SAM in acetonitrile was subjected to iterative CV scans. The measured Epc remains at −1.4 V (Figure S5i,ii). Upon applying a potential of −1.6 V for 300 s, the Epc moves toward a more oxidative position of −1.2 V (Figure S5iii), which, in subsequent scans, slowly trends toward the initial value of −1.4 V (Figure S5iv,v). These results support the transient, reversible association of SAM to the glassy carbon working electrode surface during electrolysis. Therefore, the measured peak potentials are not significantly affected by surface passivation.
SAM Cleaves under Reducing Conditions to Produce dAdo
We next examined the products of reductive cleavage of SAM. In these experiments, SAM and the supporting electrolyte KI were mixed under anaerobic conditions. The reactions were poised at potentials ranging from −0.8 to −2.8 V, and aliquots were withdrawn at various times after initiating the reduction. dAdo is readily detected by LC-MS analysis of the samples (Figure 2A). The rate of formation of dAdo at each potential was determined by quantifying the peak area of dAdo formed during electrolysis by comparing it to a known dAdo standard curve. Figure 2B shows a representative example of the rate data at −1.5 V. Plots of the rate of formation of 5′-dAdo versus cell potential (Figure 2C) reveal a clear midpoint potential for the cleavage of SAM which is centered at −1.4 V. This value agrees remarkably well with data obtained from the CV experiments. We note that the 5 mM SAM used in all these measurements was sufficient to achieve the maximal cleavage rate under the experimental conditions.
Figure 2.

SAM is cleaved under reducing conditions to produce dAdo. (A) UHPLC trace of authentic dAdo standard (upper), extract ion chromatogram (EIC) of m/z 252.11 corresponding to dAdo from authentic standard (middle) and dAdo from electrolysis of SAM (lower). The small difference in retention times observed between UV and MS is the result of the distance between the UV–visible detector and the in-line MS analyzer. (B) Representative dAdo versus time plot at −1.5 V. dAdo standards were used to quantify dAdo. (C) Rate of dAdo as a function of cell potential reveals a midpoint of ∼−1.4 V vs SHE.
The reductive cleavage of SAM generates Met and dAdo•, which is presumably quenched in solution by a hydrogen atom derived from a solvent exchangeable site. We note that in enzyme catalyzed reactions, dAdo is often formed even in the absence of substrate due to abortive cleavage cycles, which experiments in D2O have shown can be quenched by a solvent exchangeable sites. The MS of dAdo exhibits a major base peak at m/z of 252 (Figure 3A). The relative abundances of the base peak and the corresponding +1 and +2 natural abundance isotope peaks are 100% to 10.8% and 0.6%, respectively. These are consistent with the theoretical values. By contrast, when the same experiment is carried out in 95% D2O, in addition to the major base peak, a substantial peak at m/z of 253.1145 (Figure 3B), which is within 5 ppm of that expected for dAdo containing a single deuterium atom, is observed. The source of this deuterium is not known, but we presume it is derived from a solvent exchangeable site. We also see unlabeled dAdo, albeit at much smaller amounts, which could arise from dAdo• being quenched by nonexchangeable sites, such as the buffer, or sites that exchange with the small amount of H2O present. These data unambiguously establish dAdo is a product of the controlled potential reduction of SAM.
Figure 3.
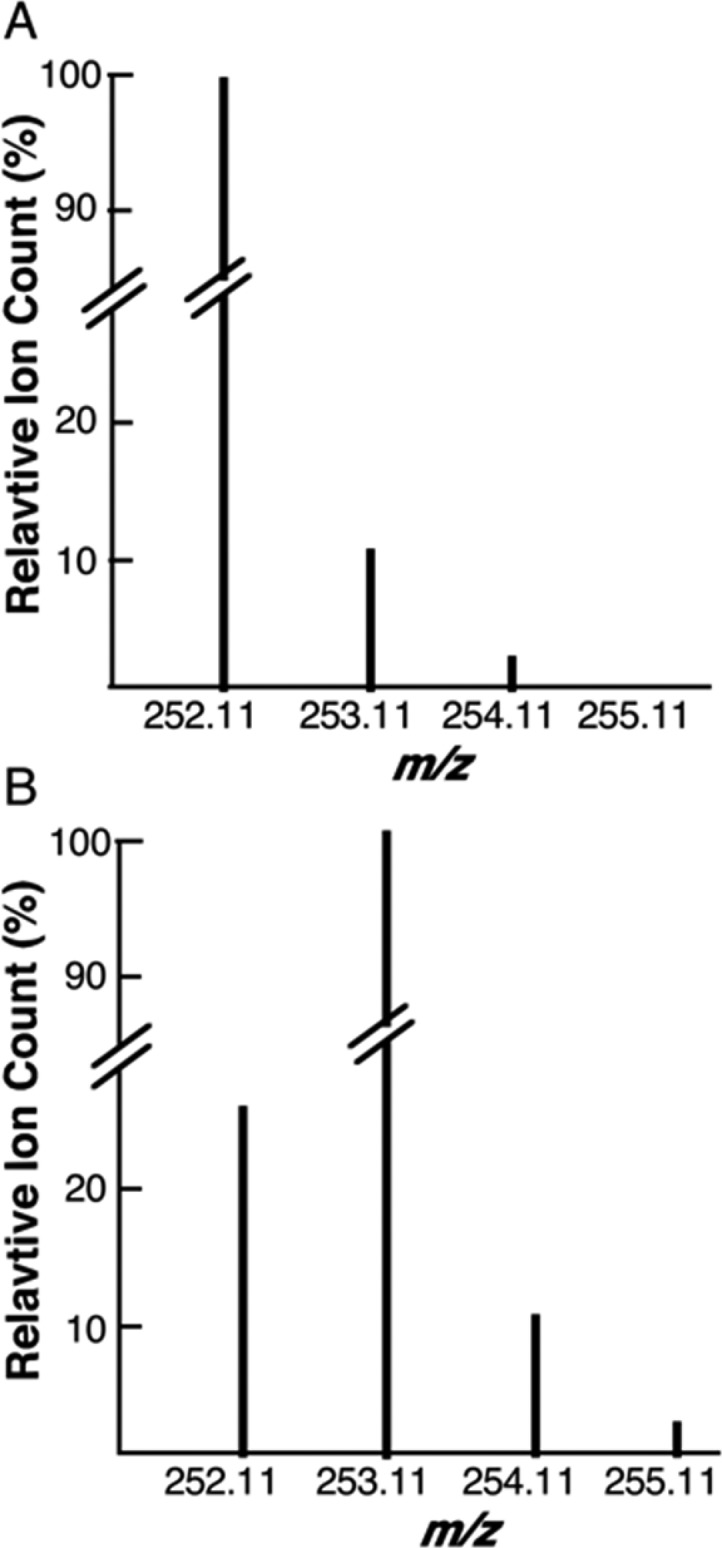
Isotope incorporation from bulk solvent into dAdo. Isotopic peak distribution of dAdo when electrochemically reduced in (A) H2O or (B) D2O.
dAdo Formation: A One Electron Process
While deuterium incorporation into dAdo suggests that dAdo• forms in the reductive cleavage of SAM, it can also undergo a secondary reduction, followed by protonation to produce 5′-dAdo. Frey and Abeles demonstrated that when adenosylcobalamin (AdoCbl) is photolyzed under anaerobic conditions, 8,5′-cycloadenosine (cyc-dAdo) is one of the observed products.62,63 The formation of cyc-dAdo presumably occurs through a radical addition between the unpaired electron at the 5′-position and the C-8 of the base. We reasoned that observation of cyc-dAdo would implicate the formation of dAdo• during controlled potential electrolysis of SAM. As an initial control, we carried out anaerobic photolysis of AdoCbl and analyzed samples before and after complete cleavage of the molecule. In our experimental setup, exposure of a 0.1 mM solution of AdoCbl in water to light for 30 min leads to the disappearance of the AdoCbl features at 520 nm and the appearance of cob(II)alamin at 475 nm (Figure 4A). We observe no oxidation of the cob(II)alamin, which is reasonable considering that oxygen is excluded in these experiments. As expected, LC-MS analysis of the reaction mixture before and after exposure to light shows that the homolysis leads to the formation of dAdo, which has the same retention time and mass (m/z = 252) of that formed in the controlled potential experiments with SAM (compare Figures 4B and 2A). Formation of dAdo requires light and did not form if the sample was not photolyzed. To identify the presence of cyc-dAdo, the extracted ion chromatograms from samples that were removed before and after photolysis of AdoCbl were examined for species with m/z of 250. The EIC reveal two peaks (at 3.8 and 10.6 min) (Figure 4B), which are only observed under illumination. As discussed below, the 10.6 min peak corresponds to cyc-dAdo.
Figure 4.

Analysis of photolysis products of AdoCbl (A) UV–visible spectra of 0.1 mM AdoCbl solution during photolysis. (B) EIC traces at m/z 252.11 AdoCbl prior to (gray) and resulting from photolysis (black) (upper) and EIC trace at m/z 250.09 prior to (gray) and resulting from photolysis (black) (lower). (C) HCD fragmentation of authentic dAdo standard (upper; RT 12.2 min, m/z 252.11) and authentic cyc-dAdo (lower; RT 10.6 min, m/z 250.09). (D) HCD fragmentation of dAdo (upper; RT 12.2 min, m/z 252.11) and cyc-dAdo (lower; RT 10.6 min, m/z 250.09) from photolysis of AdoCbl.
To definitively identify the 10.6 min peak as cyc-dAdo, comparative MS/MS analysis of dAdo and an authentic cyc-dAdo standard were carried out. High-energy collisional dissociation (HCD) of dAdo releases the base, which has an m/z of 136.0614 (Figure 4C upper trace). By contrast, fragmentation of cyc-dAdo only leads to loss of water resulting in an m/z of 232.08. We do not observe release of the base at any HCD power setting examined (Figure S6) with the cyc-dAdo standard; this is presumably because fragmentation at both the N-glycosidic bond and the C5′–C8 cross-link are unlikely (Figure 4C lower trace and Figure S6). Analysis of the species eluting at 10.6 min with m/z of 250 formed during photolysis of AdoCbl reveals identical fragmentation properties (Figure 4D lower trace). The HCD fragmentation of the peaks corresponding to dAdo and cyc-dAdo observed during the photolysis of adenosylcobalamin are identical to the authentic standards (compare Figures 4C and D). Since the peak at 3.8 min did not have the retention time or fragmentation pattern of cyc-dAdo, we did not probe the identity of this species further.
The extracted ion chromatograms from controlled potential electrolysis of SAM also reveal formation of cyc-dAdo (Figure 5A), which elutes with exactly the same retention time as samples from photolysis of AdoCbl and the authentic standards (compare Figure 4B and Figure S7). Moreover, when subjected to HCD fragmentation only loss of water, rather than the release of the adenine base (Figure 5B), is observed. This is consistent with its assignment as cyc-dAdo (Figure 4C and D).
Figure 5.
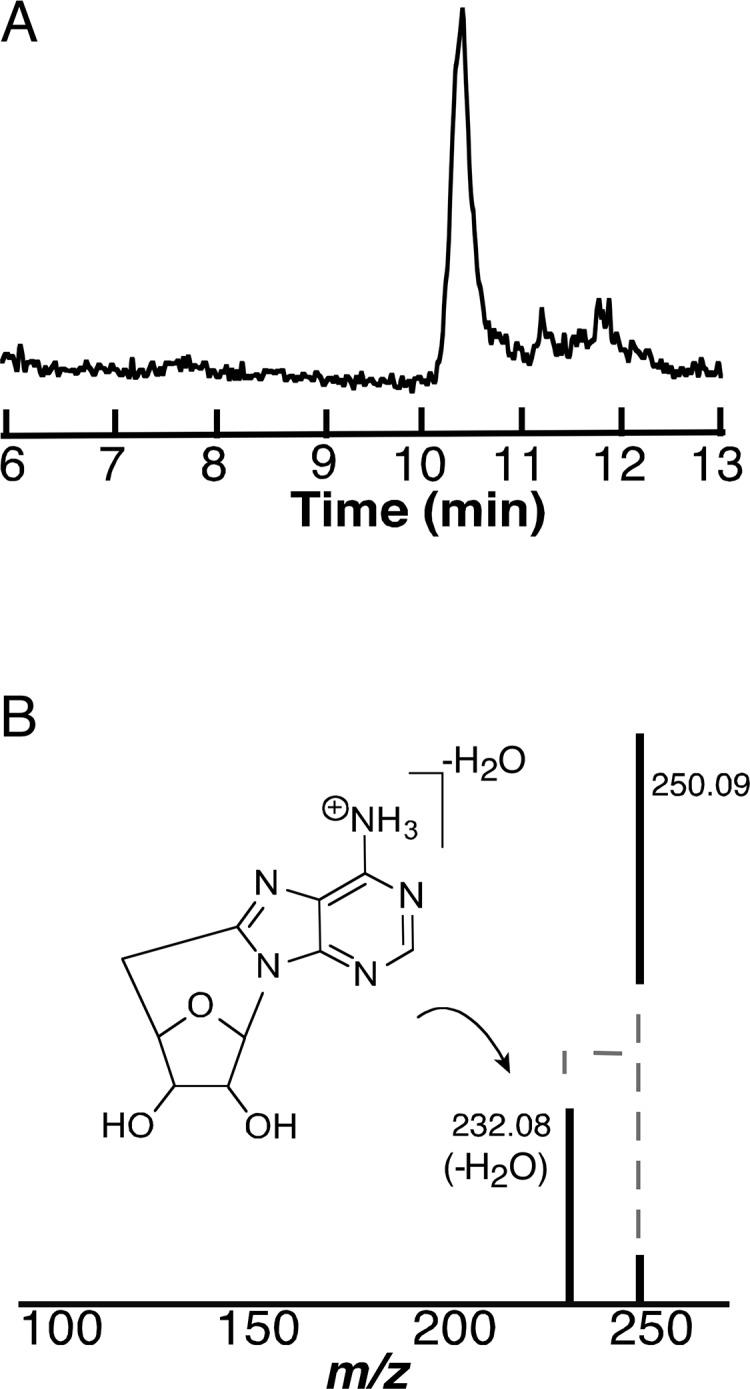
Characterization of m/z 250 species from controlled potential electrolysis of SAM. (A) EIC at m/z 250.09 of electrolysis of SAM at −1.8 V. (B) Fragmentation of the species at m/z of 250.09 produces fragments that are identical to those observed with cyc-dAdo standards (Figure 4C).
Reductive Cleavage of SAM also Produces 2-AB
The results described above clearly demonstrate that electrolysis of SAM produces 5′-dAdo•. However, in a small subset of radical SAM enzymes, homolysis of SAM is also able to produce a 2-AB radical. For example, 2-AB, which is presumably formed by the reductive cleavage of SAM, is used to post-translationally modify a histidine residue in elongation factor-2 (EF-2) forming “diphthamide.”16,17 Therefore, we investigated the production of 2-AB in controlled potential electrolysis of SAM. 2-AB is readily detected by LC-MS analysis using a hydrophilic HPLC column (Figure 6A, upper trace). The species eluting at 5.7 min exhibits a m/z of 104.0707), which is within 3.8 ppm of the theoretical mass of 2-AB. Electrolysis of SAM under the conditions needed to produce dAdo also forms a species with identical retention time (5.7 min) and m/z (104.0707) as the standard (see Figure 6A and B, middle trace). The m/z of the species observed in the electrolysis experiments is also within 3.8 ppm of the theoretical mass. As with dAdo, when this experiment is carried out in D2O an additional peak at m/z 105.0769 (Figure 6B, lower trace) is observed. The observed m/z is within 3.8 ppm of the expected value for incorporation of a single deuterium into 2-AB. As with dAdo, 2-AB appears to quench by incorporating H from both solvent exchangeable and nonexchangeable sites.
Figure 6.

Controlled potential electrolysis of SAM produces 2-AB. Controlled potential electrolysis experiments were carried out at −1.8 V. (A) The EIC traces correspond to 2-AB standard (upper trace, m/z = 104.07), electrolysis in H2O (middle trace, m/z = 104.07), and electrolysis in D2O (lower trace, m/z = 105.07). (B) Mass spectra corresponding to the peak at 5.7 min in the EIC traces are shown in panel A. (C) MS/MS analysis of the base peaks in spectra shown in B.
To unambiguously establish that the 2-AB observed in these experiments is identical to the standard, the base peaks were subjected to MS/MS analysis (Figure 6C). The major fragmentation product of the 2-AB standard and 2-AB produced in H2O is at m/z of 58.0659, which is consistent with the loss of the carboxylate. In D2O, peaks at 105.07 and 59.07 are observed, consistent with incorporation of deuterium into 2-AB.
To establish if the rate of cleavage of SAM to produce 2-AB correlates with the peak potential of SAM, controlled potential experiments were conducted where the cell was poised at −1.25, −1.5, or −2.25 V (Figure 7A), followed by simultaneous quantification of dAdo and 2-AB. Because 2-AB does not have a UV–visible feature that can be used for quantitation, we integrated the peak area for 2-AB and dAdo in the EIC traces of these species at various times and quantified by comparison to known standards. As shown in Figure 7B, both species are formed at similar rates over the range of potentials examined. Indeed, the dependence of cleavage rate on the applied potential is very similar to that shown for dAdo alone (compare Figures 2C and 7B), with a midpoint for rate occurring near the peak potential of SAM. Therefore, at least to a first approximation, there is no energetic preference for which C–S bond is cleaved, and the choice of cleavage in enzyme-catalyzed reactions is dictated by the local environment of the active site.
Figure 7.
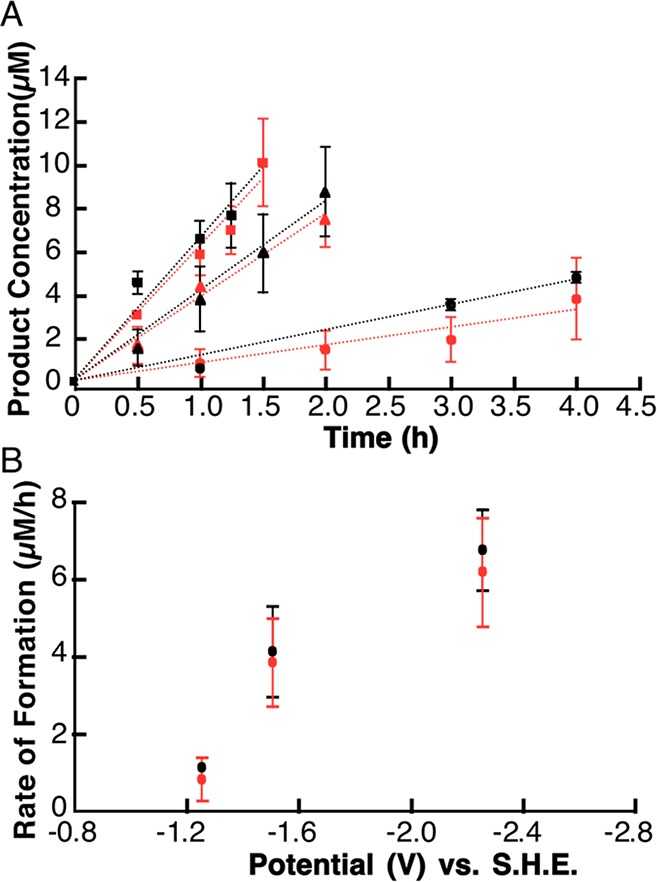
dAdo and 2-AB are produced with similar rates during controlled potential electrolysis of SAM. In these experiments, solutions were poised at −1.25 V (circle), −1.5 V (triangle), or −2.25 V (square). Samples were withdrawn at various times and (A) dAdo (black) and 2-AB (red) were quantified on the basis of the area of the EIC peak. (B) Rate of formation of dAdo (black) and 2-AB (red) versus the cell potential.
In summary, the results presented here demonstrate that the controlled potential electrolysis of SAM produces both dAdo and 2-AB. In the enzyme, the choice of dAdo• or 2-AB• is presumably dictated by the active site constraints. To our knowledge these data are the first measurement of the reductive potential of SAM and evidence for its ability to produce dAdo• or 2-AB• under enzyme-free conditions.
Discussion
Radical SAM enzymes have emerged as a massive superfamily whose functions span primary and secondary metabolism in all domains of life. Recent bioinformatic studies suggest that there may be >100, 000 members in the superfamily, many of which are likely to catalyze distinct transformations.6 Despite their ubiquity, the function of only a few handfuls of radical SAM enzymes are known. In nearly every case, significant mechanistic questions remain, particularly in cases where multiple iron–sulfur clusters are required for catalysis. The details for the activation of SAM have remained murky.
Frey and colleagues recognized early on with studies on LAM that the energetic requirement to cleave SAM is significant. Model studies available at the time placed the cathodic peak potential of SAM at ∼−1.6 V (v SHE). While the peak potential correlates with both the free energy and kinetics of the reduction and not the thermodynamic barrier for cleavage of SAM alone, the substantial difference between it and the midpoint potential of the radical SAM cluster in LAM still suggests a significant obstacle to its cleavage51,64 The midpoint potential of the cluster is lowered to −0.99 V in the ternary complex, suggesting that the binding energy from the interactions with the substrates/cofactor may partially mitigate this.51 If one takes the experimentally obtained Epc of SAM from this study (∼−1.4 V) as the upper limit for the reduction potential of bound SAM, the difference between the Epc and the midpoint of the potential is still 0.41 V, which still corresponds to a ∼40 kJ/mol thermodynamic mismatch. We cannot rule out the binding to the cluster may finetune the potential of SAM.
More recently Broderick, Hoffman, and their co-workers have posed an intriguing hypothesis for the activation of SAM, which is based on the observation of a new species in the reaction catalyzed by pyruvate formate lyase activating enzyme (PFL-AE). The omega intermediate (Ω) forms early in incubation of PFL-AE7 and its disappearance correlates with formation of the glycyl radical on its partner pyruvate formate-lyase, which ultimately catalyzes the conversion of pyruvate to formate. Ω has been proposed to be an organometallic adduct of the radical SAM cluster with the 5′-position of dAdo. This intermediate has also been seen with several other radical SAM enzymes.65 The appeal of this adduct 2-fold. First, this adduct would provide mechanistic symmetry between Ω and the AdoCbl cofactor. Second, it mitigates the need for direct reductive cleavage of SAM, which as discussed above, is energetically uphill. However, if the mechanism for the formation of the adduct entails initial reductive cleavage, followed by recombination with the cluster, then the process would be similarly unfavorable energetically.
A comprehensive understanding of the reductive cleavage of SAM by radical SAM enzymes requires that we understand the reduction of SAM as its own entity. It is with this goal in mind that we undertook the voltammetric and amperometric studies of SAM in solution. Our data show that SAM is irreversibly cleaved with an Epc of ∼−1.4 V. All structural data to date place the sulfonium moiety of SAM within a few angstroms of the cluster, thereby providing significant charge–charge interactions between the cluster and SAM that may further facilitate its reductive cleavage. While studying the electrochemical reduction of SAM in bulk solution removes the bias for any specific orientation of SAM during homolysis and both dAdo and 2-AB can form, in the active site the binding mode of SAM to the cluster must necessarily be favoring the production of an dAdo• versus the 2-AB radical,16,17,66 suggesting that binding orientation dominates which radical is produced from its homolysis in the enzyme. To our knowledge, 2-AB is never observed in enzymes that generate dAdo for catalysis and vice versa. We note in passing that while the difference between the Epc of SAM (−1.4 V) and those of alkyl and aryl sulfoniums may seem small, the value reported here is essential to ground any future discussion of the mechanisms by which radical SAM enzymes overcome substantial thermodynamic mismatches to allow the radical cluster to catalyze the cleavage of a C–S bond of SAM.
The measured potential for the reductive cleavage of SAM in solution presented in this manuscript provides a starting point for quantitative insights into the mechanism for the activation of SAM by radical SAM enzymes. These data support the notion that, in principle, SAM can undergo reductive cleavage. While the differences between the free energy for cleavage of SAM and the midpoint potential of various iron–sulfur clusters suggest a substantial thermodynamic mismatch, we posit that in fact, nature may have evolved this by design. If the potential of the cluster was such that cleavage of SAM occurred readily, it would potentially lead to formation of significant levels of dAdo•, which in the absence of substrate, could be quenched to form dAdo. Indeed, abortive cleavage of SAM is observed in vitro and hampers radical SAM enzymology. In many of these enzymes, the concentration of their substrate is likely to be significantly less than that of SAM in vivo. The substantial negative potential of SAM would ensure that cleavage is a rare event that coincides with the presence of bound substrate.
Acknowledgments
We are grateful for numerous discussions and helpful suggestions in the course of experimental design and analysis with Dr. Ross Minton and Dr. David Hickey, as well as to Prof. Shelley Minteer for careful reading of the manuscript and for advice. Research reported in this publication was supported by National institutes of General Medical Sciences of the National Institutes of Health under the award number R35 GM126956. The content is solely the responsibility of the authors and does not necessarily represent the official views of the National Institutes of Health.
Supporting Information Available
The Supporting Information is available free of charge on the ACS Publications website at DOI: 10.1021/jacs.9b00933.
Figures S1–S7 show methyl viologen control CV scans, overlay of CV of SAM solutions obtained with variable scan rates, scan rate dependent peak responses of SAM in solution, electrode passivation controls, HCD fragmentation of cyc-dAdo standard, and extracted ion chromatogram of cyc-dAdo standard (PDF)
The authors declare no competing financial interest.
Supplementary Material
References
- Frey P. A.; Moss M. L. Cold Spring Harbor Symp. Quant. Biol. 1987, 52, 571. 10.1101/SQB.1987.052.01.065. [DOI] [PubMed] [Google Scholar]
- Moss M.; Frey P. A. J. Biol. Chem. 1987, 262, 14859. [PubMed] [Google Scholar]
- Knappe J.; Neugebauer F. A.; Blaschkowski H. P.; Ganzler M. Proc. Natl. Acad. Sci. U. S. A. 1984, 81, 1332. 10.1073/pnas.81.5.1332. [DOI] [PMC free article] [PubMed] [Google Scholar]
- Sofia H. J.; Chen G.; Hetzler B. G.; Reyes-Spindola J. F.; Miller N. E. Nucleic Acids Res. 2001, 29, 1097. 10.1093/nar/29.5.1097. [DOI] [PMC free article] [PubMed] [Google Scholar]
- Brown S. D.; Babbitt P. C. J. Biol. Chem. 2014, 289, 30221. 10.1074/jbc.R114.569350. [DOI] [PMC free article] [PubMed] [Google Scholar]
- Holliday G. L.; Akiva E.; Meng E. C.; Brown S. D.; Calhoun S.; Pieper U.; Sali A.; Booker S. J.; Babbitt P. C. Methods Enzymol. 2018, 606, 1. 10.1016/bs.mie.2018.06.004. [DOI] [PMC free article] [PubMed] [Google Scholar]
- Broderick W. E.; Hoffman B. M.; Broderick J. B. Acc. Chem. Res. 2018, 51, 2611. 10.1021/acs.accounts.8b00356. [DOI] [PMC free article] [PubMed] [Google Scholar]
- Kim H. J.; McCarty R. M.; Ogasawara Y.; Liu Y. N.; Mansoorabadi S. O.; LeVieux J.; Liu H. W. J. Am. Chem. Soc. 2013, 135, 8093. 10.1021/ja312641f. [DOI] [PMC free article] [PubMed] [Google Scholar]
- Dowling D. P.; Bruender N. A.; Young A. P.; McCarty R. M.; Bandarian V.; Drennan C. L. Nat. Chem. Biol. 2014, 10, 106. 10.1038/nchembio.1426. [DOI] [PMC free article] [PubMed] [Google Scholar]
- Chatterjee A.; Li Y.; Zhang Y.; Grove T. L.; Lee M.; Krebs C.; Booker S. J.; Begley T. P.; Ealick S. E. Nat. Chem. Biol. 2008, 4, 758. 10.1038/nchembio.121. [DOI] [PMC free article] [PubMed] [Google Scholar]
- Allen K. D.; Wang S. C. Biochim. Biophys. Acta, Proteins Proteomics 2014, 1844, 2135. 10.1016/j.bbapap.2014.09.009. [DOI] [PMC free article] [PubMed] [Google Scholar]
- Walsby C. J.; Hong W.; Broderick W. E.; Cheek J.; Ortillo D.; Broderick J. B.; Hoffman B. M. J. Am. Chem. Soc. 2002, 124, 3143. 10.1021/ja012034s. [DOI] [PubMed] [Google Scholar]
- Walsby C. J.; Ortillo D.; Broderick W. E.; Broderick J. B.; Hoffman B. M. J. Am. Chem. Soc. 2002, 124, 11270. 10.1021/ja027078v. [DOI] [PubMed] [Google Scholar]
- Chen D.; Walsby C.; Hoffman B. M.; Frey P. A. J. Am. Chem. Soc. 2003, 125, 11788. 10.1021/ja036120z. [DOI] [PubMed] [Google Scholar]
- Broderick J. B.; Duffus B. R.; Duschene K. S.; Shepard E. M. Chem. Rev. 2014, 114, 4229. 10.1021/cr4004709. [DOI] [PMC free article] [PubMed] [Google Scholar]
- Zhang Y.; Zhu X.; Torelli A. T.; Lee M.; Dzikovski B.; Koralewski R. M.; Wang E.; Freed J.; Krebs C.; Ealick S. E.; Lin H. Nature 2010, 465, 891. 10.1038/nature09138. [DOI] [PMC free article] [PubMed] [Google Scholar]
- Zhu X.; Dzikovski B.; Su X.; Torelli A. T.; Zhang Y.; Ealick S. E.; Freed J. H.; Lin H. Mol. BioSyst. 2011, 7, 74. 10.1039/C0MB00076K. [DOI] [PMC free article] [PubMed] [Google Scholar]
- Demick J. M.; Lanzilotta W. N. Biochemistry 2011, 50, 440. 10.1021/bi101255e. [DOI] [PubMed] [Google Scholar]
- Cooper L. E.; Fedoseyenko D.; Abdelwahed S. H.; Kim S. H.; Dairi T.; Begley T. P. Biochemistry 2013, 52, 4592. 10.1021/bi400498d. [DOI] [PMC free article] [PubMed] [Google Scholar]
- Mahanta N.; Fedoseyenko D.; Dairi T.; Begley T. P. J. Am. Chem. Soc. 2013, 135, 15318. 10.1021/ja408594p. [DOI] [PMC free article] [PubMed] [Google Scholar]
- Lilla E. A.; Yokoyama K. Nat. Chem. Biol. 2016, 12, 905. 10.1038/nchembio.2187. [DOI] [PMC free article] [PubMed] [Google Scholar]
- Blaszczyk A. J.; Silakov A.; Zhang B.; Maiocco S. J.; Lanz N. D.; Kelly W. L.; Elliott S. J.; Krebs C.; Booker S. J. J. Am. Chem. Soc. 2016, 138, 3416. 10.1021/jacs.5b12592. [DOI] [PubMed] [Google Scholar]
- Ballinger M. D.; Reed G. H.; Frey P. A. Biochemistry 1992, 31, 949. 10.1021/bi00119a001. [DOI] [PubMed] [Google Scholar]
- Ballinger M. D.; Frey P. A.; Reed G. H. Biochemistry 1992, 31, 10782. 10.1021/bi00159a020. [DOI] [PubMed] [Google Scholar]
- Ollagnier-De Choudens S.; Sanakis Y.; Hewitson K. S.; Roach P.; Munck E.; Fontecave M. J. Biol. Chem. 2002, 277, 13449. 10.1074/jbc.M111324200. [DOI] [PubMed] [Google Scholar]
- Lieder K. W.; Booker S.; Ruzicka F. J.; Beinert H.; Reed G. H.; Frey P. A. Biochemistry 1998, 37, 2578. 10.1021/bi972417w. [DOI] [PubMed] [Google Scholar]
- Henshaw T. F.; Cheek J.; Broderick J. B. J. Am. Chem. Soc. 2000, 122, 8331. 10.1021/ja002012q. [DOI] [Google Scholar]
- Krebs C.; Broderick W. E.; Henshaw T. F.; Broderick J. B.; Huynh B. H. J. Am. Chem. Soc. 2002, 124, 912. 10.1021/ja017562i. [DOI] [PubMed] [Google Scholar]
- Cosper N. J.; Booker S. J.; Ruzicka F.; Frey P. A.; Scott R. A. Biochemistry 2000, 39, 15668. 10.1021/bi0022184. [DOI] [PubMed] [Google Scholar]
- Layer G.; Moser J.; Heinz D. W.; Jahn D.; Schubert W. D. EMBO J. 2003, 22, 6214. 10.1093/emboj/cdg598. [DOI] [PMC free article] [PubMed] [Google Scholar]
- Berkovitch F.; Nicolet Y.; Wan J. T.; Jarrett J. T.; Drennan C. L. Science 2004, 303, 76. 10.1126/science.1088493. [DOI] [PMC free article] [PubMed] [Google Scholar]
- O’Brien J. R.; Raynaud C.; Croux C.; Girbal L.; Soucaille P.; Lanzilotta W. N. Biochemistry 2004, 43, 4635. 10.1021/bi035930k. [DOI] [PubMed] [Google Scholar]
- Boal A. K.; Grove T. L.; McLaughlin M. I.; Yennawar N. H.; Booker S. J.; Rosenzweig A. C. Science 2011, 332, 1089. 10.1126/science.1205358. [DOI] [PMC free article] [PubMed] [Google Scholar]
- Benjdia A.; Heil K.; Barends T. R.; Carell T.; Schlichting I. Nucleic Acids Res. 2012, 40, 9308. 10.1093/nar/gks603. [DOI] [PMC free article] [PubMed] [Google Scholar]
- Lepore B. W.; Ruzicka F. J.; Frey P. A.; Ringe D. Proc. Natl. Acad. Sci. U. S. A. 2005, 102, 13819. 10.1073/pnas.0505726102. [DOI] [PMC free article] [PubMed] [Google Scholar]
- Goldman P. J.; Grove T. L.; Sites L. A.; McLaughlin M. I.; Booker S. J.; Drennan C. L. Proc. Natl. Acad. Sci. U. S. A. 2013, 110, 8519. 10.1073/pnas.1302417110. [DOI] [PMC free article] [PubMed] [Google Scholar]
- Goldman P. J.; Grove T. L.; Booker S. J.; Drennan C. L. Proc. Natl. Acad. Sci. U. S. A. 2013, 110, 15949. 10.1073/pnas.1312228110. [DOI] [PMC free article] [PubMed] [Google Scholar]
- Silakov A.; Grove T. L.; Radle M. I.; Bauerle M. R.; Green M. T.; Rosenzweig A. C.; Boal A. K.; Booker S. J. J. Am. Chem. Soc. 2014, 136, 8221. 10.1021/ja410560p. [DOI] [PMC free article] [PubMed] [Google Scholar]
- Benjdia A.; Heil K.; Winkler A.; Carell T.; Schlichting I. Chem. Commun. (Cambridge, U. K.) 2014, 50, 14201. 10.1039/C4CC05158K. [DOI] [PubMed] [Google Scholar]
- Nicolet Y.; Pagnier A.; Zeppieri L.; Martin L.; Amara P.; Fontecilla-Camps J. C. ChemBioChem 2015, 16, 397. 10.1002/cbic.201402661. [DOI] [PubMed] [Google Scholar]
- Grove T. L.; Himes P. M.; Hwang S.; Yumerefendi H.; Bonanno J. B.; Kuhlman B.; Almo S. C.; Bowers A. A. J. Am. Chem. Soc. 2017, 139, 11734. 10.1021/jacs.7b01283. [DOI] [PMC free article] [PubMed] [Google Scholar]
- Davis K. M.; Schramma K. R.; Hansen W. A.; Bacik J. P.; Khare S. D.; Seyedsayamdost M. R.; Ando N. Proc. Natl. Acad. Sci. U. S. A. 2017, 114, 10420. 10.1073/pnas.1703663114. [DOI] [PMC free article] [PubMed] [Google Scholar]
- Grell T. A. J.; Bell B. N.; Nguyen C.; Dowling D. P.; Bruender N. A.; Bandarian V.; Drennan C. L. Protein Sci. 2019, 28, 202. 10.1002/pro.3529. [DOI] [PMC free article] [PubMed] [Google Scholar]
- Bandarian V.; Drennan C. L. Curr. Opin. Struct. Biol. 2015, 35, 116. 10.1016/j.sbi.2015.11.005. [DOI] [PMC free article] [PubMed] [Google Scholar]
- Dowling D. P.; Vey J. L.; Croft A. K.; Drennan C. L. Biochim. Biophys. Acta, Proteins Proteomics 2012, 1824, 1178. 10.1016/j.bbapap.2012.04.006. [DOI] [PMC free article] [PubMed] [Google Scholar]
- Vey J. L.; Drennan C. L. Chem. Rev. 2011, 111, 2487. 10.1021/cr9002616. [DOI] [PMC free article] [PubMed] [Google Scholar]
- Saeva F. D.; Morgan B. P. J. Am. Chem. Soc. 1984, 106, 4121. 10.1021/ja00327a010. [DOI] [Google Scholar]
- Maiocco S. J.; Arcinas A. J.; Landgraf B. J.; Lee K. H.; Booker S. J.; Elliott S. J. Biochemistry 2016, 55, 5531. 10.1021/acs.biochem.6b00670. [DOI] [PMC free article] [PubMed] [Google Scholar]
- Maiocco S. J.; Grove T. L.; Booker S. J.; Elliott S. J. J. Am. Chem. Soc. 2015, 137, 8664. 10.1021/jacs.5b03384. [DOI] [PubMed] [Google Scholar]
- Ugulava N. B.; Gibney B. R.; Jarrett J. T. Biochemistry 2001, 40, 8343. 10.1021/bi0104625. [DOI] [PMC free article] [PubMed] [Google Scholar]
- Wang S. C.; Frey P. A. Biochemistry 2007, 46, 12889. 10.1021/bi701745h. [DOI] [PMC free article] [PubMed] [Google Scholar]
- Bewley K. D.; Dey M.; Bjork R. E.; Mitra S.; Chobot S. E.; Drennan C. L.; Elliott S. J. PLoS One 2015, 10, e0122466 10.1371/journal.pone.0122466. [DOI] [PMC free article] [PubMed] [Google Scholar]
- Walker L. M.; Kincannon W. M.; Bandarian V.; Elliott S. J. Biochemistry 2018, 57, 6050. 10.1021/acs.biochem.8b00846. [DOI] [PMC free article] [PubMed] [Google Scholar]
- McCarty R. M.; Krebs C.; Bandarian V. Biochemistry 2013, 52, 188. 10.1021/bi301156w. [DOI] [PMC free article] [PubMed] [Google Scholar]
- Colichman E. L.; Love D. L. J. Org. Chem. 1953, 18, 40. 10.1021/jo01129a008. [DOI] [Google Scholar]
- Kampmeier J. A.; Hoque A. K.; Saeva F. D.; Wedegaertner D. K.; Thomsen P.; Ullah S.; Krake J.; Lund T. J. Am. Chem. Soc. 2009, 131, 10015. 10.1021/ja809918k. [DOI] [PubMed] [Google Scholar]
- McKinney P. S.; Rosenthal S. J. Electroanal. Chem. Interfacial Electrochem. 1968, 16, 261. 10.1016/S0022-0728(68)80066-X. [DOI] [Google Scholar]
- Finkelstein M.; C. Petersen R.; D. Ross S.. Electrochemical Degradation of Aryl Sulfonium Salts; 1963; Vol. 110. [Google Scholar]
- Vase K. H.; Holm A. H.; Norrman K.; Pedersen S. U.; Daasbjerg K. Langmuir 2008, 24, 182. 10.1021/la702301a. [DOI] [PubMed] [Google Scholar]
- Viaud P.; Coeffard V.; Thobie-Gautier C.; Beaudet I.; Galland N.; Quintard J. P.; Le Grognec E. Org. Lett. 2012, 14, 942. 10.1021/ol300003f. [DOI] [PubMed] [Google Scholar]
- Vase K. H.; Holm A. H.; Norrman K.; Pedersen S. U.; Daasbjerg K. Langmuir 2007, 23, 3786. 10.1021/la0629227. [DOI] [PubMed] [Google Scholar]
- Frey P. A.; Essenberg M. K.; Abeles R. H. J. Biol. Chem. 1967, 242, 5369. [PubMed] [Google Scholar]
- Hogenkamp H. P. C. J. Biol. Chem. 1963, 238, 477. [Google Scholar]
- Hinckley G. T.; Frey P. A. Biochemistry 2006, 45, 3219. 10.1021/bi0519497. [DOI] [PMC free article] [PubMed] [Google Scholar]
- Byer A. S.; Yang H.; McDaniel E. C.; Kathiresan V.; Impano S.; Pagnier A.; Watts H.; Denler C.; Vagstad A. L.; Piel J.; Duschene K. S.; Shepard E. M.; Shields T. P.; Scott L. G.; Lilla E. A.; Yokoyama K.; Broderick W. E.; Hoffman B. M.; Broderick J. B. J. Am. Chem. Soc. 2018, 140, 8634. 10.1021/jacs.8b04061. [DOI] [PMC free article] [PubMed] [Google Scholar]
- Dong M.; Horitani M.; Dzikovski B.; Pandelia M. E.; Krebs C.; Freed J. H.; Hoffman B. M.; Lin H. J. Am. Chem. Soc. 2016, 138, 9755. 10.1021/jacs.6b04155. [DOI] [PMC free article] [PubMed] [Google Scholar]
Associated Data
This section collects any data citations, data availability statements, or supplementary materials included in this article.