

Abstract
A hallmark of pancreatic ductal adenocarcinoma (PDAC) is an exuberant stroma comprised of diverse cell types that enable or suppress tumor progression. Here, we explored the role of oncogenic Kras in pro-tumorigenic signaling interactions between cancer cells and host cells. We show that Kras* drives cell autonomous expression of type I cytokine receptor complexes (IL2rγ-IL4r⍺ and IL2rγ-IL13r⍺1) in cancer cells that in turn are capable of receiving cytokine growth signals (IL4 or IL13) provided by invading TH2 cells in the microenvironment. Early neoplastic lesions show close proximity of Kras* cancer cells and TH2 cells producing IL4 and IL13. Activated IL2rγ-IL4r⍺ and IL2rγ-IL13r⍺1 receptors signal primarily via Jak1-Stat6. Integrated transcriptomic, chromatin occupancy and metabolomic studies identified cMyc, as a direct target of activated Stat6, and that cMyc drives glycolysis. Thus paracrine signaling in the tumor microenvironment plays a key role in the Kras*-driven metabolic reprogramming of PDAC.
INTRODUCTION
Oncogenic KRAS mutation (KRAS*) is a signature genetic alteration in human PDAC. Genetically engineered mouse models have validated a critical role of Kras* in both the initiation and maintenance of PDAC1–3. Kras* alone has been shown to cause acinar cell dysplasia or acinar ductal metaplasia (ADM) and, together with inflammatory injury (e.g., cerulean-induced pancreatitis) and/or tumor suppressor deficiencies (e.g., Ink4a/Arf, TP53 and/or Smad4 loss), promotes the malignant transformation of these initiated preneoplastic lesion into high-grade pancreatic intraepithelial neoplasia (PanIN) and frank adenocarcinoma. Most studies to date have focused on cooperative cancer cell-intrinsic oncogenic genetic alterations that drive growth factor-independent proliferation and enhanced survival of cancer cells. Additionally, while a growing body of evidence has revealed a key role for cancer intrinsic oncogenic signals in driving the recruitment of suppressive immunocytes to constrain anti-tumor immunity, whether and how these infiltrating immunocytes might, in turn, provide additional trophic support for these Kras*-initiated cancer cells to enable cancer progression is less well defined.
A hallmark feature of PDAC is an extensive desmoplastic stroma comprised of fibroblasts, extracellular matrix (ECM), and immune cells4–6. Studies have reported both the presence7,8 and absence5,9 of infiltrating effector immune cells in PDAC tumor microenvironment with lymphocyte infiltrates confined mostly to the stromal compartment. The biological relevance of these lymphocytes is suggested by the observation that the presence of a T cell coinhibitory gene expression pattern is inversely correlated with survival10. To date, studies exploring the role of lymphocytes in PDAC biology have focused largely on their immunological functions in constraining tumor initiation and progression. Beyond their role in immune suppression, infiltrating immune cells may also function to support the initiation and growth of PDAC. In the case of CD4+ T cells which are present in malignant lesions (this study), some of its subtypes (TH2, TH17, Treg) are known to play critical roles in inflammatory processes in cancer11,12 and TH2 subtypes can promote tumor growth via induction of polarization of M1 macrophages into immune suppressive M2 macrophages13.
Exploration of the cross-talk between various cells and their factors in the PDAC tumor microenvironment in processes of tumor initiation and progression represents an area of active investigation. Here, we specifically explored the cooperative interactions between Kras* signaling in cancer cells and cytokines derived from the tumor micronenviroment, specifically infiltrating TH2 polarized CD4+ T-cells, in pre-neoplasic lesions (PanIN) and PDAC. We established that Kras* drives the expression of cytokine receptors which are in turn activated by cytokines produced predominantly by infiltrating TH2 cells. Ligand-induced activation of cytokine receptor signals via the Jak-STAT pathway to directly up-regulate cMyc which in turn drives metabolic reprogramming by the upregulation of glycolytic genes. This paracrine pathway contributes to Kras*-driven glycolysis and provides potential therapeutically targetable interactions in the PDAC tumor microenvironment.
RESULTS
Kras* upregulates specific type I cytokine receptor family members.
The iKras* model enables temporal and spatial control of Kras* in PDAC via doxycycline (dox) (Figure 1A). Upon extinction of Kras* in established tumors, we observed significant rapid changes in the tumor microenvironment, prompting us to explore Kras*-dependent signaling interactions within and across cancer and host cells (Supplementary Figure 1A). Gene set enrichment analysis (GSEA) comparisons of Kras* parental cancer cell lines versus Kras*-negative relapsed cancer cell lines (Kras*+ vs Kras*-)3 identified IL2 and IL21 as top oncogenic signature pathways upregulated in the Kras*+ cell lines (Figure 1B,C). Similarly, comparison of cell lines ‘On’ versus 24 hours ‘Off’ dox shows enrichment of IL2, IL15 and IL21 gene signatures in the Kras* dependent escaper lines. (Supplementary Fig. 1B–D). We then audited microarray expression patterns of verifiable mouse cytokine genes (~650) in Kras* ‘On’ versus ‘Off’ cell lines derived from an autochthonous iKras* tumor. Among the top 25 Kras*-upregulated cytokine network genes were IL2R gamma (IL2Rγ) along with one of its family members, IL4r⍺ (Figure 1D). Finally, meta-analysis of human PDAC identified IL2Rγ as one of the top 50 most overexpressed genes in PDAC tumors14.
Figure 1: Kras* upregulates specific type I cytokine receptor family members.
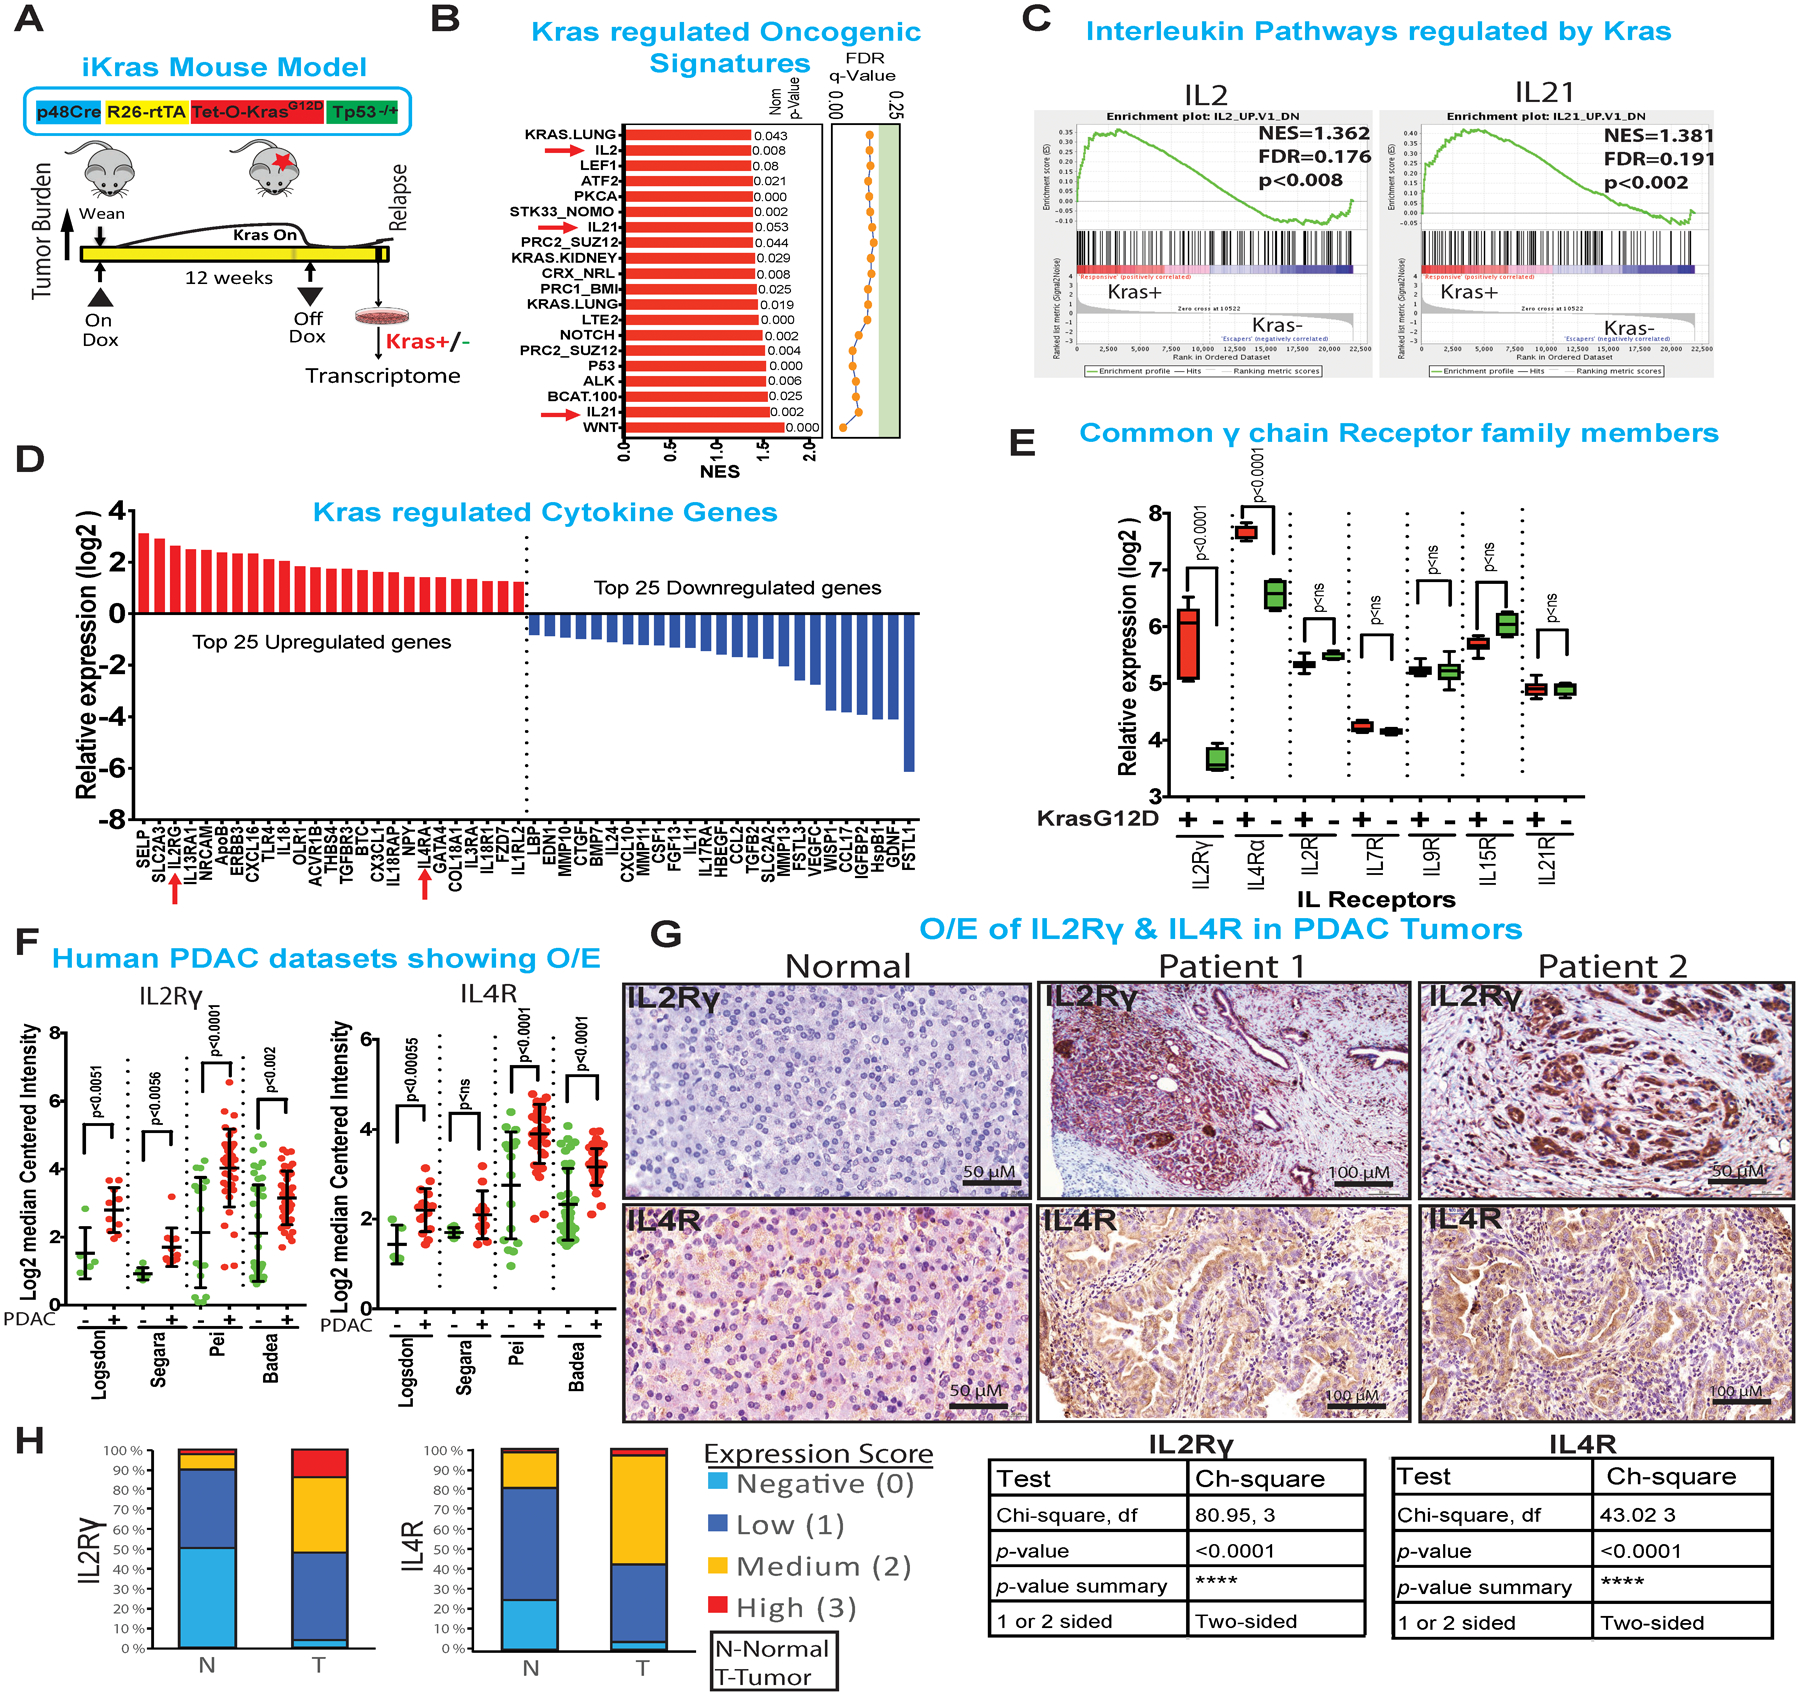
(A) Construct of the inducible KrasG12D transgenic mouse alleles (top). Strategy to generate iKras* cell lines followed by transcriptome analysis.
(B) Gene Set Enrichment Analysis (GSEA) of oncogenic pathways. Pathways of interest IL2, IL15 and IL21 are highlighted in blue and indicated with red arrow. NOM p values are shown on the right side of the bar graph.
(C) Graphs showing the enrichment plots generated by GSEA analysis of IL2 and IL21, comparing Kras+ vs Kras− cells. The enrichment score is shown as a scattered green line. In the inset are shown normalized enrichment score (NES), FDR and nominal p value (NOM p value).
(D) Top and bottom 25 Kras* regulated mouse cytokine family genes. The gene-rank list was generated by manual curation of ~650 mouse cytokine genes.
(E) Relative expression of common gamma (γ) chain receptor family genes regulated by Kras*. Results are shown as mean ± SEM. p values were calculated using Student’s t-test (ns: not statistically significant).
(F) Differential expression (log2) of IL2Rγ and IL4R genes from human Oncomine datasets. Results are shown as mean ± SEM. p values were calculated using Student’s t-test (ns: not statistically significant).
(G) Normal (left panel) and two representative (right 2 panels) immunohistochemistry of IL2Rγ and IL4R in human samples (n=121) showing membrane expression of both proteins. Scale bars, 50 μm and 100 μm.
(H) Quantification and statistical analysis of the immunohistochemistry data from above. Low levels of IL2Rγ and IL4R are expressed in normal pancreas, mostly by the islet cells whereas medium to high level of expression is observed in PDAC. Statistical analysis of the patient samples is shown in the table to the right of graph.
IL2Rγ and IL4R are members of a common gamma chain receptor (γc or CD132) family, which is part of a larger superfamily known as the type I cytokine receptor superfamily. IL4 binds to IL4R receptor (CD124)15 which then recruits the IL2Rγ chain receptor to form a functional type I IL4R receptor (Supplementary Figure 1E). In addition, IL2Rγ can heterodimerize with other private co-receptors IL2R, IL7R, IL9R, IL15R and IL21R to engage specific cytokines IL2, IL7, IL9, IL15 and IL21, respectively16. Examination of the type I cytokine receptor family showed that only IL2rγ and IL4r⍺ were regulated by Kras* (Figure 1E). Analysis of human PDAC datasets in oncomine (Datasets from following publications: PMIDs- 12750293, 15867264, 19732725 and 19260470) also showed IL2Rγ and IL4R overexpression in PDAC relative to normal pancreas (Figure 1F). Next, we performed ‘digital microdissection’ of RNAseq data of TCGA PDAC datasets to identify those cells expressing IL2Rγ and IL4R, which can also be expressed in T cells, macrophages, eosinophils and basophils. This approach enabled assignment of the source of IL2Rγ to cancer cells and its correlation with Kras* expression (Supplementary Figure 1F). Examination of human PDAC samples (n=121) showed that ~95% of patients variably overexpress low to high levels of IL2Rγ and IL4R relative to normal tissues (Figure 1G,H). Thus, these type I cytokine receptor family members are consistently upregulated in Kras* expressing human and murine PDAC.
IL4r⍺ and not IL2rγ contribute to PDAC progression in vivo.
IL2rγ and IL4r⍺ are over expressed in PDAC, where their expression is Kras* dependent (Figure 2A, Supplementary Figure 2A,B). Notably, while IL2rγ gene expression is not necessary for in vitro cell proliferation (Figure 2B,C, Supplementary Figure 2C), inhibition of IL2rγ in an in vivo syngeneic orthotopic mouse model caused a modest decrease in tumor burden albeit with rapid recurrence and thus only a modest survival benefit (median survival 32 days compared to 29 days for control tumor) (Figure 2D, Supplementary Figure 2D–F). Decreased tumor burden aligns with previous reports that shRNA-mediated IL2rγ depletion provokes tumor regression17. These modest anti-tumor results raised the possibility that either IL2rγ plays a marginal role in tumor growth, or an alternate receptor complex or pathway is available to sustain growth and survival signals. Along these lines, IL4r⍺ receptor can engage the IL4 ligand via two distinct receptor complexes, type I and II IL4r⍺ receptors, depending on its dimerizing partner. Both type I (IL2rγ and IL4r⍺) and type II (IL4r⍺ and IL13r⍺1) can bind with IL4 and activate its downstream Jak-STAT pathway; however, each complex utilizes distinct Jak kinases and Stat transcription factors (Figure 2E). We therefore tested and determined that both IL4r⍺ (Figure 1F) and IL13r⍺1 were indeed regulated by Kras* (Figure 2A); specifically, these receptors were among the top 25 cytokine genes regulated by Kras* (Figure 1D). The expression of both IL4r⍺ and IL13R⍺1 was lost upon extinction of Kras* in the iKras* mouse model (Supplementary Figure 2G). We also validated that IL13R⍺1 was upregulated in multiple human PDAC tumor datasets compared to PanIN or non-malignant part of the pancreas parenchyma (Figure 2F). In contrast to the modest anti-tumor impact of IL2rγ depletion above, shRNA-mediated depletion of IL4r⍺ led to significant tumor regression and increased survival (median survival 60 days compared to 30 days for control tumor) (Figure 2G,H, Supplementary Figure 2H, I). There is also a significant decrease in proliferation marker PCNA upon IL4r⍺ depletion (Figure 2I). The above findings suggest that IL4r⍺ is a central node for the dual signaling arising from IL4 or IL13, and contributes to PDAC tumorigenesis.
Figure 2: IL4r⍺ and not IL2rγ contribute to PDAC progression in vivo.
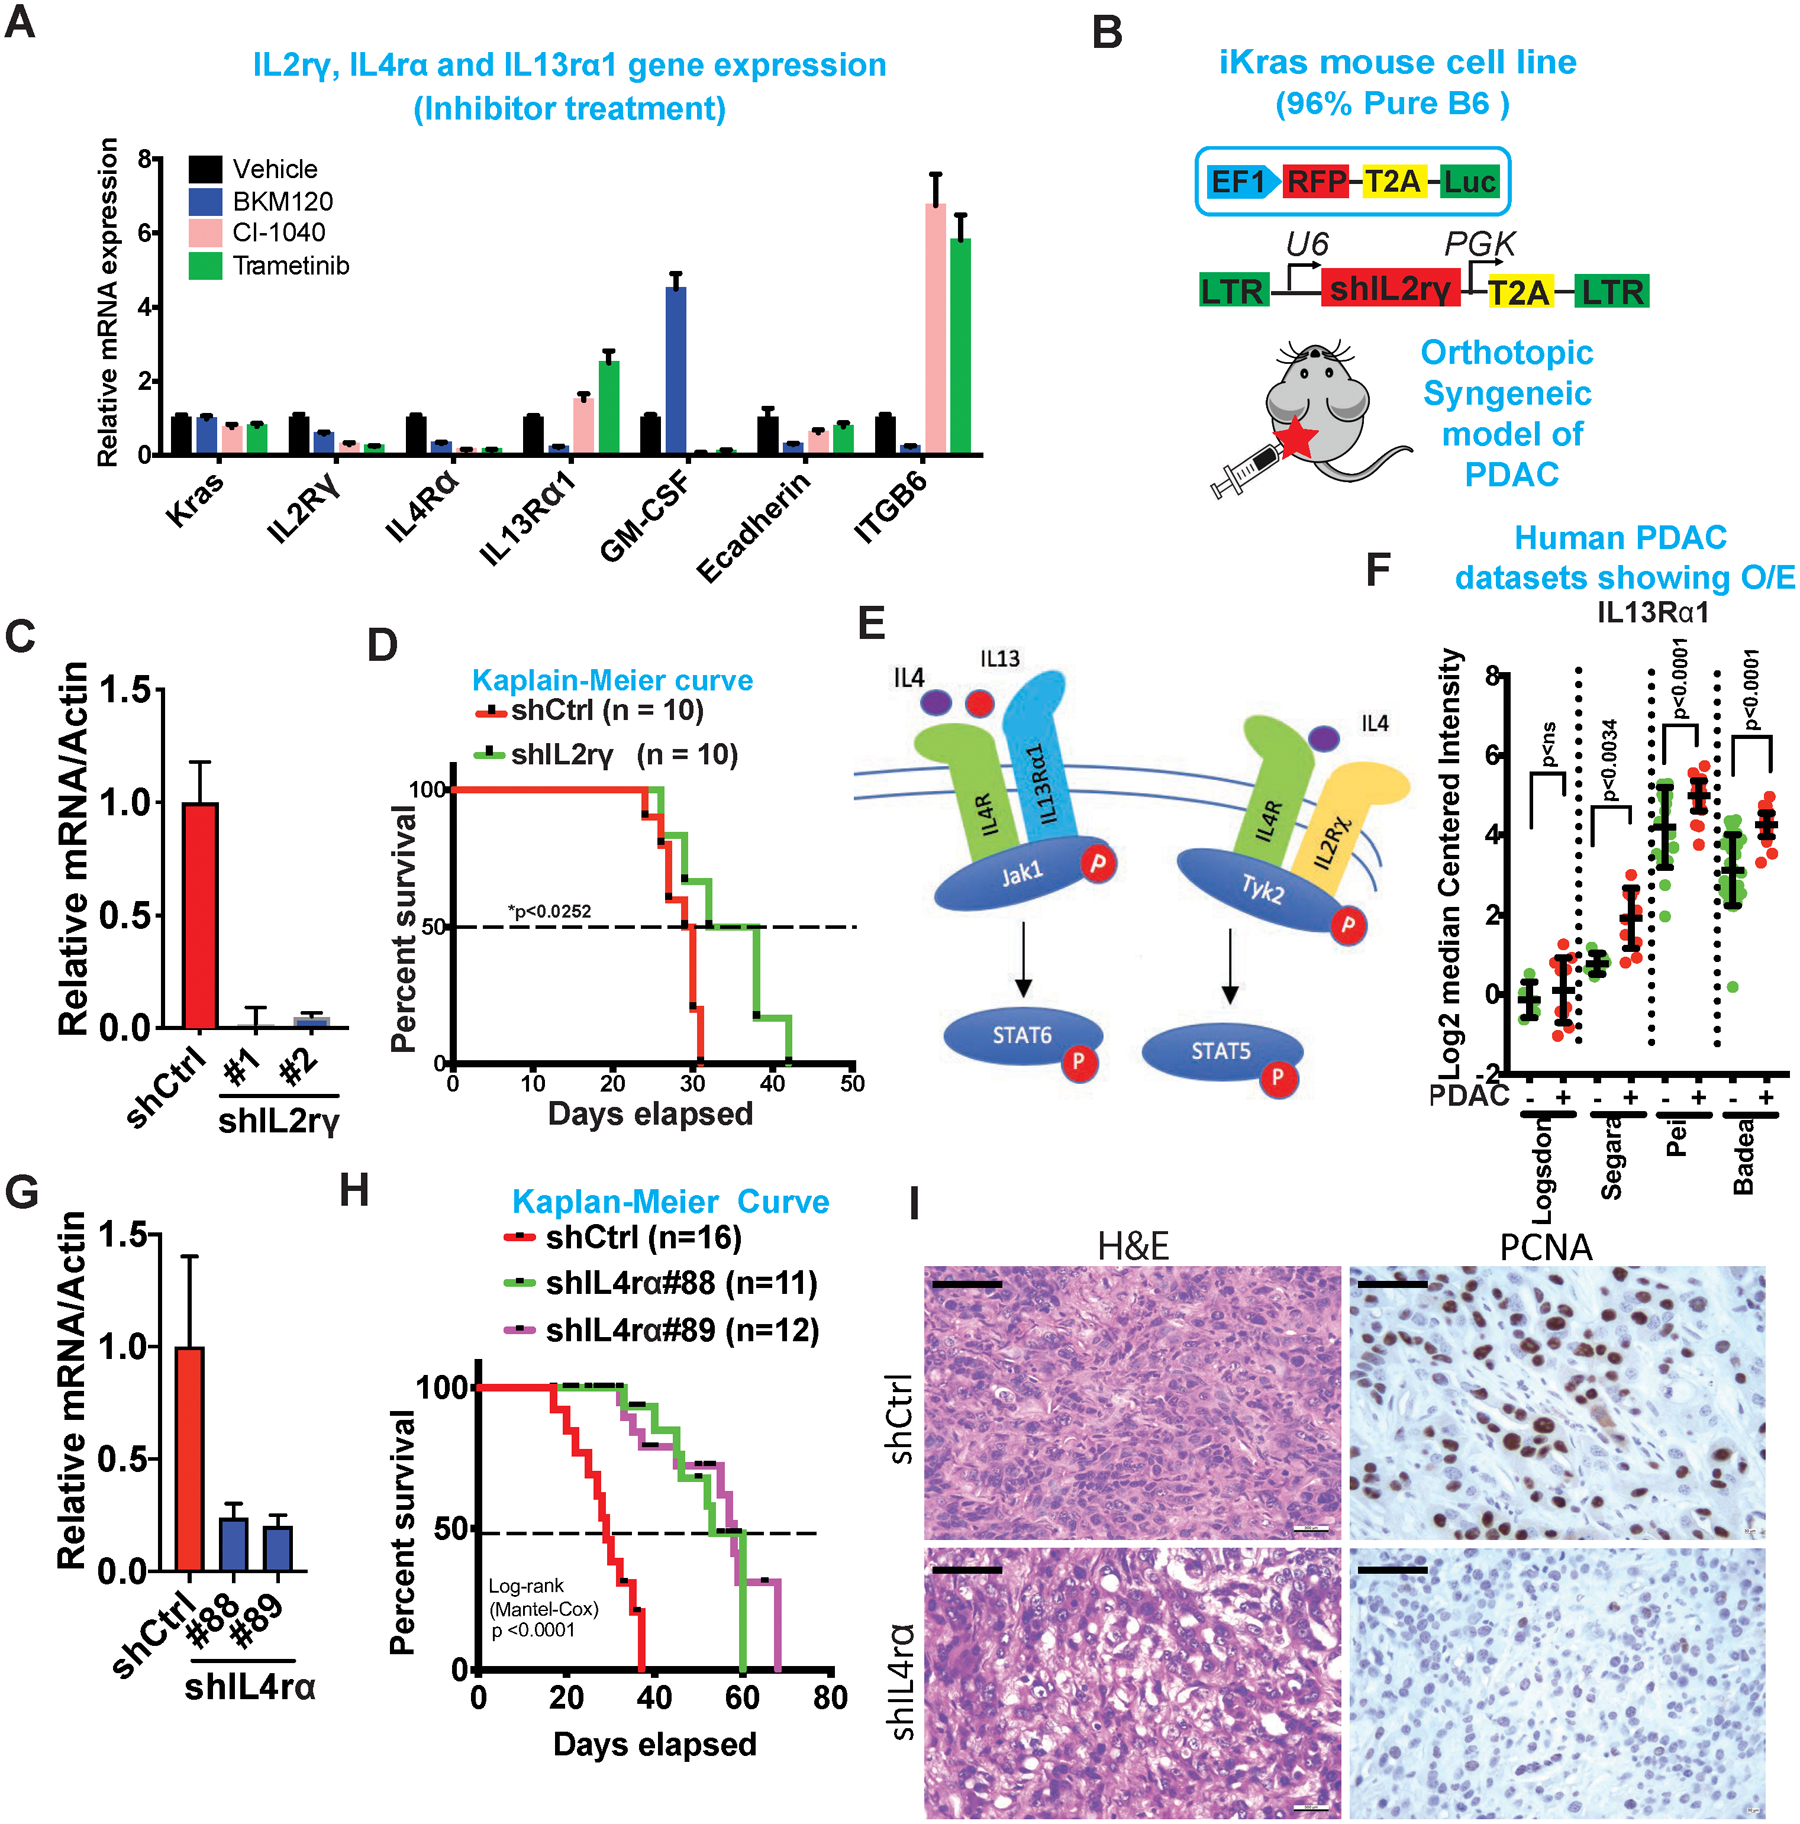
(A) mRNA expression of Kras, IL2Rγ, IL4rα and IL13Rα1 upon treatment with MEK1/2 (CI-1040 and Trametinib) and PI3K (BKM120) inhibitors. Also, shown are the mRNA expression of GM-CSF, E-cadherin and ITGB6, known downstream regulated genes of Kras and PI3K.
(B) Schematic of the vector construct used to generate luciferase receptor cell lines and shRNA knockdown of IL2Rγ (Top). Schematic of orthotopic syngeneic mouse model in C57BL/6 mice (Bottom).
(C) mRNA expression of IL2Rγ in mouse tumor cell lines transfected with shRNA for IL2Rγ (Clone #1 and #2) or control vector.
(D) Kaplain-Meier survival curves of mice transplanted with mouse tumor cell lines transfected with shRNA for IL2Rγ or control vector (n=10).
(E) Schematic of IL2Rγ-IL4R and IL13Rα1-IL4R pathways.
(F) Differential expression (log2) of IL13Rα1 in human Oncomine datasets. Results are shown as mean ± SEM. p values were calculated using Student’s t-test (ns: not statistically significant).
(G) mRNA expression of IL4rα in mouse tumor cell lines transfected with shRNA for IL4rα (Clone #88 and #89) or control vector.
(H) Kaplain-Meier survival curves of mice transplanted with mouse tumor cell lines transfected with shIL4rα#88 (n=11), shIL4rα#89 (n=12) or control vector (n=16). Survival statistics was calculated using Log-rank (Mantel-Cox) test; p value <0.0001.
(I) Representative H & E and PCNA staining of orthotopic tumor of mouse transfected with shIL4rα#89 or shCtrl cell lines. Scale bars, 50 μm.
PDAC cancer cells are responsive to IL4 and IL13 cytokines which drives Jak-Stat-cMYC activation.
Thorough analysis of all γc cytokine family (IL2, IL4, IL7, IL9, IL15 and IL21) and IL13 genes revealed that none of the cytokines except IL15 was regulated by Kras* (Figure 3A). This led us to speculate that γc cytokines may be sourced instead from host cells in the TME. It is well established that ligand-induced dimerization of cytokine receptors leads to cross-phosphorylation of tyrosine residues in Janus kinases (Jaks) which in turn interacts with the SH2 domain of the Stat transcription factors, leading to Stat phosphorylation, homodimerization and activation18. To examine ligand-induced activation and downstream signaling, we systematically analyzed the capacity of the above cytokines to activate any of the four mammalian Jak family members (Jak1, Jak2, Jak3 and Tyk2) and the seven Stat family members (Stat1, Stat2, Stat3, Stat4, Stat5a, Stat5b and Stat6)18 (data not shown). First, we established that IL4-mediated activation of the Jak-Stat pathway was independent of serum status (2% FBS, depletion for 24 hrs) (Figure 3B). Second, IL4 and IL13 were the only ligands capable of activating the downstream effectors: specifically, Jak1 (Tyr1034/1035) and Tyk2 (Tyr1054/1055) kinases as well as Stat6 (Tyr641) and Stat5 (Tyr694) (Figure 3B, Supplementary Figure 3A). Consistently, IL4 treatment also activated Stat6 in most human PDAC cell lines tested (Supplementary Figure 3B). Third, inhibition of IL2rγ using neutralizing antibodies showed no change in Jak1 or Stat6 phosphorylation, and moderate decrease in pTyk2 and pStat5, indicating that IL4 signaling via IL2rγ-IL4r⍺ receptors utilized the Tyk2-Stat5 pathway whereas signaling via IL13R⍺1-IL4R utilized the Jak1-Stat6 pathway (Figure 3C). Also, inhibition of IL2rγ receptor had no effect on IL13 ligand-mediated Jak1-Stat6 activation, indicating that IL13 does not utilize the IL2rγ-IL4r⍺ receptor pathway (Supplementary Figure 3C).
Figure 3: PDAC cancer cells are responsive to IL4 and IL13 cytokines which drives Jak-Stat-cMYC activation.
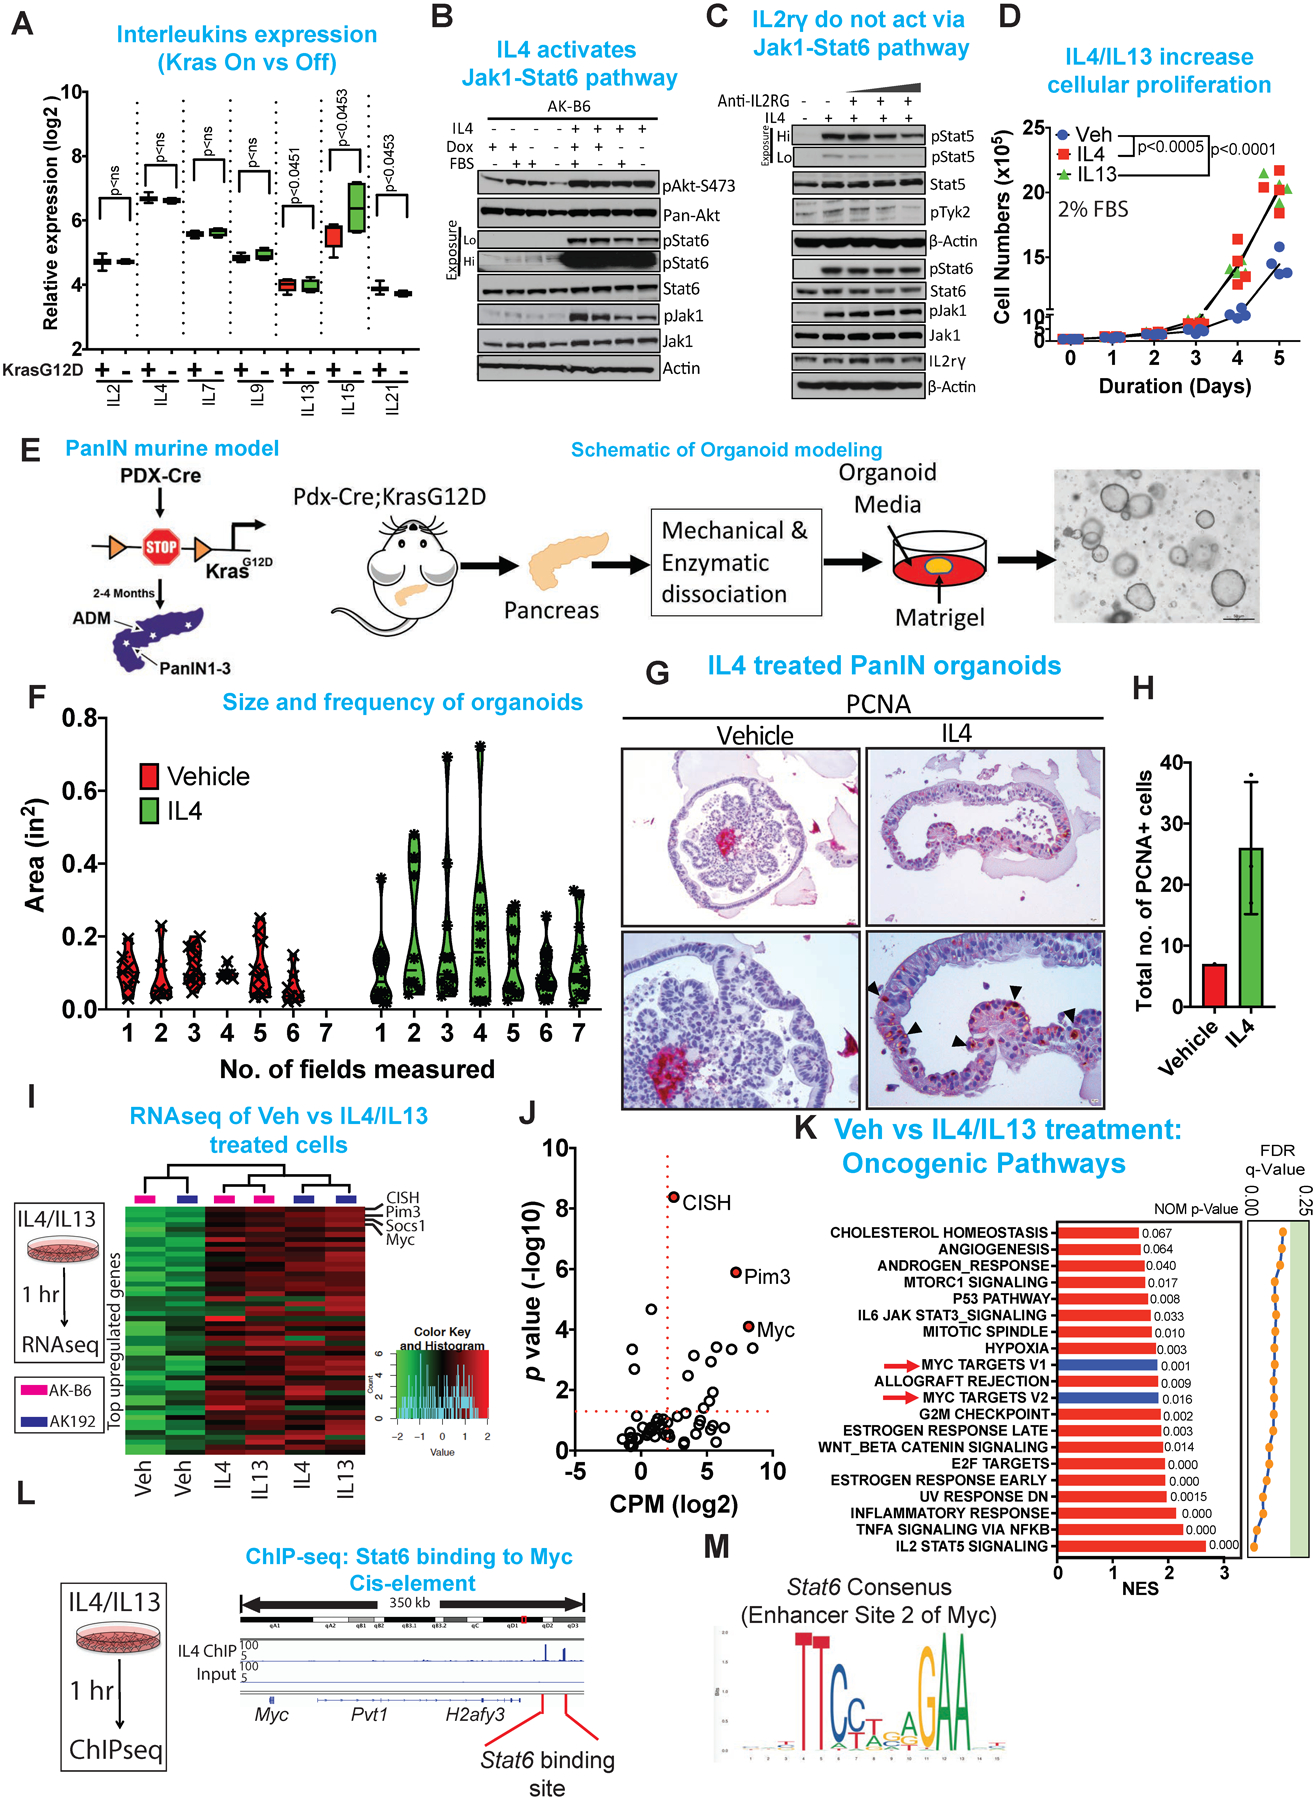
(A) Relative expression (log2) of common gamma chain family cytokines ON and OFF dox. Results are shown as mean ± SEM. p values were calculated using Student’s t-test (ns: not statistically significant).
(B) Immunoblot analysis for pAkt-S473, pan-Akt, pStat6, Stat6, pJak1 and Jak1 of mouse cell lines treated for 1 hour with IL4 in the presence or absence of FBS and dox. β-Actin acts as a loading control. Hi and Lo indicates high and low exposure of the membrane.
(C) Immunoblot analysis for pStat5, Stat5, pTyk2, pStat6, Stat6, pJak1, Jak1 and IL2rγ upon treatment with anti-IL2rγ antibody (concentration range 3.3, 33, 66, 132 μg/ml, respectively) in the presence or absence of IL4 (10 ng/ml). β-Actin acts as a loading control. Hi and Lo indicates high and low exposure of the membrane.
(D) Proliferation assay of mouse cell lines treated with IL4 (10 ng/ml) or IL13 (10 ng/ml) for the days indicated. The cells were cultured in 2% FBS. Data represent n=3, repeated 4 times.
(E) Schematic of the PanIN mouse model and of the workflow for generating pancreas organoid.
(F) Violin plots of size and frequency of organoids upon treatment with vehicle or IL4. Organoids were grown as droplets in 96 well plates and treated with IL4 (20 ng/ml) for 72 hrs. Seven individual wells were imaged and the measurement were done using ImageJ.
(G) Representative immunohistochemistry of PCNA comparing vehicle and IL4 treated pancreas organoid.
(H) Quantification of PCNA positive cells following vehicle vs IL4 treatment of organoids.
(I) Heat maps of the genes enriched in indicated genes upon treatment of cells with IL4 (10 ng/ml) or IL13 (10 ng/ml) for 1 hour. Expression levels shown are representative of log2 values of each replicate from either vehicle or IL4 treated cultured cell lines. Red signal denotes higher expression relative to the mean expression level within the group, and green signal denotes lower expression relative to the mean expression level within the group.
(J) Quantification of the enriched genes based on CPM (log2) vs p value (-log10) showing cMyc as the top enriched gene.
(K) GSEA analysis of oncogenic pathways showing cMyc as of the top targets.
(L) ChIP-seq of Stat6 showing binding of Stat6 on the cis-element of cMyc.
(M) Consensus sequence of Stat6 binding site on the cMyc cis-element.
This strong activation of the Jak1-Stat6 signaling pathway prompted functional analysis of this pathway on cancer cell survival and tumorigenesis. Specifically, IL4 (10 ng/ml) or IL13 (10 ng/ml) treatment of iKras* cell lines increased proliferation (Figure 3D). To recapitulate the in vivo condition, an ex vivo organoid model from Pdx-Cre; LSL-KrasG12D pancreas was generated (Figure 3E). Upon characterization, the organoid was identified as being derived from mouse progenitor cells as evidenced by Dclk1 expression and are also positive for epithelial marker, as shown Pan-cytokeratin (Pan-CK) (Supplementary Figure 3D). The established organoids were then tested for response to IL4 treatment, which showed an increase in frequency and size of organoid (Figure 3F, Supplementary Figure 3E). Moreover, IL4 treatment led to an increase in staining for proliferation marker, PCNA (Figure 3G, H). To understand the pro-proliferative actions of IL4 and IL13, RNAseq analysis was performed, revealing that the top most upregulated genes included Myc and Pim3 (serine/threonine kinase) (Figure 3I,J). Following both IL4 and IL13 treatment, GSEA analysis showed that cMyc ranked highest among the oncogenic pathways (Figure 3K, Supplementary Figure 3F), and the top KEGG pathways were the Jak-Stat pathways (Supplementary Figure 3G). Given that Stat6 is a transcription factor, ChIP-seq was used to assess whether Stat6 directly binds to the promoter/enhancer regions of the aforementioned genes. ChIP-seq showed that Stat6 bound directly to the enhancer region of these targets (Figure 3L, M, Supplementary Figure 3H); As previous work showed that cMyc expression has a dose-dependent effect on tumor cell proliferation19,20, the findings that IL4 could elevate cMyc expression in PDAC cells reinforces the hypothesis of a tumor promoting role for IL4.
IL4/IL13 upregulates cMyc to promote metabolic reprogramming.
cMyc is known to cooperate with Kras* in driving many cancers, and contributes to many cancer hallmarks21,22 including cancer cell survival23,24, cancer initiation and progression24,25, and metabolic reprogramming of bioenergetic pathways such as glutamine26 and glucose27 metabolism to support anabolic processes. As our previous work in the iKras* model demonstrated an enrichment of cMYC E-box binding elements in many genes governing glucose and glutamine metabolism1, we performed targeted metabolic analysis following a one-hour treatment of IL4 or IL13 (10 ng/ml) in iKras cells. We observed increased glucose metabolism leading to increased production of pyruvate (Figure 4A). These findings contrast with earlier in vitro studies showing that glucose catabolism in PDAC is directed towards the pentose phosphate pathway (PPP) for synthesis of ribose-5-phosphate1 and glutaminolysis provides the carbon for TCA cycle. It is interesting to note that in vivo metabolism studies in PDAC and other cancer types have definitively shown both glucose and glutamine are utilized by tumors compared to in vitro where PDAC cells are mostly dependent on glutamine28,29. Thus, we considered the possibility that the presence of cancer cell extrinsic factors in TME that include cytokines might contribute to the in vivo metabolic pathway profile. Consistent with increased glycolysis upon IL4 or IL13 treatment, we observed increased expression of the glycolytic genes hexokinase II (HK-II), and enolase I (Figure 4B). The strong expression of HK-II and enolase I is also observed in the epithelial compartment of pre-malignant tumor model alluding to upregulation of specific glycolytic genes (Figure 4C) which are known cMyc targets. Knockdown of IL4r⍺ in syngenic orthotopic tumors decreases cMyc and a concurrent decrease in HK-II and enolase I expression (Figure 4D, Supplementary Figure 4A,B). Using Seahorse glycolysis stress assay, we further analyzed the glucose consumption rate upon addition of IL4 and IL13 and detected a substantial increase in extracellular acidification rate (ECAR) which is an indication of acidification of the media upon conversion of glucose to lactate, and a net increase in protons in the spent media (Figure 4E,F). Moreover, C13-Glucose (Glc) tracing analysis show that IL4 reprograms glycolytic pathway by diverting glucose-carbon towards energy production via TCA cycle and lesser towards the PPP. We saw an enrichment in C13-isotope labeling in glycolysis and tricarboxylate acid (TCA) cycle intermediates such as pyruvate, fumarate and oxaloacetate (OAA). There was a simultaneous decrease in C13-isotope labeling in PPP intermediates such as ribose-5-phosphate and sedoheptulose-7-phosphate (Figure 4G,H). Together, these findings support the view that IL4/IL13 drives energy production via glycolysis and the TCA cycle.
Figure 4: IL4/IL13 upregulates cMyc to promote metabolic reprogramming.
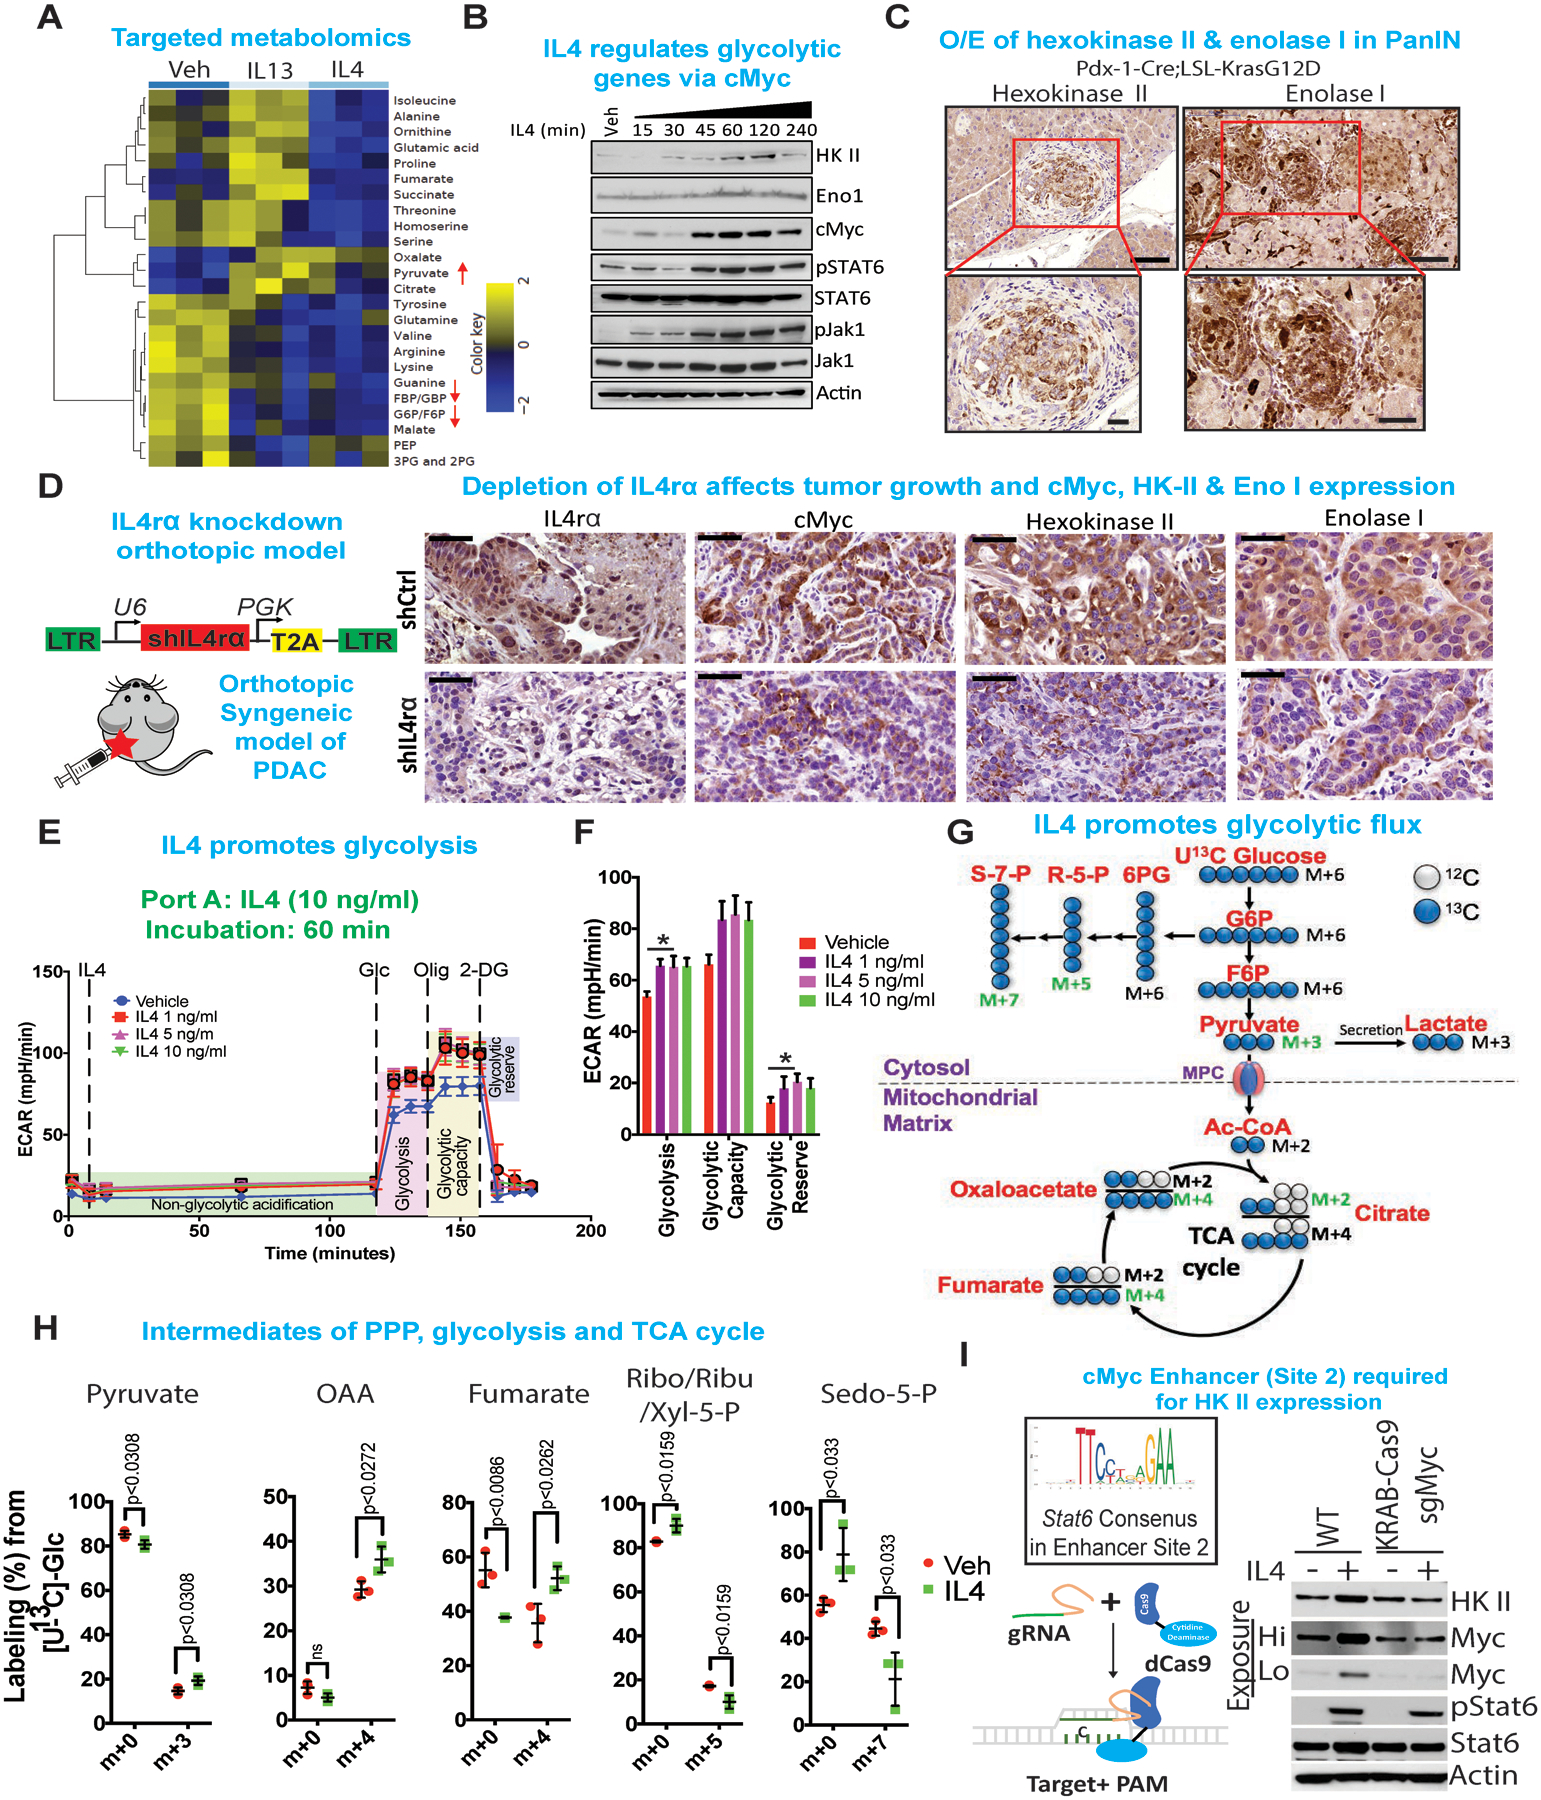
(A) Heat map of those metabolites that were significantly and consistently changed upon treatment of IL4 or IL13 in two iKras cell lines as determined by targeted LC-MS/MS. Cells were treated with IL4 or IL13 for 1 hour, at which point metabolite levels were measured from triplicates for each treatment condition. The averaged ratios of differentially regulated metabolites are represented in the heat map (Differential FDR<0.25). Arrows indicate metabolites involved in glucose metabolism that were regulated upon IL4 or IL13 treatment.
(B) Immunoblot analysis for hexokinase (HK) II, enolase I, cMyc, pStat6, Stat6, pJak1 and Jak1 of cells treated with IL4 (10 ng/ml) for indicated times. β-Actin acts as a loading control.
(C) Immunohistochemistry of hexokinase II and enolase I in pre-neoplastic mouse (Pdx-1-Cre;LSL-KrasG12D) pancreas. The lower panels are magnified images of the boxed regions. Scale bars, 50 μm and 100 μm, respectively.
(D) (Left) Cartoon of syngeneic orthotopic tumor model, whose tissues were used for immunohistochemistry analysis. (Right) Representative immunohistochemistry showing IL4ra, cMyc, Hexokinase II and Enolase I expression in syngeneic orthotopic tumor tissues comparing shIL4r⍺ vs. shCtrl knockdown. Scale bar, 50 μm.
(E) Seahorse analysis for extracellular acidification rate (ECAR) of cells treated with IL4 (1–10 ng/ml) for 1 hour.
(F) Quantification of the Seahorse data on the left. Results are shown as mean ± SEM. p values were calculated using Student’s t-test.
(G) Diagram of glycolysis and TCA cycle. Blue circles indicate 13C-labeled carbons. Red label indicates metabolites measured using mass spectrometry.
(H) Percentage labelling of 13C-labeled carbon in metabolites indicated. Data are presented as mean ± SEM. n = 4. Two-tailed t-test was used for all comparisons between two groups.
(I) Consensus sequence of Stat6 binding site on the cMyc cis-element (Top left). Schematic of KRAB-dCas9 (Bottom left). Immunoblot showing loss of IL4 mediated regulation of cMyc and HK II upon binding of KRAB-dCas9 on the cMyc cis-element, that blocks the binding of Stat6 to the consensus cis-element. Actin acts as a loading control.
We further validated whether IL4 acts through cMyc or directly regulates metabolic enzymes HK II and enolase I. In order to test this hypothesis, we have utilized a catalytically inactive Cas9 (dCas9) fused to transcriptional/chromatin effector domains (KRAB-Krüppel associated box) allowing silencing of a genomic region of interest. We designed sgRNA that would target the Stat6 binding site 2, as detected in the ChIP-seq, on the cMyc cis-element approximately 350 kb upstream of cMyc promoter region. Immunoblot shows that upon silencing of Stat6 binding region, IL4 mediated regulation of cMyc and HK II is lost, however the baseline expression of cMyc remains intact, indicating alternate regulation of baseline cMyc and HK II expression (Figure 4I). Similarly, using ruxolitinib, a Jak1 specific inhibitor shows that upon inhibition of Jak1-Stat6 signaling the IL4 mediated upregulation of cMyc and HK II is abolished (Supplementary Figure 4C)
The tumor microenvironment supplies IL4 and IL13.
As IL4 and IL13 drive cancer cell proliferation in vivo in our model, we sought to identify the source of these cytokines in the TME. Immunohistochemistry confirmed elevated IL4 and IL13 in Kras*-On tumors compared with Kras*-Off tumors or normal pancreas (Supplementary Figure 5A). IL4 and IL13 are known to be secreted primarily by TH2 polarized CD4+ T cells and to a lesser extent by mast cells, eosinophils and stromal cells30. The TH2 cells secrete IL4 and IL13 in a paracrine fashion, polarizing additional naïve CD4+ T cells to TH2 type31. Importantly, flow cytometry analysis showed that 40–60% of the live cells in the PDAC tumor were CD45+ cells, of which 18–20% were CD3+ cells and a majority of those were CD4+ cells (Figure 5A, Supplementary Figure 5B–D). Next, CyTOF, was used to conduct a comprehensive immune profile of mouse PDAC tumors (On Dox for 12 weeks) and compare these profiles with those of normal pancreas and spleen (Figure 5B, Supplementary Figure 5E). Correspondingly, using multiplexed imaging Mass Spectrometry (iMC), human PDAC tissues also showed significant infiltration of CD4+ T cells (Figure 5C,D). These findings are consistent with recent reports that anti-tumor immune response is dependent on the presence of right proportion of T effector (TH1 and CD8+) cells vs tumor promoting T (Treg, TH2, TH17) cells10,32. Expression of transcription factors T-bet and Gata-3 is used for molecular subtyping of TH1 cells and TH2 cells, respectively33. Molecular characterization of the specific type of infiltrating CD4+ T cells, shows that most infiltrating CD4+ T-cells were Gata-3+ TH2 cells and only a small fraction were T-bet+ TH1 cells (Figure 5E,F, Supplementary Figure 5F). Single cell analysis of low and high grade IPMN and PDAC patient samples revealed CD4+ T cell infiltration and higher percentage of the CD4+ T cells are Gata3+ TH2 subtypes compared to T-bet+ TH1 cells (Figure 5G,H, Supplementary Figure 5G).
Figure 5: The tumor microenvironment supplies IL4 and IL13.
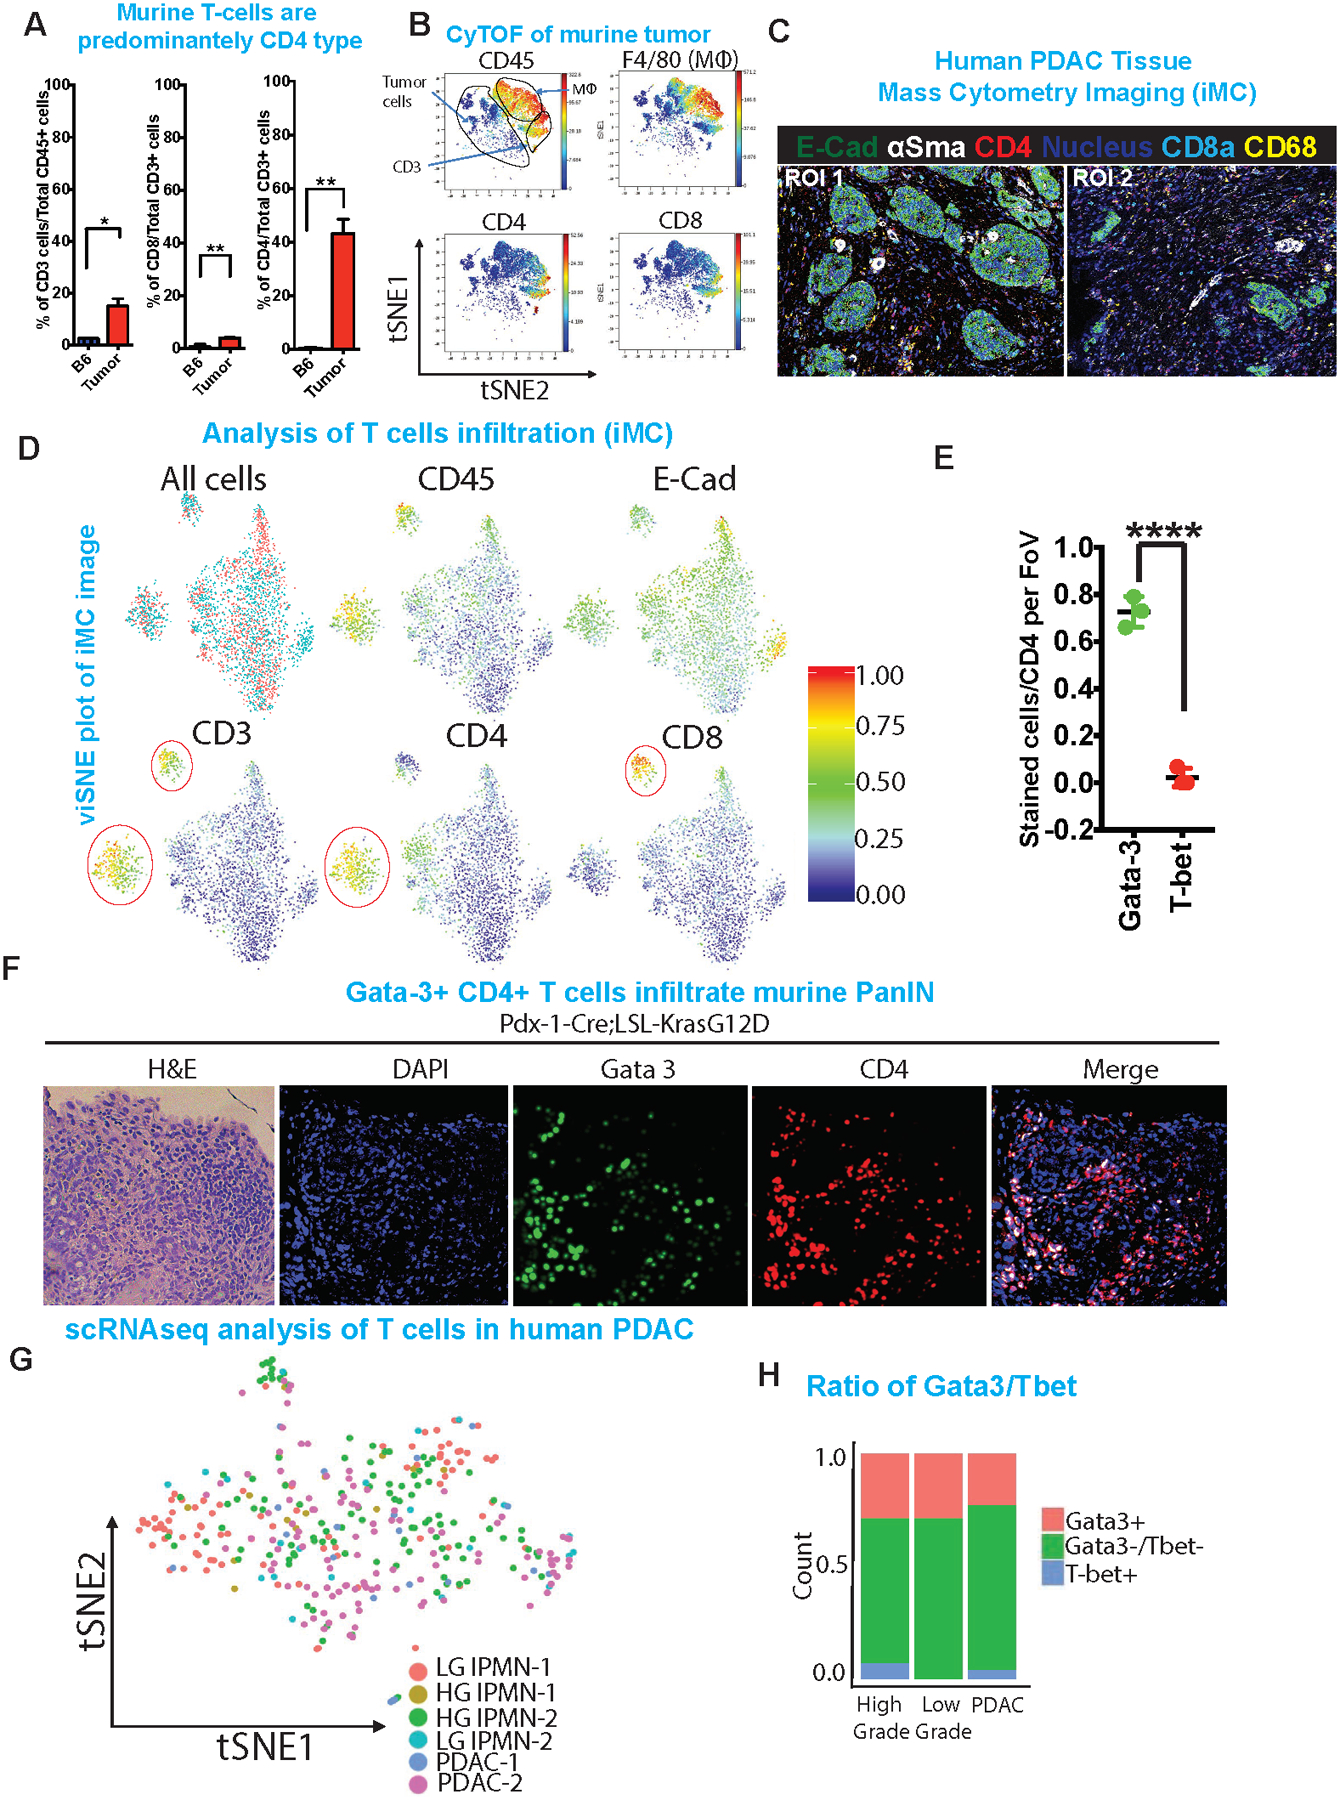
(A) Quantification of total CD3, CD8 and CD4 populations in iKras tumor compared to normal pancreas using flow cytometry. Cell populations were identified as T cells (CD45+CD3e+), CD4+ T cells (CD45+CD3e+CD8−CD4+), CD8+ T cells (CD45+CD3e+ CD8+CD4−).
(B) viSNE analysis of CyTOF data of immune cells from tumor, colored by relative expression of CyTOF markers, with populations indicated as CD45, F4/80, CD4 and CD8. Total CD3, tumor cells and macrophage populations are circled.
(C) Representative images of two different ROI of multiplex imaging (iMC) showing staining for E-cadherin, αSMA, CD4, CD8a and CD68. White asterisks indicate CD4+ T cells.
(D) viSNE plot of population analysis of iMC image (Figure 5C). Shown are quantification of all events, CD45, E-cadherin, CD3, CD4 and CD8.
(E) Quantification of Gata-3 and T-bet staining based on the IHC staining in PanIN model. ***p <0.001
(F) Representative H&E and immunofluorescence images of PanINs stained with DAPI, Gata3, CD4. Right most panel shows merged image of CD4 and Gata3. Scale bars, 100 μm
(G) tSNE plot of single cell analysis on IPMN and PDAC human tumor samples followed by digital microdissection of T cells to analyze the presence of various T cell subtypes. Annotated colors represent lesion of origin of the respective T cells.
(H) Quantification of single cell data (left) showing Gata3+ and T-bet+ CD4 T cells in human IPMNs (low and high grade) and PDAC samples.
Given the paucity of T cells in the tumor microenvironment of advanced PDAC and that Kras mutational activation is an early event in PDAC tumorigenesis, we also assessed whether TH2 cells infiltrate during very early stages of the neoplastic process and potentially cooperate with Kras* to drive tumorigenesis. We utilized the Pdx-cre;LSL-KrasG12D model which generates acinar to ductal metaplasia (ADM) and PanIN lesions at 3–6 months of age; these neoplasms rarely progress to advanced malignancy following a long latency34. IL4r⍺ and IL13r⍺ expression as well as activated Stat6 and elevated cMyc levels were readily detected in the KrasG12D-expressing neoplastic cells (Figure 6A) -- findings consistent with a potential role of IL4 and IL13 during early stages of tumorigenesis. Also, these PanIN like lesions were infiltrated by CD4+ T cells, which were also mostly TH2 type (Gata3+) (Figure 5F, Supplementary Figure 5F) as the Gata-3/T-bet ratio was skewed towards TH2 phenotype. Based on these findings, we speculated that infiltrating TH2 cells contribute to pancreatic cancer initiation and progression. Accordingly, regimen of 12 doses of anti-CD4 neutralizing antibody treatment of Pdx-cre;LSL-KrasG12D mice, starting at age 30 days, resulted in a decrease in size and number of PanIN lesions (Supplementary Figure 6A). Immunohistochemical staining of tissues derived from anti-CD4 treated mice shows a marked reduction in CD4 T cells in the vicinity of the smaller PanIN lesions; moreover, these lesions show reduced expression of PCNA, hexokinase II and enolase I in the cancer cells (Supplementary Figure 6B).
Figure 6: Jak1-Stat6 pathway promotes cancer cell proliferation and tumor growth.
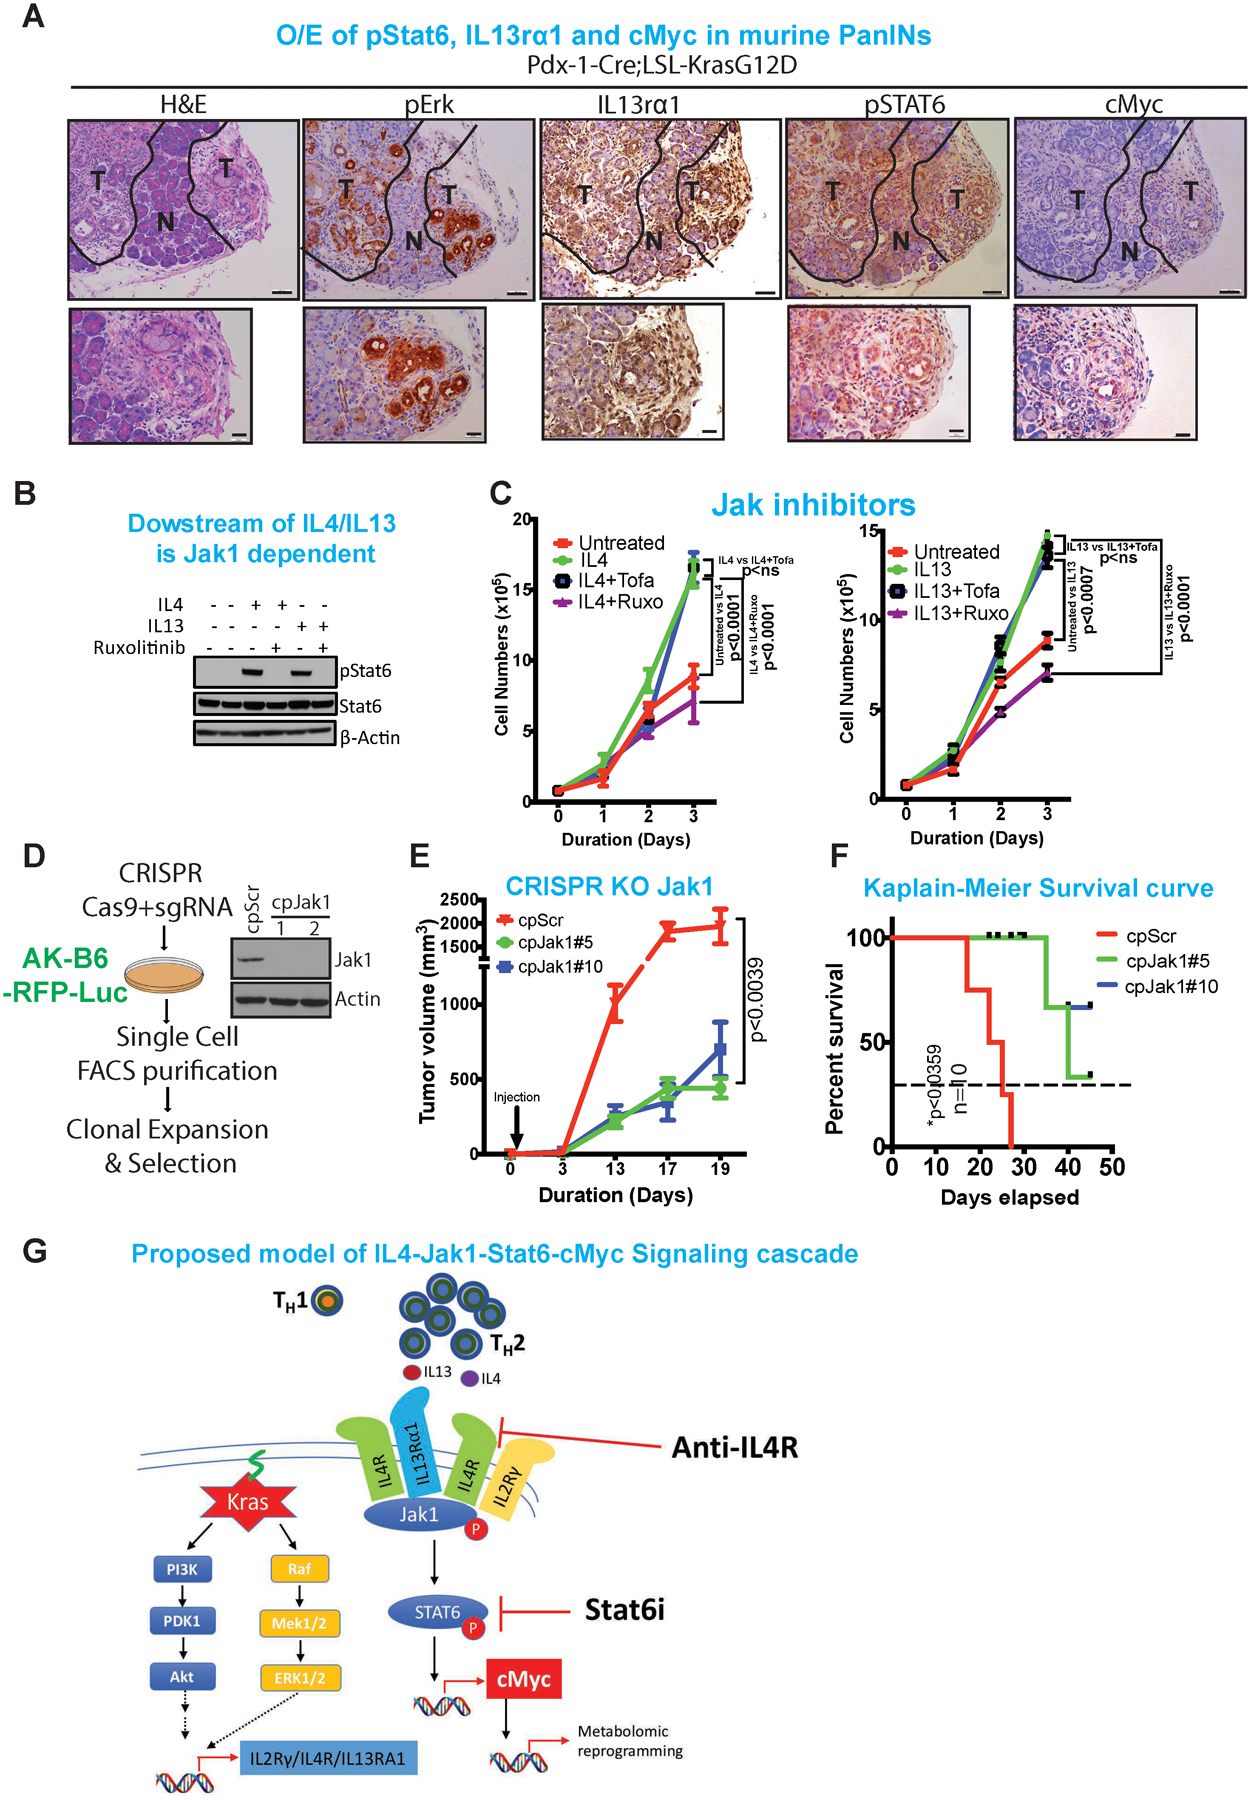
(A) Representative H&E and immunohistochemistry analysis of pErk, IL13rα1, pStat6 and cMyc in the pre-neoplastic pancreas. The lower panels are amplified images of those above. Scale bars, 100 μm (upper) and 50 μm (lower). Representative luciferase images of comparing anti-HRP vs anti-IL4 (n=10), imaged at day 4.
(B) Immunoblot of pStat6 and Stat6 upon treatment with IL4 or IL13 followed by treatment with ruxolitinib, a specific Jak1 inhibitor. β-Actin acts as a loading control.
(C) Proliferation assay of iKras cell lines upon treatment with IL4 or IL13 and followed by treatment with ruxolitinib (Jak1 inhibitor) and tofacitinib (Jak2/3 inhibitor).
(D) Strategy for CRISPR-Cas9 knockdown of Jak1 in mouse pancreas cell line. Immunoblot of Jak1 in two separate single clones of Jak1 knockout cell lines. β-Actin acts as a loading control.
(E) Tumor volume of transplanted tumor upon CRISPR-Cas9 knockout of Jak1 compared to scrambled control (n=5).
(F) Kaplain-Meier survival curves of mice transplanted with mouse tumor cell lines transfected with CRISPR-Cas9 knockout of Jak1 or control cell lines (n=10).
(G) Proposed model of IL4-Jak1-Stat-cMyc signaling cascade that includes Kras mediated upregulation IL4-IL2rγ and IL4-IL13Rα1 receptors and infiltration of TH2 cells into the tumor microenvironment.
Jak1-Stat6 pathway promotes cancer cell proliferation and tumor growth.
To assess the molecular and biological impact of these IL4- and IL13-secreting TH2 cells on cancer cell signaling, we inhibited IL4- or IL13-mediated Jak-Stat pathway activation using Ruxolitinib, a specific Jak1/2 inhibitor, and Tofacitinib, a specific Jak3 inhibitor. Consistent with the role of Jak1 above, Ruxolitinib inhibited Stat6 phosphorylation (Figure 6B) and abolished IL4- and IL13-mediated growth stimulation of PDAC cells, whereas Tofacitinib had no effect on the IL4- and IL13-mediated proliferation. (Figure 6C). Similarly, Jak1 ablation by CRISPR/Cas gene editing (Figure 6D) displayed markedly reduced tumor growth with Jak1-null cancer cells relative to unedited isogenic controls and increased survival (median survival 40 days) (Figure 6E–F). These genetic studies of inhibition of the Jak1 pathway support the role of the Jak1-Stat6 pathway in promoting PDAC growth. Of note, while anti-IL4 neutralizing antibody reduced tumor burden, these responses were not durable and the mice eventually succumbed to tumor recurrence (Supplementary Figure 6C–E), suggesting that IL13 can complement IL4 function, and any attempt to target the TH2 signaling would likely require neutralizing both IL4/IL13 cytokines. Alternatively, the common receptor for IL4/IL13 signaling, IL4R may be an attractive target, as this intervention would block the signal emanating from both IL4 and IL13.
DISCUSSION
Kras* plays a central role in PDAC initiation and maintenance thorough a variety of mechanisms involving its well established autonomous cancer cell signaling functions. In this study, we show that a novel tumor promoting function of Kras* involves establishment of a paracrine circuit utilizing T cell cytokines in the PDAC tumor microenvironment. Specifically, Kras* is shown to regulate cytokine receptor expression in the cancer cells and that infiltrating T cells provide cytokines to activate these receptors which in turn signal via Jak1-Stat6-cMyc resulting in upregulation of glycolysis genes to support cancer cell metabolic reprogramming. Targeting components of this Kras*-regulated pathway provides testable therapeutic targets for indirectly disrupting Kras* driven tumorigenesis.
Most work to date has focused on the classical role of IL4 in promoting tumor progression via activation of immune suppressive macrophages (M2 polarization)13,35 which in turn directly enhances cancer progression and metastasis via secretion of immunosuppressive molecules such as IL10 and TGF-β. This study, and the work of others36 expands the role of IL4 in the context of Kras* driven PDAC through its promoting cancer cell proliferation via Kras* mediated upregulation of cytokine receptors such as IL4R, IL2Rγ and IL13R⍺1 which in turn enables IL4 and IL13 cytokine activation of the Jak1-Stat6-cMyc pathway in cancer cells. cMYC upregulation promotes cancer cell proliferation37 and metabolic reprogramming characterized by increased glucose utilization as well as activation of the core glycolytic pathway38. Importantly, cMyc is required for metabolic reprogramming, as its deletion has been shown to diminish expression of key metabolic genes required for maintaining the above mentioned metabolic pathways1. In view of the cMyc upregulation observed in our current study, we investigated its effect on metabolic genes. Following IL4 treatment, our work confirmed enhanced glycolytic pathway activity followed by an increase in TCA cycle intermediates and diminished PPP intermediates, a feature that is known to be attributed to cMyc activation38. This finding aligns convincingly with recent in vivo metabolic studies in various cancer models, where glucose is an important source of energy39,40.
Our findings emphasize the critical nature of tumor microenvironment derived cytokines in shaping the metabolic landscape of cancer cells and further suggests that the absence of cytokines in the in vitro setting could account for the metabolic shift of cancer cells to glutaminolysis in cell culture41. Overall, our prior work1 and current study emphasize that Kras and IL4 both can regulate cMyc protein via distinct and reinforcing mechanisms. Kras is known to regulate cMyc protein stability via phosphorylation at site S6242, which inhibits proteasomal degradation of cMyc. Moreover, in our prior work1, we observed that glycolytic genes that are up-regulated with Kras* possess cMyc binding elements in the promoter. In our current study, we extend our understanding of how Kras regulates cMyc by showing that Kras also regulates a cytokine circuit that results in the transcriptional up-regulation of cMyc via activated STAT6 engagement of the upstream enhancer element of the cMyc locus.
Factors secreted by cancer cells, especially cytokines such as GM-CSF, G-CSF, etc., have been long associated with the recruitment of leukocytes into the tumor microenvironment, which creates a tumor permissive niche for cancer cells to thrive43,44. Of special interest are the T cells, because of their therapeutic potential via immune checkpoint blockade inhibition (ICI). Unfortunately, PDAC microenvironment lacks sufficient effector immune cells to mount anti-tumor immunity for any therapeutic benefit. At the same time, recent clinical studies suggest that lymphocyte function may remain an important determinant of clinical outcome, as evidenced by the expression of the inhibitory immune checkpoint genes which inversely correlate with survival. We speculate that the localization of lymphocytes in the stroma, but not in close proximity to cancer cells, might diminish their effector function and patient response to ICI therapy10 yet still enable such immune cells to support tumor development via mechanisms elucidated in this study. That is, the current study emphasizes the presence of the various T cell subtypes in the tumor microenvironment and highlights the possibility of distinct effects on tumorigenesis and cancer therapy responses. Generally, TH1 cells provide positive response to ICI such as anti-CTLA4 therapy45,46 and induction of CD8+ T cell infiltration. Whereas polarization towards TH2 cells prevents tumor rejection and facilitates tumor growth47; IL4 is one of the most abundant cytokines secreted by TH2 cells. Correspondingly, it is notable that PDAC patients with predominantly TH2 (Gata3+) polarized lymphoid infiltrate show reduced survival compared to tumors with higher TH1 cells47. Our data also revealed that infiltration of TH2 polarized cells is an early event as evidenced by their prominence in PanIN lesions, well before the pancreas parenchyma has lost its cytoarchitecture. Earlier studies have shown that other CD4+ T cell subtypes, such as TH17 cells, can also infiltrate preneoplastic lesions48,49. Accordingly, we detect approximately 12–14% (data not shown) of CD4+ TH17 cells in these early stage lesions, although IL17RA expression in cancer cells is independent of Kras* in our model.
A variety of mechanisms have been identified by which cancer cells reap the benefit of an immune rich microenvironment. It is well established that pro- and/or anti-inflammatory cytokines and chemokines sourced from various immune50–52 and stromal compartments53 can shape the tumor microenvironment and ultimately dictate the trajectory of tumor progression. These cytokines and chemokines are in a constant tussle to promote or oppose host immune responses, which can lead to tumor progression, metastasis and chemoresistance54. In addition, while Kras* is critical for all stages of tumorigenesis from initiation to metastasis, challenges surrounding anti-Kras* therapeutics, coupled with murine studies showing bypass of Kras* dependency3,55, underscore the need for alternative strategies targeting Kras*-dependent circuitry to treat pancreatic cancer. The results of this study raise the possibility that targeting the IL4-IL4R-Jak1-Stat6 signaling cascade at the level of the dual neutralization of IL4/IL13 cytokines, IL4R receptor, Jak1 and/or Stat6 may provide such a therapeutic strategy (Figure 6G). A phase II study with Ruxolitinib in Pancreatic Cancer Patients (RECAP) study showed the median overall survival (OS) was significantly greater with ruxolitinib vs placebo. In a followup trial, two randomized, phase III studies, JANUS 1 and JANUS 2 were conducted to evaluate ruxolitinib in combination with capecitabine in patients with advanced/metastatic pancreatic cancer. However, the studies were terminated, following a planned interim futility/efficacy analysis of JANUS 1, because of lack of increase in OS56. Overall, our study has provided an avenue to explore novel pancreatic cancer treatment based on the hallmarks of cancer that involve heterotypic collaborative interactions between cancer cells and cells of the TME.
METHODS
Ethics statement and animal modeling
All mouse manipulations were approved under MD Anderson Cancer Center’s Institutional Animal Care and Use Committee (IACUC). All animals were maintained in pathogen-free conditions and cared for in accordance with the International Association for Assessment and Accreditation of Laboratory Animal Care policies and certification. All surgeries were performed with isoflurane anesthesia. Analgesic was administered after surgery along with temperature-controlled post-surgical monitoring to minimize suffering. TetO_Lox-Stop-Lox-KrasG12D (tetO_KrasG12D), ROSA26-LSL-rtTA-IRES-GFP (ROSA_rtTA), p48-Cre and LSL-Trp53 strains were described previously1. Mice were backcrossed to the C57BL/6 background for more than 8 generations to achieve a pure B6 mouse, and its purity and zygosity were validated by Charles River. Mice were maintained in pathogen-free conditions at MD Anderson. Mice with spontaneous pancreas tumors were euthanized at designated time points for tumor collection. Owing to the internal location of these tumors, we used signs of lethargy, reduced mobility, and morbidity, rather than maximal tumor size, as a protocol-enforced end point.
Subcutaneous and orthotopic syngeneic models
For all experiments, C57BL/6J (Stock 000664) mice, aged 4–6 weeks were obtained from Jackson Laboratory unless otherwise mentioned. A 2×2-mm portion of the left abdomen was shaved to facilitate transplantation. Subcutaneous tumors were established by injection of 1×10⁶ cells into the flanks of mice. Tumor length and width were measured every 4–5 days and the volume was calculated according to the formula: Volume = (4/3)*3.14*(length/2)*(length/2)*(width/2). These experiments were not randomized, and the investigators were not blinded to allocation during experiments and outcome assessment. No statistical method was used to predetermine sample size. The cohort sizes for the study were estimated based on previous experience using similar mouse models that showed significance. Animals were euthanized for humane reasons when tumors were ~15 mm in diameter. Doxycycline was provided to the animals in the form of dox water (dox 2 mg/ml, sucrose 40 mg/ml) starting 2 days prior to transplantation. For orthotopic pancreas transplantation, mice were anaesthetized using ketamine/xylazine. An incision was made in the left abdomen and the pancreas was gently exposed along with the spleen. Luciferase-expressing cells were slowly injected into the tail of the pancreas using a Hamilton syringe. Five microliters of cells (5 × 10⁵) mixed with 5 μl Matrigel were injected. For the orthotopic model, animals were imaged (IVIS Spectrum, PerkinElmer) 2 days after surgery to assess successful implantation of the tumors. Only orthotopic tumors of similar luciferase intensity were used further for the study. These criteria were pre-established. Furthermore, the animals were luciferase imaged to monitor the progress of the tumor at different time points. Dox water treatment was started 2 days after transplantation. Owing to the internal location of the tumors, we used signs of lethargy, reduced mobility, and morbidity, rather than maximal tumor size, as a protocol-enforced end point.
In vivo imaging
Live in vivo imaging was performed at the Small Animal Imaging Facility at MD Anderson. MRI was performed using a Bruker ICON. For bioluminescent imaging, animals were anesthetized with isoflurane, injected intraperitoneally with 3 mg of D-Luciferin (Perkin Elmer) and imaged using IVIS Spectrum Imaging System (Perkin Elmer). The Living Image 4.7 software (Perkin Elmer) was used for analysis of the images post acquisition.
Human PDAC primary tumor samples
Human PDAC samples were obtained from MD Anderson’s tissue Biobank. The samples were stained using the standard IHC protocol. The antibodies used were IL2Rγ (Sigma Prestige HPA046641); IL4R (Bioss bs2458R); T-bet/TBX21 (CST 132325) and CD4 (Abcam ab133616). The stained samples were imaged using Pannoramic 250 slide scanner and data analyzed using Pannoramic viewer software (3DHISTECH Ltd) by two independent pathologists. Human studies were approved by MD Anderson’s Institutional Review Board, and prior informed consent was obtained from all subjects under IRB protocol LAB05–0854.
Digital microdissection of TCGA datasets
Digital microdissection of TCGA datasets were done by analyzing the mRNA expression data. Pearson correlation analysis of RNA datasets were done by comparing KRAS expression with known T cell signatures genes (CD8, IL2RG, ICOS, GZMK). A significant positive correlation of Kras with T cell signature genes was considered as co-expression of the above genes in the same tissue compartment.
Gene expression profiling and computational analysis
Gene expression profiling was performed using Affymetrix Gene Chip Mouse Genome 430 2.0 Arrays. Complete gene expression profiles are available at GEO at GSE53169. For detailed protocol of the analysis refer to Ying et al. 2012, Cell1.
Transcriptomic profiling by RNA-seq and qRT-PCR
RNA was isolated using Trizol extraction followed by purification with the Qiagen RNAeasy kit as described previously57. RNA-seq was performed by the Sequencing and Microarray Facility (SMF) core at MD Anderson. Libraries were generated using Illumina’s TruSeq kit and were sequenced using the Illumina HiSeq2000 Sequencer. Raw read RNA-seq data were mapped to hg19 reference genome using Bowtie58. The mapped reads were then assembled by Cufflinks59 to generate a transcriptome assembly for each sample. After the assembly phase, Cufflinks quantified expression level of the transcriptome in each gene for each sample (i.e., FPKM, fragments per kilobase of transcript per million fragments mapped). For qRT-PCR, RNA samples were reverse transcribed into cDNA using the High-Capacity cDNA Reverse Transcript kit (Life Technologies). cDNA samples were subjected to qRT-PCR quantification in duplicate and performed with Power SYBR Green PCR Master Mix (Life Technologies) according to the product guides on an Agilent Mx3005P and Applied Biosystems AB7500 Fast Real Time machine.
The primer sequences used for real-time qRT-PCR are the following: Kras (Fwd 5’ CAAGAGCGCCTTGACGATACA 3’, Rev 5’ CCAAGAGACAGGTTTCTCCATC 3’), ACTB (Fwd 5’ GGCTGTATTCCCCTCCATCG 3’, Rev 5’ CCAGTTGGTAACAATGCCATGT 3’), IL2rγ (Fwd 5’ AATCTGAGTGAATCCCAGCTAGA 3’, Rev 5’ GATCTCTGTTGCTCCGGTACT 3’), IL13r⍺1 (Fwd 5’ ATGCTGGGAAAATTAGGCCATC 3’, Rev 5’ ATTCTGGCATTTGTCCTCTTCAA 3’), IL4r⍺ (Fwd 5’ TCTGCATCCCGTTGTTTTGC 3’, Rev 5’ GCACCTGTGCATCCTGAATG 3’), GM-CSF (Fwd 5’ TCGTCTCTAACGAGTTCTCCTT 3’, Rev 5’ CGTAGACCCTGCTCGAATATCT 3’), E-Cadherin (Fwd 5’ CAGTTCCGAGGTCTACACCTT 3’, Rev 5’ TGAATCGGGAGTCTTCCGAAAA 3’), ITGB6 (Fwd 5’ CAGGTCCGCCAAACTGAAGAT 3’, Rev 5’ TGTTGAGGTCGTCATCCATAGA 3’)
Single cell RNA sequencing and analyses
Preparation of fresh human pancreatic tissue and dissociation into single cells: For fresh tissues undergoing single cell transcriptomic analysis, a total of 6 patients were recruited at MD Anderson Cancer Center and University of Pittsburgh Medical Center. Patients gave written informed consent to MDACC’s banking protocol (Lab00–396), which included consent to provide leftover tissue for future analysis. Tissues were distributed for scRNA-seq under MDACC’s protocol PA15–0014 for use/analysis. All work was done following institutional review board (IRB) approval at both institutions (PA15–0014, Lab08–0098, Lab05–0080, and Lab00–396). Following resection, pancreatic tissue was delivered to the laboratory on ice and dissociated into single cell suspensions as previously described60.
Single-cell transcriptomic amplification and library prep was performed using the SureCell WTA 3’ Library Prep Kit for the ddSEQ System and as previously described. Quality analysis and quantification of cDNA libraries was performed on an Agilent 2200 Tapestation system (Tapestation) using a High Sensitivity D5000 screentape (Agilent). Libraries were sequenced using a NextSeq 500 High Output Kit (Illumina). For a detailed protocol of sample preparation and analysis, refer to Bernard et al. 2018, CCR60. Digital microdissection of single barcoded cells determined to be lymphocytes from overall tumor cell populations samples was performed based on expression of CD45 and CD3 of individual cells. Location of single cells representing gene expression of interest was visualized on a dimensional reduction plot utilizing FeaturePlot. All T-SNE and heat maps were run in R v3.4.2.
Reagents, drugs, neutralizing antibodies and chemicals
Ruxolitinib and Tofacitinib were purchased from SelleckChem. 13C- and 15N-labelled isotopes were purchased from Cambridge Isotope Laboratories. Monoclonal neutralizing antibodies for in vivo experiments were obtained from BioXcell. For ICB and IL4-neutralizing antibody treatment, anti-CD4 (clone GK1.5, BioXcell, BE0003–1), anti-IL4 (clone 11B11, BioXcell, BP0045) antibodies or their respective HRP-IgG controls were intraperitoneally administered at 200 μg per injection two times per week.
CyTOF and imaging Mass Cytometry (iMC)
Metal-labeled antibodies against cell surface markers were purchased from Fluidigm. Pancreas tumor single cells were isolated using the Mouse Tumor Dissociation kit (cat# 130-096-730, Miltenyl Biotec). Cells from spleen were isolated by mincing with a 5-mL syringe plunger against a 70 μm cell strainer into a 60 mm dish with RPMI medium containing 10% fetal bovine serum (FBS). The cells were depleted of erythrocytes by hypotonic lysis. Peripheral blood (100 μL) was drawn using retroorbital bleeding and depleted of erythrocytes by hypotonic lysis. Next, tumor, spleen or blood cells were incubated with CD16/CD32 antibody (clone 2.4G2, BD Biosciences) to block FcγR binding for 10 minutes then with antibody mix for 30 minutes at room temperature. Cells were washed once and incubated with MAXPAR®Nucleic Acid Intercalator-103Rh (Cat# 201103A, Fluidigm) for 20 minutes for viability staining. Cells were fixed with 1.6% formaldehyde for 1 hour and incubated with MAXPAR®Nucleic Acid Intercalator-Ir (Cat# 201192A, Fluidigm) at 4°C overnight to stain the nuclei. The samples were analyzed with CyTOF instrument (Fluidigm) in the Flow Cytometry and Cellular Imaging Core Facility at M.D. Anderson Cancer Center. Data were analyzed with FlowJo (Tree Star) and viSNE61.The following markers were used to define different immune populations: Ly-6G 139La (Clone RB6–8C5), CD4 145Nd (Clone RM4–5), CD45 147Sm (Clone 104), CD11b 148Nd (Clone M1/70), CD3e 152Sm (Clone 145–2C11), Ly6c 162Dy (Clone HK1.4) and CD8 146Nd (Clone 53–6.7).
For iMC imaging FFPE slides are processed similar to IHC samples. A cocktail of the following rare earth metal labeled antibodies are used: CD4 156Gd (Clone EPR6855), SMA 141Pr (Clone 1A4), CD68 159Tb (Clone KP1), CD8a 162Dy (Clone D8A8Y), E-Cadherin 158Gd (Clone 24E10).
Flow cytometry
Single cells for flow cytometry are obtained as described above for CyTOF. Fluorochrome-conjugated antibodies against CD45 (clone 30-F11), CD11b (M1/70), Gr-1 (RB6–8C5), Ly-6C (HK1.4) were purchased from eBiosciences. Antibody against Ly-6G (1A8), CD4 (GK1.5), CD3 (145–2C11), CD8 (53–6.7), T-bet (4B10), IL17RB (9B10) and Gata3 (16E10A23) was purchased from BioLegend. Primary cells from mice were isolated with the same methods as in CyTOF. To assess cell viability, cells were incubated with Ghost dye violet (Tonbo Biosciences) prior to FACS analysis. All samples were acquired with the LSRFortessa analyzer (Becton Dickinson) and analyzed with FlowJo software (Tree Star).
Chromatin immunoprecipitation sequencing
ChIP was performed as described previously62 using Stat6 antibody (Cell signaling Technology, 5397). Briefly, 5 μg rabbit IgG (Santa Cruz) or Stat6 antibody was incubated with Protein A Dynabead magnetic beads (Invitrogen) for 4 h, followed by extensive washing to remove unbound antibody. Antibody beads were then added to the chromatin and incubated overnight.
Cell Culture and establishment of primary PDAC lines
All the human cell lines (Hs766T, BxPc3, Patu8988T and Patu8902) used in this study were purchased from ATCC, used below passage 25 and continuously cultured in 100 U/ml penicillin and 100 U/ml streptomycin. The cell lines were authenticated by short tandem repeat (STR) profiling at the Institute for Applied Cancer Sciences, MD Anderson Cancer Center. The Patu8988T, Hs766T and Patu8902 cell lines were routinely cultured in Dulbecco’s modified Eagle’s medium (DMEM) with 10% FBS (Invitrogen). BxPc3 cell lines were routinely cultured in Roswell Park Memorial Institute (RPMI) 1640 (Invitrogen) with 10% FBS. Primary mouse cell lines were established in the laboratory (AK-B6, AK192, HY6468, PJAK4217, PJAK4298) as described previously34 and were routinely cultured in Roswell Park Memorial Institute (RPMI) 1640 (Invitrogen) 10% FBS (Invitrogen). For inducible Kras derived cell lines, 1 ug/ml of doxycycline was directly added to the media. For metabolic and metabolomic assays, 10% dialysed FBS (Atlanta Biologicals Inc.) was used. The cell lines were mycoplasma free, based on tests done monthly in the laboratory using Lonza’s MycoAlert Mycoplasma Detection Kit assays with confirmatory tests by PCR-based assays.
Organoid culture and treatment
Pancreas organoids were cultured according to manufacturer’s protocol and using PancreaCult Pancreas Organoid media (Stem Cell Technology). Briefly the pancreas was isolated, followed by mechanical and enzymatic dispersion. The isolated tissue clusters were then filtered through a 70um filter and embedded in Matrigel63. The matrigel was layered with PancreaCult media supplemented with 100 I.U./ml Penicillin and 100 μg/ml Streptomycin (Invitrogen), 10 μM Rho associated protein kinase (ROCK) inhibitor (Stem Cell Technology). Organoids were cultured and passaged every 5 days. For IHC, organoids are harvested and fixed in formalin followed by encapsuling in histogel and embedded in paraffin. The paraffin embedded sections were stained using standard protocol for the following primary antibodies: Dclk1 (Abcam ab31704); Pan-CK (Novus Biologicals Inc. nbp2–29429) and PCNA (Abcam ab92552).
shRNA and CRISPR-Cas9 knockdown
shRNA knockdown was performed as described previously64. We screened 3–5 hairpins targeting the gene of interest and found three independent sequences that reduced mRNA levels by >60%. The shRNA sequences were as follows: IL2rγ 5’ CCGGCCCTGATCTTTGTGTACTGTTCTCGAGAACAGTACACAAAGATCAGGGTTTTTG 3’ (TRCN0000068113) and 5’ CCGGGCTGTACAGAAGCTAAACCTACTCGAGTAGGTTTAGCTTCTGT ACAGCTTTTTG 3’ (TRCN0000068117); IL4ra 5’ CCGGCCTACACTACAGGCTGATGTTCTCGAGAA CATCAGCCTGTAGTGTAGGTTTTTG 3’ (TRCN0000068188) and 5’ CCGGCCTGGAATAACCT GTACCCATCTCGAGATGGGTACAGGTTATTCCAGGTTTTTG 3’ (TRCN0000068189). A non-targeting shRNA (shCtrl) was used as a control. The shRNA-expressing pLKO.1 vector was introduced into cancer cell lines by lentiviral infection. Recombinant lentiviral particles were produced by transient transfection of 293T cells following a standard protocol. Briefly, 10 μg of the shRNA plasmid, 5 μg of psPAX2 and 2.5 μg of pMD2.G were transfected using polyethylenimine (1 μg/μl, Polysciences #23966–2) into 293T cells plated in a 100-mm dish. Viral supernatant was collected 72 h after transfection, centrifuged to remove any 293T cells and filtered (0.45 μm). For transduction, viral solutions were added to cell culture medium containing 4 μg/ml polybrene; 48 h after infection, cells were selected using 2 μg/ml puromycin and tested for gene depletion by qRT–PCR or immunoblotting. For CRISPR knockdown of Jak1, sgRNAs were purchased from Sigma (Sanger CRISPR clones). The sgRNAs were cloned into U6-gRNA: PGK-puro-2A-tagBFP (Sigma Sanger Vector). The sgJak1 sequences targets DNA regions: ATTTTAGCACAGAACGCCATGG and GACTTTCTATCTGTTGGACAGG. The plasmids were virally transduced into cell lines and the cells were puromycin selected and FACS sorted for single clones. The clones were validated by western blot for deletion of Jak1.
Immunoblotting and antibodies
Media were removed and the cells were washed twice in ice-cold phosphate-buffered saline (PBS), scraped and collected as pellets after centrifugation at 1700 g for 5 min. The pelleted cells were incubated in RIPA buffer with proteinase and phosphatase inhibitors for 15 min. Lysates were then collected and centrifuged at 208,000 × g for 15 min at 4°C. Protein concentrations were measured using the DC Protein Assay Kit (Biorad, Cat. No. 5000111). SDS–PAGE and immunoblotting were performed as described previously in pre-cast bis-Tris 4–20% gradient gels (Invitrogen)64. The following antibodies were used: IL2rγ (Abcam ab180698, bioss bs-2545R); IL13ra1 (Abcam ab79277); pAKT-S473 (CST 9271); Stat1 (CST 9172); Stat3 (CST 4904); pStat3-S727 (CST 9134); pStat2-Y690 (4441); pStat5-Y705 (CST 9145); Stat6 (abcam ab28829); Stat6 (CST); pStat6-Y641 (CST 56554); pStat5-Y694 (CST 4322); pStat5 (CST 9359); Jak1 (CST 3344); pJak1-Tyr1034/1035 (CST 74129); Jak2 (CST 3230T); Jak3 (CST 8827); pJak3 (CST 5031); Hexokinase II (CST 2867); Enolase (Abcam ab155102); pERK-p44/42 (CST 4370); cMyc (CST 5605); Pim3 (Abcam ab71321); and β-Actin (Sigma-Aldrich, A2228).
Immunohistochemistry and Immunofluroscence
Harvested tissues were immediately fixed in 10% formalin overnight and embedded in paraffin. IHC was performed as described previously62. Briefly, endogenous peroxidases were inactivated by 3% hydrogen peroxide. Non-specific signals were blocked using 3% BSA, 10% goat serum in 0.1% Triton X-100. Tumor samples were stained with the following primary antibodies: IL2Rγ (Abcam ab180698, Bioss bs-2545R); Ki67 (Vector Laboratory, VP-RM04); IL4R (Bioss bs2458R); cMyc (Abcam ab32072); Hexokinase II (Abcam ab209847); Gata-3 (CST 5852); LDHA (CST 3582); IL13rα1 (Abcam ab79277); Jak1 (CST 3344); pSTAT1-Y701 (CST 9167); pSTAT3-Y705 (CST 9145); Stat5 (CST 94205); Stat1 (CST 9172); IL4 (Abcam ab9622); IL13 (Abcam ab106732); CD45 (Abcam ab10558), CD4 (Abcam ab183685) and F4/80 (Abcam ab6640). After overnight incubation, the slides were washed and incubated with secondary antibody (HRP-polymers, Biocare Medical) for 30 min at room temperature. The slides were washed three times and stained with DAB substrate (ThermoFisher Scientific). The slides were then counterstained with haematoxylin and mounted with mounting medium. For clinical samples, staining intensity of tissue sections was scored in a ‘blinded’ manner by two independent pathologists.
Immunofluorescence slides were imaged with an Olympus Microscope and quantified with ImageJ.
Glycolytic capacity
Cells were plated into XF Cell Culture Microplates (Seahorse Bioscience) overnight at 37°C and 5% CO2. The next day, cells were treated with IL4 and/or IL13 for 1 h. To measure OCR and ECAR, media were replaced in the Seahorse microplates with assay medium free of sodium bicarbonate and FBS, and the plate was incubated in a CO2-free incubator for 1 h at 37°C. Oligomycin, FCCP, and rotenone were sequentially injected at a final concentration of 2 μg/ml, 1 μM and 1 μM, respectively. Experiments were run using an XF analyzer, and raw data were normalized with total protein measured in each well of the microplate.
Isotope Labeling and Profiling by targeted mass spectrometry
Glucose-free RPMI media was supplemented with 10% dialyzed serum and 12 mM 13C-U-glucose (Cambridge Isotope Labs). For glucose-flux analysis, cells were maintained in glucose-free RPMI media overnight. The next day the media was replaced with U-13C-glucose-containing media.
For metabolite collection, media from biological triplicates (in 10-cm dishes at 70% confluence) was fully aspirated; and the cells were snap frozen by the addition of liquid nitrogen. For metabolic extractions, 1 ml of 50% (v/v) methanol was added. Cells and the metabolite-containing samples were then collected into extraction vials. The cells were sonicated for 1 min (30 sec pulse twice) and mixed with 450 μl of ice cold chloroform and vortex mixed in a Multi-Tube Vortexer for 10 min. The resulting homogenate was mixed with 150 μl of ice cold water and vortexed again for 2 min. The homogenate was incubated at −20°C for 20 min and centrifuged at 4°C for 10 min to partition the aqueous and organic layers. The aqueous and organic layers were combined and dried at 37°C for 45 min in an Automatic Environmental Speed Vac® system (Thermo Fisher Scientific, Rockford, IL). The extract was reconstituted in 500 μl of ice cold methanol: water (50:50) and filtered through 3 KDa molecular filter (Amicon Ultracel −3K Membrane, Millipore Corporation, Billerica, MA) at 4°C for 90 min to remove proteins. The filtrate was dried at 37°C for 45 min in speed vac and stored at −80°C until mass spectrometry analysis. Prior to mass spectrometry analysis, the dried extract was resuspended in 50 μL of methanol:water (50:50) containing 0.1% formic acid and analyzed using MRM. Ten microliters were injected and analyzed using a 6490 QQQ triple quadrupole mass spectrometer (Agilent Technologies) coupled to a 1290 series HPLC system via selected reaction monitoring (SRM). Metabolites were targeted in both positive and negative ion mode, ESI voltage was +4000 V in positive ion mode and −3500 V in negative ion mode. Approximately 9–12 data points were acquired per detected metabolite. Samples were delivered to the MS via normal phase chromatography using a Luna Amino column (4um, 100A 2.1×150mm, Phenominex) at 400 ml/min gradient spanning 80% B to 2% B over a 20-min period followed by 2% B to 80% B for a 5-min period and followed by 80% B for an 8-min time period to re-equilibrate the column. Buffer A was comprised of 5 mM ammonium acetate (pH = 9.9) in water: acetonitrile.
For 13C labeled experiments, SRMs were created for expected 13C incorporation in various forms for targeted LC-MS/MS. To assess the validity of our method for calculating isotopomers, we determined the complete isotopomer distributions for each metabolite. Data analysis was performed in Quantitative analysis and estimated the % of isotopomer incorporation using the formula [% of Incorporation = 13C/13C+12C) X100] and subtracted with the natural abundance.
Statistical Analysis
GraphPad Prism software was used to conduct the statistical analysis of all data except for qPCR data where Microsoft excel was used. Data are presented as mean ± s.d. except for metabolic and metabolomic experiments where data are presented as mean ± s.e.m. All quantitative results were assessed by unpaired Student’s t-test after confirming that the data met appropriate assumptions (normality and independent sampling). The Student t-test assumed two-tailed distributions to calculate statistical significance between groups. Unless otherwise indicated, for all in vitro experiments, three technical replicates were analyzed. Sample size estimation was done taking into consideration previous experience with animal strains, assay sensitivity and tissue collection methodology used. For clinical samples, IHC staining intensity of tissue sections was scored in a ‘blinded’ manner by a pathologist. Animal survival impact was determined by the Kaplan–Meier analysis. P < 0.05 was considered statistically significant; the P values are indicated in the figures.
Supplementary Material
SIGNIFICANCE.
Type II cytokines, secreted by TH2 cells in the tumor microenvironment, can stimulate cancer cell intrinsic cMyc transcriptional upregulation to drive glycolysis. This Kras*-driven heterotypic signaling circuit in the early and advance tumor microenvironment enables cooperative pro-tumorigenic interactions, providing candidate therapeutic targets in the Kras* pathway for this intractable disease.
ACKNOWLEDGEMENTS
We thank the MD Anderson core facilities supported by P30CA16672, including Sequencing and Microarray Facility (SMF), Flow Cytometry and Cellular Imaging Core Facility; and S. Jiang and Z. Xu for assistance in maintenance of mouse colonies. The metabolomic core facility at Baylor College of Medicine supported by P30CA125123, CPRIT Proteomics and Metabolomics Core Facility (RP170005). In addition, this study was supported by NCI P01 CA117969 grant (R.A.D.); NCI R01 CA225955 (R.A.D.); DOD Postdoctoral research fellowship W81XWH-14-1-0429 (P.D.); K99/R00 grant 1K99 CA218891-01A1 (P.D.); U24 CA224020 (A.M.); R01 CA218004 (A.M.); R01 CA304969 (A.M.). We thank Dr. Raghu Kalluri and colleagues for their critical review of the manuscript.
Footnotes
Disclosure of Potential Conflicts of Interest
R.A.D. is a co-founder, advisor and director of Tvardi Therapeutics, Asylia Therapeutics, and Nirogy Therapeutics. The work of this paper is not connected with the focus on these biotechnology companies.
Data availability statement
Source Data for the main and Supplementary Data Figures are provided in the online version of this paper. All other data are available from the corresponding authors upon request.
REFERENCES
- 1.Ying H, et al. Oncogenic Kras maintains pancreatic tumors through regulation of anabolic glucose metabolism. Cell 149, 656–670 (2012). [DOI] [PMC free article] [PubMed] [Google Scholar]
- 2.Viale A, et al. Oncogene ablation-resistant pancreatic cancer cells depend on mitochondrial function. Nature 514, 628–632 (2014). [DOI] [PMC free article] [PubMed] [Google Scholar]
- 3.Kapoor A, et al. Yap1 activation enables bypass of oncogenic Kras addiction in pancreatic cancer. Cell 158, 185–197 (2014). [DOI] [PMC free article] [PubMed] [Google Scholar]
- 4.Feig C, et al. The pancreas cancer microenvironment. Clinical cancer research : an official journal of the American Association for Cancer Research 18, 4266–4276 (2012). [DOI] [PMC free article] [PubMed] [Google Scholar]
- 5.Clark CE, et al. Dynamics of the immune reaction to pancreatic cancer from inception to invasion. Cancer Res 67, 9518–9527 (2007). [DOI] [PubMed] [Google Scholar]
- 6.Steele CW, et al. Exploiting inflammation for therapeutic gain in pancreatic cancer. British journal of cancer 108, 997–1003 (2013). [DOI] [PMC free article] [PubMed] [Google Scholar]
- 7.Protti MP & De Monte L Immune infiltrates as predictive markers of survival in pancreatic cancer patients. Front Physiol 4, 210 (2013). [DOI] [PMC free article] [PubMed] [Google Scholar]
- 8.Ino Y, et al. Immune cell infiltration as an indicator of the immune microenvironment of pancreatic cancer. Br J Cancer 108, 914–923 (2013). [DOI] [PMC free article] [PubMed] [Google Scholar]
- 9.Vonderheide RH & Bayne LJ Inflammatory networks and immune surveillance of pancreatic carcinoma. Curr Opin Immunol 25, 200–205 (2013). [DOI] [PMC free article] [PubMed] [Google Scholar]
- 10.Blando J, et al. Comparison of immune infiltrates in melanoma and pancreatic cancer highlights VISTA as a potential target in pancreatic cancer. Proc Natl Acad Sci U S A 116, 1692–1697 (2019). [DOI] [PMC free article] [PubMed] [Google Scholar]
- 11.Bluestone JA, Mackay CR, O’Shea JJ & Stockinger B The functional plasticity of T cell subsets. Nat Rev Immunol 9, 811–816 (2009). [DOI] [PMC free article] [PubMed] [Google Scholar]
- 12.Coussens LM, Zitvogel L & Palucka AK Neutralizing tumor-promoting chronic inflammation: a magic bullet? Science 339, 286–291 (2013). [DOI] [PMC free article] [PubMed] [Google Scholar]
- 13.DeNardo DG, et al. CD4(+) T cells regulate pulmonary metastasis of mammary carcinomas by enhancing protumor properties of macrophages. Cancer Cell 16, 91–102 (2009). [DOI] [PMC free article] [PubMed] [Google Scholar]
- 14.Rajamani D & Bhasin MK Identification of key regulators of pancreatic cancer progression through multidimensional systems-level analysis. Genome Med 8, 38 (2016). [DOI] [PMC free article] [PubMed] [Google Scholar]
- 15.Terabe M, Park JM & Berzofsky JA Role of IL-13 in regulation of anti-tumor immunity and tumor growth. Cancer Immunol Immunother 53, 79–85 (2004). [DOI] [PMC free article] [PubMed] [Google Scholar]
- 16.Asao H, et al. Cutting edge: the common gamma-chain is an indispensable subunit of the IL-21 receptor complex. J Immunol 167, 1–5 (2001). [DOI] [PubMed] [Google Scholar]
- 17.Ayars M, et al. IL2RG, identified as overexpressed by RNA-seq profiling of pancreatic intraepithelial neoplasia, mediates pancreatic cancer growth. Oncotarget 8, 83370–83383 (2017). [DOI] [PMC free article] [PubMed] [Google Scholar]
- 18.O’Shea JJ, Holland SM & Staudt LM JAKs and STATs in immunity, immunodeficiency, and cancer. N Engl J Med 368, 161–170 (2013). [DOI] [PMC free article] [PubMed] [Google Scholar]
- 19.Berta MA, Baker CM, Cottle DL & Watt FM Dose and context dependent effects of Myc on epidermal stem cell proliferation and differentiation. EMBO Mol Med 2, 16–25 (2010). [DOI] [PMC free article] [PubMed] [Google Scholar]
- 20.Schuhmacher M & Eick D Dose-dependent regulation of target gene expression and cell proliferation by c-Myc levels. Transcription 4, 192–197 (2013). [DOI] [PMC free article] [PubMed] [Google Scholar]
- 21.Armelin HA, et al. Functional role for c-myc in mitogenic response to platelet-derived growth factor. Nature 310, 655–660 (1984). [DOI] [PubMed] [Google Scholar]
- 22.Dang CV MYC on the path to cancer. Cell 149, 22–35 (2012). [DOI] [PMC free article] [PubMed] [Google Scholar]
- 23.Koh CM, et al. Alterations in nucleolar structure and gene expression programs in prostatic neoplasia are driven by the MYC oncogene. Am J Pathol 178, 1824–1834 (2011). [DOI] [PMC free article] [PubMed] [Google Scholar]
- 24.Wang H, et al. c-Myc depletion inhibits proliferation of human tumor cells at various stages of the cell cycle. Oncogene 27, 1905–1915 (2008). [DOI] [PMC free article] [PubMed] [Google Scholar]
- 25.Cappellen D, Schlange T, Bauer M, Maurer F & Hynes NE Novel c-MYC target genes mediate differential effects on cell proliferation and migration. EMBO Rep 8, 70–76 (2007). [DOI] [PMC free article] [PubMed] [Google Scholar]
- 26.Yuneva M, Zamboni N, Oefner P, Sachidanandam R & Lazebnik Y Deficiency in glutamine but not glucose induces MYC-dependent apoptosis in human cells. J Cell Biol 178, 93–105 (2007). [DOI] [PMC free article] [PubMed] [Google Scholar]
- 27.Shim H, Chun YS, Lewis BC & Dang CV A unique glucose-dependent apoptotic pathway induced by c-Myc. Proc Natl Acad Sci U S A 95, 1511–1516 (1998). [DOI] [PMC free article] [PubMed] [Google Scholar]
- 28.Mayers JR, et al. Tissue of origin dictates branched-chain amino acid metabolism in mutant Kras-driven cancers. Science 353, 1161–1165 (2016). [DOI] [PMC free article] [PubMed] [Google Scholar]
- 29.Davidson SM, et al. Direct evidence for cancer-cell-autonomous extracellular protein catabolism in pancreatic tumors. Nat Med 23, 235–241 (2017). [DOI] [PMC free article] [PubMed] [Google Scholar]
- 30.Choi P & Reiser H IL-4: role in disease and regulation of production. Clin Exp Immunol 113, 317–319 (1998). [DOI] [PMC free article] [PubMed] [Google Scholar]
- 31.Bao K & Reinhardt RL The differential expression of IL-4 and IL-13 and its impact on type-2 immunity. Cytokine 75, 25–37 (2015). [DOI] [PMC free article] [PubMed] [Google Scholar]
- 32.Carstens JL, et al. Spatial computation of intratumoral T cells correlates with survival of patients with pancreatic cancer. Nat Commun 8, 15095 (2017). [DOI] [PMC free article] [PubMed] [Google Scholar]
- 33.Mikhalkevich N, et al. Responsiveness of naive CD4 T cells to polarizing cytokine determines the ratio of Th1 and Th2 cell differentiation. J Immunol 176, 1553–1560 (2006). [DOI] [PubMed] [Google Scholar]
- 34.Aguirre AJ, et al. Activated Kras and Ink4a/Arf deficiency cooperate to produce metastatic pancreatic ductal adenocarcinoma. Genes Dev 17, 3112–3126 (2003). [DOI] [PMC free article] [PubMed] [Google Scholar]
- 35.Wang HW & Joyce JA Alternative activation of tumor-associated macrophages by IL-4: priming for protumoral functions. Cell Cycle 9, 4824–4835 (2010). [DOI] [PMC free article] [PubMed] [Google Scholar]
- 36.Bankaitis KV & Fingleton B Targeting IL4/IL4R for the treatment of epithelial cancer metastasis. Clin Exp Metastasis 32, 847–856 (2015). [DOI] [PMC free article] [PubMed] [Google Scholar]
- 37.Bernard S & Eilers M Control of cell proliferation and growth by Myc proteins. Results Probl Cell Differ 42, 329–342 (2006). [DOI] [PubMed] [Google Scholar]
- 38.Dang CV MYC, metabolism, cell growth, and tumorigenesis. Cold Spring Harb Perspect Med 3(2013). [DOI] [PMC free article] [PubMed] [Google Scholar]
- 39.Hosios AM, et al. Amino Acids Rather than Glucose Account for the Majority of Cell Mass in Proliferating Mammalian Cells. Dev Cell 36, 540–549 (2016). [DOI] [PMC free article] [PubMed] [Google Scholar]
- 40.Davidson SM, et al. Environment Impacts the Metabolic Dependencies of Ras-Driven Non-Small Cell Lung Cancer. Cell Metab 23, 517–528 (2016). [DOI] [PMC free article] [PubMed] [Google Scholar]
- 41.Son J, et al. Glutamine supports pancreatic cancer growth through a KRAS-regulated metabolic pathway. Nature 496, 101–105 (2013). [DOI] [PMC free article] [PubMed] [Google Scholar]
- 42.Vaseva AV, et al. KRAS Suppression-Induced Degradation of MYC Is Antagonized by a MEK5-ERK5 Compensatory Mechanism. Cancer Cell 34, 807–822 e807 (2018). [DOI] [PMC free article] [PubMed] [Google Scholar]
- 43.Bayne LJ, et al. Tumor-derived granulocyte-macrophage colony-stimulating factor regulates myeloid inflammation and T cell immunity in pancreatic cancer. Cancer Cell 21, 822–835 (2012). [DOI] [PMC free article] [PubMed] [Google Scholar]
- 44.Pylayeva-Gupta Y, Lee KE, Hajdu CH, Miller G & Bar-Sagi D Oncogenic Kras-induced GM-CSF production promotes the development of pancreatic neoplasia. Cancer Cell 21, 836–847 (2012). [DOI] [PMC free article] [PubMed] [Google Scholar]
- 45.Ubaldi V, Gatta L, Pace L, Doria G & Pioli C CTLA-4 engagement inhibits Th2 but not Th1 cell polarisation. Clin Dev Immunol 10, 13–17 (2003). [DOI] [PMC free article] [PubMed] [Google Scholar]
- 46.Eagar TN, et al. CTLA-4 regulates expansion and differentiation of Th1 cells following induction of peripheral T cell tolerance. J Immunol 172, 7442–7450 (2004). [DOI] [PubMed] [Google Scholar]
- 47.De Monte L, et al. Intratumor T helper type 2 cell infiltrate correlates with cancer-associated fibroblast thymic stromal lymphopoietin production and reduced survival in pancreatic cancer. J Exp Med 208, 469–478 (2011). [DOI] [PMC free article] [PubMed] [Google Scholar]
- 48.Zhang Y, et al. Immune Cell Production of Interleukin 17 Induces Stem Cell Features of Pancreatic Intraepithelial Neoplasia Cells. Gastroenterology 155, 210–223 e213 (2018). [DOI] [PMC free article] [PubMed] [Google Scholar]
- 49.McAllister F, et al. Oncogenic Kras activates a hematopoietic-to-epithelial IL-17 signaling axis in preinvasive pancreatic neoplasia. Cancer Cell 25, 621–637 (2014). [DOI] [PMC free article] [PubMed] [Google Scholar]
- 50.Landskron G, De la Fuente M, Thuwajit P, Thuwajit C & Hermoso MA Chronic inflammation and cytokines in the tumor microenvironment. J Immunol Res 2014, 149185 (2014). [DOI] [PMC free article] [PubMed] [Google Scholar]
- 51.Dranoff G Cytokines in cancer pathogenesis and cancer therapy. Nat Rev Cancer 4, 11–22 (2004). [DOI] [PubMed] [Google Scholar]
- 52.Van Acker HH, et al. The role of the common gamma-chain family cytokines in gammadelta T cell-based anti-cancer immunotherapy. Cytokine Growth Factor Rev 41, 54–64 (2018). [DOI] [PubMed] [Google Scholar]
- 53.Sherman MH, et al. Stromal cues regulate the pancreatic cancer epigenome and metabolome. Proc Natl Acad Sci U S A 114, 1129–1134 (2017). [DOI] [PMC free article] [PubMed] [Google Scholar]
- 54.Ying H, et al. Genetics and biology of pancreatic ductal adenocarcinoma. Genes Dev 30, 355–385 (2016). [DOI] [PMC free article] [PubMed] [Google Scholar]
- 55.Muzumdar MD, et al. Survival of pancreatic cancer cells lacking KRAS function. Nat Commun 8, 1090 (2017). [DOI] [PMC free article] [PubMed] [Google Scholar]
- 56.Hurwitz H, et al. Ruxolitinib + capecitabine in advanced/metastatic pancreatic cancer after disease progression/intolerance to first-line therapy: JANUS 1 and 2 randomized phase III studies. Invest New Drugs 36, 683–695 (2018). [DOI] [PMC free article] [PubMed] [Google Scholar]
- 57.Dey P, et al. Estrogen receptors beta1 and beta2 have opposing roles in regulating proliferation and bone metastasis genes in the prostate cancer cell line PC3. Mol Endocrinol 26, 1991–2003 (2012). [DOI] [PMC free article] [PubMed] [Google Scholar]
- 58.Langmead B & Salzberg SL Fast gapped-read alignment with Bowtie 2. Nat Methods 9, 357–359 (2012). [DOI] [PMC free article] [PubMed] [Google Scholar]
- 59.Trapnell C, et al. Differential gene and transcript expression analysis of RNA-seq experiments with TopHat and Cufflinks. Nat Protoc 7, 562–578 (2012). [DOI] [PMC free article] [PubMed] [Google Scholar]
- 60.Bernard V, et al. Single-Cell Transcriptomics of Pancreatic Cancer Precursors Demonstrates Epithelial and Microenvironmental Heterogeneity as an Early Event in Neoplastic Progression. Clin Cancer Res 25, 2194–2205 (2019). [DOI] [PMC free article] [PubMed] [Google Scholar]
- 61.Amir el AD, et al. viSNE enables visualization of high dimensional single-cell data and reveals phenotypic heterogeneity of leukemia. Nat Biotechnol 31, 545–552 (2013). [DOI] [PMC free article] [PubMed] [Google Scholar]
- 62.Dey P, Strom A & Gustafsson JA Estrogen receptor beta upregulates FOXO3a and causes induction of apoptosis through PUMA in prostate cancer. Oncogene 33, 4213–4225 (2014). [DOI] [PubMed] [Google Scholar]
- 63.Sato T, et al. Single Lgr5 stem cells build crypt-villus structures in vitro without a mesenchymal niche. Nature 459, 262–265 (2009). [DOI] [PubMed] [Google Scholar]
- 64.Dey P, et al. Genomic deletion of malic enzyme 2 confers collateral lethality in pancreatic cancer. Nature 542, 119–123 (2017). [DOI] [PMC free article] [PubMed] [Google Scholar]
Associated Data
This section collects any data citations, data availability statements, or supplementary materials included in this article.