

Abstract
Myeloid-derived suppressor cells (MDSCs) are innate immune cells that acquire the capacity to suppress adaptive immune responses during cancer. It remains elusive how MDSCs differ from their normal myeloid counterparts, which limits our ability to specifically detect and therapeutically target MDSCs during cancer. Here, we sought to determine the molecular features of breast cancer-associated MDSCs using the widely studied mouse model based on mammary tumor virus (MMTV) promoter-driven expression of the polyoma middle T oncoprotein (MMTV-PyMT). To identify MDSCs in an unbiased manner, we used single-cell RNAseq to compare MDSC-containing splenic myeloid cells from breast tumor-bearing mice to wildtype controls. Our computational analysis of 14,646 single-cell transcriptomes revealed that MDSCs emerge through an aberrant neutrophil maturation trajectory in the spleen that confers them an immunosuppressive cell state. We establish the MDSC-specific gene signature and identify CD84 as a surface marker for improved detection and enrichment of MDSCs in breast cancers.
One Sentence Summary:
Alshetaiwi et al. identify CD84 to be a robust MSDC-specific cell surface marker in breast cancers.
Introduction
Breast cancer is one of the most prevalent types of cancer with over 260,000 new cases and over 40,000 deaths in 2018 in the US1. During tumor development, breast cancer cells secrete various cytokines such as granulocyte-macrophage colony-stimulating factor (GM-CSF), which exert systemic effects on hematopoiesis and myeloid cell differentiation promoting the development of myeloid-derived suppressor cells (MDSCs)2,3. These MDSCs are a heterogeneous population of neutrophil- and monocyte-like myeloid cells, which are increasingly recognized as key mediators of immune suppression in various types of cancer3,4. In cancer patients, increased numbers of MDSCs in circulation correlate with advanced clinical stages, increased metastatic progression and immune suppression5. MDSCs can mediate immune suppression through multiple mechanisms including the production of reactive oxygen species (ROS) and depletion of key amino acids required for T cell proliferation through expression of arginase (Arg) and indoleamine 2,3-dioxygenase (IDO)6,7,8. In addition, MDSCs produce a range of immunosuppressive and cancer-promoting cytokines including IL-10 and TGF-β9. Besides their immune-suppressive function, MDSCs may also actively shape the tumor microenvironment through complex crosstalk with breast cancer cells and surrounding stroma, resulting in increased angiogenesis, tumor invasion, and metastasis8,10,11.
The unique molecular features of MDSCs are currently unclear and it remains elusive whether MDSCs represent a unique subpopulation of myeloid cells that differ from their normal, healthy counterparts. This limits our ability to determine specific MDSC functions as opposed to bulk-level changes in neutrophils or monocytes during cancer. In mice, MDSCs are defined through the expression of CD11b+Gr1+ and can be further classified into CD11b+Ly6ClowLy6G+ granulocytic MDSCs (G-MDSCs) and CD11b+Ly6C+Ly6G− monocytic MDSCs (M-MDSCs)12. In humans, G-MDSCs are defined as CD11b+CD14−CD15+ or CD11b+CD14−CD66b+and M-MDSCs as CD11b+CD14+HLA-DR−/lowCD15− followed by additional functional characteristics such as T cells suppression and ROS assays12. However, these markers overlap with those defining healthy neutrophils and monocytes, which makes it challenging to distinguish MDSCs from normal cells to advance our understanding of MDSC biology and ultimately, to establish novel therapeutic avenues to interfere with their tumor-promoting and immune suppressive roles.
Here, we used single-cell RNA sequencing (scRNAseq) to delineate the molecular features of MDSCs in the MMTV-PyMT mouse model of breast cancer. Our computational analysis of 14,646 single cell transcriptomes revealed a unique MDSC gene signature, which is largely shared between G-MDSCs and M-MDSCs, but which strongly differs from their normal myeloid counterparts. Focusing on G-MDSCs, our pseudotemporal analysis delineates the emergence of MDSCs as an aberrant differentiation state that forms a separate branch during the transition of neutrophil progenitors into mature neutrophils. Further interrogation of the distinct MDSC gene expression signature identified several novel surface markers (e.g. CD84, JAML) for faithful MDSC detection and prospective enrichment.
Results
The spleen is the predominant site of MDSC accumulation in tumor-bearing mice
Mice expressing the polyomavirus middle T antigen (PyMT) driven by the mouse mammary tumor virus (MMTV) promoter13 develop breast tumors that closely resembles human pathogenesis14 and give rise to MDSCs during tumor progression2. Here, we used the MMTV-PyMT transgenic mouse model of breast cancer to explore the role of MDSCs during breast cancer progression. We first sought to confirm the most reliable organ site of MDSC accumulation for further molecular studies of this cell population. In agreement with previous reports in other murine models of cancer2, we observed that later stages of cancer progression were associated with an expansion of CD11b+Gr1+ myeloid cells in bone marrow, blood, spleens, lungs, brains and primary tumors (fig. S1A–C), and an enlargement of the spleen of tumor-bearing PyMT mice compared to wildtype (WT) controls (fig. S1D–E). To functionally confirm whether MDSCs are present in expanded populations of CD11b+Gr1+ cells in tumor-bearing mice, we isolated CD11b+Gr1+ cells from various organs of tumor-bearing and control mice by fluorescence-activated cell sorting (FACS) and co-cultured these with isolated T cells to measure suppression of T cell proliferation induced by CD3/CD28 co-stimulation2, and reactive oxygen species (ROS) formation as a read-out for MDSC function12 (fig. S2A). We found that CD11b+Gr1+ cells sorted from spleens of tumor-bearing mice significantly suppressed CD4+ and CD8+ T cell proliferation (fig. S2B–C), whereas CD11b+Gr1+ cells from control spleens showed no measurable effect on T cell proliferation. Of note, CD11b+Gr1+ cells sorted from bone marrow (fig. S2D–E) and lungs (fig. S2F–G) of tumor- bearing mice demonstrated nonsignificant suppression of T cell proliferation. These findings were further corroborated by ROS production assays as measured by flow cytometry using 2ʹ,7ʹ-Dichlorofluorescin diacetate (H2DCFDA), which showed that only spleen-derived CD11b+Gr1+ cells from tumor-bearing mice exhibited significant oxidative burst formation as a hallmark for MDSCs (fig. S2H–I). Together, these results establish the spleen as one of the major sites of MDSC emergence during breast tumor formation in PyMT mice.
Single-cell transcriptomics reveal MDSCs as distinct clusters within neutrophilic and monocytic lineages
In order to determine how MDSCs differ from their normal myeloid counterparts on a cellular and molecular level, we used scRNAseq to compare the molecular differences of spleen-derived myeloid cells in tumor-bearing mice against the respective cell population from WT mice on an individual cell basis. We utilized a scalable droplet-mediated scRNAseq platform (10X Genomics Chromium) to profile FACS-purified live (Sytox-negative) CD45+CD11b+Gr1+ myeloid cells from the spleens of tumor-bearing PyMT and control WT mice (Fig. 1A). We profiled two samples from tumor-bearing PyMT mice (9,155 cells) and WT control mice (5,491 cells), respectively, for a total of 14,646 cells that were sequenced at an average depth of ~50,000 reads per cell. The two libraries were aggregated and aligned together using the CellRanger pipeline (10X Genomics) to compensate for minor differences in library complexity. After quality control filtering to remove cells with low gene detection (<500genes) and high mitochondrial gene content (>8%), we performed clustering and cell type identification analysis of combined PyMT and WT datasets using Seurat15 (Fig. S3A). Using the canonical correlation analysis (CCA) method16, we identified the main cell types based on expression of hallmark genes for myeloid subsets (Fig. 1B), and determined their marker genes (Fig. S3C; table S1). Neutrophils formed the largest population encompassing numerous distinct clusters (C0, C2, C4, C5, C7 and C8) characterized by high levels of Ly6g and Cxcr2 expression (Fig. 1B–C). Monocytes were less abundant and less diverse forming one cluster (C1) that was marked by expression of Csf1r and Ccr2 (Fig. 1B–C). We also detected two minor cell types: T cells (C9) expressing Cd3, Cd4, Cd8; and B cells (C6 and C3) expressing Cd19, Cd22, Cd79a (Fig. 1B–C).
Fig. 1. Identifying MDSC-specific gene expression signatures using scRNAseq.
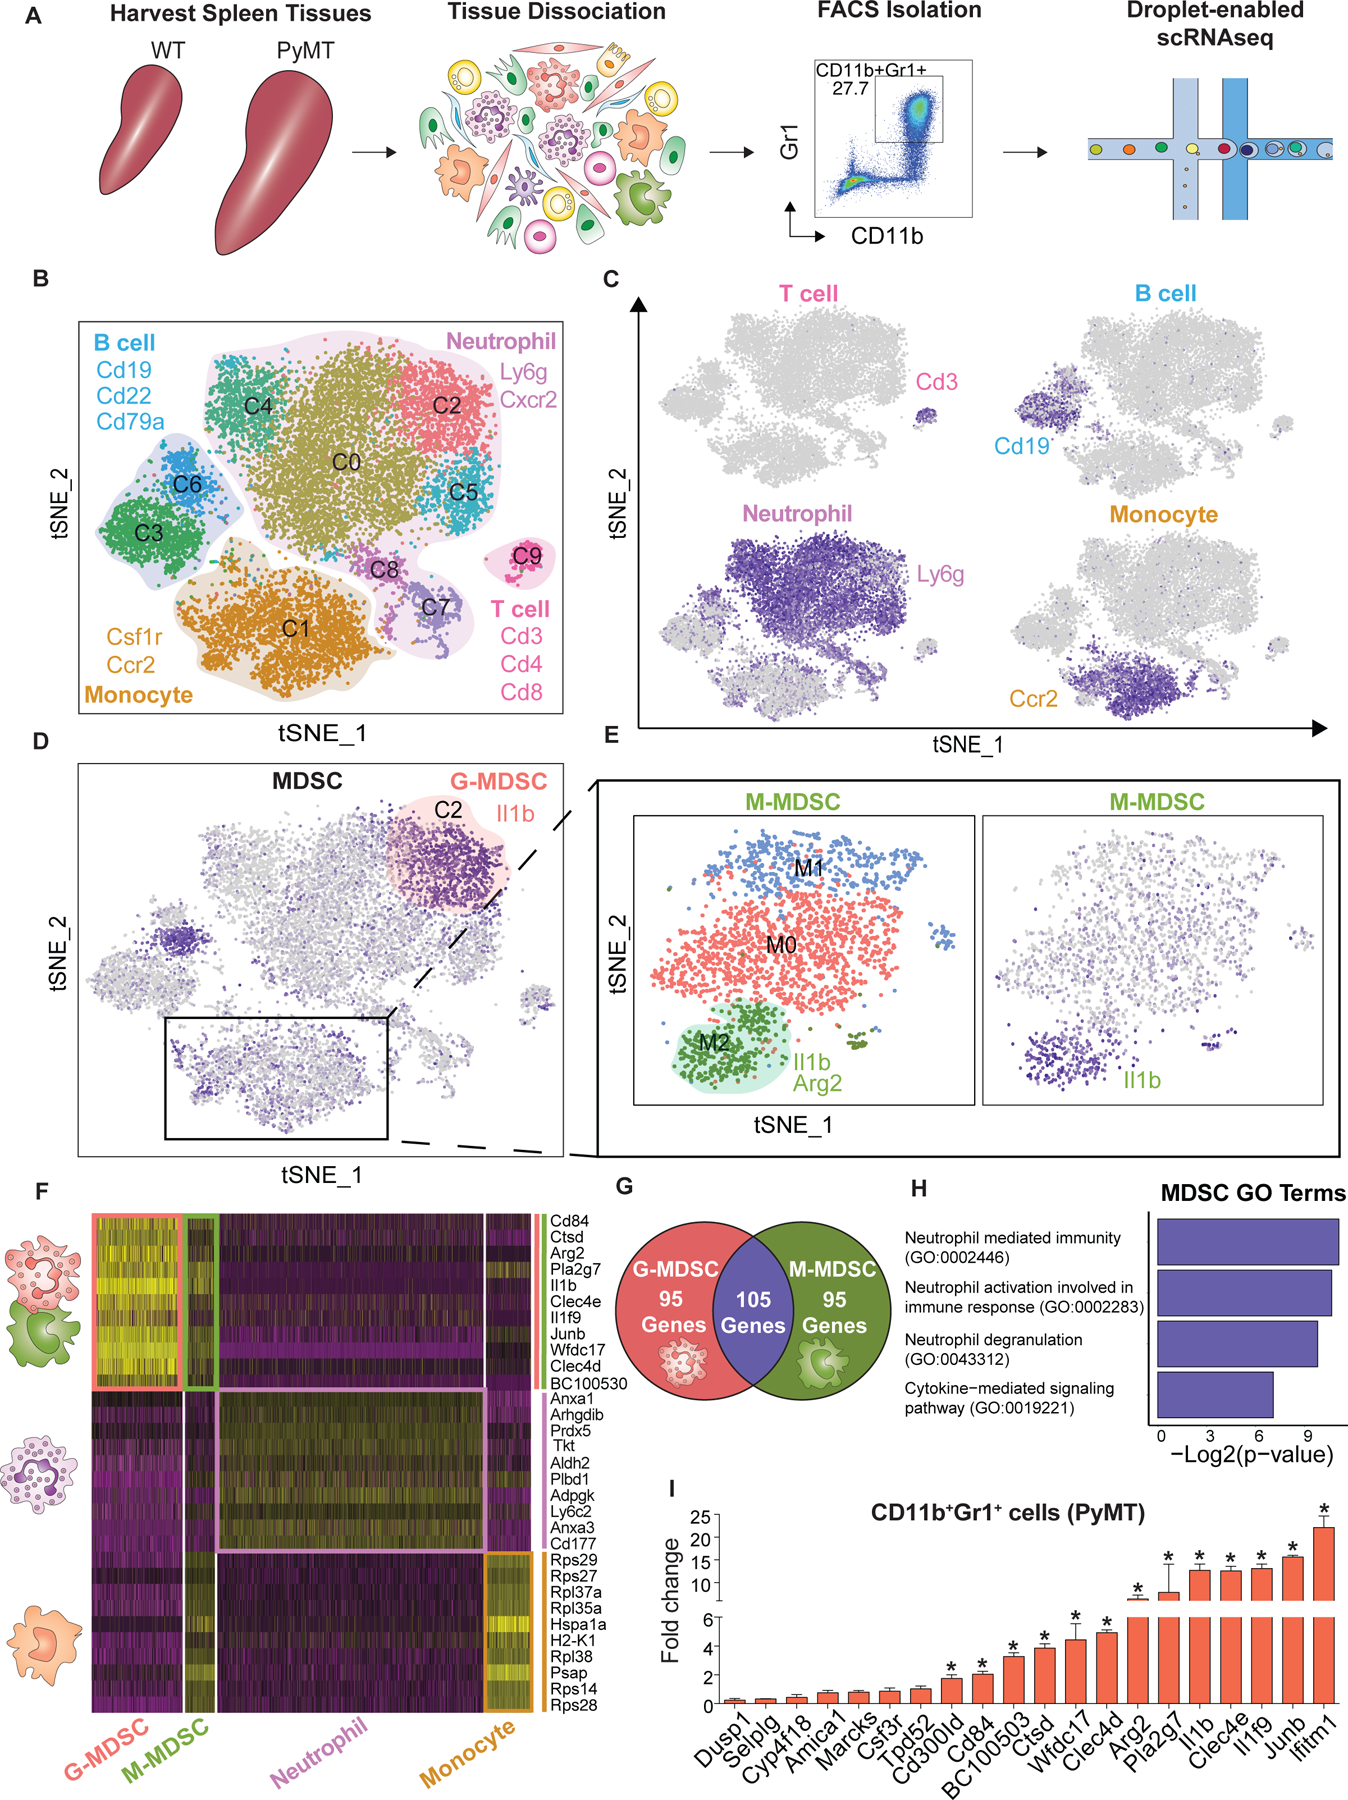
(A) Approach overview for single-cell analysis of and (sytox blue-negative) CD45+CD11b+Gr1+ cells were sorted from the spleen of control WT and tumor-bearing PyMT’s mice by FACS following droplet-enabled scRNAseq. (B-C) Combined Seurat analysis of in total 14,646 cells from control and PyMT mice shown in tSNE projection results in various distinct clusters of splenic CD11b+Gr1+ cells. Main cell types (T cells, B cells, neutrophils, monocytes) are outlined based on hallmark gene expression. (C) Feature plots of characteristic markers of the four main cell types showing expression levels with low expression in grey to high expression in dark blue. (D) G-MDSCs were identified in cluster C1 by expression marker genes (Arg2 & Il1β) from the PyMT sample. (E) Subset analysis of monocytes cluster identified M-MDSCs. Three clusters were found; cluster M2 was identified as M-MDSCs (positive for Arg2 & Il1β). (F) Heatmap displaying the scaled expression patterns of top marker genes within each G-MDSCs and M-MDSCs clusters compared to normal neutrophil and monocyte clusters from WT mice, respectively; yellow = high expression; purple = low expression. (G) Venn diagram showing the number of statistically significant marker genes and overlap between G-MDSC and M-MDSC. (H) Gene ontology (GO) term analysis using Enrichr of curated MDSC signature. (I) Validation using qPCR of selected upregulated MDSC genes, statistical analysis unpaired t-test (Mean ± SEM of n = 3) *P< 0.05.
Further interrogation of neutrophil heterogeneity revealed that cluster C0 was marked by high levels of genes associated with a mature neutrophil state such as Camp17 and high Ly6g expression18; cluster C2 was strongly enriched in tumor-bearing PyMT mice (fig. S3E) and displayed high expression of MDSC-related genes such as Il1β and Arg2, two major immunosuppressive factors previously used to define MDSCs in cancer models4,19 (Fig. 1D); clusters C4 and C5 displayed overlapping marker gene expression including genes such as Cebpe and Retnig; clusters C7 and C8 exhibited high expression of cell cycle genes such as Tuba1b and Cdc20 indicating the existence of a proliferative pool of neutrophils in the spleen.
We next focused on the monocyte-restricted cluster C1, which showed diffuse expression of MDSC genes Arg2 and Il1b in the combined analysis (Fig. 1D) suggesting that M-MDSCs were present but did not cluster distinctly from monocytes due to the more substantial differences between different cell types in the combined analysis. Therefore, we performed a monocyte-only clustering analysis after removal of contaminating cells such as neutrophils and B cells to identify three distinct states (clusters M0-M2) including a distinct M-MDSC population in cluster M2, which was strongly enriched in tumor-bearing PyMT mice (Fig. 1E; fig. S3B, D, F; table S2). These analyses formed the basis for a detailed molecular definition of G- and M-MDSCs as described below. Our dataset represents a valuable single-cell level transcriptome analysis of MDSCs, which revealed that G- and M-MDSCs form distinct clusters that are unique from their normal myeloid counterparts.
G- and M-MDSCs share a conserved immune cell activation program that differs from normal myeloid cells
We next utilized our scRNAseq dataset to reveal the unique molecular features of MDSCs and to unravel the distinct biological programs that define the MDSC state. We performed differential expression analysis in Seurat to determine how G- and M-MDSCs from tumor- bearing mice differ from their normal counterparts, namely neutrophils and monocytes in WT mice (Fig. 1F). Our analysis revealed 642 differentially expressed genes in G-MDSCs compared to normal neutrophils (table S3), and 223 differentially expressed genes in M-MDSCs compared to normal monocytes (table S4) demonstrating that MDSCs differ substantially from their normal myeloid counterparts. Interestingly, there was substantial overlap between gene signatures for G- and M-MDSCs (105 of 200 top marker genes, Fig. 1G; table S5) indicating that a similar immune-suppressive cell state can be acquired by both monocytes and neutrophils independently. Shared markers included genes involved in immune suppression such as Il1b, Arg2, Cd84 and Wfdc1720. Interferon-induced transmembrane protein 1 (Ifitm1), which has been reported to be involved in progression of colorectal cancer21,22 and inflammatory breast cancer cells23 was upregulated in MDSCs. Additional MDSC markers included myeloid associated immunoglobulin like receptor family (Cd300ld), C-type lectin domain family 4-member E and D (Clec4e and Clec4d), Interleukin 1f9 (Il1f9), AP-1 transcription factor subunit (Junb), Cathepsin D (Ctsd), phospholipase A2 group VII (Pla2g7) and cystatin domain containing 5 (BC100530).
We next performed gene ontology (GO) term analysis on our MDSC gene signature (table S 5) using Enrichr (GO Biological Process 2018)24. The top GO terms included ‘neutrophil mediated immunity’, ‘neutrophil activation involved in immune response’ and ‘neutrophil degranulation’ (Fig. 1H; table S6). Those terms included genes encoding complement C5a receptor 1 (C5ar1), S100 Calcium binding protein A11(S100a11), C-type lectin domain family 4 member D (Clec4d), chemokine receptor 2 (Cxcr2), and myeloid cell surface antigen CD33 (Cd33). Interestingly, several of these factors promote recruitment of neutrophils and MDSCs as reported for C5ar125,26, and S100a8/927,28. In addition, Cd33 is specifically expressed in MDSCs29 and is currently pursued as a target in therapeutic approaches30. Another significant GO term ‘Cytokine-mediated signaling pathway’ (Fig. 1H) included genes such as Il1β, Ifitm1, Junb, and Myd88. In particular, Myd88 has been reported to promote expansion of immature Gr1+ cells and may be involved in mediating T cell suppressing cell states31. Additionally, this pathway included genes associated with MDSCs accumulation and trafficking such as Cxcr232,33, Csf3r34 and Ccr135, suggesting that MDSCs may be able to respond to recruitment signals from sites of inflammation such as the primary tumor or metastatic sites.
To validate the MDSC gene signature we isolated CD11b+Gr1+ cells from spleens of WT and tumor-bearing PyMT mice by FACS and subjected to quantitative PCR (qPCR). Our scRNAseq results were broadly confirmed in this targeted approach, since a large proportion of MDSC signature genes were significantly upregulated in CD11b+Gr1+ cells from PyMT compared to WT (Fig. 1I). Taken together, these analyses revealed that G- and M-MDSCs share a conserved gene signature that strongly differs from their normal myeloid counterparts. This shared MDSC marker gene list shows certain differences and as well as overlap with previous bulk transcriptome-level analyses of MDSCs, and it would be interesting to systematically determine whether bulk-level changes in these myeloid cell populations mask certain specific programs underlying MDSC cell function.
The MDSC gene signature is highly expressed in human breast cancer-associated neutrophils
To determine whether this MDSC gene signature is generalizable and translatable into the human context, we explored a recently published scRNAseq immune cell map including T cells, B cells, monocytes, and neutrophils from primary tumor samples of breast cancer patients36. We performed clustering of this dataset in Seurat to reproduce cell type labels (Fig. 2A), and then carried out an unbiased gene signature scoring of all cell types, which revealed that specifically neutrophils and monocytes in the tumor microenvironment express high levels of MDSC signature genes (Fig. 2B). To assess whether there are distinct subsets of neutrophils with particularly high MDSC signatures, we also analyzed neutrophils separately using unbiased clustering yielding four distinct states (Fig. 2C–D). Interestingly, cluster N0 showed MDSC-related marker genes S100A9 and CCR2, suggesting that this subset of neutrophils represents G-MDSCs in the tumor microenvironment of breast cancer patients. Gene scoring analysis using our MDSC gene signature in these neutrophil subclusters indeed showed by far the highest scores in cells from cluster N0 (Fig. 2E). Additionally, monocytes were analyzed separately showing three distinct clusters that scored more ambiguously for our MDSC signature (Fig. 2F–H), suggesting that monocytic MDSCs may not be directly comparable between mouse and human. Together, these analyses confirmed that – at least in the context of G-MDSCs - our MDSC gene signature derived from a murine breast cancer model is translatable into human disease indicating that the MDSC state is largely conserved between mice and human.
Fig. 2. Comparative analysis using MDSC signature in myeloid cells from human breast cancer patients.

(A) Seurat analysis of previously published scRNAseq dataset comprising various immune cell populations in primary human breast tumor samples36 projected in UMAP with cell type labels as indicated in different colors. (B) Violin plot showing relative MDSC score of all cells in this dataset ordered by cell type showing highest scores in neutrophils and monocytes. (C) Separate unbiased Seurat clustering analysis of neutrophil alone projected in UMAP yielded four distinct clusters of neutrophils in this dataset. (D) Heatmap showing top 10 marker genes for each neutrophil cluster. (E) Violin plots showing relative MDSC score ordered by neutrophil subcluster showing that cluster 0 exhibit highest expression of MDSC gene signature. (F) Subset monocyte-specific Seurat clustering analysis projected in UMAP yielded three distinct clusters of monocytes in this dataset. (G) Heatmap showing top 10 marker genes for each monocyte cluster. (H) Violin plots showing relative MDSC score ordered by monocytes subclusters.
Identification of cell surface markers for MDSC detection and isolation
Our scRNAseq data revealed several previously unknown specific cell surface markers for MDSCs including CD84 and Amica1/Jaml. CD84 is a cell surface receptor of the signaling lymphocytic activation molecule (SLAM) family41 and is expressed on some immune cell types42,43. Amica1/Jaml is a junctional adhesion molecule known to mediate the transmigration of neutrophils and monocytes by interacting with coxsackie-adenovirus receptor (CAR) expressed by epithelia44. We profiled CD84 and Jaml expression using FACS on CD11b+Gr1+ cells from different organs in tumor-bearing PyMT mice and WT mice. We first used FMO and isotype controls to determine specific marker expression (fig. S4A–B). Next, we characterized CD84 and Jaml expression in the CD11b+Gr1+ population from various organ preparations (bone marrow, lung, spleen, MFP and primary tumor) and compared control WT to tumor-bearing PyMT mice. Importantly, while CD11b+Gr1+ cells from bone marrow and lung were generally negative for CD84 (Fig. 3A) and Jaml (Fig. 3D), we found a significant number of CD11b+Gr1+ cells from the spleen and primary tumors of PyMT mice exhibited high expression of CD84 (Fig. 3B) and Jaml (Fig. 3E) compared to the respective WT controls. This is particularly apparent when cells from all organs are plotted side by side (Fig. 3C&F). This observation of high expression of CD84 and Jaml in spleen and primary tumors correlates with high MDSC capacity of CD11b+Gr1+ cells in these sites.
Fig. 3. Identification of cell surface markers for MDSCs in breast cancer models.

(A) CD84 expression profiling in WT and tumor-bearing PyMT showing that only spleen and primary tumor from PyMT exhibit significant expression. (B) Combined results and statistical analysis using unpaired t-test (Mean ± SEM of n = 10) *P< 0.05. (D) Profiling Jaml expression in WT and PyMT showing only spleen and tumor from PyMT exhibit significant expression. (E) Combined results and statistical analysis unpaired t-test (Mean ± SEM of n = 3 *P< 0.05. (C&F) Concatenate multiple flow samples to visualize CD84 and Jaml1 expression in one feature plot across all samples including; (FMO, Bone marrow, lung, spleen, MFP and tumor from WT and PyMT); significant expression was only observed in spleen and tumor from PyMT. (G) Overview of PBMC collection, culture condition, and FACS approach. (H) Concatenate multiple flow samples to visualize CD84 expression in G- and M-MDSCs in one feature plot across all samples including PBMC control and treated. (I-J) Statistical analysis using unpaired t-test (Mean ± SEM of n = 3) *P< 0.05
To determine how generalizable these markers are, we next explored if CD11b+Gr1+ cells express CD84 in another mouse model of breast cancer: an orthotopic transplant model using 4T1 breast cancer cells in Balb/c mice. Similar with the MMTV-PyMT model, we observed that CD84 expression was elevated in spleens (~ 21.46%) and primary tumors (~ 8.49%) of 4T1 tumor-bearing animals, while CD11b+Gr1+ cells from bone marrow and lungs showed no detectable CD84 expression (fig. S4C–D). Additionally, we used in vitro generation of MDSCs by treating myeloid cells with GMCSF7. We found that after G-MCSF treatment the CD11b+Gr1+ population exhibited a significant increase in CD84 positive cells (~ 24.45%; fig. S5A–B) and Jaml positive cells (~ 11.26%; fig. S5A,C). Finally, we used previously established protocols for in vitro generation of human MDSCs by isolating peripheral blood mononuclear cells (PBMCs) and treating them with G-MCSF and IL646 (Fig. 3G; fig. S5D). We observed a significant upregulation of CD84 in samples from in vitro generated CD11b+/CD14+ M-MDSCs and CD11b+/CD15+ G-MDSCs compared to control cells (Fig. 3H–J). To additionally verify the successful generation of MDSCs in these in vitro cultures, we measured the expression of LOX-1 in CD11b+/CD15+ neutrophils, which was previously used to define G-MDSCs47,48, and found that this G-MDSC marker is concomitantly with CD84 upregulated in human neutrophils. We also measured expression of HLA-DR CD11b+/CD14+ monocytes in culture, which has been shown to be downregulated in M-MDSCs12, and found that HLA-DR is indeed downregulated in in vitro generated M-MDSCs (fig. S5D–E). Together, these experiments established CD84 as a robust and generalizable cell surface marker for G- and M-MDSCs.
CD84hi MDSCs exhibit T cell suppression and increased ROS production
To functionally validate whether CD45+CD11b+Gr1+CD84hi cells inhibit immune cell activation, we performed co-cultures with activated T cells as described above (Fig. 4A). Indeed, CD45+CD11b+Gr1+CD84hi cells from spleen of tumor-bearing mice suppressed CD4 and CD8 T cell proliferation significantly, while CD45+CD11b+Gr1+CD84lo cells from tumor-bearing mice showed no significant inhibition (Fig. 4B–C). Interestingly, in primary tumors, both CD84hi and CD84lo exhibited T cell suppressive capacity (Fig. 4D–E), which likely indicates that additional factors exist in the tumor microenvironment that contribute to maturation of MDSCs49. In direct comparison, CD84hi showed more robust immune suppression compared to CD84−/lo cells (Fig. 4D–E), which is in line with the notion that CD84 expression is a robust indicator of MDSC capacity.
Fig. 4. CD11b+Gr1+CD84hi cells exhibit potent capacity for T cell suppression and increased ROS production.

(A) Overview of FACS approach using two different tissues (spleen and primary tumor) from WT and PyMT were subjected to T cell activation, ROS formation and qPCR assays. (B-C) Splenic CD11b+Gr1+CD84hi cells from tumor-bearing mice suppress T cell proliferation. Histogram overly (B) and quantitative bar charts (C) showing CD4/CD8 T cell proliferation measured by FACS in control samples with T cells only (black), T cells activated by CD3/CD28 (blue), activated T cells plus CD11b+Gr1+ cells from control spleens (orange), activated T cells plus CD11b+Gr1+CD84−/lo cells (purple) and activated T cells plus CD11b+Gr1+CD84hi (red) from spleen of tumor-bearing mice. (C) Statistical analysis unpaired t-test (Mean ± SEM of n = 3) *P< 0.05. (D-E) T cell suppression analysis using CD11b+Gr1+CD84hi and CD84−/lo cells isolated from primary tumors. Histogram overly (D) and quantitative bar charts (E) showing CD4/CD8 T cell proliferation measured by FACS in control samples T cells (black), T cells activated by CD3/CD28 (blue), activated T cells plus CD11b+Gr1+CD84−/lo cells (purple) and activated T cells plus CD11b+Gr1+CD84hi (red) from tumor of tumor-bearing mice. (E) Statistical analysis unpaired t-test (Mean ± SEM of n = 3) *P< 0.05. (F-G) CD11b+Gr1+CD84hi cells from tumor-bearing mice show increased ROS formation compared to CD11b+Gr1+CD84−/lo; PMA-treated cells were used as positive control. ROS was measured by FACS using H2DCFDA. (E) Statistical analysis of ROS assay unpaired t-test (Mean ± SEM of n = 3) *P< 0.05.
Next, we measured ROS production as a hallmark for MDSC function in CD11b+Gr1+CD84−/lo and CD11b+Gr1+CD84hi cells from spleens and primary tumors of tumor-bearing and control mice. We utilized H2DCFDA staining for ROS in combination with flow cytometry and observed that CD11b+Gr1+CD84hi cells produced significantly higher amounts of ROS compared to CD11b+Gr1+ cells from control mice, while CD11b+Gr1+CD84−/lo showed no statistically different ROS production (Fig. 4F–G). Additionally, ROS production was significantly increased in CD11b+Gr1+Jamlhi cells from spleen and tumor of PyMT tumor-bearing mice compared to CD11b+Gr1+Jaml−/lo and to the control CD11b+Gr1+ cells (fig. S5F). Finally, we used qPCR to interrogate selected genes from our MDSC signature and found elevated expression of the complete panel of MDSC-related genes in CD11b+Gr1+CD84hi cells compared to CD11b+Gr1+CD84lo (fig. S6A; table S10). These findings indicate that MDSCs capable of T cell suppression and ROS production can be faithfully detected and enriched for based on high CD84 expression.
To further distinguish the expression of CD84 and JAML in the subsets of MDSCs (G- and M-MDSCs), we used flow cytometry to investigate CD45+CD11b+Ly6C+Ly6G− (M-MDSCs) and CD45+CD11b+Ly6CloLy6G+ (G-MDSCs) (fig. S6B) in combination CD84 or JAML staining. Interestingly, CD84 was lowly detected in M-MDSCs from spleen (fig. S6C), while M-MDSCs from primary tumors showed a substantial increase in CD84 expression (~28.13%) compared to cells from control mammary glands (fig. S6D). G-MDSCs on the other hand exhibit high CD84 expression in both primary tumors (~30.46%) and spleens (~17.33%) from tumor-bearing mice (fig. S6C–D). JAML expression was upregulated in both M- and G-MDSCs in spleen and tumor from tumor-bearing mice (fig. S6E–F). To further validate that increased CD84 expression is associated with functional MDSC capacity in both MDSC subsets, Ly6C+CD84hi or Ly6G+CD84hi cells were isolated from in vitro generated MDSCs and subjected to T cell suppression assays. Indeed, Ly6C+CD84hi and Ly6G+CD84hi suppressed CD4 and CD8 T cell proliferation (fig. S6G–H) to a similar degree as we previously found in the combined CD11b+/Gr1+ cell populations (fig. S2). These findings indicate that G- and M-MDSCs subsets express both CD84 and JAML and are capable of suppressing T cells.
G-MDSCs emerge through aberrant differentiation trajectory during cancer
To reconstruct the maturation process leading to MDSC generation in the spleen and to determine their differentiation state relative to normal progenitor and mature neutrophil populations, we next performed Monocle for unsupervised pseudotemporal ordering of our scRNAseq dataset37. We focused on the Ly6g+ neutrophil subset (clusters C0, C2, C4, C5, C7 and C8 in Fig. 1B–C) because in contrast to M-MDSCs we recovered sufficient numbers of total neutrophils and G-MDSCs in this analysis to ensure an interpretable result. We first generated a new Seurat-based clustering of this neutrophil subset and then performed Monocle using this newly defined set of marker genes (fig. S7A; table S7). This resulted in a three-branch trajectory with 5 distinct cell states (Fig. 5A). To interpret this trajectory, we compared our results to recent work using scRNAseq to define the signatures of the naïve haematopoietic stem, progenitor and differentiated cell states in the bone marrow of mice, which revealed that neutrophil progenitors are marked by the genes Elane, Mpo and Prtn3, while mature neutrophils expressed elevated levels of Camp, Ltf and Lcn217. Integrating these markers together with the MDSC signature established in our work (Fig. 1F), we were able to annotate the five states. First identified were neutrophil progenitors (state 4; Elane-hi) that show increased proliferation (fig. S7B–C) and form the beginning of pseudotime. These progenitors then bifurcate into mature neutrophils (state 3; Camp-hi) on the one branch, and MDSCs (state 1; Cd84-hi) on the other branch as illustrated by gene plots over pseudotime (Fig. 5B), suggesting that G-MDSCs emerge from neutrophil progenitors via an alternative maturation process.
Fig. 5. G-MDSCs emerge through aberrant differentiation trajectory during cancer.

(A) Neutrophil-specific Monocle analysis on subset of Ly6g+ neutrophil clusters resulted in branched trajectory with 5 distinct Monocle states (color code for each state is indicated) which are named based on respective gene expression profile. (B) Pseudotime plot illustrating expression of selected marker genes over pseudotime with the branch ending in State 1 shown with the dotted line, and the branch ending with state 3 highlighted by the solid line. Neutrophil progenitors are characterized by high levels of Elane, Mpo and Prtn3 (state 4), which bifurcate into mature neutrophils (state 3; Camp, Ltf, Lcn2) on the one branch, and MDSCs (state 1; e.g. CD84) on the other branch. (C) Early G-MDSC transition was marked by high expression of Asprv1, Plscr1 and Pirb. (D) Summary schematic indicates that G-MDSCs emerge from neutrophil progenitor cells via an aberrant form of neutrophil differentiation rather than from mature neutrophils that are reprogrammed into immunosuppressive cells.
Interestingly, Monocle detected two additional cell states (2 and 5) around the beginning of the MDSC branch: while state 5 was characterized by high ribosomal gene counts indicative of a translationally active cell state, state 2 represents the earliest phase of MDSC differentiation and was marked by high expression of Asprv138, Plscr139 and Pirb40 (Fig. 5C). Interestingly, it has been reported that neutrophils promote chronic inflammation using Asprv138, suggesting the aspartic protease encoded by Asprv1 may functionally contribute to the emergence of MDSCs in the spleen. Furthermore, paired immunoglobin-like receptor-b (Pirb) has been reported to regulate the suppressive function and fate of MDSCs, indicating that Pirb is required for MDSC generation40. Taken together, these findings indicate that MDSCs emerge from neutrophil progenitor cells via an aberrant form of neutrophil differentiation in the spleen rather than from mature neutrophils that are reprogrammed into immunosuppressive cells (Fig. 5D; table S8). In addition, our work identified an early, transitional MDSC state characterized by a number of genes showing elevated expression only around the branching point and during MDSC differentiation, but not during the normal progenitor or mature neutrophil trajectory. This may suggest that the transitional MDSC state could be targeted to block differentiation into mature MDSCs while not affecting normal neutrophil maturation and function.
We also performed a monocyte-specific subset Monocle analysis in a comparable way as described for neutrophils above, which yielded a similar three-branched trajectory (fig. S7D–E), suggesting that a similar alternative maturation process occurs during M-MDSC maturation. In contrast to our neutrophil-specific trajectory analyses, no transitional states emerged in our monocyte-specific analysis, which likely is due to the lower cell numbers in monocytes and decreased coverage of potentially transitioning states.
Discussion
Understanding the cellular and molecular mechanisms through which the tumor microenvironment can suppress an active anti-tumor immune response will be critical to improve current approaches for cancer immunotherapy such as checkpoint inhibition (e.g., PD1, CTLA4) or CAR-T cell treatments50. MDSCs represent such microenvironmental components that commonly expand in cancer patients and promote advanced tumor progression and T cell-suppression in various different cancers including breast cancer5. Here, we generate a single-cell transcriptomics map of MDSC maturation during cancer to dissect the unique molecular features of MDSCs in breast tumor-bearing mice, and to elucidate how these immunosuppressive cells differ from their normal myeloid counterparts. Using this resource, we establish an MDSC-specific gene signature that is largely shared between G- and M-MDSCs but strongly differs from their normal myeloid counterparts; we reconstruct their differentiation trajectory from neutrophil progenitors through an aberrant path of differentiation; and we identify MDSC-specific cell surface markers for detection and prospective isolation of MDSCs.
The MMTV-PyMT mouse model for breast cancer is one of the most widely used model system for studying breast cancer, which closely resembles human pathogenesis14 and which is known to induce significant expansion of MDSCs during tumor progression2. We show here that spleen is the major organ site in which MDSCs can be robustly detected. To identify unique molecular features associated with MDSC function, we utilized scRNAseq as a powerful, unbiased method to reveal hidden variation on a single-cell level in a population of FACS-isolated CD45+CD11b+Gr1+ cells from the spleen of WT control and tumor-bearing PyMT mice. This dataset not only provides the first single cell-level depiction of monocyte/neutrophil heterogeneity in the spleen under steady-state conditions (WT mice), but also elucidated how MDSCs emerge as distinct clusters in both monocytes and neutrophil-like cells, which allowed us to establish MDSC-specific gene signatures. Interestingly, there was significant overlap between G- and M-MDSCs, suggesting that both monocytes and neutrophils acquire similar immune-suppressive features. The MDSC signature includes various genes associated with immune regulations such as Arg2 and Cd84, as well as chemokine receptors (e.g. Ccr2, Cxcr2) indicating that MDSCs are responsive to neutrophil/MDSC-recruiting chemokines guiding their migration to active sites of inflammation such as the primary tumor or metastatic foci (Fig. 6).
Fig. 6. Proposed model of aberrant neutrophil differentiation in the spleen during cancer.

Myeloid cells differentiate in bone marrow from hematopoietic stem cells through common myeloid progenitors. Common granulocyte/monocyte progenitors expand in the bone marrow and migrate to spleen as a marginated pool, where they give rise to normal neutrophil maturation and, in cancer, aberrant neutrophil differentiation into G-MDSCs. Our findings that indicate MDSC-specific gene signature that is largely shared between G- and M-MDSCs but differs from their normal myeloid counterparts. This MDSC signature includes numerous chemokine receptors, which likely guide their migration towards primary tumor or metastatic sites (indicated by arrows), where they may shield tumor cells from anti-tumor immunity.
Our findings indicate that G-MDSCs may emerge from neutrophil progenitors through an aberrant differentiation trajectory giving rise to a cell state that is not present in normal conditions. Interrogating our observed cell states using pseudotemporal ordering and comparing these to recent work that defined the signatures of various haematopoietic stem and progenitor cell states in single-cell resolution17 allowed us to reconstruct MDSC form an aberrant trajectory from neutrophil progenitor cells that occurs at the cost of normal differentiation into mature neutrophil granulocytes, which are less abundant in tumor-bearing mice (Fig. 5A). Further interrogation of the initial transitional cell state that branches off into G-MDSCs revealed several genes that strongly increase in expression in this transitional phase (Fig. 5C), which may suggest that therapeutically interfering with these gene products could block MDSC differentiation before they become functionally active.
While our study provides some previously unappreciated insights into the biology of MDSCs, there are potential limitations to our analysis here. One limitation is associated with the inability to clearly distinguish between monocytes and macrophages in scRNAseq data. As such, it is conceivable that our flow cytometry approach included macrophages from the spleen, which however did not readily emerge as distinct clusters in our computational analyses. Therefore, we are unable to clarify ongoing discussions in the field about the nature of M-MDSCs as macrophages or monocytes. Secondly, while our findings indicate that the spleen might play a critical role in the generation and maturation process of MDSCs, the significance of the spleen should be addressed in future studies for example by carrying out splenectomy experiments in murine cancer models. Finally, our studies have relied solely a single cancer, breast cancer. It remains to be determined whether the findings reported here are applicable to other cancer settings.
A major problem for researchers studying MDSCs is the relative dearth of MDSC-specific cell surface receptors for detection and prospective isolation for functional interrogation. Here, we identify CD84 and JAML cell surface receptors on MDSCs, which can be used in combination with CD11b/Gr1 staining to detect the presence of MDSCs in various organs of tumor-bearing mice, or in humans in combination with CD11b/CD14 or CD15. CD84 is involved in cell-cell interactions and modulation of the activation and differentiation of a variety of immune cells51, and functions as a homophilic adhesion molecule on B cells, monocytes and, on a lower extent, T cells where it enhances IFN-γ secretion and activation42,43. Interestingly, CD84 can regulate PD-1/PD- L1 expression and function in chronic lymphocytic leukemia resulting in suppression of T cell responses and activity52, suggesting that CD84 may allow MDSCs to directly regulate immune checkpoints in breast cancer patients.
Materials and Methods
Study design.
The aim of this study is to define the molecular features of cancer-associated MDSCs using unbiased single-cell transcriptomics. To this end, we analzyed the most commonly used mouse model for breast cancer (i.e., MMTV-PyMT), which was previously shown to lead to MDSC generation in tumor-bearing animals. We first characterized various tissues for the presence of MDSCs by isolating CD11b+/Gr1+ cells and subjecting them to T cell suppression assays in vivo, which showed robust presence of MDSC capacity in the spleen of tumor-bearing mice. We performed single-cell transcriptomics on in total 14,646 FACS-isolated CD11b+/Gr1+ cells harvested from spleens of three tumor-bearing and three control mice. We then performed computational analyses for cell type clustering to identify cells of neutrophilic and monocytic origin, and focused our analyses on those clusters that were predominantly present in tumor-bearing mice. We performed orthogonal validation of MDSC-related expression changes using qPCR in additional tumor-bearing and control mice. Subset analysis for cell surface markers allowed us to identify MDSC-specific cell surface molecules (CD84, Jaml), which were validated and integrated with known cell surface markers for granulocytic (Ly6g or CD15) and monocytic (Ly6c or CD14) cells by flow cytometry in samples from control and tumor-bearing mice, as well as in primary in vitro generated MDSCs from mouse bone marrow or human peripheral blood samples. Because of the retrospective and observational nature, no prior sample size calculation was performed.
Mice.
All mouse experiments were approved by the Institutional Animal Care and Use Committee of University of California Irvine, in accordance with the guidelines of the National Institutes of Health. Transgenic PyMT (MMTV-PyMT) mice were purchased from The Jackson (JAX) Laboratory (stock no: 002374) and breedings were maintained on FVB/n and PyMT (MMTV-PyMT) backgrounds. Littermates from control and transgenic mice were used for all experiments.
Tissue Collection and Cell Isolation.
Bone marrow.
After mouse dissection, bone marrow (BM) was flushed from mouse tibia and femurs using a 28G needle and plastic syringe and then kept in HBSS (Corning, 21–023-CV). BM cells were centrifuged at 500g at 4°C for 5 min. Cells were incubated for 5 min at RT in 2 mL red blood cell (RBC) lysis buffer. Cells were quenched with 10 ml HBSS containing 2% FBS (Omega Scientific, FB-12) and centrifuged at 500g at 4°C for 5 min. Cells were resuspended in 3 mL FACS buffer (1xPBS, 3% FBS) and total remaining live BM cells were counted using the automated cell counter Countess™ II (ThermoFisher Scientific, AMQAX1000).
Spleen.
The spleen was pushed through a 70-μm cell strainer and washed with RPMI to create a cell suspension of splenocytes. Cells were centrifuged at 500g at 4°C for 5 min and then incubated for 5 min in 5 mL RBC lysis buffer at RT. Cells were quenched with 10 mL RPMI (Corning, 10–040-CV) with 5% FBS and centrifuged at 500g at 4°C for 5 min. Cells were resuspended in 3 mL FACS buffer (1xPBS, 3% FBS), and total remaining live cells were counted by Countess™ II and processed for FACS.
Lung, tumor and mammary fat pad (MFP).
Tissue samples were harvested from mice and mechanically dissociated using a razor blade. Tissues were placed in DMEM/F-12 (Corning, MT10090CV) complete medium containing 5 μg/mL insulin (Sigma-Aldrich, 11376497001), 50 μg/mL penicillin/streptomycin (HyClone, SV30010), and 0.1 mg/mL collagenase type IV (Sigma-Aldrich, C5138) and were digested at 37 °C on a shaker for 45 min. Samples were centrifuged at 500g for 5 min at RT. Cells were resuspended in HBSS and centrifuged at 500g for 5 min at RT. Cells were resuspended in 25 μL DNase I (Sigma-Aldrich, D4263) for five min at RT and then 2 mL of 0.05% Trypsin (Corning, 25–052-CI) was added and samples incubated at 37°C for 10 min. Samples were centrifuged at 500g for 5 min at RT and then resuspended in 5 mL HBSS with 2% FBS. The cell suspension was filtered through a 70 μM cell strainer (Fisher Scientific, 22363548) and incubated for 5 min at RT in 3 mL RBC lysis buffer. Cells were quenched with 10 mL HBSS with 2% FBS and centrifuged at 500g for 5 min at RT. Cells were then resuspended in RPMI with 10% FBS, and total remaining live cells were counted by Countess™ II and processed for FACS.
Peripheral blood.
Blood was collected using a 20G needle and syringe from the chest cavity after the right atrium and left ventricle were punctured. Mice were perfused with 15 mL of 10 mM EDTA in 1xPBS and blood was collected. Blood cells were centrifuged at 500g at 4°C for 5 min. Cells were resuspended in 5 mL RBC lysis buffer and incubated at RT for 5 min. Cells were quenched in 5 mL RPMI with 3% FBS and centrifuged at 500g at 4°C for 5 min. Cells were then resuspended in 3 mL FACS buffer (1xPBS, 3% FBS), and total remaining live cells were counted by Countess™ II and processed for FACS.
Brain.
Brain tissue was dissociated into a single cell suspension using the Adult Brain Dissociation Kit (Miltenyi Biotec, 130-107-677) according to the manufacturer’s protocol, and a gentleMACS Octo Dissociator with Heaters (Miltenyi Biotec, 130-096-427). Briefly, the brain was dissected from the cranium, the meninges were removed, and the brain was chopped into 8–10 pieces. The chunks were transferred into a gentleMACS C Tube (Miltenyi Biotec, 130-093-237) containing enzymes A and P, and then placed onto the gentleMACS. The brain was digested using the 37C-ADBK protocol on the instrument. After a 30-minute heated digestion, the brain slurry was strained through a 70 μm nylon strainer and washed with 10 mL ice cold 1xPBS with 2% BSA (Sigma, A-964). The suspension was centrifuged at 300g for 10 min at 4°C and then mixed with 4 mL of 1X Debris Removal Solution provided in the kit and centrifuged for 10 min at 3000g at 4°C or RT. The myelin layer was removed, and the cells were washed with DPBS, and centrifuged for 10 min at 1000g. Red blood cells were lysed for 3 min on ice with 1mL of 1X Red Blood Cell Lysis Buffer provided in the kit. After quenching in 2 mL of DPBS with 2% BSA, the cells were pelleted at 500g for 3 min at 4°C and total remaining live cells were counted by Countess™ II and processed for FACS.
In vitro generation of MDSCs
Mice.
BM cells were collected as described above and then cells were cultured with RPMI and 10%FBS and treated with 20ng/ml recombinant murine GM-CSF (Peprotech, 315–03) every other day. The cells were collected after 4 days in culture and total remaining live cells were counted by Countess™ II and processed for FACS.
Human.
We followed established protocols for in vitro generation of human MDSCs46. Briefly, Human blood was incubated with 3% dextran (Sigma-Aldrich, 31392–10G) for 18 min, supernatants were collected and followed by differential density gradient separation (Ficoll-paque™ PLUS, Neta Scientific, GHC-17-1440-02). Samples were centrifuged at 500 RCF for 30 min at 20oC. PBMCs including granulocytes were collected and incubated with 10ng/ml of recombinant human cytokines (GM-CSF, Peprotech, 300–03 and IL-6, Peprotech, 200–06) or without in RPMI contain 10%FBS. Cells were treated with these cytokines every day and on day 4 cells were collected from cultures and total remaining live cells were counted by Countess™ II. Cells were blocked with Human TruStain FcX™ (Fc Receptor Blocking Solution) (BioLegend, 422301) on ice for at least 10 min. Cells were then centrifuged at 500g for 5 min at 4°C and washed once with FACS buffer (1xPBS with 3%FBS). Cells were incubated for 30 min at 4°C with pre-conjugated fluorescent labeled antibodies with the following combinations: CD45 (2D1) (ThermoFisher, 48945942 (efluor)), CD11b (ICRF44) (Biolegend, 301335, (Brilliant Violet 650™)), CD14 (61D3) (ThermoFisher, 45014942 (PerCp-Cyanine5.5)), CD15 (HI98) (Biolegend, 301923 (APC) or 301923 (PE-cy7)), CD84 (CD84.121) (Biolegend, 326007 (PE)), LOX-1 (15C4) (Biolegend, 358605 (APC)), HLA-DR (L243) (Biolegend, 307645 (Brilliant Violet 510™)). Sytox green dye (Thermo Fisher, S34860) was added to stained cells to assay for viability. Cells were analyzed by BD FACSAria™ Fusion.
Fluorescence-Activated Cell Sorting.
Tissue samples were harvested from mice and mechanically dissociated to generate single cell suspensions as described above. Cells were blocked with anti-mouse FcγR (CD16/CD32) (BioLegend, 101301) on ice for at least 10 min. Cells were then centrifuged at 500g for 5 min at 4°C and washed once with FACS buffer (1xPBS with 3%FBS). Cells were incubated for 30 min at 4°C with pre-conjugated fluorescent labeled antibodies with the following combinations: CD45 (30-F11) (BioLegend, 103112 (APC) or 103115 (APC-cy7)), CD11b (M1/70) (BioLegend, 101206 (FITC) or 101212 (APC), Gr1 (Rb6–8C5) (BioLegend, 101206 (PE) or 108439 (BV605), Ly6C (HK1.4) (BioLegend, 128017 (PE/Cy7), Ly6G (1A8) (BioLegend, 127613 (APC), CD84 (mCD84.7) (BioLegend, 122805 (PE)), and Jaml (4e10) (BioLegend, 128503 (PE)). Sytox Blue dye (Life Technologies, S34857) was added to stained cells to assay for viability. Cells sorted by BD FACSAria™ Fusion and desired populations were isolated for different experiments. Human PBMCs were prepared as described above, cells were blocked with Human TruStain FcX (BioLegend, 422301) on ice for 10 min. Then cells were centrifuged at 500g for 5 min at 4°C and washed once with FACS buffer (1xPBS with 3%FBS). Cells were incubated for 30 min at 4°C with the following anti-human, pre-conjugated fluorescent labeled antibodies: CD45 (efluor 450) (Thermofisher, 48-9459-42), CD11b (BV650) (BioLegend, 101206), CD14 (PerCP-Cy5.5) (Thermofisher, 45-0149-42), CD15 (APC) (BioLegend, 301907), and CD84 (PE) (BioLegend, 326007). Sytox Green (Life Technologies, S34860) was added to the stained cells to assay viability. Cells were analyzed by BD FACSAria™ Fusion.
T cell Suppression Assay.
Spleens were dissected, filtered into a single-cell suspension and depleted of red blood cells using Tris-acetic-acid-chloride (TAC). T cells were isolated from the spleen using the EasySep™ Mouse T cell Isolation Kit (StemCell Technologies, 19851) according to the manufacturer’s instructions. Isolated T cells were washed once with PBS and resuspended at 15 ×106/mL in staining buffer (0.01% BSA in PBS). T cells were stained with proliferation dye eFluor™ 670 (ThermoFisher Scientific, 65-0840-85) using 5mM dye per 1×10⁷ cells and incubated in a 37°C water bath for 10 min. Finally, T cells were washed and resuspended at 1×10⁶/mL in RPMI 1640 w/ HEPES+ L-glutamine (Gibco, 22400–105) complete medium containing 10% FBS (Atlanta Biologicals, S11150), 1X non-essential amino acids (Gibco, 11146–050), 100U/mL penicillin-100μg/mL streptomycin (Gibco, 15140163), 1mM sodium pyruvate (Gibco, 11360–070), and 55 μM β-mercaptoethanol (Gibco, 21985–023). eFluor™ 670-labeled T cells were plated (50×103/well) in a U-bottom 96-well plate (VWR, 10062–902) and activated with plate bound anti-Armenian hamster IgG (30μg/mL, Jackson ImmunoResearch, 127-005-099), with CD3 (0.5 μg/mL, Tonbo, 70–0031), and CD28 (1 μg/mL, Tonbo, 70–0281). Sorted CD11b+ Gr1+ cells from PyMT or WT mice were added to T cells in 1:1 ratio (50×103 T cells:50×103 CD11b+ Gr1+ cells). After 4 days of culture, cells were collected and blocked with anti-mouse CD16/32 (BioLegend, 101302), stained with Zombie Live/Dead Dye (BioLegend, 423105) and fluorescent-conjugated antibodies: CD4 (BioLegend, 100512; clone RM4–5), and CD8 (BioLegend, 100709; clone 53–6.7). Single-stained samples and fluorescence minus one (FMO) controls were used to establish PMT voltages, gating, and compensation parameters. Cells were processed using the BD LSR II or BD LSRFortessa™ X-20 flow cytometer and analyzed using FlowJo software v10.0.7 (Tree Star, Inc).
ROS Production Assay.
Cells were harvested from respective tissues and processed to single cell suspensions as described above. Cells were stained with CD45, CD11b, Gr1, and CD84 or Jaml antibodies as described above. Following staining, cells were resuspended in FACS buffer and 10mM 2ʹ,7ʹ-Dichlorofluorescein diacetate (H2DCFDA) (Sigma-Aldrich, D6883) was added and incubated for 30 min at RT. Positive control cells were treated with 100 nM phorbol myristate acetate (PMA) (Sigma-Aldrich, P1585–1MG). Cells were then processed on the BD FACSAria™ Fusion and analyzed using FlowJo software v10.0.7 (Tree Star, Inc).
Quantitative Real-Time PCR.
CD11b+Gr1+ cells, CD11b+Gr1+CD84hi cells and CD11b+Gr1+CD84low cells were sorted by FACS and RNA were extracted using Quick-RNA Microprep Kit (Zymo Research, R1050) following manufacturer’s instructions. RNA concentration and purity were measured with a Pearl nano spectrophotometer (Implen). Quantitative real-time PCR was conducted using PowerUp™ SYBR™ green master mix (Thermo Fisher Scientific, A25742) and primer sequences were found in Harvard primer bank and obtained from Integrated DNA Technologies (table S10). Gene expression was normalized to GAPDH housekeeping gene. For relative gene expression 2^negΔΔCt values were used and for statistical analysis ΔCt was used. The statistical significance of differences between groups was determined by unpaired t-test using Prism 6 (GraphPad Software, Inc).
Single-Cell RNA Sequencing (scRNAseq).
FACS-isolated CD11b+/Gr1+ cells from the spleens of control WT (5 mice pooled) and tumor-bearing PyMT mice (3 mice pooled) were washed once in PBS with 0.04% BSA, resuspended to a concentration of approximately 1,000 cell/μL and loaded onto the 10X Genomics Chromium platform for droplet-enabled scRNAseq according to the manufacturer’s instructions. Library generation was performed following the Chromium Single Cell 3ʹ Reagents Kits v2 User Guide: CG00052 Rev B. Each library was sequenced on the Illumina HiSeq 4000 platform to achieve an average of 48,488 reads per cell. Alignment of 3’ end counting libraries from scRNAseq analyses was completed utilizing 10× Genomics Cell Ranger 2.1.0. Each library was aligned to an indexed mm10 genome using Cell Ranger Count. “Cell Ranger Aggr” function was used to normalize the number of confidently mapped reads per cell across the two libraries.
Cluster Identification of Mouse Data Using Seurat.
The Seurat pipeline (version 2.3.1) was used for cluster identification in scRNAseq datasets. Data was read into R (version 3.5.0) as a counts matrix and scaled by a size factor of 10,000 and log transformed. We set gene expression cut-offs at minimum of 500 and a maximum cut-off of 5,000 genes per cell for each dataset. In addition, cells with a percentage of total reads that aligned to the mitochondrial genome (referred to as percent mito) greater than 8% were removed. Using Seurat’s Canonical Correlation Analysis (CCA), cells from WT and PyMT mice were integrated together into a single analysis. For tSNE projection and clustering analysis, we used the first 20 principal components. Specific markers for each cluster identified by Seurat were determined using the “FindAllMarkers” function. For gene scoring analysis, we compared gene signatures and pathways in subpopulations using Seurat’s “AddModuleScore” function. For cell type subset analyses (Monocytes and Neutrophils), clusters with high expression of cell type markers (Csf1r and Ly6g, respectively) were subset out that were determined to not be of the monocyte or neutrophil cell type in their analyses and standard Seurat workflow was applied on each. In the case of the neutrophil-specific analysis, a population of cells that grouped together and expressed a set of markers associated with neutrophil progenitors17 was manually labeled and treated as a distinct cluster for analysis.
Human Breast Cancer Associated Immune Cell Analysis Using Seurat.
Data from Azizi, Elham, et al. Cell 201836 was downloaded with associated metadata and processed in R version 3.6.0, Seurat version 3.0.2. No trimming of cells or features was performed to maintain, and the full dataset was labeled by the cell types denoted in the manuscript. All cells in the analysis were scored using the conserved MDSC signature (table S5) using Seurat’s “AddModuleScore” function. Neutrophils and monocytes were specifically subset out to their own analyses and new dimensionality reduction via UMAP, and clustering via the “FindClusters” function were generated respectively.
Reconstruction of Differentiation Trajectories using Monocle.
Using the R package Monocle (version 2.8.0), differentiation hierarchies within the neutrophil and monocyte compartments were reconstructed. All cells in the analysis were scored using Seurats “AddModuleScore” function, using a cell cycle gene list published in Giladi, Amir, et al Nature Cell Biology 201817. For the neutrophil specific analysis, starting with all cells from the WT and PyMT combined analysis, neutrophils were specifically subset out. Once subset, contaminating cell types were removed and the cells were re-clustered to explore additional heterogeneity within the neutrophils compartment. Using marker genes of these clusters, the top 20 unique genes per cluster were used to order cells along a pseudotemporal trajectory. Because cells that expressed markers associated with neutrophil progenitors17 localized to a single branch, that branch was chosen as the start of pseudotime for further analysis. For the monocyte specific analysis, cells corresponding to Cluster 1 were subset out, and contaminating cell types removed. Subsequent clustering was performed as described above. Using genes differentially expressed by cluster via monocle’s “differentialGeneTest” function, subset to those that had a q-value less than 1e-10 and expressed in greater than 20 cells were used for ordering. The start of pseudotime was chosen to be the branch containing most cells from the WT library.
Statistical Analysis.
For statistics pertaining to the scRNAseq data analysis, p-values from the function “FindAllMarkers” in Seurat and when comparing scoring as a result of the “AddModuleScore” function, we used an unpaired Wilcox Rank Sum test, with Bonferroni correction. For the differential expression test through monocle’s “differentialGeneTest” function, significance and q-value calculation are derived from the VGAM package implementation of the “vglm” and its test for control of the FDR. Data from FACS and qPCR are expressed as mean ± SEM or SD and statistical significance was determined using an unpaired t-test using the Prism 6 software (GraphPad Software, Inc). P values were considered to be significant when p<0.05.
Supplementary Material
Table S9. Monocyte-specific Monocle state marker genes
Table S10. qPCR primer sequences
Table S8. Neutrophil-specific Monocle state marker genes
Table S2. Marker genes from Seurat analysis of monocytes only
Table S1. Marker genes from combined Seurat analysis
Table S3. Gene signature from G-MDSCs vs. Neutrophils comparison
Table S5. Combined MDSC signature gene list
Table S6. GO terms (Biological Process 2018) MDSC gene signature
Table S4. Gene signature from M-MDSCs vs. Monocytes comparison
Table S7. Marker genes from Seurat analysis of neutrophils only
fig. S1. Expansion of CD11b+Gr1+ cells during tumor progression in PyMT mice.
fig. S2. MDSCs emerge predominantly in spleen of tumor-bearing mice.
fig. S3. Sample labels and marker genes from scRNAseq analysis.
fig. S4. CD84 is a generalizable MDSC marker in different breast cancer models.
fig. S5. CD84 and Jaml are upregulated by in vitro generated mouse and human MDSCs.
fig. S6. Characterization and validation of myeloid cell subsets for CD84 and Jaml expression.
fig. S7. Reconstruction of MDSC differentiation trajectory in neutrophils and monocytes
Acknowledgements:
We thank Dr. Devon Lawson for the constructive feedback on experimental design and analysis. We thank Ryan T. Davis and Linzi Megan Hosohama for careful review and feedback of the Manuscript. We thank Dr. Jennifer Atwood for assistance with cell sorting in the flow cytometry core at the University of California, Irvine.
Funding: This study was supported by funding from NIH/NCI (1R01CA234496; 4R00CA181490 to K.K.), the American Cancer Society (132551-RSG-18-194-01-DDC to K.K.), the University of Hail, Hail, Saudi Arabia for the Ph.D. Fellowship (to H.A), the Canadian Institutes of Health Research (CIHR) Postdoctoral Fellowship (to D.M.), and pilot funds from the U54 Center for Cancer Systems Biology (CA217378).
Footnotes
Competing interests: The authors declare no competing financial or non-financial interests.
Data and materials availability: Sequencing datasets have been deposited in in the GEO database under the Accession number: GSE139125.
REFERENCES and notes
- 1.Society, A. C. Cancer Facts & Figures 2018. Am. Cancer Soc (2018). doi: 10.1182/blood-2015-12-687814 [DOI] [Google Scholar]
- 2.Casbon A-J et al. Invasive breast cancer reprograms early myeloid differentiation in the bone marrow to generate immunosuppressive neutrophils. Proc. Natl. Acad. Sci 112, E566–E575 (2015). [DOI] [PMC free article] [PubMed] [Google Scholar]
- 3.Gabrilovich DI, Ostrand-Rosenberg S & Bronte V Coordinated regulation of myeloid cells by tumours. Nat. Rev. Immunol 12, 253–268 (2012). [DOI] [PMC free article] [PubMed] [Google Scholar]
- 4.Gabrilovich DI & Nagaraj S Myeloid-derived suppressor cells as regulators of the immune system. Nat. Rev. Immunol 9, 162–174 (2009). [DOI] [PMC free article] [PubMed] [Google Scholar]
- 5.Diaz-Montero CM et al. Increased circulating myeloid-derived suppressor cells correlate with clinical cancer stage, metastatic tumor burden, and doxorubicin-cyclophosphamide chemotherapy. Cancer Immunol. Immunother 58, 49–59 (2009). [DOI] [PMC free article] [PubMed] [Google Scholar]
- 6.Kang L et al. Altered recognition of antigen is a mechanism of CD8+ T cell tolerance in cancer. Nat. Med 13, 828–835 (2007). [DOI] [PMC free article] [PubMed] [Google Scholar]
- 7.Munn DH et al. Bone marrow myeloid-derived suppressor cells (MDSCs) inhibit graft-versus-host disease (GVHD) via an arginase-1-dependent mechanism that is up-regulated by interleukin-13. Blood 116, 5738–5747 (2010). [DOI] [PMC free article] [PubMed] [Google Scholar]
- 8.Wang Y, Ren X, Yan F, Li H & Yu J Response to Comment on ‘Myeloid-Derived Suppressor Cells Suppress Antitumor Immune Responses through IDO Expression and Correlate with Lymph Node Metastasis in Patients with Breast Cancer’. J. Immunol 190, 5341–5342 (2013). [DOI] [PubMed] [Google Scholar]
- 9.Huang B et al. Gr-1+ CD115+ Immature Myeloid Suppressor Cells Mediate the Development of Tumor-Induced T Regulatory Cells and T-Cell Anergy in Tumor-Bearing Host. Cancer Res. 66, 1123–1131 (2006). [DOI] [PubMed] [Google Scholar]
- 10.Lu X et al. Targeting YAP-Dependent MDSC Infiltration Impairs Tumor Progression. Cancer Discov. 6, 80–95 (2015). [DOI] [PMC free article] [PubMed] [Google Scholar]
- 11.Chun E et al. CCL2 Promotes Colorectal Carcinogenesis by Enhancing Polymorphonuclear Myeloid-Derived Suppressor Cell Population and Function. Cell Rep. 12, 244–257 (2015). [DOI] [PMC free article] [PubMed] [Google Scholar]
- 12.Bronte V et al. Recommendations for myeloid-derived suppressor cell nomenclature and characterization standards. Nat. Commun 7, 1–10 (2016). [DOI] [PMC free article] [PubMed] [Google Scholar]
- 13.Guy CT, Cardiff RD & Muller WJ Induction of mammary tumors by expression of polyomavirus middle T oncogene: a transgenic mouse model for metastatic disease. Mol. Cell. Biol 12, 954–961 (1992). [DOI] [PMC free article] [PubMed] [Google Scholar]
- 14.Lin EY et al. Progression to Malignancy in the Polyoma Middle T Oncoprotein Mouse Breast Cancer Model Provides a Reliable Model for Human Diseases. Am. J. Pathol 163, 2113–2126 (2003). [DOI] [PMC free article] [PubMed] [Google Scholar]
- 15.Trombetta JJ et al. Highly Parallel Genome-wide Expression Profiling of Individual Cells Using Nanoliter Droplets. Cell 161, 1202–1214 (2015). [DOI] [PMC free article] [PubMed] [Google Scholar]
- 16.Hoffman P, Satija R, Papalexi E, Smibert P & Butler A Integrating single-cell transcriptomic data across different conditions, technologies, and species. Nat. Biotechnol 36, (2018). [DOI] [PMC free article] [PubMed] [Google Scholar]
- 17.Giladi A et al. Single-cell characterization of haematopoietic progenitors and their trajectories in homeostasis and perturbed haematopoiesis. Nat. Cell Biol 20, 836–846 (2018). [DOI] [PubMed] [Google Scholar]
- 18.Deniset JF, Surewaard BG, Lee W-Y & Kubes P Splenic Ly6G high mature and Ly6G int immature neutrophils contribute to eradication of S. pneumoniae. J. Exp. Med 214, 1333–1350 (2017). [DOI] [PMC free article] [PubMed] [Google Scholar]
- 19.Song X et al. CD11b+/Gr-1+ Immature Myeloid Cells Mediate Suppression of T Cells in Mice Bearing Tumors of IL-1 -Secreting Cells. J. Immunol 175, 8200–8208 (2005). [DOI] [PubMed] [Google Scholar]
- 20.Karlstetter M et al. The Novel Activated Microglia/Macrophage WAP Domain Protein, AMWAP, Acts as a Counter-Regulator of Proinflammatory Response. J. Immunol 185, 3379–3390 (2010). [DOI] [PubMed] [Google Scholar]
- 21.Yu F et al. IFITM1 promotes the metastasis of human colorectal cancer via CAV-1. Cancer Lett. 368, 135–143 (2015). [DOI] [PubMed] [Google Scholar]
- 22.Sari IN et al. Interferon-induced transmembrane protein 1 (IFITM1) is required for the progression of colorectal cancer. Oncotarget 7, 86039–86050 (2016). [DOI] [PMC free article] [PubMed] [Google Scholar]
- 23.Ogony J, Choi HJ, Lui A, Cristofanilli M & Lewis-Wambi J Interferon-induced transmembrane protein 1 (IFITM1) overexpression enhances the aggressive phenotype of SUM149 inflammatory breast cancer cells in a signal transducer and activator of transcription 2 (STAT2)-dependent manner. Breast Cancer Res. 18, 1–19 (2016). [DOI] [PMC free article] [PubMed] [Google Scholar]
- 24.Meirelles G et al. Enrichr: interactive and collaborative HTML5 gene list enrichment analysis tool. BMC Bioinformatics 14, 128 (2013). [DOI] [PMC free article] [PubMed] [Google Scholar]
- 25.Loveland BE & Cebon J Cancer exploiting complement: A clue or an exception? Nat. Immunol 9, 1205–1206 (2008). [DOI] [PubMed] [Google Scholar]
- 26.Manuscript A, Complement N, Attenuates I, Injury M & Thrombogenesis A NIH Public Access. 126, 2227–2235 (2013). [Google Scholar]
- 27.Sinha P et al. Proinflammatory S100 Proteins Regulate the Accumulation of Myeloid-Derived Suppressor Cells. J. Immunol 181, 4666–4675 (2008). [DOI] [PMC free article] [PubMed] [Google Scholar]
- 28.Cross SS, Hamdy FC, Deloulme JC & Rehman I Expression of S100 proteins in normal human tissues and common cancers using tissue microarrays: S100A6, S100A8, S100A9 and S100A11 are all overexpressed in common cancers. Histopathology 46, 256–269 (2005). [DOI] [PubMed] [Google Scholar]
- 29.Ortiz ML et al. Immature myeloid cells directly contribute to skin tumor development by recruiting IL-17-producing CD4+ T cells. J. Exp. Med 212, 351–367 (2015). [DOI] [PMC free article] [PubMed] [Google Scholar]
- 30.Cheng P et al. _. (2017).
- 31.Delano MJ et al. MyD88-dependent expansion of an immature GR-1+ CD11b+ population induces T cell suppression and Th2 polarization in sepsis. J. Exp. Med 204, 1463–1474 (2007). [DOI] [PMC free article] [PubMed] [Google Scholar]
- 32.Zhu H et al. CXCR2 MDSCs promote breast cancer progression by inducing EMT and activated T cell exhaustion. 8, 114554–114567 (2017). [DOI] [PMC free article] [PubMed] [Google Scholar]
- 33.Highfill SL et al. Disruption of CXCR2-mediated MDSC tumor trafficking enhances anti-PD1 efficacy. Sci. Transl. Med 6, (2014). [DOI] [PMC free article] [PubMed] [Google Scholar]
- 34.Zhang C et al. Cancer-Associated Fibroblasts Neutralize the Anti-tumor Effect of CSF1 Receptor Blockade by Inducing PMN-MDSC Infiltration of Tumors. Cancer Cell 32, 654–668.e5 (2017). [DOI] [PMC free article] [PubMed] [Google Scholar]
- 35.Hirai H et al. CCR1-mediated accumulation of myeloid cells in the liver microenvironment promoting mouse colon cancer metastasis. Clin. Exp. Metastasis 31, 977–989 (2014). [DOI] [PMC free article] [PubMed] [Google Scholar]
- 36.Azizi E et al. Single-Cell Map of Diverse Immune Phenotypes in the Breast Tumor Microenvironment. Cell 174, 1293–1308.e36 (2018). [DOI] [PMC free article] [PubMed] [Google Scholar]
- 37.Trapnell C et al. The dynamics and regulators of cell fate decisions are revealed by pseudotemporal ordering of single cells. Nat. Biotechnol 32, 381–386 (2014). [DOI] [PMC free article] [PubMed] [Google Scholar]
- 38.Pelletier M et al. ICAM1+ neutrophils promote chronic inflammation via ASPRV1 in B cell–dependent autoimmune encephalomyelitis. JCI Insight 2, (2017). [DOI] [PMC free article] [PubMed] [Google Scholar]
- 39.Kodigepalli KM, Bowers K, Sharp A & Nanjundan M Roles and regulation of phospholipid scramblases. FEBS Lett. 589, 3–14 (2015). [DOI] [PubMed] [Google Scholar]
- 40.Eisenstein S et al. Paired Immunoglobin-like Receptor-B Regulates the Suppressive Function and Fate of Myeloid-Derived Suppressor Cells. Immunity 34, 385–395 (2011). [DOI] [PMC free article] [PubMed] [Google Scholar]
- 41.Schwartzberg PL, Mueller KL, Qi H & Cannons JL SLAM receptors and SAP influence lymphocyte interactions, development and function. Nat. Rev. Immunol 9, 39–46 (2009). [DOI] [PubMed] [Google Scholar]
- 42.Cuenca M, Sintes J, Lányi Á & Engel P CD84 cell surface signaling molecule: An emerging biomarker and target for cancer and autoimmune disorders. Clin. Immunol 0–1 (2018). doi: 10.1016/j.clim.2018.10.017 [DOI] [PubMed] [Google Scholar]
- 43.Marom A et al. CD84 mediates CLL-microenvironment interactions. Oncogene 36, 628–638 (2017). [DOI] [PubMed] [Google Scholar]
- 44.Weber DA et al. Neutrophil-derived JAML inhibits repair of intestinal epithelial injury during acute inflammation. Mucosal Immunol. 7, 1221–1232 (2014). [DOI] [PMC free article] [PubMed] [Google Scholar]
- 45.Poole AJ et al. Prevention of Brca1-mediated mammary tumorigenesis in mice by a progesterone antagonist. Science (80-. ). 314, 1467–1470 (2006). [DOI] [PubMed] [Google Scholar]
- 46.Lechner MG, Liebertz DJ & Epstein AL Characterization of Cytokine-Induced Myeloid-Derived Suppressor Cells from Normal Human Peripheral Blood Mononuclear Cells. J. Immunol 185, 2273–2284 (2010). [DOI] [PMC free article] [PubMed] [Google Scholar]
- 47.Condamine T et al. Lectin-type oxidized LDL receptor-1 distinguishes population of human polymorphonuclear myeloid-derived suppressor cells in cancer patients. Sci. Immunol 1, aaf8943–aaf8943 (2016). [DOI] [PMC free article] [PubMed] [Google Scholar]
- 48.Si Y et al. Multidimensional imaging provides evidence for down-regulation of T cell effector function by MDSC in human cancer tissue. Sci. Immunol (2019). [DOI] [PubMed] [Google Scholar]
- 49.Kumar V, Patel S, Tcyganov E & Gabrilovich DI The Nature of Myeloid-Derived Suppressor Cells in the Tumor Microenvironment. Trends Immunol. 37, 208–220 (2016). [DOI] [PMC free article] [PubMed] [Google Scholar]
- 50.Binnewies M et al. Understanding the tumor immune microenvironment (TIME) for effective therapy. Nat. Med 24, 541–550 (2018). [DOI] [PMC free article] [PubMed] [Google Scholar]
- 51.Martin M et al. CD84 Functions as a Homophilic Adhesion Molecule and Enhances IFN- Secretion: Adhesion Is Mediated by Ig-Like Domain 1. J. Immunol 167, 3668–3676 (2001). [DOI] [PubMed] [Google Scholar]
- 52.Lewinsky H, Becker-herman S & Shachar I CD84 regulates PD-1 / PD-L1 expression and function in chronic lymphocytic leukemia Find the latest version : Jci (2018). doi: 10.1007/978-1-60761-594-1 [DOI] [PMC free article] [PubMed] [Google Scholar]
Associated Data
This section collects any data citations, data availability statements, or supplementary materials included in this article.
Supplementary Materials
Table S9. Monocyte-specific Monocle state marker genes
Table S10. qPCR primer sequences
Table S8. Neutrophil-specific Monocle state marker genes
Table S2. Marker genes from Seurat analysis of monocytes only
Table S1. Marker genes from combined Seurat analysis
Table S3. Gene signature from G-MDSCs vs. Neutrophils comparison
Table S5. Combined MDSC signature gene list
Table S6. GO terms (Biological Process 2018) MDSC gene signature
Table S4. Gene signature from M-MDSCs vs. Monocytes comparison
Table S7. Marker genes from Seurat analysis of neutrophils only
fig. S1. Expansion of CD11b+Gr1+ cells during tumor progression in PyMT mice.
fig. S2. MDSCs emerge predominantly in spleen of tumor-bearing mice.
fig. S3. Sample labels and marker genes from scRNAseq analysis.
fig. S4. CD84 is a generalizable MDSC marker in different breast cancer models.
fig. S5. CD84 and Jaml are upregulated by in vitro generated mouse and human MDSCs.
fig. S6. Characterization and validation of myeloid cell subsets for CD84 and Jaml expression.
fig. S7. Reconstruction of MDSC differentiation trajectory in neutrophils and monocytes