

Abstract
Metastatic breast, prostate, lung and other cancers often affect bone, causing pain, increasing fracture risk, and decreasing function. Management of metastatic bone disease (MBD) is clinically challenging when there is potential but uncertain risk of pathological fracture. Management of MBD has become a major focus within orthopedic oncology with respect to fracture and impending fracture care. If impending skeletal related events (SREs), particularly pathologic fracture, could be predicted, increasing evidence suggests that prophylactic surgical treatment improves patient outcomes. However, current fracture risk assessment and radiographic metrics do not have high accuracy and have not been combined with relevant patient survival tools. This review first explores the prevalence, incidence, and morbidity of MBD and associated SREs for different cancer types. Strengths and limitations of current fracture risk scoring systems for spinal stability and long bone fracture are highlighted. More recent CT-based structural rigidity analysis (CTRA) and finite element (FE) analysis methods offer advantages of increased specificity (true negative rate), but are limited in availability. Other fracture prediction approaches including parametric response mapping (PRM) and positron emission tomography/computed tomography (PET/CT) measures show early promise. Substantial new information to inform clinical decision-making includes measures of survival, clinical benefits, and economic analysis of prophylactic treatment compared to after-fracture stabilization. Areas of future research include use of Big Data and machine learning to predict SREs, greater access and refinement of CTRA/FE approaches, combination of clinical survival prediction tools with radiographically based fracture risk assessment, and net benefit analysis for fracture risk assessment and prophylactic treatment.
Keywords: Metastatic bone disease, skeletal related events, fracture prediction, finite element, structural rigidity analysis, machine learning, CT, PET, SPECT, prophylactic stabilization, bone prophylaxis, femur, spine, clinical decision making, impending pathological fracture, pathologic fracture, fracture risk, bone metastases, carcinoma, myeloma, Mirels
INTRODUCTION
Management of patients with metastatic bone disease (MBD) for which there is risk of pathological fracture remains a clinical challenge. Preventing pathological fracture through use of prophylactic treatment (PT) would seem to be a reasonable approach for many patients, but determining whether a fracture might occur in the future is often difficult. This is a very active area of orthopedic research and is a topic of increased focus within the orthopedic oncology community that requires contributions from clinicians, basic scientists and engineers. This review first explores the prevalence, incidence, and morbidity of MBD and associated skeletal related events (SREs) for different cancer types. The relative benefits and risks of PT compared to after fracture care are discussed. The ability to predict SREs (specifically pathologic fractures) is then described for a number of different approaches, with validation using laboratory and clinical data. Clinical decision-making is then discussed in the context of patient survival, fracture risk assessment, and potential advantages and risks of PT.
PREVALENCE AND INCIDENCE OF METASTATIC BONE DISEASE
Prevalence of cancer cases in the United States is 1.2 million/year, but MBD prevalence is less clear. It has been estimated to be as high as 50% of all cancer cases (600,000 annually)1 or as low as 25% (280,000 annually)2. True prevalence is likely somewhere between those extremes. Prevalence is determined by input minus output, and the most important factor affecting prevalence is incidence. Incidence of MBD is strongly affected by type of primary carcinoma, predilection to metastasize, affinity of metastases for bone, and clinical ability to diagnosis bone metastases3. The most common carcinomas that spread to bone are prostate, breast, kidney, thyroid, and lung4 and 70% of MBD is accounted for by breast, prostate, and lung cancer2. However, only 4.1%, 40.1%, and 10.3% of breast, lung, and prostate cancers present with stage IV disease, and not all of those have bone involvement. Bladder and melanoma also metastasize to bone in a relatively large percentage of cases (Table 1).
Table 1.
Percentage of primary carcinoma types with metastatic bone disease (MBD) and median survival from diagnosis of MBD.
| Primary Carcinoma | Percentage with MBD | Median Survival After Dx of MBD (mo’s) |
|---|---|---|
| Breast cancer | 65–75 | 19–25 |
| Prostate cancer | 65–75 | 12–23 |
| Thyroid | 60 | 48 |
| Lung | 30–40 | 6–7 |
| Bladder | 40 | 6–9 |
| Renal | 20–25 | 12 |
| Melanoma | 14–45 | 6 |
Adapted from Selvaggi et al.5.
The top five primaries can be remembered using the mnemonic Pb Ktl (or lead kettle), which also suggests the radiographic features of their metastases, prostate being osteoblastic, breast often mixed osteoblastic and lytic, and kidney, thyroid, and lung typically lytic. In terms of progression of disease, 12% of breast carcinoma patients who present with Stage I-III disease developed MBD within 60 months, and of the small fraction of Stage IV patients at diagnosis, 55% had MBD6. The most commonly diagnosed new cancers contrasted to the most commonly diagnosed cancers with stage IV disease at diagnosis are shown in Table 27. Bone is among the top three sites of metastases, along with lung and liver8; 9. Clinical evaluation likely underestimates MBD, as MBD at post-mortem examination usually exceeds clinical frequency9; 10. This is consistent with the statement by Jaffe over fifty years ago, “70 per cent of patients who die of cancer are likely to have had bone metastases if the sampling of tissues at autopsy is adequate”11.
Table 2.
Comparison of Most Common Overall Incidence of Primary Carcinomas Versus Most Common Metastatic Carcinomas in 2014 (United States).
| Primary Carcinoma in Order of Most Commonly Diagnosed During 2014 | Total Number of Cases Diagnosed During 2014 | Primary Carcinoma in Order of Most Commonly Diagnosed with Metastatic Disease During 2014 | Total Number of Stage IV Cases Diagnosed During 2014 | Percentage of Stage IV Cases at Presentation (%) |
|---|---|---|---|---|
| Breast | 232551 | Lung/bronchus (non-small cell) | 52153 | 40.1 |
| Lung/bronchus (non-small cell) | 129970 | Pancreas | 15670 | 45.2 |
| Prostate | 101879 | Colon | 14571 | 20.2 |
| Colon | 72241 | Lung/bronchus (small cell) | 13458 | 63.3 |
| Melanoma of skin | 54231 | Non-Hodgkins Lymphoma (nodal) | 12034 | 36.9 |
| Urinary bladder | 51005 | Prostate | 10528 | 10.3 |
| Kidney or renal pelvis | 46669 | Breast | 9459 | 4.1 |
| Corpus uteri | 43025 | Kidney or renal pelvis | 6504 | 13.9 |
| Thyroid | 38535 | Urinary bladder | 3892 | 7.6 |
| Pancreas | 34704 | Rectum | 3676 | 14.9 |
| Non-Hodgkins Lymphoma (nodal) | 32609 | Thyroid | 2915 | 7.6 |
| Rectum | 24628 | Corpus uteri | 2904 | 6.7 |
| Lung/bronchus (small cell) | 21266 | Melanoma of skin | 2415 | 4.5 |
| Brain | 20418 | Brain | Unknown | Unknown |
Derived from Site by Stage of Top 14 (out of 14) Sites Cancers Diagnosed in 2004–20147.
Survival also affects prevalence. Improved survival means more patients with MBD remain alive at any given time4. Current treatments for breast, prostate, lung, and renal cancer have led to improved survival even after MBD diagnosis12. Cumulative 1- and 3-year survival for breast cancer patients with MBD is 59% and 22%13. One- and 3-year survival for prostate cancer patients with MBD is 47 and 9%2; 14. Primary cancer type affects prevalence because survival rates vary among primaries (Table 1). Finally, screening sensitivity affects prevalence14; 15. In prostate cancer, the use of whole-body imaging and CT increased detection from 31.1% to 48.7% using PSA and bone scans16. Detection of MBD in lung carcinoma has increased with PET17.
Morbidity and Skeletal Related Events (SREs)
Morbidity of MBD may manifest as pain, pathologic fracture, decreased function in activities of daily living (ADLs), and overall decreased quality of life1. Increased risk of fracture may present as impending pathologic fractures–weakened bone that has yet to fracture and pathologic fractures–after fracture through a weakened area of bone. Morbidity from MBD is often referred to by the term skeletal related events (SREs) and categorized into the specific subtypes: radiation therapy (RT), pathologic fracture (PF), bone surgery (BS), spinal cord compression (SCC), hypercalcemia (HC), and bone pain (BP). Factors affecting morbidity include anatomic location, type of lesion, and primary carcinoma (Table 3).
Table 3:
Skeletal related events (SREs) for breast, prostate, lung, renal cell, and thyroid cancer. Percent breakdown of SREs stratified by type.
| Distribution of Skeletal Related Event (SRE) Type (%) | ||||||||
|---|---|---|---|---|---|---|---|---|
| Study | Metastatic Cancer | MBD Patient Sample (N) | Overall SRE (%) | Radiation Therapy | Pathological or Osteoporotic Fracture | Bone Surgery | Spinal Cord Compression | Hyper-calcemia |
| Jensen 201119 | Breast | 1494 | 48% | 55% | 19% | 6% | 20% | NA |
| Trinkhaus 201020 | Breast | 237 | 38% | 79% | 11% | NA | 3%* | 8% |
| Hussain 201821 | Breast | 3731 | 69% | 32% | 28% | 8% | 4% | NA |
| Kawai 201922 | Castration resistant prostate cancer | 2234 | 40.1% | 27% | 12%** | 1% | 2% | NA |
| McDougal 201623 | Prostate | 3297 | 43.5% | 22% | 8% | 4% | 7% | NA |
| Skov Dalgaard 201515 | Lung | 1668 | 67% | 53%# 19%^ |
2% | 1% | 4% | NA |
| Woodward 201124 | Renal cell | 603 | 70% | 61% | 9% | 12% | 12% | 6% |
| Farooki 201225 | Thyroid | 245 | 78% | 46%^^ 44%+ |
16%^^ 19%+ |
19%^^ 25%+ |
16%^^ 10%+ |
3%^^ 2%+ |
Occurred prior to treatment with bisphosphonates;
includes traumatic and pathologic fractures;
Multiple radiation therapy treatments as the only SREs;
Radiation therapy as a solitary SRE;
First SRE;
Second SRE
The most common anatomic locations affected by MBD, include spine, pelvis, ribs, skull, proximal humerus, and the lower extremity long bones8. Types of SREs may be uniquely related to the involved anatomic site, such as SCC and spinal metastases9. However, BS, HC, PF, and RT, may occur at any anatomic site9. The most common anatomic locations requiring surgery in most series are the spine (68% in Nationwide Inpatient Sample, NIS), lower extremity (25% in NIS; especially the femur) and upper extremity (8.7% in NIS)18. In regards to need for femoral stabilization in this setting, Zickel and Mouradian in 197611 commented that, “The vast majority of lesions need no surgical treatment to maintain the bone’s function, but the fact that the femur is the bone that most often needs reinforcement or stabilization is noteworthy.”
Type of bone destruction has long been felt to have a direct relationship to morbidity, as osteolytic metastases that destroy bone (such as those from kidney, thyroid, lung cancer) are felt to pose higher risk for PF1. In contrast, osteoblastic metastases (such as those from prostate and bladder cancer) pose less of a threat. Mixed lytic/blastic metastases (such as those of breast cancer) are thought to be of intermediate PF risk.
THE CASE FOR PROPHYLACTIC STABILIZATION
Before performing prophylactic stabilization, the surgeon must consider the relative benefits and risks of PT compared to after fracture (AF) treatment. In weighing evidence, one should consider how impending fractures are defined, since inclusion of patients not in need of PT may bias outcomes.
Overall and immediate post-operative survival has been suggested to be higher with PT compared to AF treatment (Table 4). Examination of the Nationwide Inpatient Sample (NIS) suggests operative treatment is protective of survival (p<0.001)18. Fracture of either the upper or lower extremity was a significant independent risk factor for mortality (p<0.001), the implication being that preventing fracture is important. However, there are subgroups of PT patients who may be at higher risk for shortened survival26.
Table 4:
Published Literature Suggesting Survival Advantage to Prophylactic Stabilization.
| Patient Survival Prognosis | |||||||
|---|---|---|---|---|---|---|---|
| Prophylactic (P) | Fracture (F) | P vs F | |||||
| Mean (mo’s) | Range (mo’s) | N | Mean (mo’s) | Range (mo’s) | N | P value | |
| Zickel 197611^ | 13.8 | 1–48 | 11 | 4.7 | 0–5 | 35 | -- |
| Hardman 199227 | 15 | 27 | 2 | 34 | |||
| Ward 200228 | 1 YR: 35% 2 YR: 19% |
-- | 97 | 1 YR: 25% 2 YR: 10% |
-- | 85 | P=0.015 |
| Arvinius 201429 | 14 | 1–34 | 21 | 11 | 1–49 | 44 | N.S. |
| Philipp 201930 | 1 YR: 53% 2 YR: 40% |
362 | 1 YR: 49% 2 YR: 31% |
588 | P = 0.018 | ||
| Immediate Post-op Death | |||||||
| Prophylactic (P) | Fracture (F) | P vs F | |||||
| Percent | Deaths | N | Percent | Deaths | N | P value | |
| Arvinius 201429 | 5% | 1 | 21 | 11.4% | 5 | 44 | P=0.041 |
Using Zickel nail for prophylactic stabilization.
Potential clinical benefits of PT include pain and functional outcome improvements, lower estimated blood loss (EBL), and lower rates of transfusion and urinary tract infections (UTI). Controversy exists regarding improvements in pain and functional outcome. While some authors report earlier mobilization after PT (4.0 days PT vs 9.7 days AF, p=0.012), others found no difference29; 31. “Improved ability to walk” has been reported in 78–100% of those undergoing PT compared to 58–76% of patients treated AF27; 29; 32. In another series, support-free ambulation was achieved in 35% of PT patients compared to 12% treated AF28.
Limited evidence suggests lower EBL and transfusion rate with PT. However, while differences are statistically significant, numbers are not large and therefore of debatable clinical importance (76,77). Absolute mean EBL difference reported in a single institution 12-year retrospective study was 200 cc (438 cc PT=97, 636 cc AF=85, p=0.01)28. In a NIS study, rate of transfusion was 21.2% in PT patients compared to 28.6% in AF patients (p<0.001)33 (Table 5). In the most comprehensive comparison to date of PT versus AF complications, a NIS study comparing 2750 PT patients to 2829 AF patients on multivariate analysis showed PT patients to have statistically higher rates of pulmonary embolism and deep venous thrombosis33. A lower UTI rate advantage for PT did not hold up on multivariate analysis.
Table 5.
Comparison of Complications Between Prophylactic Treatment and Surgical Treatment after Pathologic Fracture in NIS
| Prophylactic fixation (%) | Pathologic fracture (%) | Univariate analysis | Multivariate analysis | |||
|---|---|---|---|---|---|---|
| P value | Odds ratio | Adjusted odds ratio | P value | |||
| Pulmonary embolism | 2.1 | 1.2 | 0.0008 | 1.79 | 2.1 | 0.0001 |
| Deep venous thrombosis | 3.2 | 2.2 | 0.03 | 1.43 | 1.5 | 0.03 |
| Urinary tract infection | 8.5 | 15.7 | <0.0001 | 0.50 | NS | NS |
| Blood transfusion | 21.2 | 28.6 | <0.0001 | 0.67 | 0.74 | <0.0001 |
Adapted from Aneja et al.33.
Another purported benefit of PT is lower cost. All series reporting discharge disposition favor PT compared to treatment AF (Table 6). With respect to LOS, the NIS showed no significant difference between PT and AF, while smaller retrospective single institutional series suggest benefits for PT. In the only comprehensive true cost analysis comparing PT to AF (2011–2014), PT showed lower direct and total cost, but this study consisted of only 40 patients (Table 7)34. Implant costs were no different in that series.
Table 6.
Comparison of Rates of Discharge to Home and Hospital Stay Between Prophylactic Fixation and Pathologic Fracture Treatment.
| Number patients | Discharge rate to home | Hospital stay | |||||
|---|---|---|---|---|---|---|---|
| Prophylactic fixation (%) | Pathologic fracture (%) | P value | Prophylactic fixation (mean days) | Pathologic fracture (mean days) | P value | ||
| Aneja 201733 | 5579 | 58.4 | 30.2 | <0.01 | 7.49 | 7.54 | N.S. |
| Blank 201634 | 40 | 84 | 57 | 0.063 | 4 (all sites) | 8 | 0.01 |
| 4 (lower extremity) | 7 | 0.053 | |||||
| Ward 200228 | 182 | 79 | 56 | 0.01 | 7 | 11 | 0.01 |
| Arvinius 200229 | 65 | NA | NA | NA | 8 | 16 | 0.012 |
| Hardman 199227 | 54 | 93 | 59 | NA | NA | NA | NA |
Table 7.
Cost Analysis of Prophylactic Fixation Compared to Pathologic Fractures.
| All anatomic sites | Lower extremities | |||||
|---|---|---|---|---|---|---|
| Prophylactic treatment (CU) | Pathologic fracture (CU) | P value | Prophylactic treatment (CU) | Pathologic fracture (CU) | P value | |
| Implant cost | 54 ±26 | 47 ± 25 | N.S. (0.38) | 52 ± 24 | 55 ± 27 | N.S. (0.72) |
| Direct cost | 227 ± 93 | 382 ± 300 | 0.038 | 237 ± 92 | 374 ± 272 | 0.06 |
| Total cost | 370 ± 171 | 642 ± 519 | 0.036 | 390 ± 169 | 634 ±477 | 0.053 |
Adapted from Blank et al34.
APPROACHES TO ASSESS FRACTURE RISK
Classification/Scoring Systems for Long Bones with Metastatic Lesions
After considering the potential risks and benefits to prophylactic stabilization, the surgeon must consider approaches to assess fracture risk, as there are many. Early efforts to assess risk of impending fracture of long bones focused on clinical and radiographic risk factors using retrospective clinical series. Increasing pain, lesion size threshold (eg > 25 mm), osteolytic appearance, femoral location, lesion-to-bone width threshold (eg > 0.6), axial cortical involvement (eg > 30 mm), and circumferential cortical involvement (eg > 50%) either individually or in combination have been proposed as risk factors11; 35–39. From these early papers, two widely quoted sets of criteria evolved -- Harrington’s criteria40 and the “conventional definition” of impending pathologic fracture described by Carnesale41. Harrington’s criteria for prophylactic fixation of metastatic lesions of the femur included a lesion 25 mm or lager in size on radiographs, a lesion occupying more than 50% of the femoral cortex, and a lesion causing local pain with weight bearing. Carnesale similarly indicated that any lesion with significant pain and greater than 50% cortical involvement or larger than 30 mm represented increased risk of fracture. Interestingly, neither of these criteria has been assessed prospectively to evaluate accuracy.
Using the concepts of lesion location, lesion type (lytic/blastic), lesion size, and patient pain, Mirels’42 developed a widely referenced scoring system that combined radiographic and clinical risk factors into one score (Figure 1). The authors retrospectively applied this scoring scheme to a series of 78 lesions in 38 patients, and found the best combination of sensitivity and specificity to predict fracture was using a Mirels’ score of 9 or greater. With a Mirels’ score of 9, the probability of fracture was 33%, and this score was suggested as diagnostic for impending fracture. Overall, Mirels’ found high sensitivity and specificity (Table 8) with an overall accuracy of 90% in correctly predicting fracture. Pain and size were more predictive of clinical fracture compared to lesion (type) or lesion site. As an independent factor, lesion site did not appear to be a significant predictor of clinical fracture.
Figure 1.
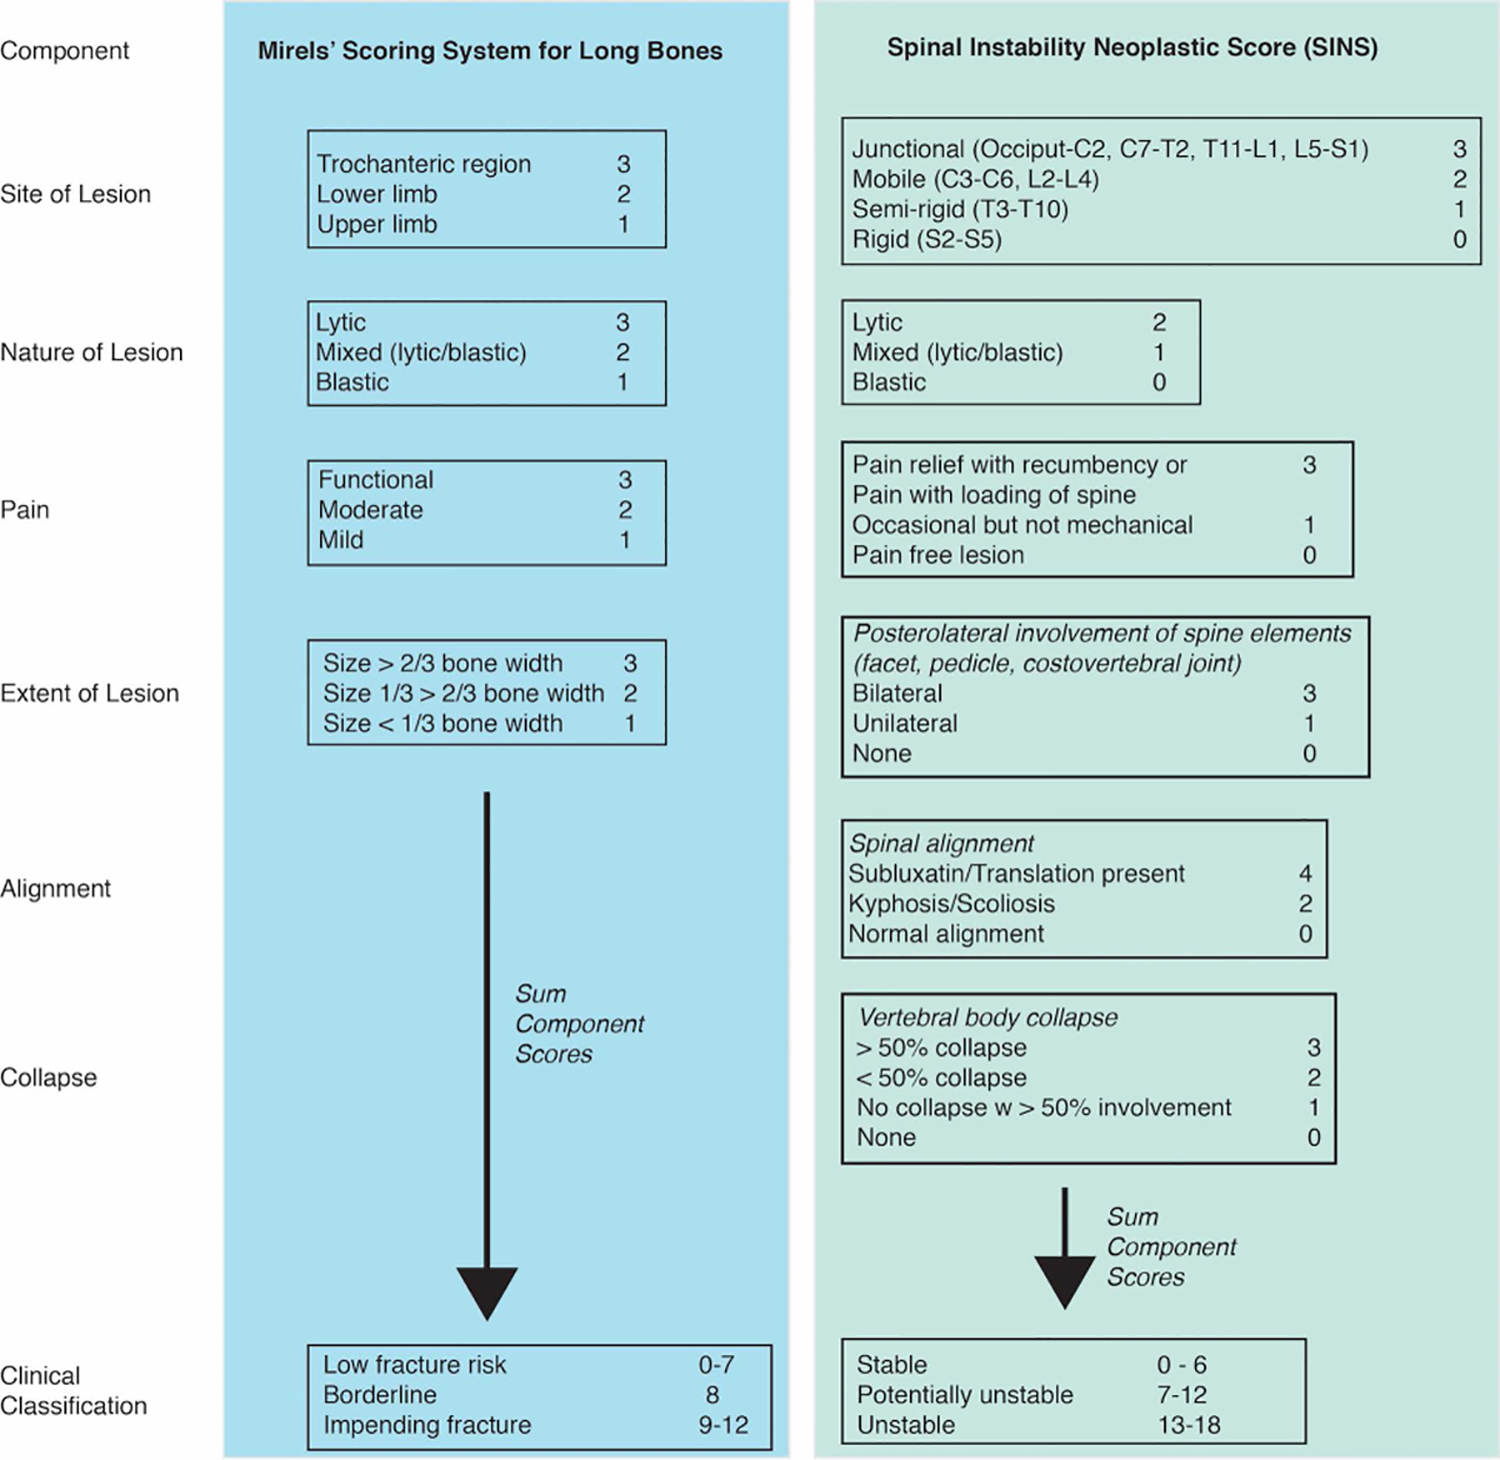
Components of Mirels’ scoring for long bones and SINS for metastatic bone lesions.
Table 8:
Statistical measures of performance using Mirels’ and SINS scoring systems with long bone impending fracture predicted for a Mirels’ score of 9 or greater, and vertebral fracture.
| Author | Scoring System | Region | Number of Patients | Fx | No Fx | Sensitivity (%) | Specificity (%) | PPV (%) | NPV (%) | Accuracy (%) |
|---|---|---|---|---|---|---|---|---|---|
| Mirels (1989)42 | Mirels | Upper and lower extremity | 38 (78 lesions) | 27 | 51 | 81 | 94 | 88 | 91 | 90 |
| Damron (2003)43 | Mirels | Femur | 12 | 2 | 5 | 91 | 35 | |||
| Van der Linden (2004)45 | Mirels | Femur | 102 (110 lesions) | 14 | 96 | 100 | 13 | 14 | 100 | 24 |
| Nazarian (2015)47 | Mirels | Femur | 104 | 7 | 58 | 71 | 50 | 15 | 94 | 52 |
| Goodheart (2015)46 | Mirels | Femur | 44 | 5 | 28 | 80 | 43 | 20 | 92 | 48 |
| Bollen (2017)48 | SINS | Vertebrae | 110 | 94 | 16 | 45* | 30 | 10 | 74 |
Average from four observers indicated.
Damron43 reported that the Mirels’ rating system was reproducible, valid, and applicable across experience levels and training background. Reproducibility was high to very high for lesion type and site, but was fair for size and pain scores. As noted above, size and pain appear to be the most important predictors of fracture. In contrast, Howard et al44, found only fair reproducibility for size and total Mirels’ score, and moderate reproducibility for site and lesion type. Subsequent application of Mirels’ scoring to independent patient series with metastatic lesions to long bones has been less promising (Table 8)43; 45–47. While sensitivity of the method appears to be relatively strong (71–100%), the specificity is much poorer (13–50%) compared to the initial Mirels series. The high specificity found with the original Mirels manuscript may be due to the fact that the Mirels scheme was developed from one (training) data set, without independent application to a separate (test) data set. The large fraction of cases that were incorrectly predicted to fracture creates a clinical challenge, because if strictly followed, would result in a large population of unnecessary PT.
The independent predictive value of factors such as pain, lesion type and location in long bones has been questioned45. Van der Linden45 found that axial cortical involvement greater than 30mm (86/58% sensitivity/specificity) and circumferential involvement greater than 50% (43/82% sensitivity/specificity) were better predictors of fracture compared to Mirels (100/13% sensitivity/specificity). Reproducibility of the axial cortical metric was high, but quantifying circumferential involvement using multiple radiographic views was challenging. Strict use of the axial cortical metric would still lead to surgical overtreatment but to a lesser extent compared to Mirels’ or other conventional predictors such as pain and lesion type.
Three-dimensional analysis of lesional size and extent using CT imaging could improve size measures beyond that available from planar x-ray. Tatar et al49 reported axial cortical involvement greater than 45mm (100/86% sensitivity/specificity) and circumferential cortical involvement greater than 30% (100/89% sensitivity/specificity) were strong predictors of long bone fracture. In addition to improvements in characterization of lesion geometry, the site of the lesion may have a large effect on bone strength. In a laboratory study, the femoral neck with an inferior-medial lesion was found to be less than half the strength of a femoral neck with a superior-lateral lesion of equivalent size50. Therefore, there is likely potential for further improvement on geometry based fracture prediction by utilizing three dimensional imaging and data concerning lesional location beyond that initially conceived by Mirels.
Classification/Scoring of Spinal Instability
Given the high prevalence of metastatic lesions in vertebrae51, a classification system to diagnose impending spinal instability (Spinal Instability Neoplastic Score (SINS)) was developed in 201052 by the Spine Oncology Study Group (SOSG). The goal was to develop a scoring system to guide clinicians in treating patients that may benefit from surgical consultation and to help guide surgical decisions. Some features overlapping with Mirels’ scoring system for long bones include lesion site, lesional nature (lytic/blastic/mixed), pain, and lesional extent (Figure 1). Additional spine components include spinal alignment and vertebral body collapse. The clinical classification is divided into stable, potentially unstable, and unstable groups.
Intra and inter-observer reliability has been reported to be very high for total SINS score53. Interobserver reliability was fair for lesion type, moderate for alignment, vertebral body collapse, and posterolateral involvement, and almost perfect for location and pain. When compared to the binary gold standard (consensus opinion to identify stable and potentially unstable/unstable lesions), 96% sensitivity and 80% specificity was found for SINS assessment from 24 SOSG members. However, there is limited data on use of SINS as a predictive tool for progression of deformity or fracture. For a series of 110 patients with a median follow-up of 5.2 months, the ability to detect deterioration of spinal alignment requiring surgical stabilization or pathological fractures using SINS48 was only modest (Table 8), with sensitivity and specificity of less than 50%.
Computed Tomography Based Structural Rigidity Analysis
Quantitative Computed tomography (QCT) scans provide full three-dimensional information about spatial geometry of bone and metastatic defects. In addition, bone density is available via the gray scale level of the bone, which correlates linearly with tissue mineral density. These two features (geometry and density) can be combined using engineering composite beam theory, resulting in measures of axial rigidity, bending rigidity, and torsional rigidity54. Rigidity components can be calculated for each axial cross section of bone from a clinical QCT scan set. Because rigidity analysis does not calculate actual bone strength, the rigidity of homologous cross sections in the contralateral bone is also calculated, and the relative difference in rigidity is calculated. For cases that only involve one limb, density calibration with a phantom may not be needed using CTRA. If lesions are present in the contralateral limb, rigidity data from a normative library for the bone is used. An example of CT rigidity analysis (CTRA) for a 68 year-old male with a lytic lesion in the proximal left femur (Figure 2) illustrates the difference in rigidity based on axial position. A reduction of rigidity of 33% or more was considered to be at high risk of fracture47.
Figure 2.

Computed tomography rigidity analysis (CTRA) of 68yo male with a Mirels’ Score of 10. CTRA indicates a significant risk of fracture at the site of the lesion and was prophylactically stabilized. In this case, axial rigidity was reduced by more than 33% at the cross section of the lesion, indicating a high risk of fracture.
CTRA has been performed on pediatric patients with benign skeletal lesions54; 55, vertebral metastases56, and metastatic lesions in the femur47; 57. Overall, the approach appears to improve specificity without loss of sensitivity compared to the scoring methods described above (Table 9). One limitation with CTRA analysis is that the underlying beam theory assumes that the bones are straight. This may be appropriate for the diaphysis of long bone, but may introduce error at the ends of the bone that are often curved, such as the proximal femur, where many metastatic lesions occur. Curved beam theory (curved-CTRA) has been applied to the proximal femur and resulted in improved correlation between bending rigidity and failure load for curved-CTRA (r2=0.89) compared to straight beam CTRA (r2 = 0.63)58. This suggests that curved-CTRA could improve predictive capabilities of the general CTRA approach. One notable feature of the CTRA approach is that the calculation of rigidity on a slice-by-slice basis is not computationally expensive, and a complete analysis to estimate fracture risk can be conducted in 15 minutes58.
Table 9:
Computed tomography rigidity analysis (CTRA) CTRA, Finite element analysis (FE), 18F-fluorodeoxyglucose (FDG) positron emission tomography/computed tomography (PET/CT), Parametric Response Mapping (PRM), and a weight scale analysis for clinical risk of fracture.
| Author | Analysis | Lesion Type | Number of Patients | Fx | No Fx | Sensitivity (%) | Specificity (%) | PPV (%) | NPV (%) | Accuracy (%) |
|---|---|---|---|---|---|---|---|---|---|
| Snyder (2006)54 | CTRA | Pediatric benign skeletal | 36 | 18 | 18 | 100 | 78 | 89 | ||
| Snyder (2009)56 | CTRA | Vertebral metastases | 94 (247 lesions) | 11 | 236 | 100 | 55 | |||
| Leong (2010)55 | CTRA | Pediatric benign skeletal | 102 (110 lesions) | 0 | 41 | 97 | 97 | |||
| Nazarian (2015)47 | CTRA | Femur | 104 | 7 | 58 | 100 | 90 | 54 | 100 | 91 |
| Damron (2016)57 | CTRA | Femur | 94 | 6 | 88 | 100 | 60 | 15 | 100 | 63 |
| Roth (2004)61 | FE | Vertebrae | 72 (92 vertebrae) | 21 | 71 | 100 | 100 | |||
| Goodheart (2015)46 | FE | Femur^ | 44 | 5 | 28 | 80 | 86 | 50 | 96 | 87 |
| Eggermont (2018)62 | FE | Femur+ | 39 | 9 | 38 | 89 | 79 | 50 | 97 | 81 |
| Sternheim (2018)63 | FE | Femur+ | 11 | 0 | 11 | 63 | 63 | |||
| Eggermont (2020)64 | FE | Femur+ | 50 | 7 | 43 | 100 | 74 | 39 | 100 | 78 |
| Ulaner (2017)65 | FDG PET/CT | Femur | 82 | 27 | 52 | 85 | 80 | 67 | 92 | 81 |
| Hoff (2015)66 | PRM | Vertebrae | 5 | 5 | 5 | 100 | 71 | |||
| Howard (2019)67 | Weight Scale | Lower limb^^ | 59 | 26 | 33^^ | 97 | 65 | 79 | 86 | 81 |
level walking load condition.
axial head load condition.
estimated high fracture risk rather than actual fracture.
Finite Element Modeling
Application of the finite element (FE) method to predict fracture of the femur59 and spine60 with simulated metastatic lesions was first attempted in the 1990s. The FE approach is appealing because models recreate the three dimensional geometry of the bone and metastatic lesions (Figure 3) using Quantitative Computed Tomography (QCT) data, and each element has mechanical attributes (stiffness, strength, post yield behavior) based on local bone density. Loading conditions that reflect ADLs or loading from a fall can be applied to the model. While a definite load bearing capacity can be determined for the simulation, validation is needed to insure that the FE solution is accurate.
Figure 3.

CT based solid model of proximal femur (A) with a large intertrochanteric lytic defect (B). Elements are based on CT voxels (three dimensional pixels) (C) and material properties (elastic modulus shown here) of each element is based on CT mineral equivalent densities. Mechanical loading (D) can simulate different activities of daily living such as level walking or stair ascent. Reprinted from Goodheart et al46.
Subject specific FE models can be developed from cadaver bones containing metastatic lesions or experimentally created lesions. The predicted strength from the FE analysis can be compared to the actual load bearing strength of cadaver bone for validation purposes (Table 10). Overall, correlation of FE predicted and actual bone strength is strong for the femur with clinical or experimentally created lesions (ave r2=0.87 for 6 studies, range 0.77–0.98)68–73. The accuracy of FE predicted values is often expressed as the standard error of the estimate (SEE) normalized by the averaged measured strength (%SEE)74. For the four non-linear finite element studies that report SEE for femurs with lesions, the average %SEE was 16.4%. These findings illustrate that when the loading is specifically defined, the FE approach can explain ~80% of the variability in load bearing strength, with errors in predicting actual failure magnitudes for a specific femur of 12–20%.
Table 10:
Correlation of finite element (FE) models with laboratory biomechanical testing. Standard error of the estimate (SEE).
| Author | Tissue | Experimental Loading | Material Model | Number of Specimens | Lesions | Model-Exp Correlation (r2) | Mean Error (%) | SEE (N) | SEE/Mean (%) |
|---|---|---|---|---|---|---|---|---|---|
| Keyak (2005)84 | Cadaver femur | Femoral head, stance phase | Non-linear, Density based strength, with post yield softening | 26 | 5 with metastatic lesions | 0.83 | 5.7 | 963 | 12.5 |
| Keyak (2005)70 | Cadaver femur | 4 pt bend mid-diaphysis | Linear; Density based strength | 12 | 8 with metastatic lesions | 0.88 | 1380 | 13.6 | |
| Tanck (2009)72 | Cadaver femur | Femoral head, stance phase | Non-linear, Density based strength, with post yield softening | 10 (5 pairs) | Experimentally created peritrochanteric | 0.92 | 18.7 | 1087 | 20.2 |
| Derikx (2012)69 | Cadaver femur | Femoral head, stance phase | Non-linear, Density based strength, with post yield softening | 20 (10 pairs) | Experimentally created peritrochanteric, proximal diaphysis | 0.92 | 15.7 | 1046 | 19.4 |
| Yosibash (2014)73 | Cadaver femur | Femoral head, stance phase | Linear; p-elements; Density based strength; surface strain limits | 14 | Metastatic lesions | 0.78 | 23.3 | 3075 | 51.3 |
| Benca (2019)68 | Cadaver femur | Femoral head, 20 deg coronal plane | Nonlinear, density based strength, Hill criteria | 32 | Experimentally created, neck | 0.77–0.98 | |||
| Groenen (2018)76 | Cadaver spine (2 motion segments) | Axial | Non linear, Density-based strength, softening, 4 material models | 12 | 6 with experimentally created defects | 0.22 – 0.25 | |||
| Hojjat (2012)77 | In vivo Rat vertebrae (2 motion segments) | Axial | Linear, density based strength; tissue strain correlation (10th percentile) | 15 | Inoculated breast cancer and prostate cancer cells | 0.41 |
CT-based FE modeling has also been performed retrospectively for patients with femoral metastatic lesions prior to any fracture (Table 9). For example, Eggermont et al64 performed subject specific FE analysis of 45 patients with femoral bone metastases using threshold of 7.5 x BW or lower identified as having high fracture risk. Using this criterion, the FE models were better at assessing fracture risk compared to clinical guidelines (lesions larger than 30mm) with improved sensitivity (100% vs 86%) and specificity (74% vs 42%). Similar sensitivity and specificity magnitudes were found with other FE models of clinical data sets (Table 9).
The correlation between FE modeling and experimental strength prediction for vertebral metastatic lesions have had mixed results. Using CT-based FE models of individual vertebral bodies with osteolytic lesions from multiple myeloma patients, cases with a vertebral fracture had 21% lower predicted yield force, and 27% lower work to yield compared to vertebrae that did not fracture75. However, the ability to predict actual fracture strength has not been as promising. For FE models of human cadaver spines with experimentally created defects consisting of two motion segments (Figure 4), correlation between model and experiment subjected to axial loading was relatively weak (r2=0.22–0.25)76. Predictive FE models for the spine has also been evaluated using a preclinical rat model with lytic and blastic vertebral lesions created using inoculated breast and prostate cancer cells77. Even with use of microCT imaging, the correlation between axial load bearing from experiments with magnitude of high tissue strain in subject specific models was only moderate (r2 = 0.41). Possible contributors to the poor strength prediction is the modified distribution of load between centrum and posterior elements during vertebral failure, the complex loading of the vertebral body via intervertebral discs, and endplate modeling that did not specifically model a very thin (<1mm) shell of bone. Multi-segment spine models with metastatic lesions are arguably much more complex from a modeling and experimental loading perspective compared to the proximal femur, and further development is necessary to improve the capability as a predictive tool.
Figure 4:

CT scan images of pre-experiment (A) and post axial load to failure (B) CT scans for three vertebral level construct. An experimental lesion was created for the middle vertebral body to simulate a metastatic lesion. White arrows indicate location of endplate fracture. Anterior (C) and lateral (D) views of specimen specific finite element models illustrate localization of failure to the middle vertebrae via plastic deformation (indicated in red/orange/yellow). Reprinted from Groenen et al.76.
As an alternative to subject specific modeling of the spine, a biomechanically based regression model of spinal vertebral bulging61 with contributions from tumor volume, bone mineral density, pedicle involvement, disc degeneration, applied load, and loading rate was developed using a parametric FE approach78. When applied to a series of 72 patients with 92 metastatic lesions, the authors found that sensitivity and specificity of 100% could be achieved for predicting fracture61. While promising, this work was retrospective and would need to be assessed in a prospective study to assess clinical utility. Nonetheless, the concept of combining a series of accessible factors that each contribute to vertebral fracture risk is appealing, and could be extended to other regions of the skeleton with metastatic lesions.
One challenge with respect to widespread use and implementation of QCT-FE to predict fracture risk is the effect of different CT imaging system and scanner settings on the calculated fracture load79–82. For example, differences in predicted failure load of proximal cadaver femurs varied by 17% using CT scanners from three different manufacturers82. Note that the same femurs and calibration phantoms were used in all scanners. The choice of reconstruction kernel was found to have a large effect on bone mineral density (BMD) and FE predicted failure load. There are also differences in quantified bone mineral density, depending the amount and type of tissue surrounding the bone of interest. An in vivo study of femoral BMD for women using two different imaging systems, showed that there was a significant effect of body size on inter-scanner differences in BMD measures81.
There have been several recent advances in FE approaches that could improve the utility of QCT-FE based strength prediction. Density calibration without a phantom has been used for fracture risk assessment in patients with femoral bone metastases using QCT based FE models83. No difference was seen in predicted failure load using phantom and phantom-less air-fat-muscle calibration. From a practical perspective, ability to develop bone FE models without need of a phantom allows access to a larger set of clinical scan data.
Material models used in metastatic lesion FE analysis have generally been derived from normal bone84–87. However, there is limited data on density-modulus-strength relationships for metastatic bone and some indication that metastatic cortical bone has reduced modulus and compressive strength88, even after accounting for altered bone density. Biphasic or poroelastic material models have been developed for osteolytic lesions where fluid is present within a porous solid matrix60; 89. Blastic lesions, despite having greater apparent density, had lower modulus compared to normal bone90. Specialized material models for blastic lesions that depart from normal dependence of strength and stiffness on bone density are therefore needed. Improvements in defining the geometry (edges) and intensity (density) in thin bone structures via image deblurring91 from clinical CT scan sets could also improve predictive capabilities of these models.
Other Fracture Prediction Approaches
18F-fluorodeoxyglucose (FDG) positron emission tomography/computed tomography (PET/CT) can be used to evaluate the metabolic activity of bone metastases. A retrospective study of metastatic breast cancer proximal femoral lesions showed that total lesion glycolosis (TLG) level could differentiate subsequent fracture patients (Table 9) with an accuracy of 81%65. For this patient population, the results are comparable to CTRA and FE modeling.
Parametric Response Mapping (PRM) of CT Images uses a method in which changes in voxel gray scale (Hounsfield Unit) values are documented over time from longitudinal (sequential) CT scans66. For a series of clinical cases with osteoblastic lesions, a rapid increase in local BMD was found to be predictive of impending fracture (100/71% sensitivity/specificity) (Table 9). However, sample size was very small and the developed PRM protocol should next be tested on a larger independent data set. One attractive feature of this approach is that it does not require complex FE modeling, but it does require image registration between CT scan sets.
Other simple tools, such as the ability to weight bear on the affected leg of patients with MBD through use of a weight scale has recently been proposed67 as a method to assess fracture risk. Patients that could support less than 85% of body weight through the affected limb were found to be at increased risk of fracture. However, strict endpoints of pathologic fracture or no fracture were not used, but were based on clinical assessment of high or low fracture risk (Table 9).
CLINICAL DECISION-MAKING
In the shared decision-making discussion with the patient in the setting of possible impending pathologic fracture and in trying to come to the best decision with the patient, pros and cons must be weighed and discussed. As previously summarized, suggested potential advantages of PT, including survival, clinical benefits, and lower cost, should be considered. On balance, risks of PT, including early perioperative death and increased thromboembolic disease (TED) risk, must be weighed. Patient survival prediction following surgical treatment for MBD should be considered before surgery in order to determine if the patient’s predicted survival warrants operative intervention. Numerous survival prediction tools are available for MBD of both the spine and extremities92–95. In two comparisons of 7–9 scoring systems for metastatic spine disease, the SORG nomogram showed highest accuracy for 30 (Area Under Curve, AUC 0.81) and 90 (AUC 0.78) day survival, but original Tokuhashi score was most accurate at 1 year (AUC 0.78)94. The SORG nomogram is favored (94). Negative survival prognostic factors in the SORG nomogram include low hemoglobin, leukocytosis, older age, prior systemic treatment, lung/liver or brain mets, more than 1 mobile spine met, type 2 cancers, and European Cooperative Oncology Group (ECOG) 3 or 4 (describes patient functional status).
Patient survival tools for appendicular MBD include several models, scores, and nomograms. In direct comparison, the PATHFx model was most accurate at predicting 3 (AUC 0.70) and 6 (AUC 0.70) month survival, but the OPTIModel was most accurate for 12 (AUC 0.79) and 24 (AUC 0.77) month survival96. PATHFx is available online (www.pathfx.org), whereas none of the other systems are to date. Factors associated with decreased survival include Type 2 or 3 tumors, visceral mets, femoral neck lesions, ASA > 3, ALP > 129 U/L, Albumin < 30 g/L.
In evaluation of three machine learning techniques to develop a survival prediction model, artificial neural network (ANN) had highest discrimination at 3 (AUC 0.89) and 12 (AUC 0.93) months compared to Bayesian belief network (BBN) and logistic regression97. Decision (net benefit) analysis is a sophisticated decision analytic measure that provides information on balanced comparison of a test’s risks and benefits and has specific applicability to prediction tools98. The authors compared ANN to BBN to regression applied decision analysis and demonstrated highest net benefit using ANN but suggested that BBN may be easier to implement in the clinical setting.
DISCUSSION
The global incidence rate of cancer is projected to increase to 20 million by 2030, and patients are also surviving longer with cancer and metastatic disease99. For patients with MBD, identifying patients that have impending pathologic fractures is important because prophylactic treatment may reduce overall patient morbidity and mortality. However, correctly identifying patients truly at fracture risk remains a clinical challenge. Without good tools to identify impending fractures, potential remains for unnecessary surgery from a false positive test. Refined definitions of impending pathological fracture and spinal instability (through predictive tool assessment and validation) are therefore needed.
Of the numerous techniques available to predict fracture risk, the newer techniques that combine three-dimensional CT imaging and structural analysis (FE and CTRA) seem promising, but the clinical data sets used to evaluate these techniques are relatively small. In particular, there are few reported fracture cases, so that the confidence interval and uncertainty of the reported mean value for the sensitivity measure is very large. Access to a large number of pre-fracture CT scan sets, perhaps through use of phantomless density calibration83, could be helpful in this regard.
Magnitude of load applied to a bone with metastatic lesions is likely a substantial contributor to fracture risk. For the proximal femur, loads from ADLs such as stance, gait, and stair climbing have been used in FE models, but more aggressive scenarios such as trip or fall have not been considered. Probability of encountering a range of loading activities could be assigned to individual patients as part of a probabilistic risk assessment tool100 based on individual status (bedridden, ambulatory, at high risk of a fall). Combining this with a strength assessment (FE hip load capacity) could help guide decisions for PT.
In this era of “big data” and “machine learning”, we are on the cusp of many new developments. Machine learning, specifically decision tree (DT) and support vector machine (SVM), have been used to predict SREs, but access to truly “big data” is limited. Wang et al101 mined data for 1143 cancer patients, finding AUC 88.2% with only 4 variables for SRE prediction. Unfortunately, no analysis has been published yet for the subset of 248 pathologic fractures. It is this sort of truly big data with large numbers of pathologic fractures that may yield highly accurate fracture prediction. In a study combining CT and clinical data for 84 lung cancer patients with proximal femoral bone lesions, machine learning showed high accuracy (AUC 0.80) for fracture risk assessment, but 71% of patients fractured within 3 months, an unusually high level102.
Despite the promise of newer techniques (CTRA, FE, PET/CT, PRM, machine learning), they are not widely available and require specialized equipment/software and expertise to implement. Simpler screening/scoring tools described above (Mirels, cortical involvement, SINS) therefore still have an important role in clinical decision making. However, scoring prediction as applied to the femur suffers from poor specificity, and if followed strictly would greatly over-estimate the need for PT. SINS was only recently developed to predict spine instability, there is only one prospective study to date, and this has indicated sensitivity and specificity of less than 50%. Additional prospective assessment of these scoring tools is needed and application to larger data sets could also help refine important predictors of fracture.
Although the increasing number of recently published papers supporting PT over AF treatment is welcome, care must be taken in interpretation. “Impending fracture” definitions in those papers are often poor or absent. The potential is that misplaced benefit is assigned to PT procedures where patients would be better off without PT if not truly at risk for fracture. Future prospective data collection should provide detailed definitions and, when possible, use advanced fracture prediction tools.
The concept of combining CT imaging data and other clinical data could further improve fracture prediction. For example, Goodheart et al46 showed improved prediction combining FEA and Mirels. CT-based descriptive variables combined with clinical features improved fracture prediction AUC from 0.62 to 0.80102. This approach of combining variables is similar to survival analysis and will require similar steps to validate.
Finally, current approaches do not consider the net benefit analysis for fracture risk testing. Net benefit analysis has been applied to compare survival prediction tools but not fracture prediction tools97 in metastatic disease. Such application would be advantageous to determine the best fracture risk assessment tool from a broader perspective.
As a group, the specialists that evaluate and surgically treat patients with MBD and likely have the greatest potential to contribute to the advancement of care are orthopedic oncologists. As in other areas, evidence based medicine is needed to support the need for care of these patients by these specialists over community surgeons. Such efforts would surely be welcomed by those suffering from MBD.
Acknowledgements:
This work was supported by the Carol Baldwin Breast Cancer Research Fund (TAD and KAM), the National Institute of Arthritis and Musculoskeletal and Skin Diseases of the National Institutes of Health under award R01AR065419 (TAD) and by the David G. Murray Endowment (TAD). The content is solely the responsibility of the authors and does not necessarily represent the official views of the National Institutes of Health.
REFERENCES
- 1.AAOS. 2019. Metastatic Bone Disease. orthoinfo.aaos.org. [Google Scholar]
- 2.Li S, Peng Y, Weinhandl ED, et al. 2012. Estimated number of prevalent cases of metastatic bone disease in the US adult population. Clin Epidemiol 4:87–93. [DOI] [PMC free article] [PubMed] [Google Scholar]
- 3.Ellis L, Woods LM, Esteve J, et al. 2014. Cancer incidence, survival and mortality: explaining the concepts. Int J Cancer 135:1774–1782. [DOI] [PubMed] [Google Scholar]
- 4.Rogoz B, Houze de l’Aulnoit A, Duhamel A, et al. 2018. Thirty-Year Trends of Survival and Time-Varying Effects of Prognostic Factors in Patients With Metastatic Breast Cancer-A Single Institution Experience. Clin Breast Cancer 18:246–253. [DOI] [PubMed] [Google Scholar]
- 5.Selvaggi G, Scagliotti GV. 2005. Management of bone metastases in cancer: a review. Crit Rev Oncol Hematol 56:365–378. [DOI] [PubMed] [Google Scholar]
- 6.Body JJ, Quinn G, Talbot S, et al. 2017. Systematic review and meta-analysis on the proportion of patients with breast cancer who develop bone metastases. Crit Rev Oncol Hematol 115:67–80. [DOI] [PubMed] [Google Scholar]
- 7.Surgeons ACo. 2019. Site by STage of Top 14 (out of 14) Sites Cancers Diagnosed in 2004 to 2014. [Google Scholar]
- 8.Coleman RE. 2001. Metastatic bone disease: clinical features, pathophysiology and treatment strategies. Cancer Treat Rev 27:165–176. [DOI] [PubMed] [Google Scholar]
- 9.Coleman RE. 2006. Clinical features of metastatic bone disease and risk of skeletal morbidity. Clin Cancer Res 12:6243s–6249s. [DOI] [PubMed] [Google Scholar]
- 10.Glasko C 1981. The Anatomy and Pathwats of Skeletal Metastases In: Weiss L, Gilbert AH editors. Bone Metastases. Bostn: G.K. Hall; pp. 49–63. [Google Scholar]
- 11.Zickel RE, Mouradian WH. 1976. Intramedullary fixation of pathological fractures and lesions of the subtrochanteric region of the femur. J Bone Joint Surg Am 58:1061–1066. [PubMed] [Google Scholar]
- 12.Gutowski CJ, Zmistowski B, Fabbri N, et al. 2019. Should the Use of Biologic Agents in Patients With Renal and Lung Cancer Affect Our Surgical Management of Femoral Metastases? Clin Orthop Relat Res 477:707–714. [DOI] [PMC free article] [PubMed] [Google Scholar]
- 13.Yong M, Jensen AO, Jacobsen JB, et al. 2011. Survival in breast cancer patients with bone metastases and skeletal-related events: a population-based cohort study in Denmark (1999–2007). Breast Cancer Res Treat 129:495–503. [DOI] [PubMed] [Google Scholar]
- 14.Norgaard M, Jensen AO, Jacobsen JB, et al. 2010. Skeletal related events, bone metastasis and survival of prostate cancer: a population based cohort study in Denmark (1999 to 2007). J Urol 184:162–167. [DOI] [PubMed] [Google Scholar]
- 15.Skov Dalgaard K, Gammelager H, Svaerke C, et al. 2015. Hospital use among patients with lung cancer complicated by bone metastases and skeletal- related events: a population-based cohort study in Denmark. Clin Epidemiol 7:363–368. [DOI] [PMC free article] [PubMed] [Google Scholar]
- 16.Sonpavde G, Madan A, Baker MK, et al. 2017. Prevalence of Measurable Disease in Metastatic Castration-resistant Prostate Cancer. Clin Genitourin Cancer 15:534–539. [DOI] [PMC free article] [PubMed] [Google Scholar]
- 17.Kosteva J, Langer C. 2008. The changing landscape of the medical management of skeletal metastases in nonsmall cell lung cancer. Curr Opin Oncol 20:155–161. [DOI] [PubMed] [Google Scholar]
- 18.Behnke NK, Baker DK, Xu S, et al. 2017. Risk factors for same-admission mortality after pathologic fracture secondary to metastatic cancer. Support Care Cancer 25:513–521. [DOI] [PubMed] [Google Scholar]
- 19.Jensen AO, Jacobsen JB, Norgaard M, et al. 2011. Incidence of bone metastases and skeletal-related events in breast cancer patients: a population-based cohort study in Denmark. BMC Cancer 11:29. [DOI] [PMC free article] [PubMed] [Google Scholar]
- 20.Trinkaus M, Simmons C, Myers J, et al. 2010. Skeletal-related events (SREs) in breast cancer patients with bone metastases treated in the nontrial setting. Support Care Cancer 18:197–203. [DOI] [PubMed] [Google Scholar]
- 21.Hussain A, Yong C, Tkaczuk KHR, et al. 2018. Prevalence and risk of skeletal complications and use of radiation therapy in elderly women diagnosed with metastatic breast cancer. PLoS One 13:e0193661. [DOI] [PMC free article] [PubMed] [Google Scholar]
- 22.Kawai AT, Martinez D, Saltus CW, et al. 2019. Incidence of Skeletal-Related Events in Patients with Castration-Resistant Prostate Cancer: An Observational Retrospective Cohort Study in the US. Prostate Cancer 2019:5971615. [DOI] [PMC free article] [PubMed] [Google Scholar]
- 23.McDougall JA, Bansal A, Goulart BH, et al. 2016. The Clinical and Economic Impacts of Skeletal-Related Events Among Medicare Enrollees With Prostate Cancer Metastatic to Bone. Oncologist 21:320–326. [DOI] [PMC free article] [PubMed] [Google Scholar]
- 24.Woodward E, Jagdev S, McParland L, et al. 2011. Skeletal complications and survival in renal cancer patients with bone metastases. Bone 48:160–166. [DOI] [PubMed] [Google Scholar]
- 25.Farooki A, Leung V, Tala H, et al. 2012. Skeletal-related events due to bone metastases from differentiated thyroid cancer. J Clin Endocrinol Metab 97:2433–2439. [DOI] [PubMed] [Google Scholar]
- 26.Kotian RN, Puvanesarajah V, Rao S, et al. 2018. Predictors of survival after intramedullary nail fixation of completed or impending pathologic femur fractures from metastatic disease. Surg Oncol 27:462–467. [DOI] [PubMed] [Google Scholar]
- 27.Hardman PD, Robb JE, Kerr GR, et al. 1992. The value of internal fixation and radiotherapy in the management of upper and lower limb bone metastases. Clin Oncol (R Coll Radiol) 4:244–248. [DOI] [PubMed] [Google Scholar]
- 28.Ward WG, Holsenbeck S, Dorey FJ, et al. 2003. Metastatic disease of the femur: surgical treatment. Clin Orthop Relat Res:S230–244. [DOI] [PubMed] [Google Scholar]
- 29.Arvinius C, Parra JL, Mateo LS, et al. 2014. Benefits of early intramedullary nailing in femoral metastases. Int Orthop 38:129–132.24126497 [Google Scholar]
- 30.Philipp TC, Mikula JD, Doung Y-C, et al. 2020. Is there an association between prophylactic femor stabilization and survival in patients with metastatic bone disease? Clin Orthop Relat Res 478:540–546. [DOI] [PMC free article] [PubMed] [Google Scholar]
- 31.Nooh A, Goulding K, Isler MH, et al. 2018. Early Improvement in Pain and Functional Outcome but Not Quality of Life After Surgery for Metastatic Long Bone Disease. Clin Orthop Relat Res 476:535–545. [DOI] [PMC free article] [PubMed] [Google Scholar]
- 32.Ryan JR, Rowe DE, Salciccioli GG. 1976. Prophylactic internal fixation of the femur for neoplastic lesions. J Bone Joint Surg Am 58:1071–1074. [PubMed] [Google Scholar]
- 33.Aneja A, Jiang JJ, Cohen-Rosenblum A, et al. 2017. Thromboembolic Disease in Patients with Metastatic Femoral Lesions: A Comparison Between Prophylactic Fixation and Fracture Fixation. J Bone Joint Surg Am 99:315–323. [DOI] [PubMed] [Google Scholar]
- 34.Blank AT, Lerman DM, Patel NM, et al. 2016. Is Prophylactic Intervention More Cost-effective Than the Treatment of Pathologic Fractures in Metastatic Bone Disease? Clin Orthop Relat Res 474:1563–1570. [DOI] [PMC free article] [PubMed] [Google Scholar]
- 35.Snell W, Beals RK. 1964. Femoral Metastases and Fractures from Breast Cancer. Surg Gynecol Obstet 119:22–24. [PubMed] [Google Scholar]
- 36.Fidler M 1973. Prophylactic internal fixation of secondary neoplastic deposits in long bones. Br Med J 1:341–343. [DOI] [PMC free article] [PubMed] [Google Scholar]
- 37.Parrish FF, Murray JA. 1970. Surgical treatment for secondary neoplastic fractures. A retrospective study of ninety-six patients. J Bone Joint Surg Am 52:665–686. [PubMed] [Google Scholar]
- 38.Beals RK, Lawton GD, Snell WE. 1971. Prophylactic internal fixation of the femur in metastatic breast cancer. Cancer 28:1350–1354. [DOI] [PubMed] [Google Scholar]
- 39.Menck H, Schulze S, Larsen E. 1988. Metastasis size in pathologic femoral fractures. Acta Orthop Scand 59:151–154. [PubMed] [Google Scholar]
- 40.Harrington KD. 1982. New trends in the management of lower extremity metastases. Clin Orthop Relat Res:53–61. [PubMed] [Google Scholar]
- 41.Carnesale P 2003. Malignant tumours of bone In: St Canale JB editor. Campbell’s Operative Orthopaedics, 10th ed. Amsterdam: Elsevier; p. 551. [Google Scholar]
- 42.Mirels H 1989. Metastatic disease in long bones. A proposed scoring system for diagnosing impending pathologic fractures. Clin Orthop Relat Res:256–264. [PubMed] [Google Scholar]
- 43.Damron TA, Morgan H, Prakash D, et al. 2003. Critical evaluation of Mirels’ rating system for impending pathologic fractures. Clin Orthop Relat Res:S201–207. [DOI] [PubMed] [Google Scholar]
- 44.Howard EL, Shepherd KL, Cribb G, et al. 2018. The validity of the Mirels score for predicting impending pathological fractures of the lower limb. Bone Joint J 100-B:1100–1105. [DOI] [PubMed] [Google Scholar]
- 45.Van der Linden YM, Dijkstra PD, Kroon HM, et al. 2004. Comparative analysis of risk factors for pathological fracture with femoral metastases. J Bone Joint Surg Br 86:566–573. [PubMed] [Google Scholar]
- 46.Goodheart JR, Cleary RJ, Damron TA, et al. 2015. Simulating activities of daily living with finite element analysis improves fracture prediction for patients with metastatic femoral lesions. J Orthop Res 33:1226–1234. [DOI] [PubMed] [Google Scholar]
- 47.Nazarian A, Entezari V, Zurakowski D, et al. 2015. Treatment Planning and Fracture Prediction in Patients with Skeletal Metastasis with CT-Based Rigidity Analysis. Clin Cancer Res 21:2514–2519. [DOI] [PMC free article] [PubMed] [Google Scholar]
- 48.Bollen L, Groenen K, Pondaag W, et al. 2017. Clinical Evaluation of the Spinal Instability Neoplastic Score in Patients Treated With Radiotherapy for Symptomatic Spinal Bone Metastases. Spine (Phila Pa 1976) 42:E956–E962. [DOI] [PubMed] [Google Scholar]
- 49.Tatar Z, Soubrier M, Dillies AF, et al. 2014. Assessment of the risk factors for impending fractures following radiotherapy for long bone metastases using CT scan-based virtual simulation: a retrospective study. Radiat Oncol 9:227. [DOI] [PMC free article] [PubMed] [Google Scholar]
- 50.Benca E, Reisinger A, Patsch JM, et al. 2017. Effect of simulated metastatic lesions on the biomechanical behavior of the proximal femur. J Orthop Res 35:2407–2414. [DOI] [PubMed] [Google Scholar]
- 51.Sciubba DM, Petteys RJ, Dekutoski MB, et al. 2010. Diagnosis and management of metastatic spine disease. A review. J Neurosurg Spine 13:94–108. [DOI] [PubMed] [Google Scholar]
- 52.Fisher CG, DiPaola CP, Ryken TC, et al. 2010. A novel classification system for spinal instability in neoplastic disease: an evidence-based approach and expert consensus from the Spine Oncology Study Group. Spine (Phila Pa 1976) 35:E1221–1229. [DOI] [PubMed] [Google Scholar]
- 53.Fourney DR, Frangou EM, Ryken TC, et al. 2011. Spinal instability neoplastic score: an analysis of reliability and validity from the spine oncology study group. J Clin Oncol 29:3072–3077. [DOI] [PubMed] [Google Scholar]
- 54.Snyder BD, Hauser-Kara DA, Hipp JA, et al. 2006. Predicting fracture through benign skeletal lesions with quantitative computed tomography. J Bone Joint Surg Am 88:55–70. [DOI] [PubMed] [Google Scholar]
- 55.Leong NL, Anderson ME, Gebhardt MC, et al. 2010. Computed tomography-based structural analysis for predicting fracture risk in children with benign skeletal neoplasms: comparison of specificity with that of plain radiographs. J Bone Joint Surg Am 92:1827–1833. [DOI] [PMC free article] [PubMed] [Google Scholar]
- 56.Snyder BD, Cordio MA, Nazarian A, et al. 2009. Noninvasive Prediction of Fracture Risk in Patients with Metastatic Cancer to the Spine. Clin Cancer Res 15:7676–7683. [DOI] [PubMed] [Google Scholar]
- 57.Damron TA, Nazarian A, Entezari V, et al. 2016. CT-based Structural Rigidity Analysis Is More Accurate Than Mirels Scoring for Fracture Prediction in Metastatic Femoral Lesions. Clin Orthop Relat Res 474:643–651. [DOI] [PMC free article] [PubMed] [Google Scholar]
- 58.Oftadeh R, Karimi Z, Villa-Camacho J, et al. 2016. Curved Beam Computed Tomography based Structural Rigidity Analysis of Bones with Simulated Lytic Defect: A Comparative Study with Finite Element Analysis. Sci Rep 6:32397. [DOI] [PMC free article] [PubMed] [Google Scholar]
- 59.Cheal EJ, Hipp JA, Hayes WC. 1993. Evaluation of finite element analysis for prediction of the strength reduction due to metastatic lesions in the femoral neck. J Biomech 26:251–264. [DOI] [PubMed] [Google Scholar]
- 60.Whyne CM, Hu SS, Lotz JC. 2001. Parametric finite element analysis of vertebral bodies affected by tumors. J Biomech 34:1317–1324. [DOI] [PubMed] [Google Scholar]
- 61.Roth SE, Mousavi P, Finkelstein J, et al. 2004. Metastatic burst fracture risk prediction using biomechanically based equations. Clin Orthop Relat Res:83–90. [DOI] [PubMed] [Google Scholar]
- 62.Eggermont F, Derikx LC, Verdonschot N, et al. 2018. Can patient-specific finite element models better predict fractures in metastatic bone disease than experienced clinicians?: Towards computational modelling in daily clinical practice. Bone Joint Res 7:430–439. [DOI] [PMC free article] [PubMed] [Google Scholar]
- 63.Sternheim A, Giladi O, Gortzak Y, et al. 2018. Pathological fracture risk assessment in patients with femoral metastases using CT-based finite element methods. A retrospective clinical study. Bone 110:215–220. [DOI] [PubMed] [Google Scholar]
- 64.Eggermont F, van der Wal G, Westhoff P, et al. 2020. Patient-specific finite element computer models improve fracture risk assessments in cancer patients with femoral bone metastases compared to clinical guidelines. Bone 130:115101. [DOI] [PubMed] [Google Scholar]
- 65.Ulaner GA, Zindman AM, Zheng J, et al. 2017. FDG PET/CT Assesses the Risk of Femoral Pathological Fractures in Patients With Metastatic Breast Cancer. Clin Nucl Med 42:264–270. [DOI] [PMC free article] [PubMed] [Google Scholar]
- 66.Hoff BA, Toole M, Yablon C, et al. 2015. Potential for Early Fracture Risk Assessment in Patients with Metastatic Bone Disease using Parametric Response Mapping of CT Images. Tomography 1:98–104. [DOI] [PMC free article] [PubMed] [Google Scholar]
- 67.Howard EL, Cool P, Cribb GL. 2019. Prediction of pathological fracture in patients with metastatic disease of the lower limb. Sci Rep 9:14133. [DOI] [PMC free article] [PubMed] [Google Scholar]
- 68.Benca E, Synek A, Amini M, et al. 2019. QCT-based finite element prediction of pathologic fractures in proximal femora with metastatic lesions. Sci Rep 9:10305. [DOI] [PMC free article] [PubMed] [Google Scholar]
- 69.Derikx LC, van Aken JB, Janssen D, et al. 2012. The assessment of the risk of fracture in femora with metastatic lesions: comparing case-specific finite element analyses with predictions by clinical experts. J Bone Joint Surg Br 94:1135–1142. [DOI] [PubMed] [Google Scholar]
- 70.Keyak JH, Kaneko TS, Rossi SA, et al. 2005. Predicting the strength of femoral shafts with and without metastatic lesions. Clin Orthop Relat Res 439:161–170. [DOI] [PubMed] [Google Scholar]
- 71.Keyak JH, Kaneko TS, Skinner HB, et al. 2007. The effect of simulated metastatic lytic lesions on proximal femoral strength. Clin Orthop Relat Res 459:139–145. [DOI] [PubMed] [Google Scholar]
- 72.Tanck E, van Aken JB, van der Linden YM, et al. 2009. Pathological fracture prediction in patients with metastatic lesions can be improved with quantitative computed tomography based computer models. Bone 45:777–783. [DOI] [PubMed] [Google Scholar]
- 73.Yosibash Z, Plitman Mayo R, Dahan G, et al. 2014. Predicting the stiffness and strength of human femurs with real metastatic tumors. Bone 69:180–190. [DOI] [PubMed] [Google Scholar]
- 74.Viceconti M, Qasim M, Bhattacharya P, et al. 2018. Are CT-Based Finite Element Model Predictions of Femoral Bone Strengthening Clinically Useful? Curr Osteoporos Rep 16:216–223. [DOI] [PMC free article] [PubMed] [Google Scholar]
- 75.Campbell GM, Pena JA, Giravent S, et al. 2017. Assessment of Bone Fragility in Patients With Multiple Myeloma Using QCT-Based Finite Element Modeling. J Bone Miner Res 32:151–156. [DOI] [PubMed] [Google Scholar]
- 76.Groenen KHJ, Bitter T, van Veluwen TCG, et al. 2018. Case-specific non-linear finite element models to predict failure behavior in two functional spinal units. J Orthop Res 36:3208–3218. [DOI] [PMC free article] [PubMed] [Google Scholar]
- 77.Hojjat SP, Beek M, Akens MK, et al. 2012. Can micro-imaging based analysis methods quantify structural integrity of rat vertebrae with and without metastatic involvement? J Biomech 45:2342–2348. [DOI] [PubMed] [Google Scholar]
- 78.Whyne CM, Hu SS, Lotz JC. 2003. Burst fracture in the metastatically involved spine: development, validation, and parametric analysis of a three-dimensional poroelastic finite-element model. Spine (Phila Pa 1976) 28:652–660. [DOI] [PubMed] [Google Scholar]
- 79.Dragomir-Daescu D, Salas C, Uthamaraj S, et al. 2015. Quantitative computed tomography-based finite element analysis predictions of femoral strength and stiffness depend on computed tomography settings. J Biomech 48:153–161. [DOI] [PMC free article] [PubMed] [Google Scholar]
- 80.Giambini H, Dragomir-Daescu D, Nassr A, et al. 2016. Quantitative Computed Tomography Protocols Affect Material Mapping and Quantitative Computed Tomography-Based Finite-Element Analysis Predicted Stiffness. J Biomech Eng 138. [DOI] [PMC free article] [PubMed] [Google Scholar]
- 81.Carpenter RD, Saeed I, Bonaretti S, et al. 2014. Inter-scanner differences in in vivo QCT measurements of the density and strength of the proximal femur remain after correction with anthropomorphic standardization phantoms. Med Eng Phys 36:1225–1232. [DOI] [PMC free article] [PubMed] [Google Scholar]
- 82.Eggermont F, Derikx LC, Free J, et al. 2018. Effect of different CT scanners and settings on femoral failure loads calculated by finite element models. J Orthop Res. [DOI] [PMC free article] [PubMed] [Google Scholar]
- 83.Eggermont F, Verdonschot N, van der Linden Y, et al. 2019. Calibration with or without phantom for fracture risk prediction in cancer patients with femoral bone metastases using CT-based finite element models. PLoS One 14:e0220564. [DOI] [PMC free article] [PubMed] [Google Scholar]
- 84.Keyak JH, Kaneko TS, Tehranzadeh J, et al. 2005. Predicting proximal femoral strength using structural engineering models. Clin Orthop Relat Res:219–228. [DOI] [PubMed] [Google Scholar]
- 85.Kopperdahl DL, Morgan EF, Keaveny TM. 2002. Quantitative computed tomography estimates of the mechanical properties of human vertebral trabecular bone. J Orthop Res 20:801–805. [DOI] [PubMed] [Google Scholar]
- 86.Morgan EF, Bayraktar HH, Keaveny TM. 2003. Trabecular bone modulus-density relationships depend on anatomic site. J Biomech 36:897–904. [DOI] [PubMed] [Google Scholar]
- 87.Schileo E, Taddei F, Cristofolini L, et al. 2008. Subject-specific finite element models implementing a maximum principal strain criterion are able to estimate failure risk and fracture location on human femurs tested in vitro. J Biomech 41:356–367. [DOI] [PubMed] [Google Scholar]
- 88.Kaneko TS, Pejcic MR, Tehranzadeh J, et al. 2003. Relationships between material properties and CT scan data of cortical bone with and without metastatic lesions. Med Eng Phys 25:445–454. [DOI] [PubMed] [Google Scholar]
- 89.Falcinelli C, Di Martino A, Gizzi A, et al. 2019. Mechanical behavior of metastatic femurs through patient-specific computational models accounting for bone-metastasis interaction. J Mech Behav Biomed Mater 93:9–22. [DOI] [PubMed] [Google Scholar]
- 90.Hipp JA, Rosenberg AE, Hayes WC. 1992. Mechanical properties of trabecular bone within and adjacent to osseous metastases. J Bone Miner Res 7:1165–1171. [DOI] [PubMed] [Google Scholar]
- 91.Falcinelli C, Schileo E, Pakdel A, et al. 2016. Can CT image deblurring improve finite element predictions at the proximal femur? J Mech Behav Biomed Mater 63:337–351. [DOI] [PubMed] [Google Scholar]
- 92.Leithner A, Radl R, Gruber G, et al. 2008. Predictive value of seven preoperative prognostic scoring systems for spinal metastases. Eur Spine J 17:1488–1495. [DOI] [PMC free article] [PubMed] [Google Scholar]
- 93.Paulino Pereira NR, McLaughlin L, Janssen SJ, et al. 2017. The SORG nomogram accurately predicts 3- and 12-months survival for operable spine metastatic disease: External validation. J Surg Oncol 115:1019–1027. [DOI] [PubMed] [Google Scholar]
- 94.Ahmed AK, Goodwin CR, Heravi A, et al. 2018. Predicting survival for metastatic spine disease: a comparison of nine scoring systems. Spine J 18:1804–1814. [DOI] [PubMed] [Google Scholar]
- 95.Paulino Pereira NR, Janssen SJ, van Dijk E, et al. 2016. Development of a Prognostic Survival Algorithm for Patients with Metastatic Spine Disease. J Bone Joint Surg Am 98:1767–1776. [DOI] [PubMed] [Google Scholar]
- 96.Meares C, Badran A, Dewar D. 2019. Prediction of survival after surgical management of femoral metastatic bone disease - A comparison of prognostic models. J Bone Oncol 15:100225. [DOI] [PMC free article] [PubMed] [Google Scholar]
- 97.Forsberg JA, Sjoberg D, Chen QR, et al. 2013. Treating metastatic disease: Which survival model is best suited for the clinic? Clin Orthop Relat Res 471:843–850. [DOI] [PMC free article] [PubMed] [Google Scholar]
- 98.Vickers AJ, Van Calster B, Steyerberg EW. 2016. Net benefit approaches to the evaluation of prediction models, molecular markers, and diagnostic tests. BMJ 352:i6. [DOI] [PMC free article] [PubMed] [Google Scholar]
- 99.Bray F, Jemal A, Grey N, et al. 2012. Global cancer transitions according to the Human Development Index (2008–2030): a population-based study. Lancet Oncol 13:790–801. [DOI] [PubMed] [Google Scholar]
- 100.Michalski AS, Amin S, Cheung AM, et al. 2019. Hip load capacity cut-points for Astronaut Skeletal Health NASA Finite Element Strength Task Group Recommendations. NPJ Microgravity 5:6. [DOI] [PMC free article] [PubMed] [Google Scholar]
- 101.Wang Z, Wen X, Lu Y, et al. 2016. Exploiting machine learning for predicting skeletal-related events in cancer patients with bone metastases. Oncotarget 7:12612–12622. [DOI] [PMC free article] [PubMed] [Google Scholar]
- 102.Oh E, Seo SW, Yoon YC, et al. 2017. Prediction of pathologic femoral fractures in patients with lung cancer using machine learning algorithms: Comparison of computed tomography-based radiological features with clinical features versus without clinical features. J Orthop Surg (Hong Kong) 25:2309499017716243. [DOI] [PubMed] [Google Scholar]