

Abstract
Background
Relatively little is known about the long‐term consequences of venous thromboembolism (VTE) on physical functioning. We compared long‐term frailty status, physical function, and quality of life among survivors of VTE with survivors of coronary heart disease (CHD) and stroke, and with those without these diseases.
Methods and Results
Cases of VTE, CHD, and stroke were continuously identified since ARIC (Atherosclerosis Risk in Communities Study) recruitment during 1987 to 1989. Functional measures were objectively captured at ARIC clinic visits 5 (2011–2013) and 6 (2016–2017); quality of life was self‐reported. The 6161 participants at visit 5 were, on average, 75.7 (range, 66–90) years of age. By visit 5, 3.2% had had a VTE, 6.9% CHD, and 3.4% stroke. Compared with those without any of these conditions, VTE survivors were more likely to be frail (odds ratio [OR], 3.11; 95% CI, 1.80–5.36) and have low (<10) versus good scores on the Short Physical Performance Battery (OR, 3.59; 95% CI, 2.36–5.47). They also had slower gait speed, less endurance, and lower physical quality of life. VTE survivors were similar to coronary heart disease and stroke survivors on categorical frailty and outcomes on Short Physical Performance Battery assessment. When score on the Short Physical Performance Battery instrument was modeled continuously, VTE survivors performed better than stroke survivors but worse than CHD survivors.
Conclusions
VTE survivors had triple the odds of frailty and poorer physical function than those without the vascular diseases considered. Their function was somewhat worse than that of CHD survivors, but better than stroke survivors. These findings suggest that VTE patients may benefit from additional efforts to improve postevent physical functioning.
Keywords: frailty, physical function, quality of life, venous thromboembolism
Subject Categories: Vascular Disease, Quality and Outcomes, Epidemiology
Nonstandard Abbreviations and Acronyms
- ARIC
Atherosclerosis Risk in Communities Study
- CHD
coronary heart disease
- DVT
deep vein thrombosis
- PE
pulmonary embolism
- SF‐36
Medical Outcomes Short Form‐36
- SPPB
Short Physical Performance Battery
- QOL
quality of life
- VTE
venous thromboembolism
Clinical Perspective
What Is New?
Venous thromboembolism (VTE) is often viewed as an acute condition; this study demonstrated that VTE survivors were more likely to be frail and have poor physical function long after their initial VTE event.
Physical function in VTE survivors was somewhat worse when compared with coronary heart disease survivors, but better than that observed in stroke survivors.
What Are the Clinical Implications?
Patients with VTE may represent a group with a high risk of functional decline who warrant screening, and potentially interventions, to preserve physical function.
Venous thromboembolism (VTE), consisting of deep vein thrombosis (DVT) and pulmonary embolism (PE), confers a lifetime risk of 1 in 121 after 45 years of age and affects ≈1 million Americans annually.2 The 30‐day case fatality for VTE is ≈10%, and the 1‐year mortality is about 25%.3 VTE survivors face a number of challenges, as patients must manage anticoagulation regimens,4, 5 and many have complications.
Among DVT patients, 20% to 50% develop postthrombotic syndrome, characterized by leg pain, swelling, edema, and skin discoloration/dryness, and ≈4% have venous stasis ulcers.6, 7, 8 After PE, patients may also have difficulty breathing or decreased cardiopulmonary reserve,9, 10, 11, 12, 13 and ≈4% of PE patients are afflicted by chronic thromboembolic pulmonary hypertension.14, 15 Furthermore, VTE recurrence is common.16, 17, 18 Bleeding is also a major potential complication due to the use of anticoagulant therapy to treat the initial VTE event and prevent recurrence.19, 20
Research on the physical functioning of long‐term VTE survivors is limited and has focused on self‐reported rather than objective measures. In the Nurses’ Health Study, women who survived VTE had a decline in physical function, as assessed by the physical function domain of the Medical Outcomes Study 36‐item Short Form Health Survey (SF‐36), equivalent to a physical decline of 5.4 years of aging. Likewise, Women's Health Initiative participants with prevalent VTE who survived to 80 years of age had lower physical functioning, as assessed by SF‐36 score, than did their counterparts without VTE.21 Small clinical studies, with variable comparison groups, have also reported low quality of life (QOL) for VTE patients.10, 22, 23, 24 Norwegian VTE patients were also more likely than the general working‐age population to be granted permanent work‐related disability.25 In addition, VTE patients with postthrombotic syndrome have less mobility and diminished health‐related QOL compared with VTE patients without postthrombotic syndrome.26, 27 The relatively few studies that did assess objective measures of physical function among VTE survivors were small, not population‐based, and/or without appropriate control groups for comparison.
Using data collected at the ARIC (Atherosclerosis Risk in Communities) study's fifth (2011–2013) clinic examination, we assessed frailty, physical function (using the Short Physical Performance Battery [SPPB] instrument and gait speed), and QOL among VTE survivors. At the sixth (2016–2017) clinic exam, we assessed functional endurance using the 2‐minute walk test. We compared survivors of VTE with: (1) survivors of coronary heart disease (CHD); (2) survivors of stroke; and (3) those without VTE, CHD, or stroke. CHD and stroke were selected as a comparators because, similar to VTE, both are acute, severe vascular events and are associated with postevent functional deficits. The ARIC Study has previously demonstrated that self‐reported functional status post‐CHD declined relative to pre‐event levels, but improved to close to pre‐CHD levels within 3 years, whereas declines in poststroke functional status remained over time.28 We hypothesized that VTE survivors would be more frail and have lower physical function and QOL than those who were CHD survivors or remained free of these vascular conditions, but that functional measures would be better for VTE survivors than for stroke survivors.
Methods
Data from the ARIC study can be accessed, with appropriate approval, through the National Heart, Lung, and Blood Institute's BioLINCC repository (https://biolincc.nhlbi.nih.gov/home/) or by contacting the ARIC Coordinating Center (http://www2.cscc.unc.edu/aric/distribution-agreements).
During the period from 1987 to 1989, the ARIC study recruited a total of 15 792 men and women from 4 US communities (ie, suburbs of Minneapolis, Minnesota; Jackson, Mississippi; Forsyth County, North Carolina; and Washington County, Maryland) into a population‐based prospective cohort.29 Participants were 45 to 64 years of age at the time of the initial clinic visit and included both blacks and whites. We followed these individuals continuously for hospitalizations and deaths, and also conducted numerous follow‐up clinical visits. Local institutional review boards approved the protocol, and all participants gave written informed consent.
Relevant to this analysis, 6538 participants attended the fifth clinic visit, which took place between 2011 and 2013. Table S1 shows participants’ characteristics, stratified by disease state, according to visit 5 attendance and vital status. We excluded participants who self‐reported their race as other than black or white (n=18); blacks from Maryland and Minnesota (n=25); those self‐reporting prevalent VTE at visit 1 but who had no incident VTE event during follow‐up (n=92); those who had an incident non‐leg DVT only (n=11); those self‐reporting prevalent CHD at visit 1 but no incident CHD event (n=71); those self‐reporting prevalent stroke at visit 1 but no incident stroke event (n=34); and those who were missing information on key covariates (n=126). The final visit 5 analytic sample included 6161 participants.
The sixth ARIC Study clinic visit (2016–2017) was attended by 4003 participants. After applying the same exclusions as described for visit 5 to the visit 6 sample, the final visit 6 analytic sample included 3756 participants.
Ascertainment of Previous VTE, CHD, and Stroke
We followed participants for hospitalizations and deaths through telephone calls (annually before 2012; twice yearly since that time) to participants or proxies and active surveillance of local hospital discharge indices. Trained abstractors collected information from all hospitalizations, including International Classification of Diseases—Ninth Revision, Clinical Modification (ICD‐9) codes for discharge diagnoses and procedures associated with each hospitalization. We identified potential VTE, CHD, and stroke events from hospital records with ICD codes indicating possible events. For all 3 event types, records of potential cases were then abstracted, and independently reviewed by physicians. DVT was defined on the basis of duplex ultrasound or venogram or, in rare cases, by impedance plethysmography, computed tomography, or autopsy.30 Definite PE required presence in the medical record of evidence of ventilation/perfusion scanning showing multiple segmental or subsegmental mismatched perfusion defects, or a positive pulmonary angiogram or computed tomography.30 For the present analyses, DVTs occurring outside the legs (in the absence of PE) were not classified as VTE cases. Events were further classified as unprovoked or provoked (occurring within 90 days of major trauma, surgery, hospitalization, or marked immobility, or associated with active cancer or chemotherapy).
Incident CHD was defined by definite or probable CHD, coronary angioplasty, or coronary artery bypass surgery, according to previously described procedures.31 Definite/probable hospitalized strokes were classified by a combination of computer algorithm and physician review, using standardized criteria.32
Indicators of QOL and Physical Functioning
At ARIC Study visit 5, trained and certified staff conducted standardized measurements of the following:
QOL: The QOL was assessed using a modified version of the 12‐item Short Form Health Survey version 2. We analyzed the physical and mental components separately, with the scale modeled continuously.
Frailty: Frailty was operationalized using Cardiovascular Health Study criteria, as implemented previously in the ARIC study.33 Briefly, this definition incorporates measures of weight loss, exhaustion, slow walking speed (based on gait speed >4 meters), low physical activity, and low grip strength. For analyses, the scale was modeled both continuously and categorically (as frail, pre‐frail, or not frail).
SPPB 34, 35: The SPPB instrument is composed of 3 standardized tests, namely balance (standing, semitandem, or tandem stands held for up to 10 s each), usual gait speed, and time to rise from a seated position 5 times without using the arms. Each task was scored from 0 (worse) to 4 (best) based on population norms and summed to create a composite score ranging from 0 to 12; participants who were unable to perform a task received a score of 0. For analyses, the SPPB score was modeled, both continuously and categorically, as low (0–6), fair (7–9), and good (10–12, reference).
Gait speed (mobility): Participants were timed walking 4 meters at their usual speed, and the faster of the 2 trials was recorded for analysis. Participants were encouraged not to use walking aids, but aids were allowed per participants’ discretion. Although gait speed is a component of the SPPB and frailty, it was included as a separate continuous outcome because it may be substantially impacted by VTE.
Endurance assessment at ARIC visit 6 was as follows:
Two‐minute walk: The 2‐minute walk protocol, validated and described in the National Institutes of Health toolkit, was offered to all participants who completed the 4‐meter walk test without a walking aid. The 2‐minute walk is a measure of functional endurance and may also be a more sensitive measure than gait speed or SPPB, such as among high‐functioning adults.
Covariates
Covariate information was collected by trained and certified staff using standardized protocols at visit 5 (or visit 6 for the endurance analyses), with the exception of established demographic information collected at visit 1. Smoking status was assessed by questionnaire. Height and weight were measured using standard methods, and body mass index was calculated as weight per height squared (kg/m2). Medications taken in the previous 4 weeks were brought to the clinic visit, and coded. Systolic and diastolic blood pressure levels were measured in triplicate after a 5‐minute rest; the mean of the 2 most recent measurements was used for analysis. Diabetes mellitus was defined by fasting glucose ≥126 mg/dL, nonfasting glucose ≥200 mg/dL, a self‐report of physician diagnosis, or current medication use for diabetes mellitus. Chronic obstructive pulmonary disease was determined through a self‐reported physician diagnosis of chronic bronchitis or emphysema. Prevalent heart failure was adjudicated according to standard ARIC procedures.36 Peripheral artery disease was ascertained from an ankle/brachial index <0.9 at ARIC visits 3 or 4, or by identification of hospital discharge diagnoses for peripheral artery disease during follow up.
Statistical Analysis
Visit 5 data were used cross‐sectionally for the primary analysis. Descriptive characteristics are provided according to 4 categories: VTE survivors; CHD survivors; stroke survivors; and none of these (ie, no previous VTE, CHD, or stroke). The VTE, CHD, and stroke categories are not mutually exclusive in Table 1. However, for analyses comparing VTE survivors with CHD or stroke surviors (all subsequent tables), individuals with both conditions were excluded.
Table 1.
Visit 5 Characteristics by Prevalent Disease Status (VTE, CHD, Stroke, or No Events) in the ARIC Study, 2011–2013
| Prevalent VTEa | Prevalent CHDa | Prevalent Strokea | No Prevalent Events | |
|---|---|---|---|---|
| n | 195 | 425 | 208 | 5409 |
| Age, y | 76.6 (5.2) | 77.2 (5.4) | 77.2 (5.7) | 75.5 (5.2) |
| Sex, % | ||||
| Female | 59.5 | 39.1 | 49.0 | 60.5 |
| Male | 40.5 | 60.9 | 51.0 | 39.5 |
| Race, % | ||||
| White | 68.7 | 77.6 | 66.3 | 77.5 |
| Black | 31.3 | 22.4 | 33.7 | 22.5 |
| Body mass index, kg/m2 | 29.7 (7.5) | 27.7 (6.3) | 27.8 (6.3) | 28.3 (6.2) |
| Smoking status, % | ||||
| Current | 2.0 | 8.2 | 5.8 | 5.5 |
| Former | 43.6 | 51.8 | 50.0 | 45.3 |
| Never | 39.5 | 24.2 | 25.5 | 38.3 |
| Unknown | 14.9 | 15.8 | 18.8 | 10.9 |
| Diabetes mellitus, % | 42.6 | 42.8 | 45.2 | 30.5 |
| Hypertension medication, % | 84.6 | 95.8 | 88.5 | 73.0 |
| Prevalent COPD, % | 15.4 | 13.9 | 8.7 | 9.1 |
| Prevalent heart failure, % | 22.6 | 49.7 | 30.3 | 9.5 |
| Prevalent peripheral artery disease, % | 13.3 | 18.4 | 17.8 | 7.5 |
| Systolic blood pressure, mm Hg | 129.5 (17.6) | 129.9 (19.7) | 135.3 (21.6) | 130.5 (18.2) |
| Quality of lifeb | ||||
| Mental score | 55.0 (8.6) | 55.4 (8.2) | 55.4 (9.0) | 55.3 (7.6) |
| Physical score | 40.9 (11.7) | 42.6 (11.4) | 40.7 (10.8) | 46.7 (10.0) |
| Frailty, %b | ||||
| Frail | 12.8 | 9.4 | 12.0 | 5.3 |
| Pre‐frail | 49.7 | 46.8 | 46.6 | 42.6 |
| Not frail | 23.1 | 29.9 | 22.6 | 43.6 |
| SPPB scoreb | 7.5 (3.3) | 8.6 (2.9) | 7.3 (3.4) | 9.4 (2.4) |
| Low (0–6) | 31.8 | 19.3 | 33.7 | 11.3 |
| Fair (7–9) | 25.6 | 28.0 | 25.0 | 27.6 |
| Good (10–12) | 31.3 | 40.2 | 26.4 | 54.0 |
| Gait speed—4‐m walk, m/sc | 0.84 (0.2) | 0.88 (0.2) | 0.80 (0.2) | 0.95 (0.2) |
| Gait speed—4‐m walk (SPPB score 0–4)c | 3.1 (1.0) | 3.4 (0.9) | 3.0 (1.1) | 3.6 (0.7) |
| 0 | 3.1 | 1.2 | 2.9 | 0.1 |
| 1 | 3.1 | 2.8 | 8.2 | 1.7 |
| 2 | 15.4 | 9.7 | 13.9 | 6.2 |
| 3 | 25.1 | 21.4 | 23.1 | 19.2 |
| 4 | 41.5 | 52.2 | 37.0 | 65.0 |
Data are presented as percent for categorical variables and as mean (standard deviation) for continuous variables. ARIC indicates Atherosclerosis Risk in Communities; CHD, coronary heart disease; COPD, chronic obstructive pulmonary disease; SPPB, Short Physical Performance Battery; and VTE, venous thromboembolism.
Prevalent VTE, CHD, and stroke events are not mutually exclusive.
Higher scores indicate better quality of life.
Sample size modestly smaller due to additional missing data.
SAS version 9.4 (SAS Institute, Cary, NC) was used for all data analyses. For the primary analysis involving visit 5, comparisons were made between VTE survivors and: (1) survivors of CHD; (2) survivors of stroke; and (3) individuals with no previous VTE, CHD, or stroke. The outcomes include both categorical and continuous variables. Linear regression was used for the continuous outcomes. For multilevel categorical outcomes (ie, frailty or SPPB score), we conducted analyses using polytomous (multinomial) regression with a generalized logit function (glogit link in SAS). For all analyses, model 1 adjusted for age at visit 5, sex, race and site (a 5‐level variable: MN whites, MD whites, MS blacks, NC whites, and NC blacks), and body mass index. Model 2 additionally adjusted for smoking status and comorbidities (diabetes mellitus, systolic blood pressure, hypertension medications, chronic obstructive pulmonary disease, heart failure, and peripheral artery disease). Sensitivity analyses were conducted: (1) restricting to unprovoked VTE as the exposure, as it is likely less confounded by disease status than provoked VTE; (2) evaluating prevalent PE and DVT separately; and (3) removing disease events in the 2 years before visit 5 to isolate the long‐term impact of the conditions on physical function.
Visit 6 analyses of the 2‐minute walk test were conducted cross‐sectionally, in a similar manner to the visit 5 analyses. Prevalent VTE, CHD, and stroke status, and all covariates except for chronic obstructive pulmonary disease (which was only assessed at visit 5) were obained at the time of visit 6.
Results
The 6161 participants in our analytic visit 5 sample were, on average, 75.7±5.2 years of age, 58.8% female, and 23.0% black. Among these, 195 (3.2%) were VTE survivors, 425 (6.9%) CHD survivors, and 208 (3.4%) stroke survivors. On average (mean±standard deviation), VTE events occurred 7.5±6.0 years before the visit 5 clinic examination, CHD events 9.1±6.1 years before the visit, and stroke events 7.9±5.9 years before the visit (for individuals with recurrence, the date of the most recent event was used). A total of 24 individuals had both VTE and CHD, and 16 had both VTE and stroke. Table 1 presents the visit 5 participants’ characteristics—including indices of frailty, physical function, and QOL—according to prevalence of VTE, CHD, stroke, or the comparison group with none of these diseases. As compared with those having no prevalent disease, VTE survivors tended to be black, have higher body mass index, and have more comorbidities. In these unadjusted analyses, VTE survivors also had greater frailty (12.8% vs 5.3%), higher prevalence of low SPPB (31.8% vs 11.3%), and slower gait speed (0.84 m/s vs 0.95 m/s) when compared with those having no prevalent disease.
The crude findings persisted when adjusted for demographics (model 1) and also for behaviors and comorbidities (model 2) (Table 2 Figure 1, and Table S2). Participants with prevalent VTE had slower gait speed and lower scores on the SPPB and QOL physical domain when compared with participants with no prevalent disease. Compared with participants having prevalent CHD, those with prevalent VTE performed more poorly on the SPPB, and in model 2 had slower gait speed. However, compared with participants having prevalent stroke, those with prevalent VTE performed better on the SPPB and had faster gait speed. There was no difference in QOL mental domain across any of the comparisons.
Table 2.
Linear Regression of Prevalent VTE With Physical Function and Quality of Life Outcomes in the ARIC Study, 2011–2013 and 2016–2017
| Prevalent VTE vs No Prevalent Events | Prevalent VTE vs Prevalent CHDa | Prevalent VTE vs Prevalent Strokea | ||||||||
|---|---|---|---|---|---|---|---|---|---|---|
| n | Coefficient (95% CI) | P Value | n | Coefficient (95% CI) | P Value | n | Coefficient (95% CI) | P Value | ||
| Quality of life—mental score | ||||||||||
| Model 1 | Prevalent VTE | 190 | −0.12 (−1.21 to 0.97) | 0.83 | 166 | −0.24 (−1.84 to 1.37) | 0.77 | 175 | −0.23 (−2.11 to 1.64) | 0.81 |
| Comparison | 5295 | (Reference) | 384 | (Reference) | 180 | (Reference) | ||||
| Model 2 | Prevalent VTE | 190 | 0.21 (−0.88 to 1.30) | 0.70 | 166 | 0.38 (−1.38 to 2.15) | 0.67 | 175 | 0.19 (−1.77 to 2.14) | 0.85 |
| Comparison | 5295 | (Reference) | 384 | (Reference) | 180 | (Reference) | ||||
| Quality of life—physical score | ||||||||||
| Model 1 | Prevalent VTE | 190 | −4.57 (−5.95 to −3.19) | <0.0001 | 166 | −0.27 (−2.40 to 1.87) | 0.81 | 175 | 1.11 (−1.21 to 3.42) | 0.35 |
| Comparison | 5295 | (Reference) | 384 | (Reference) | 180 | (Reference) | ||||
| Model 2 | Prevalent VTE | 190 | −3.25 (−4.57 to −1.93) | <0.0001 | 166 | −1.75 (−3.91 to 0.40) | 0.11 | 175 | 0.57 (−1.74 to 2.87) | 0.63 |
| Comparison | 5295 | (Reference) | 384 | (Reference) | 180 | (Reference) | ||||
| Gait speed—4‐m walk, m/s | ||||||||||
| Model 1 | Prevalent VTE | 166 | −0.07 (−0.10 to −0.04) | <0.0001 | 147 | −0.0001 (−0.04 to 0.04) | 0.99 | 154 | 0.06 (0.02 to 0.11) | 0.01 |
| Comparison | 4981 | (Reference) | 347 | (Reference) | 159 | (Reference) | ||||
| Model 2 | Prevalent VTE | 166 | −0.06 (−0.09 to −0.03) | <0.0001 | 147 | −0.02 (−0.06 to 0.03) | 0.41 | 154 | 0.06 (0.01 to 0.11) | 0.01 |
| Comparison | 4981 | (Reference) | 347 | (Reference) | 159 | (Reference) | ||||
| Endurance, feetb | ||||||||||
| Model 1 | Prevalent VTE | 86 | −19.21 (−35.98 to −2.44) | 0.02 | 78 | 16.12 (−7.55 to 39.78) | 0.18 | 82 | 36.59 (11.03 to 62.14) | 0.01 |
| Comparison | 2528 | (Reference) | 172 | (Reference) | 85 | (Reference) | ||||
| Model 2 | Prevalent VTE | 86 | −15.00 (−31.39 to 1.38) | 0.07 | 78 | 15.46 (−10.02 to 40.94) | 0.23 | 82 | 29.41 (2.51 to 56.32) | 0.03 |
| Comparison | 2528 | (Reference) | 172 | (Reference) | 85 | (Reference) | ||||
Model 1: Linear regression adjusted for age, race/center, sex, and body mass index. Model 2: model 1 plus additional adjustment for chronic obstructive pulmonary disease, diabetes mellitus, hypertensive medication, smoking status, systolic blood pressure, prevalent heart failure, and prevalent peripheral artery disease. Linear regression coefficient represents the difference between prevalent venous thromboembolism and the comparison group of each physical function and quality‐of‐life outcome. ARIC indicates Atherosclerosis Risk in Communities; CHD, coronary heart disease; and VTE, venous thromboembolism.
Prevalent VTE, CHD, and stroke events are mutually exclusive.
Data from visit 6. The linear regression models include the same covariates from visit 6, except for chronic obstructive pulmonary disease, which is from visit 5.
Figure 1. Linear regression of prevalent VTE events with gait speed and endurance in the Atherosclerosis Risk in Communities Study, 2011–2013 and 2016–2017.
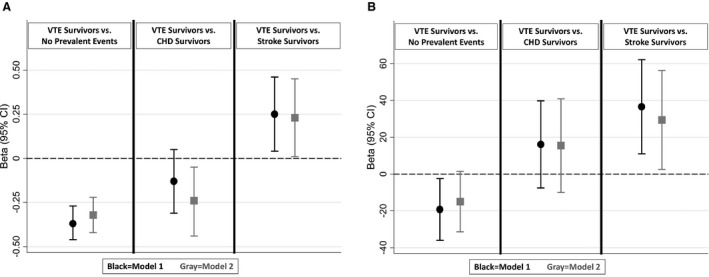
A, Gait speed—4‐m walk (in meters per second). B, Endurance (in feet). CHD indicates coronary heart disease; and VTE, venous thromboembolism.
Participants with prevalent VTE had higher odds of frailty compared with participants without prevalent disease after accounting for demographics (odds ratio for model 1 [ORmodel 1], 3.81; 95% CI, 2.25–6.45) and when additionally adjusting for behaviors and comorbidities (ORmodel 2, 3.11; 95% CI, 1.80–5.36) (Table 3 and Figure 2). Odds of frailty were not statistically different when comparing participants with prevalent VTE versus those with prevalent CHD (ORmodel 1, 1.28; 95% CI, 0.63–2.61) or prevalent stroke (ORmodel 1, 0.68; 95% CI, 0.30–1.54). The OR for low SPPB among participants with prevalent VTE versus no prevalent disease was 4.18 (95% CI, 2.77–6.30) in model 1 and 3.59 (95% CI, 2.36–5.47) in model 2. ORs of low SPPB comparing prevalent VTE with prevalent CHD or stroke, after model 1 adjustments, were 1.52 (95% CI, 0.90–2.59) and 0.55 (95% CI, 0.30–1.01), respectively.
Table 3.
Polytomous Logistic Regression of Prevalent VTE With Physical Function and Quality‐of‐Life Outcomes in the ARIC Study, 2011–2013
| Prevalent VTE vs No Prevalent Events | Prevalent VTE vs Prevalent CHDa | Prevalent VTE vs Prevalent Strokea | |||||||||||
|---|---|---|---|---|---|---|---|---|---|---|---|---|---|
| N | VTE, n | OR (95% CI) | P Value | n | VTE, n | OR (95% CI) | P Value | n | VTE, n | OR (95% CI) | P Value | ||
| Frailty | |||||||||||||
| Model 1 | Frail | 310 | 25 | 3.81 (2.25–6.45) | <0.0001 | 59 | 22 | 1.28 (0.63–2.61) | 0.50 | 40 | 20 | 0.68 (0.30–1.54) | 0.35 |
| Pre‐frail | 2400 | 97 | 1.99 (1.38–2.87) | 0.0003 | 274 | 86 | 1.24 (0.77–1.99) | 0.38 | 180 | 90 | 0.91 (0.53–1.57) | 0.74 | |
| Not frail | 2403 | 45 | 1 (Reference) | 162 | 40 | 1 (Reference) | 90 | 44 | 1 (Reference) | ||||
| Model 2 | Frail | 310 | 25 | 3.11 (1.80–5.36) | <0.0001 | 59 | 22 | ···b | 40 | 20 | ···b | ||
| Pre‐frail | 2400 | 97 | 1.90 (1.31–2.75) | 0.001 | 274 | 86 | ···b | 180 | 90 | ···b | |||
| Not frail | 2403 | 45 | 1 (Reference) | 162 | 40 | 1 (Reference) | 90 | 44 | 1 (Reference) | ||||
| SPPB groups | |||||||||||||
| Model 1 | Low (0–6) | 671 | 62 | 4.18 (2.77–6.30) | <0.0001 | 132 | 56 | 1.52 (0.90–2.59) | 0.12 | 110 | 51 | 0.55 (0.30–1.01) | 0.05 |
| Fair (7–9) | 1541 | 50 | 1.49 (1.01–2.21) | 0.05 | 157 | 44 | 0.97 (0.59–1.60) | 0.90 | 100 | 49 | 0.78 (0.44–1.38) | 0.39 | |
| Good (10–12) | 2979 | 61 | 1 (Reference) | 218 | 54 | 1 (Reference) | 110 | 58 | 1 (Reference) | ||||
| Model 2 | Low (0–6) | 671 | 62 | 3.59 (2.36–5.47) | <0.0001 | 132 | 56 | 2.04 (1.11–3.77) | 0.02 | 110 | 51 | ···b | |
| Fair (7–9) | 1541 | 50 | 1.39 (0.94–2.07) | 0.10 | 157 | 44 | 1.33 (0.76–2.32) | 0.33 | 100 | 49 | ···b | ||
| Good (10–12) | 2979 | 61 | 1 (Reference) | 218 | 54 | 1 (Reference) | 110 | 58 | 1 (Reference) | ||||
Model 1: Polytomous logistic regression adjusted for age, race/center, sex, and body mass index. Model 2: Model 1 plus additional adjustment for chronic obstructive pulmonary disease, diabetes mellitus, hypertensive medication, smoking status, systolic blood pressure, prevalent heart failure at visit 5, and prevalent peripheral artery disease at visit 5. The odds ratios compare those with prevalent VTE versus the comparison group within each physical function and quality‐of‐life outcome group. ARIC indicates Atherosclerosis Risk in Communities; OR, odds ratio; SPPB, Short Physical Performance Battery; and VTE, venous thromboembolism.
Prevalent VTE, coronary heart disease, and stroke events are mutually exclusive.
Model failed to converge due to the small sample size and some covariates lacking individuals within their categories.
Figure 2. Polytomous logistic regression of prevalent VTE with Short Physical Performance Battery score and frailty in the Atherosclerosis Risk in Communities Study, 2011–2013.
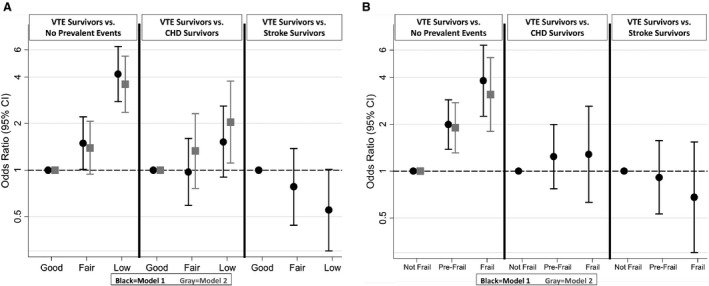
A, SPPB score. B, Frailty. CHD indicates coronary heart disease; and VTE, venous thromboembolism.
Results are similar in analyses restricted to unprovoked VTE (Tables S3 and S4). Likewise, results are generally similar when we looked separately at prevalent PE (Tables S5 and S6) and DVT (Tables S7 and S8), and when we removed events that occurred within 2 years of the visit 5 date (Tables S9 and S10).
Among the 3756 participants in our visit 6 analytic sample (average age, 79.5±4.7 years; 59.0% female; and 23.5% black [Table S11]), 148 (3.9%) were VTE survivors, 271 (7.2%) CHD survivors, and 160 (4.3%) stroke survivors. As shown in the lower portion of Table 2, VTE survivors had poorer endurance than those with no prevalent disease, similar endurance to CHD survivors, but better endurance than stroke survivors.
Discussion
In this community‐based sample of older adults, VTE survivors were 3 times more likely to be frail and have poorer physical functioning than those without a history of VTE, CHD, or stroke. There is some evidence that VTE survivors had more long‐term physical problems than CHD survivors, but fewer than stroke survivors. Specifically, VTE survivors performed more poorly than CHD survivors on the SPPB and had slower gait speed. These findings enhance understanding of the long‐term functioning of VTE patients. VTE is typically viewed as an acute condition, but the pervasiveness of physical limitations observed in our data highlight the need for continued monitoring, and suggest that interventions to improve physical functioning after a VTE event may be useful. Furthermore, directly comparing adults with a diagnosis of VTE to CHD and stroke survivors provides clinical context on the importance of these long‐term limitations. Overall, the prevalence of frailty was 12.8% among VTE survivors, 9.4% among CHD survivors, 12.0% among stroke survivors, and 5.3% in those with no prevalent events.
Our study has provided new information about long‐term function after a VTE diagnosis, as few studies have approached this issue using objective measures. The Evaluation of Long‐Term Outcomes After Pulmonary Embolism cohort study reported that, among 100 PE patients who were assessed at the time of diagnosis, and 1, 3, 6, and 12 months post‐PE, average QOL, dyspnea, and walking distance improved during the year after PE.37 A study from Australia also reported that 120 long‐term survivors of PE (time since index PE ≥4 years, and, on average, 7.7 years) demonstrated poor exercise capacity, heart rate recovery, and mild pulmonary hypertension.38 Both of the aforementioned studies are limited in that they did not include a non‐PE comparison group.
Our finding that VTE was associated with poorer self‐reported physical QOL is consistent with previous literature. A Nurses’ Health Study analysis reported a greater decline in physical functioning—as assessed by the physical domain of the SF‐36—among women with VTE as compared with those without a greater decline.39 The decline was steep soon after VTE; in later time periods, physical function remained lower, but the rate of decline returned to the expected rate of decline associated with aging.39 Likewise, physical function, as assessed by the SF‐36 physical function score, was also lower among Women's Health Initiative participants with prevalent VTE who survived to 80 years of age than it was among their counterparts without VTE.21 There is some evidence that the lower physical function was more pronounced among PE survivors than those without PE, and when the SF‐36 items were evaluated individually, the most common limitations were with vigorous activities, climbing several flights of stairs, walking more than 1 mile, and kneeling/bending. In the present analysis, frailty and physical function tended to be similar between DVT and PE survivors, relative to those with no prevalent disease.
Evidence that early intervention may improve physical functioning and QOL among VTE survivors is scant but suggestive. A small trial of 19 VTE patients, randomized to either a 3‐month exercise and weight loss intervention or a control group with neither, showed that those in the intervention group were more active, had greater weight loss, and had higher objectively measured fitness (VO2peak).40 Observational studies of inpatient rehabilitation after PE suggest that in‐hospital rehabilitation is safe,41, 42 but whether this translates to long‐term improvements in physical function and QOL remains uncertain. Comprehensive cardiac rehabilitation, incorporating numerous secondary prevention strategies (eg, nutritional, lifestyle, psychosocial, and smoking counseling; risk factor management; and education about medications and compliance) is a mainstay management strategy after myocardial infarction.43, 44 Among cardiac rehabilitation patients presenting with low SPPB scores, cardiac rehabilitation was found to be associated with significant improvements in physical function.45 Comprehensive guidelines also exist for stroke rehabilitation and recovery.46 It is unclear whether VTE patients would benefit from standardized rehabilitation. The extent of long‐term physical function deficits observed among VTE survivors in the present analysis indicates potential targets for intervention studies that can maximize QOL and healthy aging among VTE patients.
The strengths of this study are its: (1) community‐based sample, including men and women and blacks and whites; (2) adjudication of incident VTE, CHD, and stroke events; and (3) perhaps most importantly, objective and standardized measurements of physical function. The fact that the length of time varied between the clinical events and the visit 5 assessments may also be considered a strength of the study, as it makes our findings more generalizable to the patients a clinician may see in a general practice setting. Yet, in recent decades there is evidence that smaller, PEs47 and possibly DVTs are being detected. Thus, ARIC VTE survivors may have more functional limitations than contemporary VTE survivors.
Selection bias is a possible drawback of this study, because frail participants were probably less likely to have attended the clinic visit than those with better function. Likewise, survivors of VTE, CHD, or stroke whose initial events were severe may be less likely to participate in clinic visits. As with all observational studies, it is possible that uncontrolled confounding may underlie our findings. For this specific analysis, factors that provoke VTE are strong candidates for confounding. However, results are similar in the sensitivity analyses restricted to individuals with unprovoked VTE. Finally, given the cross‐sectional design and lack of functional assessments before visit 5, we cannot rule out reverse causality—that is, that lower functional status throughout adulthood led to increased risk of VTE, rather than vice versa.
Maintenance of physical function—the ability to perform basic and instrumental activities of daily living48—is an essential component of healthy aging, QOL, and preserving independence. Patients with VTE may represent a group with high risk of functional decline who warrant screening and, potentially, interventions to preserve physical function.
Sources of Funding
The Atherosclerosis Risk in Communities Study is carried out as a collaborative study supported by the National Heart, Lung, and Blood Institute (award nos. HHSN268201700001I, HHSN268201700002I, HHSN268201700003I, HHSN268201700005I, HHSN268201700004I). VTE work is supported by NHLBI R01 HL59367. Neurocognitive data and physical function data were collected through grants from the National Institutes for Health (NHLBI, NINDS, NIA, and NIDCD) (award nos. U01 2U01HL096812, 2U01HL096814, 2U01HL096899, 2U01HL096902, 2U01HL096917).
Disclosures
None.
Supporting information
Tables S1–S11
Acknowledgments
The authors thank the staff and participants in the Atherosclerosis Risk in Communities Study for their valuable contributions.
(J Am Heart Assoc. 2020;9:e015656 DOI: 10.1161/JAHA.119.015656.)
For Sources of Funding and Disclosures, see page 9.
References
- 1. Bell EJ, Lutsey PL, Basu S, Cushman M, Heckbert SR, Lloyd‐Jones DM, Folsom AR. Lifetime risk of venous thromboembolism in two cohort studies. Am J Med. 2016;339.e19–26. [DOI] [PMC free article] [PubMed] [Google Scholar]
- 2. Benjamin EJ, Muntner P, Alonso A, Bittencourt MS, Callaway CW, Carson AP, Chamberlain AM, Chang AR, Cheng S, Das SR, et al. Heart disease and stroke statistics 2019 update: a report from the American Heart Association. Circulation. 2019;e56–e528. [DOI] [PubMed] [Google Scholar]
- 3. Tagalakis V, Patenaude V, Kahn SR, Suissa S. Incidence of and mortality from venous thromboembolism in a real‐world population: the Q‐VTE Study Cohort. Am J Med. 2013;832.e13–832.e21. [DOI] [PubMed] [Google Scholar]
- 4. Lutsey PL, Horvath KJ, Fullam L, Moll S, Rooney MR, Cushman M, Zakai NA. Anticoagulant preferences and concerns among venous thromboembolism patients. Thromb Haemost. 2018;553–561. [DOI] [PMC free article] [PubMed] [Google Scholar]
- 5. Gaertner S, Cordeanu EM, Nouri S, Faller AM, Frantz AS, Mirea C, Bilbault P, Ohlmann P, Le Ray I, Stephan D. Rivaroxaban versus standard anticoagulation for symptomatic venous thromboembolism (REMOTEV observational study): analysis of 6‐month outcomes. Int J Cardiol. 2017;103–109. [DOI] [PubMed] [Google Scholar]
- 6. Moustafa A, Alim HM, Chowdhury MA, Eltahawy EA. Postthrombotic syndrome: long‐term sequela of deep venous thrombosis. Am J Med Sci. 2018;152–158. [DOI] [PubMed] [Google Scholar]
- 7. Kahn SR, Comerota AJ, Cushman M, Evans NS, Ginsberg JS, Goldenberg NA, Gupta DK, Prandoni P, Vedantham S, Walsh ME, et al. The postthrombotic syndrome: evidence‐based prevention, diagnosis, and treatment strategies: a scientific statement from the American Heart Association. Circulation. 2014;1636–1661. [DOI] [PubMed] [Google Scholar]
- 8. Mohr DN, Silverstein MD, Heit JA, Petterson TM, O'Fallon WM, Melton LJ. The venous stasis syndrome after deep venous thrombosis or pulmonary embolism: a population‐based study. Mayo Clin Proc. 2000;1249–1256. [DOI] [PubMed] [Google Scholar]
- 9. Klok FA, van der Hulle T, den Exter PL, Lankeit M, Huisman MV, Konstantinides S. The post‐PE syndrome: a new concept for chronic complications of pulmonary embolism. Blood Rev. 2014;221–226. [DOI] [PubMed] [Google Scholar]
- 10. Klok FA, van Kralingen KW, van Dijk APJ, Heyning FH, Vliegen HW, Kaptein AA, Huisman MV. Quality of life in long‐term survivors of acute pulmonary embolism. Chest. 2010;1432–1440. [DOI] [PubMed] [Google Scholar]
- 11. Kahn SR, Akaberi A, Granton JT, Anderson DR, Wells PS, Rodger MA, Solymoss S, Kovacs MJ, Rudski L, Shimony A, et al. Quality of life, dyspnea, and functional exercise capacity following a first episode of pulmonary embolism: results of the ELOPE cohort study. Am J Med. 2017;990.e9–990.e21. [DOI] [PubMed] [Google Scholar]
- 12. Kahn SR, Hirsch AM, Akaberi A, Hernandez P, Anderson DR, Wells PS, Rodger MA, Solymoss S, Kovacs MJ, Rudski L, et al. Functional and exercise limitations after a first episode of pulmonary embolism. Chest. 2017;1058–1068. [DOI] [PubMed] [Google Scholar]
- 13. Sista AK, Miller LE, Kahn SR, Kline JA. Persistent right ventricular dysfunction, functional capacity limitation, exercise intolerance, and quality of life impairment following pulmonary embolism: systematic review with meta‐analysis. Vasc Med. 2017;37–43. [DOI] [PubMed] [Google Scholar]
- 14. Pengo V, Lensing AW, Prins MH, Marchiori A, Davidson BL, Tiozzo F, Albanese P, Biasiolo A, Pegoraro C, Iliceto S, et al. Incidence of chronic thromboembolic pulmonary hypertension after pulmonary embolism. N Engl J Med. 2004;2257–2264. [DOI] [PubMed] [Google Scholar]
- 15. Guérin L, Couturaud F, Parent F, Revel M‐P, Gillaizeau F, Planquette B, Pontal D, Guégan M, Simonneau G, Meyer G, et al. Prevalence of chronic thromboembolic pulmonary hypertension after acute pulmonary embolism. Thromb Haemost. 2014;598–605. [DOI] [PubMed] [Google Scholar]
- 16. Heit JA. The epidemiology of venous thromboembolism in the community. Arterioscler Thromb Vasc Biol. 2008;370. [DOI] [PMC free article] [PubMed] [Google Scholar]
- 17. Prandoni P, Noventa F, Ghirarduzzi A, Pengo V, Bernardi E, Pesavento R, Iotti M, Tormene D, Simioni P, Pagnan A. The risk of recurrent venous thromboembolism after discontinuing anticoagulation in patients with acute proximal deep vein thrombosis or pulmonary embolism. A prospective cohort study in 1,626 patients. Haematologica. 2007;199–205. [DOI] [PubMed] [Google Scholar]
- 18. Lutsey PL, Virnig BA, Durham SB, Steffen LM, Hirsch AT, Jacobs DR Jr, Folsom AR. Correlates and consequences of venous thromboembolism: the Iowa Women's Health Study. Am J Public Health. 2010;1506–1513. [DOI] [PMC free article] [PubMed] [Google Scholar]
- 19. Kearon C, Akl EA, Ornelas J, Blaivas A, Jimenez D, Bounameaux H, Huisman M, King CS, Morris TA, Sood N, et al. Antithrombotic therapy for VTE disease: CHEST guideline and expert panel report. Chest. 2016;315–352. [DOI] [PubMed] [Google Scholar]
- 20. van der Hulle T, Kooiman J, den Exter PL, Dekkers OM, Klok FA, Huisman MV. Effectiveness and safety of novel oral anticoagulants as compared with vitamin K antagonists in the treatment of acute symptomatic venous thromboembolism: a systematic review and meta‐analysis. J Thromb Haemost. 2014;320–328. [DOI] [PubMed] [Google Scholar]
- 21. Stefanick ML, Brunner RL, Leng X, Limacher MC, Bird CE, Garcia DO, Hogan PE, LaMonte MJ, Mackey RH, Johnson KC, et al. The relationship of cardiovascular disease to physical functioning in women surviving to age 80 and above in the Women's Health Initiative. J Gerontol A Biol Sci Med Sci. 2016;S42–S53. [DOI] [PMC free article] [PubMed] [Google Scholar]
- 22. Tavoly M, Utne KK, Jelsness‐Jørgensen L‐P, Wik HS, Klok FA, Sandset PM, Ghanima W. Health‐related quality of life after pulmonary embolism: a cross‐sectional study. BMJ Open. 2016;e013086. [DOI] [PMC free article] [PubMed] [Google Scholar]
- 23. van Es J, den Exter PL, Kaptein AA, Andela CD, Erkens PMG, Klok FA, Douma RA, Mos ICM, Cohn DM, Kamphuisen PW, et al. Quality of life after pulmonary embolism as assessed with SF‐36 and PEmb‐QoL. Thromb Res. 2013;500–505. [DOI] [PubMed] [Google Scholar]
- 24. van Korlaar IM, Vossen CY, Rosendaal FR, Bovill EG, Cushman M, Naud S, Kaptein AA. The impact of venous thrombosis on quality of life. Thromb Res. 2004;11–18. [DOI] [PubMed] [Google Scholar]
- 25. Braekkan SK, Grosse SD, Okoroh EM, Tsai J, Cannegieter SC, Naess IA, Krokstad S, Hansen JB, Skjeldestad FE. Venous thromboembolism and subsequent permanent work‐related disability. J Thromb Haemost. 2016;1978–1987. [DOI] [PMC free article] [PubMed] [Google Scholar]
- 26. Kahn SR, Hirsch A, Shrier I. Effect of postthrombotic syndrome on health‐related quality of life after deep venous thrombosis. Arch Intern Med. 2002;1144–1148. [DOI] [PubMed] [Google Scholar]
- 27. Roberts LN, Patel RK, Donaldson N, Bonner L, Arya R. Post‐thrombotic syndrome is an independent determinant of health‐related quality of life following both first proximal and distal deep vein thrombosis. Haematologica. 2014;e41–e43. [DOI] [PMC free article] [PubMed] [Google Scholar]
- 28. Kucharska‐Newton A, Griswold M, Yao ZH, Foraker R, Rose K, Rosamond W, Wagenknecht L, Koton S, Pompeii L, Windham BG. Cardiovascular disease and patterns of change in functional status over 15 years: findings from the Atherosclerosis Risk in Communities (ARIC) Study. J Am Heart Assoc. 2017;e004144 DOI: 10.1161/JAHA.116.004144. [DOI] [PMC free article] [PubMed] [Google Scholar]
- 29. The ARIC Investigators . The Atherosclerosis Risk in Communities (ARIC) Study: design and objectives. Am J Epidemiol. 1989;687–702. [PubMed] [Google Scholar]
- 30. Cushman M, Tsai AW, White RH, Heckbert SR, Rosamond WD, Enright P, Folsom AR. Deep vein thrombosis and pulmonary embolism in two cohorts: the longitudinal investigation of thromboembolism etiology. Am J Med. 2004;19–25. [DOI] [PubMed] [Google Scholar]
- 31. Folsom AR, Yatsuya H, Nettleton JA, Lutsey PL, Cushman M, Rosamond WD. Community prevalence of ideal cardiovascular health, by the American Heart Association definition, and relationship with cardiovascular disease incidence. J Am Coll Cardiol. 2011;1690–1696. [DOI] [PMC free article] [PubMed] [Google Scholar]
- 32. Rosamond WD, Folsom AR, Chambless LE, Wang CH, McGovern PG, Howard G, Copper LS, Shahar E. Stroke incidence and survival among middle‐aged adults: 9‐year follow‐up of the Atherosclerosis Risk in Communities (ARIC) cohort. Stroke. 1999;736–743. [DOI] [PubMed] [Google Scholar]
- 33. Kucharska‐Newton AM, Palta P, Burgard S, Griswold ME, Lund JL, Capistrant BD, Kritchevsky SB, Bandeen‐Roche K, Windham BG. Operationalizing frailty in the Atherosclerosis Risk in Communities Study cohort. J Gerontol A Biol Sci Med Sci. 2017;382–388. [DOI] [PMC free article] [PubMed] [Google Scholar]
- 34. Guralnik JM, Ferrucci L, Simonsick EM, Salive ME, Wallace RB. Lower‐extremity function in persons over the age of 70 years as a predictor of subsequent disability. N Engl J Med. 1995;556–562. [DOI] [PMC free article] [PubMed] [Google Scholar]
- 35. Guralnik JM, Simonsick EM, Ferrucci L, Glynn RJ, Berkman LF, Blazer DG, Scherr PA, Wallace RB. A short physical performance battery assessing lower extremity function: association with self‐reported disability and prediction of mortality and nursing home admission. J Gerontol. 1994;M85–M94. [DOI] [PubMed] [Google Scholar]
- 36. Rosamond WD, Chang PP, Baggett C, Johnson A, Bertoni AG, Shahar E, Deswal A, Heiss G, Chambless LE. Classification of heart failure in the Atherosclerosis Risk in Communities (ARIC) Study. Circ Heart Fail. 2012;152–159. [DOI] [PMC free article] [PubMed] [Google Scholar]
- 37. Kahn SR. The post‐thrombotic syndrome. Hematology Am Soc Hematol Educ Program. 2010;216–220. [DOI] [PubMed] [Google Scholar]
- 38. Chow V, Ng ACC, Seccombe L, Chung T, Thomas L, Celermajer DS, Peters M, Kritharides L. Impaired 6‐min walk test, heart rate recovery and cardiac function post pulmonary embolism in long‐term survivors. Respir Med. 2014;1556–1565. [DOI] [PubMed] [Google Scholar]
- 39. Hagan KA, Harrington LB, Kim J, Zeleznik O, Rimm EB, Grodstein F, Kabrhel C. Reduction in physical function in women after venous thromboembolism. J Thromb Haemost. 2018;1564–1571. [DOI] [PMC free article] [PubMed] [Google Scholar]
- 40. Lakoski SG, Savage PD, Berkman AM, Penalosa L, Crocker A, Ades PA, Kahn SR, Cushman M. The safety and efficacy of early‐initiation exercise training after acute venous thromboembolism: a randomized clinical trial. J Thromb Haemost. 2015;1238–1244. [DOI] [PubMed] [Google Scholar]
- 41. Noack F, Schmidt B, Amoury M, Stoevesandt D, Gielen S, Pflaumbaum B, Girschick C, Völler H, Schlitt A. Feasibility and safety of rehabilitation after venous thromboembolism. Vasc Health Risk Manag. 2015;397–401. [DOI] [PMC free article] [PubMed] [Google Scholar]
- 42. Amoury M, Noack F, Kleeberg K, Stoevesandt D, Lehnigk B, Bethge S, Heinze V, Schlitt A. Prognosis of patients with pulmonary embolism after rehabilitation. Vasc Health Risk Manag. 2018;183–187. [DOI] [PMC free article] [PubMed] [Google Scholar]
- 43. Thomas RJ, King M, Lui K, Oldridge N, Piña IL, Spertus J. AACVPR/ACCF/AHA 2010 update: performance measures on cardiac rehabilitation for referral to cardiac rehabilitation/secondary prevention services: endorsed by the American College of Chest Physicians, the American College of Sports Medicine, the American Physical Therapy Association, the Canadian Association of Cardiac Rehabilitation, the Clinical Exercise Physiology Association, the European Association for Cardiovascular Prevention and Rehabilitation, the Inter‐American Heart Foundation, the National Association of Clinical Nurse Specialists, the Preventive Cardiovascular Nurses Association, and the Society of Thoracic Surgeons. J Am Coll Cardiol. 2010;1159–1167. [DOI] [PubMed] [Google Scholar]
- 44. Jneid H. Cardiac rehabilitation after myocardial infarction: unmet needs and future directions. JAMA Cardiol. 2016;978–979. [DOI] [PubMed] [Google Scholar]
- 45. Rengo JL, Savage PD, Shaw JC, Ades PA. Directly measured physical function in cardiac rehabilitation. J Cardiopulm Rehabil Prev. 2017;175–181. [DOI] [PMC free article] [PubMed] [Google Scholar]
- 46. Winstein CJ, Stein J, Arena R, Bates B, Cherney LR, Cramer SC, Deruyter F, Eng JJ, Fisher B, Harvey RL, et al. Guidelines for adult stroke rehabilitation and recovery. Stroke. 2016;e98–e169. [DOI] [PubMed] [Google Scholar]
- 47. Wiener R, Schwartz LM, Woloshin S. Time trends in pulmonary embolism in the United States: evidence of overdiagnosis. Arch Intern Med. 2011;831–837. [DOI] [PMC free article] [PubMed] [Google Scholar]
- 48. Painter P, Stewart AL, Carey S. Physical functioning: definitions, measurement, and expectations. Adv Ren Replace Ther. 1999;110–123. [DOI] [PubMed] [Google Scholar]
Associated Data
This section collects any data citations, data availability statements, or supplementary materials included in this article.
Supplementary Materials
Tables S1–S11