

Abstract
Background
The Life’s Simple 7 (LS7) metric incorporates health behaviors (body mass index, diet, smoking, physical activity) and health factors (blood pressure, cholesterol, glucose) to estimate an individual’s level of cardiovascular health. The association between cardiovascular health and incident hypertension is unresolved. Hypertension’s threshold was recently lowered and it is unclear if better cardiovascular health is associated with lower risk of incident hypertension with the updated threshold or in a multirace cohort. We sought to assess the association between better LS7 score and risk of incident hypertension among Black and White adults using a 130/80 mm Hg hypertension threshold.
Methods and Results
We determined the association between LS7 metric and incident hypertension in the REGARDS (Reasons for Geographic and Racial Disparities in Stroke) study, including participants free of baseline hypertension (2003–2007) who completed a second visit between 2013 and 2016. Hypertension was defined as systolic/diastolic blood pressure ≥130/80 mm Hg or antihypertensive medication use. Each LS7 component was assigned 0 (poor), 1 (intermediate), or 2 (ideal) points. We generated a 14‐point score by summing points. Among 2930 normotensive participants (20% Black, 80% White), the median (25th–75th percentiles) LS7 total score was 9 (8–10) points. Over a median follow‐up of 9 years, 42% developed hypertension. In the fully adjusted model, each 1‐point higher LS7 score had a 6% lower risk of incident hypertension (risk ratio, 0.94 per 1 point; 95% CI, 0.92–0.96).
Conclusions
Better cardiovascular health was associated with lower risk of incident hypertension using a 130/80 mm Hg hypertension threshold among Black and White adults.
Keywords: cardiovascular health, cohort study, hypertension, Life’s Simple 7
Subject Categories: Epidemiology, Hypertension, Lifestyle, Risk Factors
Nonstandard Abbreviations and Acronyms
- ACC
American College of Cardiology
- AHA
American Heart Association
- BMI
body mass index
- BP
blood pressure
- CVD
cardiovascular disease
- CVH
cardiovascular health
- JNC7
Seventh Report of the Joint National Committee on Prevention, Detection, Evaluation and Treatment of High Blood Pressure
- LS7
Life’s Simple 7
- REGARDS
Reasons for Geographic and Racial Differences in Stroke
- RR
risk ratio
Clinical Perspective
What Is New?
More optimal cardiovascular health is associated with lower risk of incident hypertension in a cohort of Black and White adults across the United States.
This association persists when using hypertension thresholds of 130/80 mm Hg and 140/90 mm Hg.
What Are the Clinical Implications?
Optimization of cardiovascular health components, as defined by the Life’s Simple 7 metric, might reduce risk of incident hypertension among at‐risk adults.
Hypertension affects 46% of US adults and is a major risk factor for cardiovascular disease (CVD), kidney failure, stroke, and cognitive decline. 1 , 2 Of all diseases, hypertension accounts for the largest reduction in healthy life expectancy. 3 Optimization of cardiovascular health (CVH) is one possible approach to prevent hypertension as blood pressure (BP) is lowered by moderate‐intensity exercise, weight loss, and consumption of a heart‐healthy diet. 4 , 5 , 6 , 7 , 8 The American Heart Association’s (AHA) Life’s Simple 7 (LS7) metric is used to evaluate CVH by incorporating 4 health behaviors (body mass index [BMI], physical activity, diet, and cigarette smoking) and 3 health factors (BP, cholesterol, and glucose) into a single metric. 9
The interplay between better CVH and risk of incident hypertension remains unresolved. Only one study explored the association between higher LS7 score and incident hypertension and was limited in scope, as it included only Black adults and used the 140/90 mm Hg hypertension threshold (ie, that defined by the Seventh Report of the Joint National Committee on Prevention, Detection, Evaluation and Treatment of High Blood Pressure [JNC7]). 10 In this study, higher LS7 score consistent with better CVH was associated with a lower incidence of hypertension. It is unclear if this association is present among a population of White and Black adults and when considering the 2017 American College of Cardiology (ACC)/American Heart Association (AHA) hypertension threshold (130/80 mm Hg). 11 The AHA’s recently released 2030 Impact Goal aims to improve healthy life expectancy, emphasizing the importance of better CVH defined by the LS7 metric. 12 Reducing the burden of hypertension would help achieve this goal, yet the relationship between CVH and incident hypertension is not completely understood. To better inform potential public health interventions informed by the 2030 Impact Goal, we addressed these knowledge gaps in a large, national cohort study of Black and White adults. Specifically, we studied whether better CVH at baseline, as is indicated by higher LS7 scores, is associated with a lower risk of hypertension at follow‐up in White and Black participants and whether associations were present when using the 2017 ACC/AHA definition of hypertension.
Methods
The REGARDS study database includes identifying participant information and cannot be made publicly available because of ethical/legal restrictions. Deidentified data sets and statistical code specific to this article are available to researchers meeting criteria for access to confidential data. Data can be obtained upon request through the University of Alabama at Birmingham at regardsadmin@uab.edu.
Study Population and Data Collection
The REGARDS study enrolled 30 239 Black and White adults in the contiguous United States, details of which have been published previously. 13 Potential participants were identified from commercially available lists and were recruited using mail and telephone outreach between 2003 and 2007, with oversampling of Black adults and residents of the Stroke Belt and Stroke Buckle. 14 The Stroke Belt includes southeastern US states experiencing a high incidence of stroke mortality, namely, North Carolina, South Carolina, Georgia, Tennessee, Mississippi, Alabama, Louisiana, and Arkansas. Stroke mortality is highest in the Stroke Buckle, which includes the coastal plains of North Carolina, South Carolina, and Georgia. Eligibility criteria included age ≥45 years, non‐Hispanic Black or White race, and not residing in a nursing home. A computer‐assisted telephone interview was used to collect sociodemographic data and a history of medical conditions, including hypertension. Laboratory assessment included glucose and lipids. Approximately 4 weeks later, a trained examiner performed an in‐home visit that included measurement of height, weight, and BP and collection of blood and urine samples following an overnight fast. Measurement of BP occurred twice following 5 minutes of quiet sitting by the participant, with the mean of the 2 measurements considered as the BP. Measurements were taken preferentially from the left arm, and a large cuff was used if there was a ≥13‐inch arm circumference. Initial cuff inflation targeted 20 mm Hg higher than the pulse obliteration level, then was deflated at ≈2 mm Hg per second. Quality of BP measurements was monitored centrally, and examiner retraining occurred for digit preference or for any other quality concerns. This examiner also recorded all prescription and nonprescription medications taken in the prior 2 weeks. Diet was characterized using a self‐administered Block 98 Food Frequency Questionnaire that was completed by the participant and mailed back to the study group. A second in‐home exam between 2013 and 2016 repeated these measures.
We restricted the present analyses to REGARDS study participants who did not have baseline hypertension and completed the second study visit. We excluded participants with data anomalies, those missing data for hypertension status at either visit, or those missing LS7 data at baseline.
Hypertension Definition
In accordance with the 2017 ACC/AHA guideline, hypertension was defined by systolic BP ≥130 mm Hg, diastolic BP ≥80 mm Hg, 11 or antihypertensive medication use. The study outcome was the development of hypertension at the second in‐home study visit. Secondary analyses assessed the JNC7 definition of systolic BP ≥140 mm Hg, diastolic BP ≥90 mm Hg, or antihypertensive medication use.
LS7 Components, LS7 Total Score, and LS7 Health Categories
We assigned scores for each of the individual LS7 components using a previously described definition. 9 , 15 Each individual component was scored as 0 points (poor), 1 point (intermediate), or 2 points (ideal). The definitions for each component appear in Table S1. A total score was calculated as the sum of the points from all LS7 components, with a highest possible LS7 total score of 14 (Figure S1), and a higher score consistent with more ideal CVH. The primary analysis incorporated the LS7 total score. Consistent with prior REGARDS study analyses, 15 we also categorized participants into 1 of 3 LS7 health categories; scores ≤4 points indicated inadequate health, 5 to 9 indicated average health, and 10 to 14 indicated optimal health.
Statistical Analysis
Sociodemographics, BP, and frequency of ideal LS7 components at baseline were calculated by race and inadequate, average, or optimal LS7 health categories. The primary analytical population included all participants. As prior REGARDS study analyses reported that clinical and social factors explaining the excess burden of incident hypertension among Black adults differed by sex, the analyses were also performed in sex‐race strata (ie, for Black women, Black men, White women, and White men, separately). 16
Distributions of individual LS7 components and LS7 health categories were calculated. We calculated the proportion of participants who developed hypertension by LS7 health categories overall and within race‐sex strata. The primary analysis used modified Poisson regression to estimate risk ratios (RRs) for incident hypertension for each 1 point higher LS7 total score in 3 models. 17 Model 1 included adjustment for race, age, sex, and region of residence (Stroke Belt, Stroke Buckle, or non–Stroke Belt). Model 2 also included adjustment for education and income level, and Model 3 included the variables in Model 2 and baseline systolic BP. We tested for interactions between race or sex and LS7 total score on RR for incident hypertension in models incorporating race‐LS7 and sex‐LS7 interaction terms. Visualization of the relationship between LS7 total score and RR for incident hypertension was performed with restricted cubic splines relative to the median. 18 RR for incident hypertension for intermediate and ideal levels of each individual LS7 component was estimated with “poor” as the reference group. As participants with “poor” BP component at baseline had hypertension and were excluded from the current analyses, those in the “intermediate” LS7 category were the reference group for BP. The 3 models with progressive adjustment, as described above, were used in analysis using levels of individual components for all individual LS7 components except BP. Model 3’s addition of baseline systolic BP introduced collinearity with the BP component, so Model 3 was not used for this specific LS7 component.
We performed 2 secondary analyses to account for missing data. Both analyses used chained equations to obtain 10 multiple imputed data sets to account for all missing components of the LS7 metric, except for diet. Contrary to the other components of the LS7 diet’s missingness is likely not at random, as it required completion of a questionnaire, which might have been affected by socioeconomic factors like level of education. Multiple imputation is indicated only for data missing at random. 19 First, we included participants without diet data at baseline and assigned these individuals a diet component score of “poor” (0 points) since this category had by far the highest prevalence. Second, we assigned participants with a missing diet component a score of “intermediate” (1 point). Because there was a low frequency of “ideal” dietary patterns, we did not assign missing diet components a score of “ideal” (2 points). We also repeated all analyses defining hypertension at baseline and during follow‐up using the JNC7 definition, systolic BP ≥140 mm Hg, diastolic BP ≥90 mm Hg, or antihypertensive medication use. This JNC7 threshold was also used in assessing individual LS7 components and RR for incident hypertension.
For multiplicative interaction terms, we used P=0.10 as the threshold for statistical significance. All analyses were performed using the full REGARDS data set by 2 of the authors (TBP and IK) using R version 3.5.3 (The R Project for Statistical Computing) and Stata MP 15.1 (StataCorp, College Station, TX). Institutional review boards at each participating site approved the REGARDS protocol, and all participants provided written informed consent. The REGARDS study provides access to the data set for investigators who complete the requisite documentation, which can found at https://www.regardsstudy.org.
Results
Study Population
Among the 30 239 study participants, 22 325 (74%) had baseline hypertension by the 2017 ACC/AHA threshold and were excluded (Figure S2). Hypertension at baseline was more common among Black than White participants (10 502/12 514; 84% versus 11 823/17 669; 67%; P<0.001). Among the 7419 participants without hypertension at baseline, 1081 (15%) died and 1833 (25%) withdrew from the study, were lost to follow‐up, or did not participate in the second examination. Of the 4505 remaining participants who completed the second examination (22% Black, 78% White), 1331 (30%) were excluded for missing baseline data required to calculate the LS7 metric. The most frequent missing component was the diet score, which was missing in 830 (35% of Black participants and 14% of White participants).
Median (25th–75th percentiles) duration of time between the baseline and follow‐up exam was 9.4 (8.5–9.9) years. Baseline characteristics by race and overall LS7 score are shown in Table 1. The mean (SD) age was 61 (8) years, 59% were women, 23% were Black, and 56% lived in the Stroke Belt. Also, the mean (25th–75th percentiles) LS7 total score was 9 (8–10) points in the overall population and 8 (7–10) among Black women, 8 (8–10) among Black men, 9 (8–11) among White women, and 9 (8–10) among White men.
Table 1.
Characteristics at Baseline of REGARDS Study Participants Without Prevalent Hypertension (n=2930) by Race and LS7 Health Categories
| Black Participants (n=491) | White Participants (n=2439) | |||||
|---|---|---|---|---|---|---|
| Inadequate | Average | Optimal | Inadequate | Average | Optimal | |
| Race subgroup, n (%) | 13 (3) | 336 (68) | 142 (29) | 23 (1) | 1316 (54) | 1100 (45) |
| Age, y | 56 (7) | 60 (7) | 60 (9) | 59 (8) | 62 (8) | 61 (9) |
| Women, % | 85 | 68 | 70 | 61 | 55% | 60 |
| Black race, % | 100 | 100 | 100 | 0 | 0 | 0 |
| Region, % | ||||||
| Stroke Buckle | 23 | 21 | 17 | 22 | 25 | 23 |
| Stroke Belt, non‐Buckle | 31 | 37 | 36 | 43 | 33 | 33 |
| Non‐Belt | 46 | 42 | 47 | 35 | 43 | 45 |
| Level of education, % | ||||||
| Less than high school | 0 | 5 | 4 | 13 | 4 | 2 |
| High school graduate | 23 | 26 | 17 | 17 | 21 | 15 |
| Some college | 38 | 28 | 32 | 35 | 26 | 24 |
| College graduate and above | 38 | 41 | 47 | 35 | 49 | 60 |
| Annual household income, % | ||||||
| <$20K | 31 | 18 | 10 | 35 | 8 | 4 |
| $20k–$34k | 15 | 23 | 20 | 17 | 18 | 14 |
| $35k–$74k | 23 | 38 | 38 | 26 | 36 | 34 |
| $75k and above | 8 | 14 | 21 | 9 | 26 | 36 |
| Refused | 23 | 7 | 11 | 13 | 11 | 12 |
| Systolic BP, mm Hg | 118 (6) | 116 (9) | 111 (10) | 120 (6) | 115 (9) | 110 (9) |
| Diastolic BP, mm Hg | 72 (4) | 71 (6) | 69 (6) | 71 (6) | 70 (6) | 69 (7) |
| Ideal BMI, % | 0 | 15 | 54 | 4 | 22 | 66 |
| Ideal physical activity, % | 8 | 20 | 45 | 0 | 18 | 57 |
| Ideal diet, % | 0 | 0 | 0 | 0 | 0 | <1 |
| Ideal smoking status, % | 23 | 79 | 94 | 17 | 81 | 98 |
| Ideal blood pressure, % | 38 | 55 | 83 | 22 | 61 | 85 |
| Ideal cholesterol, % | 0 | 32 | 64 | 4 | 26 | 56 |
| Ideal blood glucose, % | 31 | 66 | 95 | 17 | 71 | 94 |
Continuous variables present standardized distribution in parentheses unless otherwise specified. BMI indicates body mass index; BP, blood pressure; and LS7, Life’s Simple 7.
Individual LS7 Components and LS7 Total Score Overall and by Race‐Sex Strata
The distribution of the components of the LS7 metric in these participants without prevalent hypertension appears in Figure 1. More than half of participants had ideal scores for smoking, glucose, and BP components. Components with the greatest percentage of poor scores were diet, physical activity, and BMI. Only 1 participant had an ideal diet. As is shown in Figure S3, Black women had the lowest proportion of ideal BMI; Black men had the greatest proportion of ideal glucose, BMI, and BP; White women had the lowest proportion of ideal glucose and BP; and White men had the greatest proportion of physical activity.
Figure 1. Distribution of the components of the LS7 metric among the analytical population.
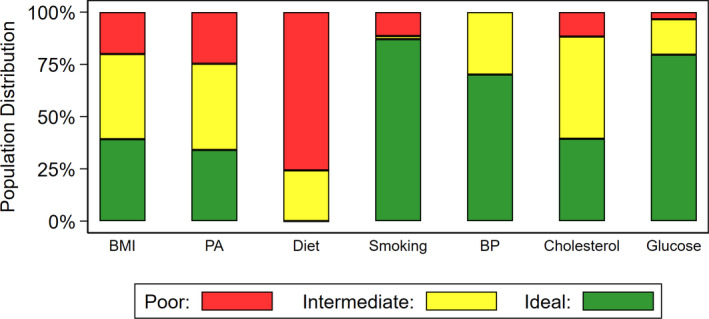
BMI indicates body mass index; BP, blood pressure; LS7, Life’s Simple 7; and PA, physical activity.
Hypertension Incidence
Overall, 1214 of the 2930 (41%) participants had hypertension at the follow‐up visit. The incidence was 52% and 50% in Black women and men, respectively, and 37% and 42% in White women and men, respectively. As shown in Table S2, the incidence of hypertension was lower with better CVH, being 75% with inadequate LS7, 47% with intermediate LS7, and 33% with optimal LS7. In race‐sex strata, an optimal LS7 category was associated with lower incidence of hypertension, being 36% and 47% among Black women and men, respectively, and 29% and 38% among White women and men, respectively.
When considering the continuous LS7 total score, there was a graded association between higher score and lower incidence of hypertension, as was depicted in the restricted cubic spline plot (Figure 2). Among race‐sex strata, there was not a consistent graded association except for White women (Figure S4).
Figure 2. Restricted cubic spline plots and histograms comparing RR for incident hypertension relative to the median LS7 total score.

This figure compares RR for incident hypertension at the second visit, according to LS7 total score at baseline using restricted spline models, adjusting for components in “Model 3” (race, age, sex, geographic location, education level, income level, and systolic blood pressure at baseline). The shaded areas represent 95% CIs. Models are relative to median LS7 total score, with knots specified with Harrell’s Method. 18 The knots were not prespecified and are located at LS7 total scores of 6, 8, 10, and 12. The plot was truncated at 0.5th and 99.5th percentiles for baseline LS7 score. The histograms represent distribution of baseline LS7 total score among those who did (upright bars) and did not (inverted bars) develop hypertension at the second visit. Histograms were not truncated. LS7 indicates Life’s Simple 7; and RR, risk ratio.
Risk of Incident Hypertension by Increasing LS7 Total Score
As shown in Table 2, each 1‐point increase in LS7 total score was associated with a 10% lower risk of incident hypertension in Models 1 and 2 (RR, 0.90; 95% CI, 0.88–0.92 for both) and a 6% lower risk in the fully adjusted Model 3 (RR, 0.94; 95% CI, 0.92–0.96), which controlled for all covariates in Model 2 plus baseline systolic BP. There were no statistical differences in the association by race (P=0.18) or sex (P=0.14) in the fully adjusted model. In analysis by race‐sex strata, there was a 5% to 7% lower risk in the fully adjusted model for Black and White women and White men. There was no clear association between higher LS7 total score and incident hypertension for Black men, though numbers were small, as only 5% of the analytical sample were Black men.
Table 2.
RRs and 95% CIs for Incident Hypertension per 1‐Point Increase in LS7 Total Score Overall and by Race‐Sex Strata*
| Group | Model 1 | Model 2 |
|---|---|---|
| All (N=2930) | 0.90 (0.88–0.92) | 0.90 (0.88–0.92) |
| Black participants | ||
| Women (n=340) | 0.92 (0.87–0.96) | 0.92 (0.88–0.97) |
| Men (n=151) | 0.95 (0.87–1.04) | 0.96 (0.87–1.06) |
| White participants | ||
| Women (n=1392) | 0.87 (0.85–0.90) | 0.89 (0.86–0.92) |
| Men (n=1047) | 0.92 (0.88–0.95) | 0.92 (0.89–0.96) |
LS7 indicates Life’s Simple 7; and RR, risk ratio. Model 1 adjusted for race, age, sex, and geographic location (Stroke Belt, Stroke Buckle, or non–Stroke Belt). Model 2 also adjusted for education and income level. Model 3 also adjusted for baseline systolic blood pressure.
Risk of Incident Hypertension by Level of Individual LS7 Components
Except for physical activity, more optimal levels of each individual LS7 component were associated with lower risk of incident hypertension in the fully adjusted Model 3 (Table 3). Relative to poor physical activity, the RR for intermediate (0.96; 95% CI, 0.87–1.07) and ideal (1.02; 95% CI, 0.92–1.04) physical activity levels included the null in the fully adjusted model. Relative to intermediate, ideal BP was associated with a 34% risk reduction with incident hypertension in Model 2, which did not incorporate baseline systolic BP as a covariate (RR, 0.66; 95% CI, 0.60–0.71). There was only 1 participant with an ideal dietary pattern so meaningful comparisons could not be drawn in the comparison between ideal and poor (reference) diet, but intermediate diet was associated with an 11% risk reduction in hypertension in the fully adjusted model (RR, 0.89; 95% CI, 0.80–1.00).
Table 3.
RR for Incident Hypertension by Individual LS7 Components
| Number With Incident Hypertension/Number in Group (%) | Model 1 | Model 2 | Model 3 | |
|---|---|---|---|---|
| BMI | ||||
| Poor | 306/588 (52.0) | Ref | Ref | Ref |
| Intermediate | 516/1194 (43.2) | 0.84 (0.76–0.93) | 0.85 (0.76–0.94) | 0.88 (0.80–0.98) |
| Ideal | 392/1148 (34.1) | 0.68 (0.60–0.76) | 0.69 (0.62–0.78) | 0.78 (0.70–0.88) |
| P trend | <0.001 | <0.001 | <0.001 | |
| Physical activity | ||||
| Poor | 313/724 (43.2) | Ref | Ref | Ref |
| Intermediate | 480/1209 (39.7) | 0.93 (0.83–1.03) | 0.96 (0.86–1.07) | 0.96 (0.87–1.07) |
| Ideal | 421/997 (42.2) | 0.98 (0.88–1.10) | 1.00 (0.90–1.12) | 1.02 (0.92–1.14) |
| P trend | 0.89 | 0.93 | 0.64 | |
| Diet | ||||
| Poor | 961/2219 (43.3) | Ref | Ref | Ref |
| Intermediate | 253/710 (35.6) | 0.83 (0.75–0.93) | 0.87 (0.78–0.97) | 0.89 (0.80–1.00) |
| Ideal | 0/1 (0.0) | 0.00 (0.00–0.00) | 0.00 (0.00–0.00) | 0.00 (0.00–0.00) |
| P trend | 0.01 | 0.01 | 0.04 | |
| Smoking | ||||
| Poor | 168/336 (50.0) | Ref | Ref | Ref |
| Intermediate | 20/44 (45.5) | 0.89 (0.63–1.26) | 0.90 (0.62–1.29) | 0.86 (0.60–1.24) |
| Ideal | 1026/2550 (40.2) | 0.80 (0.71–0.90) | 0.85 (0.75–0.96) | 0.85 (0.76–0.96) |
| P trend | <0.001 | <0.01 | <0.01 | |
| BP* | ||||
| Poor | 0/0 (0) | N/A | N/A | N/A |
| Intermediate | 493/876 (56.3) | Ref | Ref | N/A |
| Ideal | 721/2054 (35.1) | 0.64 (0.59–0.70) | 0.66 (0.60–0.71) | N/A |
| P trend | <0.001 | <0.001 | N/A | |
| Cholesterol | ||||
| Poor | 158/343 (46.1) | Ref | Ref | Ref |
| Intermediate | 611/1433 (42.6) | 0.91 (0.80–1.03) | 0.94 (0.83–1.07) | 0.94 (0.83–1.07) |
| Ideal | 445/1154 (38.6) | 0.82 (0.72–0.95) | 0.86 (0.75–0.98) | 0.86 (0.76–0.99) |
| P trend | <0.01 | 0.01 | 0.02 | |
| Glucose | ||||
| Poor | 62/100 (62.0) | Ref | Ref | Ref |
| Intermediate | 245/497 (49.3) | 0.81 (0.68–0.97) | 0.83 (0.69–0.99) | 0.84 (0.70–1.00) |
| Ideal | 907/2333 (38.9) | 0.66 (0.56–0.78) | 0.67 (0.57–0.79) | 0.71 (0.61–0.84) |
| P trend | <0.001 | <0.001 | <0.001 | |
Model 1 adjusted for race, age, sex, and geographic location (Stroke Belt, Stroke Buckle, or non–Stroke Belt). Model 2 also adjusted for education and income level. Model 3 also adjusted for baseline systolic BP. There were no additional adjustments for other LS7 metrics. BMI indicates body mass index; BP, blood pressure; LS7, Life’s Simple 7; and RR, risk ratio.
There were no participants with poor BP components given the exclusion criteria. For this, intermediate is set as the reference. Model 3 results not shown given collinearity between the LS7 BP component and baseline systolic BP.
Secondary Analyses
Assigning missing dietary scores as “poor” or “intermediate” and using multiple imputation to account for other missing LS7 components led to the inclusion of an additional 1180 participants in the analytical sample (n=4110), including 251 Black women (n=591), 177 Black men (n=328), 401 White women (n=1793), and 351 White men (n=1398). As is shown in Table S3, the associations did not differ in Model 3 regardless of the assigned dietary score. The risk for incident hypertension per 1‐point increase in LS7 continual score was associated with 5% lower risk of incident hypertension overall (RR, 0.95; 95% CI, 0.93–0.97) in Model 3. There was no clear association of LS7 and hypertension among Black men (RR, 0.99; 95% CI, 0.92–1.06 when assigning “poor”; and RR, 0.98; 95% CI, 0.92–1.05 when assigning “intermediate”). For other race‐sex groups, each 1‐point increase was associated with a 4% to 6% lower risk of hypertension in each analysis.
Performing this analysis using the JNC7 definition for hypertension (140/90 mm Hg) included an additional 1485 participants (total 4415) who had baseline systolic BP ≥130 but <140 mm Hg and diastolic BP ≥80 but <90, including 229 Black women (n=563), 157 Black men (n=308), 506 White women (n=1891), and 610 White men (n=1653). Results are shown in Tables S4 through S7 and Figures S5 through S8. Restricted cubic spline plots of continuous LS7 score show a graded association between higher score and lower risk of hypertension overall and among White women and White men. For each 1‐point increase in LS7 total score, there was an 8% reduction in risk of incident hypertension (RR, 0.92; 95% CI, 0.90–0.94) in Model 3. Comparisons by race‐sex groups were generally similar to the main analysis findings. Assigning missing dietary scores as “poor” or “intermediate” and using multiple imputation led to inclusion of an additional 1840 participants (N=6255), including 412 Black women (n=975), 318 Black men (n=626), 537 White women (n=2428), and 573 White men (n=2226). As shown in Table S8, every 1‐point increase in LS7 total score was associated with a 7% lower risk for incident hypertension overall (RR, 0.93; 0.91–0.95 assigning “poor”; and RR, 0.93; 95% CI, 0.92–0.95 assigning “intermediate”). Comparisons by race‐sex strata were similar to the analysis not accounting for missing data, using the JNC7 hypertension threshold.
Comparisons by level of individual LS7 components using the JNC7 hypertension threshold were also similar to the main analysis. Relative to poor in Model 3, there was still no difference in risk of hypertension with ideal physical activity (RR, 0.92; 95% CI, 0.83–1.01), but there was a 10% reduction comparing intermediate to poor (RR, 0.90; 0.82, 0.99). Relative to poor, intermediate (RR, 1.02; 95% CI, 0.90–1.15) and ideal cholesterol (RR, 0.93; 95% CI, 0.82–1.06) did not associate with lower risk for hypertension in Model 3. In Model 2, ideal relative to intermediate BP was associated with a 54% reduction in hypertension.
Discussion
In a national cohort of Black and White US adults aged ≥45 years old without prevalent hypertension, having better CVH, quantified by higher levels of the continuous LS7 total score, was associated with lower risk of incident hypertension over 9 years of follow‐up. We did not identify any differences in this association by race, although relatively few Black men were free from hypertension at baseline and there was no clear association between LS7 and incident hypertension in this group. Associations were similar to the main analysis when hypertension was defined using the JNC7 definition and in analyses accounting for missing data.
CVD is the leading cause of death among US adults, and the development of hypertension is a major risk factor for CVD. 2 Although antihypertensive medication can lower BP to nonhypertensive levels, there is residual risk of CVD when compared with individuals with similar BP levels who never developed hypertension. 20 Therefore, the primary prevention of hypertension is important for the prevention of CVD. Several modifiable CVH factors and behaviors included in the LS7 metric, including elevated BMI, physical inactivity, cigarette smoking, elevated fasting glucose, and dietary patterns, have been associated with an increased risk for hypertension. 21 , 22 , 23 Prior research identified a more optimal LS7 score among Black adults to associate with a lower risk of incident hypertension using the JNC7‐BP thresholds of 140/90 mm Hg. That analysis included 1878 JHS (Jackson Heart Study) participants (mean [SD] age, 49 [12]; 39% men; 100% Black race) and identified a 50% incidence of hypertension at a median follow‐up of 8 years. The analysis did not incorporate the complete range of LS7 levels, as it considered only number of ideal levels of LS7 components; there was no distinction between poor and intermediate levels when considering the overall CVH of participants. In this population, number of LS7 components in the ideal range was inversely associated with risk of hypertension at follow‐up in a graded manner. 10 This analysis also found an inverse association between more optimal levels of most individual LS7 components and risk of hypertension. Relative to poor, cholesterol scores in the LS7 intermediate and ideal range did not associate with lower risk of hypertension.
In the present analysis, we confirmed the graded association between more optimal CVH and lower incidence of hypertension at 9 years in a population of Black and White adults. This association was present when defining hypertension according to either the JNC7 or 2017 ACC/AHA guidelines. We did not identify any meaningful interactions of these associations by race or sex, though there were disproportionately fewer Black participants, especially Black men, free from prevalent hypertension in this analysis. REGARDS participants were ≈12 years older than the JHS population at baseline. Onset of hypertension occurs at a younger age among Black adults, 24 , 25 which might account for the small number free from hypertension at baseline.
The present findings in REGARDS differ from the JHS analysis in 2 ways. First, the prior JHS analysis found that ideal levels of each individual component of the LS7 metric to be associated with reduced risk of hypertension, apart from cholesterol. In the present analysis, an ideal cholesterol score had lower risk of incident hypertension with the lower 2017 ACC/AHA hypertension threshold but not the JNC7 threshold. Observational studies have suggested an association between dyslipidemia and residual risk for incident hypertension among at‐risk adults, and one trial showed modest BP‐lowering effects with short‐term administration of statins among adults without hypertension. 26 , 27 , 28 The association between cholesterol levels and risk of hypertension remains unclear. Second, the prior JHS analysis found a graded association between ideal physical activity and lower risk for incident hypertension. The REGARDS findings confirm the inverse association of ideal physical activity and risk of hypertension using the JNC7 but not the 2017 ACC/AHA hypertension definition. High‐quality evidence, including meta‐analyses of randomized controlled trials, supports the protective effects of exercise in the development of hypertension. 4 , 5 , 6 , 8 Lack of an association in the current analysis may be attributable to the method classifying physical activity in REGARDS, which used self‐reported frequency of intense physical activity sufficient to “work up a sweat.” While this question has been validated in population studies, 29 , 30 it may not sufficiently distinguish between relative levels of physical activity important for hypertension risk.
The present analysis extends scientific knowledge in several meaningful ways. First, prior studies only considered the role of ideal LS7 components when assessing risk of incident hypertension. In the present analysis, there was a graded association between higher LS7 score and lower risk of hypertension that persisted when considering all 3 possible levels of individual LS7 components to classify overall CVH. This is an important public health finding as the poor and intermediate thresholds were identified from patterns of clinically meaningful health behaviors. 9 , 15 Integrating information from the poor and intermediate levels of all LS7 components appears to further delineate risk for incident hypertension. Second, we confirm the association between more optimal LS7‐defined CVH persists among an older population of Black and White adults than previously studied, supporting the importance of CVH across the age spectrum. Third, hypertension‐related diseases occur across the spectrum of elevated BP levels and the 2017 ACC/AHA definition lowered the threshold of hypertension to 130/80 mm Hg to identify those likely to benefit from intensive BP control. 2 , 11 We are unaware of prior analyses of LS7‐defined CVH and risk of incident hypertension using this updated threshold. Finally, the AHA’s 2030 Impact Goal aims to increase healthy life expectancy through promotion of CVH. 12 The present findings extend the understanding of better CVH and its relationship with incident hypertension in a biracial cohort. Hypertension contributes to the greatest loss of disability‐adjusted life years of all diseases. 2 , 3 Population health interventions to improve CVH among those free from hypertension might lower the burden of this common disease and aid the achievement of the 2030 Impact Goal.
The LS7 metric quantifies the level of overall CVH and may help identify those at greatest risk for development of hypertension. In comparison with White US adults, Black men and women experience a greater burden of nonoptimal CVH patterns as well as greater burden of hypertension and CVD events. 16 , 31 , 32 A previous REGARDS study identified distinct clinical and social factors contributing to the greater risk of hypertension in Black participants, many of which are included in the LS7 metric. 16 Addressing the differences in these risk factors and optimizing CVH might help address the disparity in hypertension and CVD experienced by Black men and women. The LS7 is an aggregate metric for CVH and individuals can optimize its overall value by choosing to focus on ≥1 of its components. For high‐risk individuals with a suboptimal LS7 total score, a personalized approach may focus on behavioral interventions, medical therapies, or a combination of these. Future research should focus on patient‐centered optimization of the LS7 metric to prevent the development of hypertension among at‐risk adults, with a specific emphasis on Black men and women. Such analyses might consider advances in race‐specific understanding of the onset of hypertension, including differences in salt sensitivity and lower availability of nitrous oxide among Black adults. 33 , 34 , 35 Finally, although the LS7 metric gives equal weighting to each of its individual components, each individual LS7 component might contribute different of levels of risk for incident hypertension. Understanding the interplay between components of CVH and potential mechanisms for hypertension would provide further insights in targeted interventions for those at the highest risk. For example, components of LS7 related to metabolic syndrome have been implicated in increased arterial stiffness, which is itself a potent risk factor for hypertension. 36 , 37 , 38 Future research might consider whether a “weighted” LS7 score or a completely different risk metric provides more granularity in distinguishing relative levels of risk for incident hypertension in general and in the development of other potent hypertension risk factors like high arterial stiffness.
The current study has limitations. There was a high missingness of the dietary component of LS7. However, results were robust in sensitivity analyses that assigned poor or intermediate diet levels to those missing diet information. Not all participants completed the second study visit. However, prior analyses suggest that this does not bias estimates of hypertension risk factors. 39 There was greater attrition of Black than White adults, though a prior REGARDS analysis found no difference in social and clinical factors contributing to the racial difference incident hypertension using inverse probability weighting as a sensitivity analysis. 16 The analytical plan could not account for survival bias since those who died before the second visit were excluded. As a less optimal LS7 score is associated with higher risk of death, this bias is likely toward the null. 40 Since Black adults develop hypertension at younger ages, more Black participants, and especially Black men, were excluded at baseline. This limits the ability to look for specific associations between LS7 and incident hypertension among Black participants in stratified analyses. Self‐reported exercise at baseline may be insufficient to distinguish between levels of physical activity in this population. The onset of hypertension occurred at an unclear duration of time between the visits, and we were unable to conduct time‐to‐event analyses. Our study has several strengths. There were many incident hypertension events. The population was geographically and racially diverse. The retention was 97% per year.
In conclusion, in a large, biracial, national cohort of adults aged ≥45 years, relatively few Black participants were free from prevalent hypertension. In this analysis of mostly White participants, more favorable levels of LS7‐defined CVH was associated with lower risk of incident hypertension at follow‐up 9 years later. This association was present using the hypertension threshold of 130/80 mm Hg from the 2017 ACC/AHA BP guideline. Hypertension is a major risk factor for CVD, and optimizing CVH may prevent its development and thereby reduce the burden of CVD.
Sources of Funding
This research project is supported by cooperative agreement U01 NS041588, cofunded by the National Institute of Neurological Disorders and Stroke (NINDS) and the National Institute on Aging (NIA), National Institutes of Health, and Department of Health and Human Service. The content is solely the responsibility of the authors and does not necessarily represent the official views of the NINDS or the NIA. Representatives of the NINDS were involved in the review of the article but were not directly involved in the collection, management, analysis, or interpretation of the data.
Disclosures
Safford reports salary support for investigator‐initiated research from Amgen. Booth receives salary support for employment at CTI Clinical Trials and Consulting Services, Inc. for work unrelated to the topic of this manuscript, which was completed prior to his employment. The remaining authors have no disclosures to report.
Supporting information
Tables S1–S8
Figures S1–S8
Acknowledgments
The authors thank the other investigators, the staff, and the participants of the REGARDS study for their valuable contributions. A full list of participating REGARDS investigators and institutions can be found at http://www.regardsstudy.org.
(J Am Heart Assoc. 2020;9:e016482 DOI: 10.1161/JAHA.120.016482.)
For Sources of Funding and Disclosures, see page 10.
References
- 1. Muntner P, Carey RM, Gidding S, Jones DW, Taler SJ, Wright JT, Whelton PK. Potential US population impact of the 2017 ACC/AHA high blood pressure guideline. Circulation. 2018;137:109–118. [DOI] [PMC free article] [PubMed] [Google Scholar]
- 2. Virani SS, Alonso A, Benjamin EJ, Bittencourt MS, Callaway CW, Carson AP, Chamberlain AM, Chang AR, Cheng S, Delling FN, et al. Heart disease and stroke statistics—2020 update. Circulation. 2020;141:e139–e596. [DOI] [PubMed] [Google Scholar]
- 3. Lim SS, Vos T, Flaxman AD, Danaei G, Shibuya K, Adair‐Rohani H, Amann M, Anderson HR, Andrews KG, Aryee M, et al. A comparative risk assessment of burden of disease and injury attributable to 67 risk factors and risk factor clusters in 21 regions, 1990–2010: a systematic analysis for the Global Burden of Disease Study 2010. Lancet. 2012;380:2224–2260. [DOI] [PMC free article] [PubMed] [Google Scholar]
- 4. Brook RD, Appel LJ, Rubenfire M, Ogedegbe G, Bisognano JD, Elliott WJ, Fuchs FD, Hughes JW, Lackland DT, Staffileno BA, et al.; American Heart Association Professional Education Committee of the Council for High Blood Pressure Research, Council on Cardiovascular and Stroke Nursing, Council on Epidemiology and Prevention, and Council on Nutrition, Physical Activity . Beyond medications and diet: alternative approaches to lowering blood pressure: a scientific statement from the American Heart Association. Hypertension. 2013;61:1360–1383. [DOI] [PubMed] [Google Scholar]
- 5. Pescatello LS, MacDonald HV, Ash GI, Lamberti LM, Farquhar WB, Arena R, Johnson BT. Assessing the existing professional exercise recommendations for hypertension: a review and recommendations for future research priorities. Mayo Clin Proc. 2015;90:801–812. [DOI] [PubMed] [Google Scholar]
- 6. Kraus WE, Bittner V, Appel L, Blair SN, Church T, Després J‐P, Franklin BA, Miller TD, Pate RR, Taylor‐Piliae RE, et al.; American Heart Association Physical Activity Committee of the Council on Lifestyle and Metabolic Health, Council on Clinical Cardiology, Council on Hypertension, and Council on Cardiovascular and Stroke Nursing . The National Physical Activity Plan: a call to action from the American Heart Association: a science advisory from the American Heart Association. Circulation. 2015;131:1932–1940. [DOI] [PubMed] [Google Scholar]
- 7. Sacks FM, Svetkey LP, Vollmer WM, Appel LJ, Bray GA, Harsha D, Obarzanek E, Conlin PR, Miller ER, Simons‐Morton DG, et al.; DASH‐Sodium Collaborative Research Group . Effects on blood pressure of reduced dietary sodium and the Dietary Approaches to Stop Hypertension (DASH) diet. DASH‐Sodium Collaborative Research Group. N Engl J Med. 2001;344:3–10. [DOI] [PubMed] [Google Scholar]
- 8. Appel LJ, Champagne CM, Harsha DW, Cooper LS, Obarzanek E, Elmer PJ, Stevens VJ, Vollmer WM, Lin P‐H, Svetkey LP, et al. Effects of comprehensive lifestyle modification on blood pressure control: main results of the PREMIER clinical trial. JAMA. 2003;289:2083–2093. [DOI] [PubMed] [Google Scholar]
- 9. Lloyd‐Jones DM, Hong Y, Labarthe D, Mozaffarian D, Appel LJ, Van Horn L, Greenlund K, Daniels S, Nichol G, Tomaselli GF, et al.; American Heart Association Strategic Planning Task Force and Statistics Committee . Defining and setting national goals for cardiovascular health promotion and disease reduction: the American Heart Association’s strategic Impact Goal through 2020 and beyond. Circulation. 2010;121:586–613. [DOI] [PubMed] [Google Scholar]
- 10. Booth JN, Abdalla M, Tanner RM, Diaz KM, Bromfield SG, Tajeu GS, Correa A, Sims M, Ogedegbe G, Bress AP, et al. Cardiovascular health and incident hypertension in blacks: JHS (the Jackson Heart Study). Hypertension. 2017;70:285–292. [DOI] [PMC free article] [PubMed] [Google Scholar]
- 11. Whelton PK, Carey RM, Aronow WS, Casey DE, Collins KJ, Dennison Himmelfarb C, DePalma SM, Gidding S, Jamerson KA, Jones DW, et al. 2017 ACC/AHA/AAPA/ABC/ACPM/AGS/APhA/ASH/ASPC/NMA/PCNA guideline for the prevention, detection, evaluation, and management of high blood pressure in adults: executive summary: a report of the American College of Cardiology/American Heart Association Task Force on Clinical Practice Guidelines. Hypertension. 2018;71:1269–1324. [DOI] [PubMed] [Google Scholar]
- 12. Angell SY, McConnell MV, Anderson CAM, Bibbins‐Domingo K, Boyle DS, Capewell S, Ezzati M, de Ferranti S, Gaskin DJ, Goetzel RZ, et al. The American Heart Association 2030 impact goal: a presidential advisory from the American Heart Association. Circulation. 2020;141:e120–e138. [DOI] [PMC free article] [PubMed] [Google Scholar]
- 13. Howard VJ, Cushman M, Pulley L, Gomez CR, Go RC, Prineas RJ, Graham A, Moy CS, Howard G. The REasons for Geographic And Racial Differences in Stroke study: objectives and design. Neuroepidemiology. 2005;25:135–143. [DOI] [PubMed] [Google Scholar]
- 14. Howard G, Anderson R, Johnson NJ, Sorlie P, Russell G, Howard VJ. Evaluation of social status as a contributing factor to the Stroke Belt region of the United States. Stroke. 1997;28:936–940. [DOI] [PubMed] [Google Scholar]
- 15. Kulshreshtha A, Vaccarino V, Judd SE, Howard VJ, McClellan WM, Muntner P, Hong Y, Safford MM, Goyal A, Cushman M. Life’s Simple 7 and risk of incident stroke: the reasons for geographic and racial differences in stroke study. Stroke. 2013;44:1909–1914. [DOI] [PMC free article] [PubMed] [Google Scholar]
- 16. Howard G, Cushman M, Moy CS, Oparil S, Muntner P, Lackland DT, Manly JJ, Flaherty ML, Judd SE, Wadley VG, et al. Association of clinical and social factors with excess hypertension risk in Black compared with White US adults. JAMA. 2018;320:1338–1348. [DOI] [PMC free article] [PubMed] [Google Scholar]
- 17. Zou G. A modified Poisson regression approach to prospective studies with binary data. Am J Epidemiol. 2004;159:702–706. [DOI] [PubMed] [Google Scholar]
- 18. Harrell FE. Regression Modeling Strategies: With Applications to Linear Models, Logistic and Ordinal Regression, and Survival Analysis. Switzerland: Springer; 2015:1–598. [Google Scholar]
- 19. White IR, Royston P, Wood AM. Multiple imputation using chained equations: issues and guidance for practice. Stat Med. 2011;30:377–399. [DOI] [PubMed] [Google Scholar]
- 20. Howard G, Banach M, Cushman M, Goff DC, Howard VJ, Lackland DT, McVay J, Meschia JF, Muntner P, Oparil S, et al. Is blood pressure control for stroke prevention the correct goal? The lost opportunity of preventing hypertension. Stroke. 2015;46:1595–1600. [DOI] [PMC free article] [PubMed] [Google Scholar]
- 21. Carretero OA, Oparil S. Essential hypertension. Part I: definition and etiology. Circulation. 2000;101:329–335. [DOI] [PubMed] [Google Scholar]
- 22. Echouffo‐Tcheugui JB, Batty GD, Kivimäki M, Kengne AP. Risk models to predict hypertension: a systematic review. PLoS One. 2013;8:e67370. [DOI] [PMC free article] [PubMed] [Google Scholar]
- 23. De Marco M, de Simone G, Roman MJ, Chinali M, Lee ET, Russell M, Howard BV, Devereux RB. Cardiovascular and metabolic predictors of progression of prehypertension into hypertension: the Strong Heart Study. Hypertension. 2009;54:974–980. [DOI] [PMC free article] [PubMed] [Google Scholar]
- 24. Cornoni‐Huntley J, LaCroix AZ, Havlik RJ. Race and sex differentials in the impact of hypertension in the United States. The National Health and Nutrition Examination Survey I Epidemiologic Follow‐up Study. Arch Intern Med. 1989;149:780–788. [PubMed] [Google Scholar]
- 25. Hertz RP, Unger AN, Cornell JA, Saunders E. Racial disparities in hypertension prevalence, awareness, and management. Arch Intern Med. 2005;165:2098–2104. [DOI] [PubMed] [Google Scholar]
- 26. Halperin RO, Sesso HD, Ma J, Buring JE, Stampfer MJ, Gaziano JM. Dyslipidemia and the risk of incident hypertension in men. Hypertension. 2006;47:45–50. [DOI] [PubMed] [Google Scholar]
- 27. Tohidi M, Hatami M, Hadaegh F, Azizi F. Triglycerides and triglycerides to high‐density lipoprotein cholesterol ratio are strong predictors of incident hypertension in Middle Eastern women. J Hum Hypertens. 2012;26:525–532. [DOI] [PubMed] [Google Scholar]
- 28. Golomb BA, Dimsdale JE, White HL, Ritchie JB, Criqui MH. Reduction in blood pressure with statins: results from the UCSD Statin Study, a randomized trial. Arch Intern Med. 2008;168:721–727. [DOI] [PMC free article] [PubMed] [Google Scholar]
- 29. Washburn RA, Adams LL, Haile GT. Physical activity assessment for epidemiologic research: the utility of two simplified approaches. Prev Med. 1987;16:636–646. [DOI] [PubMed] [Google Scholar]
- 30. Washburn RA, Goldfield SR, Smith KW, McKinlay JB. The validity of self‐reported exercise‐induced sweating as a measure of physical activity. Am J Epidemiol. 1990;132:107–113. [DOI] [PubMed] [Google Scholar]
- 31. Folsom AR, Yatsuya H, Nettleton JA, Lutsey PL, Cushman M, Rosamond WD; ARIC Study Investigators . Community prevalence of ideal cardiovascular health, by the American Heart Association definition, and relationship with cardiovascular disease incidence. J Am Coll Cardiol. 2011;57:1690–1696. [DOI] [PMC free article] [PubMed] [Google Scholar]
- 32. Hozawa A, Folsom AR, Sharrett AR, Chambless LE. Absolute and attributable risks of cardiovascular disease incidence in relation to optimal and borderline risk factors: comparison of African American with white subjects—Atherosclerosis Risk in Communities Study. Arch Intern Med. 2007;167:573–579. [DOI] [PubMed] [Google Scholar]
- 33. Richardson SI, Freedman BI, Ellison DH, Rodriguez CJ. Salt sensitivity: a review with a focus on non‐Hispanic blacks and Hispanics. J Am Soc Hypertens. 2013;7:170–179. [DOI] [PMC free article] [PubMed] [Google Scholar]
- 34. Scuteri A, Stuehlinger MC, Cooke JP, Wright JG, Lakatta EG, Anderson DE, Fleg JL. Nitric oxide inhibition as a mechanism for blood pressure increase during salt loading in normotensive postmenopausal women. J Hypertens. 2003;21:1339–1346. [DOI] [PubMed] [Google Scholar]
- 35. Kalinowski L, Dobrucki IT, Malinski T. Race‐specific differences in endothelial function: predisposition of African Americans to vascular diseases. Circulation. 2004;109:2511–2517. [DOI] [PubMed] [Google Scholar]
- 36. Najjar SS, Scuteri A, Shetty V, Wright JG, Muller DC, Fleg JL, Spurgeon HP, Ferrucci L, Lakatta EG. Pulse wave velocity is an independent predictor of the longitudinal increase in systolic blood pressure and of incident hypertension in the Baltimore Longitudinal Study of Aging. J Am Coll Cardiol. 2008;51:1377–1383. [DOI] [PMC free article] [PubMed] [Google Scholar]
- 37. Scuteri A, Orru M, Morrell C, Piras MG, Taub D, Schlessinger D, Uda M, Lakatta EG. Independent and additive effects of cytokine patterns and the metabolic syndrome on arterial aging in the SardiNIA Study. Atherosclerosis. 2011;215:459–464. [DOI] [PMC free article] [PubMed] [Google Scholar]
- 38. Weisbrod RM, Shiang T, Al Sayah L, Fry JL, Bajpai S, Reinhart‐King CA, Lob HE, Santhanam L, Mitchell G, Cohen RA, et al. Arterial stiffening precedes systolic hypertension in diet‐induced obesity. Hypertension. 2013;62:1105–1110. [DOI] [PMC free article] [PubMed] [Google Scholar]
- 39. Long DL, Howard G, Long DM, Judd S, Manly JJ, McClure LA, Wadley VG, Safford MM, Katz R, Glymour MM. An investigation of selection bias in estimating racial disparity in stroke risk factors. Am J Epidemiol. 2019;188:587–597. [DOI] [PMC free article] [PubMed] [Google Scholar]
- 40. Ahmad MI, Chevli PA, Barot H, Soliman EZ. Interrelationships Between American Heart Association’s Life’s Simple 7, ECG silent myocardial infarction, and cardiovascular mortality. J Am Heart Assoc. 2019;8:e011648 DOI: 10.1161/JAHA.118.011648. [DOI] [PMC free article] [PubMed] [Google Scholar]
Associated Data
This section collects any data citations, data availability statements, or supplementary materials included in this article.
Supplementary Materials
Tables S1–S8
Figures S1–S8