

Abstract
Aims
To assess the therapeutic potential of fatty acid synthase (FASN) inhibition with FT‐4101, a potent, selective, orally bioavailable, small‐molecule by (a) evaluating the dose−response of single FT‐4101 doses (3, 6 and 9 mg) on hepatic de novo lipogenesis (DNL) in healthy participants (Study 1) and (b) demonstrating the safety, tolerability and efficacy on hepatic steatosis after 12 weeks of FT‐4101 dosing in patients with non‐alcoholic fatty liver disease (NAFLD; Study 2).
Materials and Methods
In Study 1, three sequential cohorts of healthy men (n = 10/cohort) were randomized to receive a single dose of FT‐4101 (n = 5/cohort) or placebo (n = 5/cohort) followed by crossover dosing after 7 days. Hepatic DNL was assessed during fructose stimulation from 13C‐acetate incorporation. In Study 2, men and women with NAFLD (n = 14) randomly received 12 weeks of intermittent once‐daily dosing (four cycles of 2 weeks on‐treatment, followed by 1 week off‐treatment) of 3 mg FT‐4101 (n = 9) or placebo (n = 5). Steady‐state DNL based on deuterated water labelling, hepatic steatosis using magnetic resonance imaging‐proton density fat fraction and sebum lipids and circulating biomarkers were assessed.
Results
Single and repeat dosing of FT‐4101 were safe and well tolerated. Single FT‐4101 doses inhibited hepatic DNL dose‐dependently. Twelve weeks of 3 mg FT‐4101 treatment improved hepatic steatosis and inhibited hepatic DNL. Decreases in sebum sapienate content with FT‐4101 at week 11 were not significant compared to placebo and rebounded at week 12. Biomarkers of liver function, glucose and lipid metabolism were unchanged.
Conclusions
Inhibition of FASN with 3 mg FT‐4101 safely reduces hepatic DNL and steatosis in NAFLD patients.
Keywords: drug development, drug mechanism, fatty liver disease, pharmacodynamics, phase I−II study, randomized trial
1. INTRODUCTION
The pathogenesis of non‐alcoholic fatty liver disease (NAFLD) and the progression from benign hepatic steatosis to non‐alcoholic steatohepatitis (NASH), a more severe form of NAFLD, is complex and not entirely understood. Accumulating evidence points towards hepatic de novo lipogenesis (DNL) as a key mediator in the development of NASH. 1 DNL is a fundamental biosynthetic pathway that is integrated in the regulation of energy metabolism and is part of a complex metabolic network in the liver, 2 particularly in the setting of insulin resistance, 3 contributing newly synthesized fatty acids to stored and circulating lipids. 4 Under healthy conditions hepatic DNL activity is minor, but in NAFLD it is elevated and represents a considerable source of liver and circulating lipids. 4 , 5 The intrahepatic metabolic milieu associated with high activity of DNL (eg, increased availability of malonyl‐CoA and glycolytic metabolites) also promotes re‐esterification rather than oxidation of incoming free fatty acids by the liver, which can further exacerbate hepatic fat accumulation. DNL‐derived lipids may also contribute to the accumulation of fatty acid metabolites causing lipotoxic hepatocellular injury 6 and the upregulation of inflammatory pathways. 7 , 8 Reducing hepatic DNL could therefore be an attractive treatment target for NASH.
Inhibitors of lipogenic enzymes such as acetyl Co‐A carboxylase (ACC) and fatty acid synthase (FASN) are currently in clinical development for NASH. 9 , 10 , 11 , 12 ACC catalyses the carboxylation of acetyl‐CoA to malonyl‐CoA, the rate‐limiting step in fatty acid synthesis. Several ACC inhibitors demonstrate dose‐dependent DNL inhibition, stimulation of fatty acid oxidation and improvements in hepatic steatosis and fibrosis markers in a clinical setting. 9 , 10 , 11 , 13 , 14 Additionally, ACC and DNL inhibition in hepatic stellate cells reduced profibrogenic activity, collagen production and fibrosis, indicating a direct role of DNL in hepatic stellate cell activation. 15 Unexpected safety issues, however, such as elevated circulating triglycerides (TGs) and reductions in platelet count observed with certain ACC inhibitors have impacted their clinical development. 10 , 11 , 16 , 17
Another key enzyme in the DNL pathway, FASN, catalyses the final step of DNL, converting acetyl‐CoA and malonyl‐CoA to palmitate. FASN gene expression level is elevated in NAFLD patients 18 and preliminary clinical data demonstrate DNL inhibition with FASN inhibition in subjects with metabolic syndrome without elevating circulating TGs. 12 Therefore, modulation of FASN offers a compelling approach for the treatment of NASH, although on‐target safety risks, such as dry skin and alopecia 12 associated with systemic FASN‐mediated DNL inhibition are of concern.
FT‐4101, a potent, selective, orally bioavailable, small molecule that inhibits FASN enzymatic activity by specifically targeting the ketoreductase domain of the enzyme is currently being investigated as a potential treatment for NASH. Lead optimization efforts were enabled by a co‐crystal structure of an early lead compound bound to the ketoreductase domain of human FASN, and ultimately yielded the identification of FT‐4101. In an enzymatic assay, FT‐4101 inhibited the human FASN activity with a half‐maximal inhibitory concentration (IC50) of 40 nM and, in cultured human hepatocytes using isotope‐labelled acetate, FT‐4101 was found to inhibit DNL with an IC50 of 23 nM. FT‐4101 was evaluated for non‐selective binding and inhibition across a diverse panel of 44 rat and human receptors, ion channels and enzymes at a single 10 μM concentration. FT‐4101 only showed an effect against the 5‐HT2B receptor, where the measured agonist and antagonist IC50 values were 15 and 5.8 μM, respectively. FT‐4101 was evaluated in the KINOMEscan™ screening platform to examine the potential interactions between FT‐4101 and 97 diverse human kinase enzymes. FT‐4101 showed relatively weak activity for kinase FLT3 (IC50 = 3.7 μM, 200 μM ATP concentration) and was very weak or inactive against all other kinases tested (IC50 > 10 μM).
In the present paper, we describe data from two clinical trials of FT‐4101. The first phase 1 study established the dose−response of single oral doses of FT‐4101 on hepatic DNL inhibition in a healthy population, and the second phase 1/2 study evaluated safety, tolerability and efficacy on hepatic steatosis with 12 weeks of intermittent FT‐4101 dosing in an NAFLD population. An intermittent dose regime of alternating 2 weeks on‐treatment and 1 week off‐treatment was selected for this study to reduce the risk of adverse effects due to chronic non‐hepatic DNL inhibition such as dry eye, dry skin, and alopecia.
2. MATERIALS AND METHODS
2.1. Study design
2.1.1. Study 1
This phase 1, randomized, double‐blind, placebo‐controlled, single‐centre, three‐cohort, crossover study evaluated target engagement of single oral doses of FT‐4101 by measuring hepatic DNL using fructose administration and 13C1‐acetate infusion. 19 Safety and pharmacokinetic (PK) variables were assessed as secondary objectives. Three cohorts of 10 participants each were enrolled sequentially, and randomly assigned to receive a single dose of FT‐4101 (n = 5) or placebo (n = 5) followed by crossover dosing after a 7‐day washout period. Participants in cohorts 1, 2 and 3 received 3, 6 and 9 mg FT‐4101 doses, respectively. Placebo capsules matched all the active capsules in size and colour. A dose escalation algorithm based on safety, PK and pharmacodynamic (PD) data from cohort 1 was used to decide doses for cohorts 2 and 3. Participants were admitted to the clinic from day −2 until day 2 to receive the first treatment assignment (Day 1) and returned 4 days later for a second inpatient visit (from Day 6 until Day 9) for the opposite treatment assignment (Day 8). Participants returned for an end‐of‐study visit on Day 14 and underwent the same procedures during the two inpatient visits. Participants received standardized meals for 2 days prior to drug administration to ensure metabolic steady state. After the evening meal on Day −1 and Day 7, participants started fasting (except water) and a continuous intravenous infusion of sodium 1‐13C1‐acetate was commenced (~3 hours post‐evening meal) to establish sufficient labelling of hepatic acetyl‐CoA for the measurement of hepatic fractional DNL. 19 , 20 , 21 On Days 1 and 8 (~9 hours after the start of the acetate infusion), participants received the assigned treatment, followed 1 hour later by the oral administration of fructose solutions (0.25 g fructose/kg body weight) every 30 minutes for 9.5 hours (20 fructose doses) to maximally and reproducibly stimulate hepatic DNL. 19 The acetate infusion was discontinued 12 hours post treatment. Safety, PK and PD assessments were performed during the inpatient period and participants were discharged after an overnight observation on Days 2 and 9. Randomization lists were generated by a designated unblinded statistician. The sample size chosen was based on typical cohort sizes for exploratory studies of DNL in humans. 5 , 9
2.1.2. Study 2
Patients with NAFLD included in this phase 1/2, double‐blind, multicentre study were randomized (2:1) to receive 3 mg FT‐4101 (n = 9) or placebo (n = 5) for 12 weeks (ClinicalTrials.gov NCT04004325). Placebo capsules matched active capsules in size and colour. Participants received four cycles of treatment during the 12 weeks. Each cycle consisted of participants receiving oral FT‐4101 or placebo once a day for 2 weeks, followed by 1 week of no treatment. Accordingly, treatment was administered during weeks 1 to 2, 4 to 5, 7 to 8 and 10 to 11, and treatment was withheld in weeks 3, 6, 9 and 12. Participants consumed 70% deuterated water (2H2O) 3 × 50 mL daily for 7 days before (week −2) and during (week 10) treatment to measure the time‐integrated DNL contribution to liver and sebum fatty acids over the 2‐week labelling period. Safety, tolerability and percent changes from baseline in hepatic fat determined by magnetic resonance imaging (MRI)‐proton density fat fraction (PDFF) at week 12 were the primary endpoints. Secondary and exploratory endpoints included the PK profile, percent change from baseline in MRI‐PDFF at week 6, percentage of participants with a relative MRI‐PDFF reduction of ≥30% at week 12, percent changes from baseline in circulating biomarkers of liver inflammation, glucose and lipid metabolism, hepatic and sebum DNL, sebum sapienate content, and sebum production. Randomization lists were generated by a designated unblinded statistician. The sample size was empirically determined to assess the safety of the dose and characterize the PK profile.
2.2. Dose selection
Nonclinical studies with FT‐4101 identified skin and eye effects as potential on‐target risks. Dose selection for Study 2 was identified based on safety results obtained from two previously completed multiple‐ascending‐dose trials (unpublished) in healthy volunteers receiving once daily oral doses of FT‐4101. In summary, administration of 9 mg FT‐4101 once daily for 14 days was tolerated, while 27 mg FT‐4101 once daily for 14 days was not, based on observed skin effects (dry skin and alopecia). Lower doses were then evaluated to reduce the risk of adverse skin effects with prolonged dosing. Administration of 3 mg FT‐4101 once daily for 28 days was safe while 4.5 and 6 mg FT‐4101 once daily treatment for 28 days resulted in mild skin effects (dry skin and alopecia). All adverse events (AEs) resolved after FT‐4101 discontinuation. No adverse effects on platelet counts were observed in any of the dosing cohorts. For Study 2, the 3 mg FT‐4101 dose was identified based on its previously observed safety profile and an empiric treatment interruption schedule was applied to reduce the potential risk of ≥ grade 2 adverse on‐target effects (dry skin, dry eye and alopecia) with chronic treatment.
2.3. Participants
Study protocols were approved by independent institutional review boards and conducted in compliance with the Declaration of Helsinki, Good Clinical Practice guidelines, and local regulatory requirements. All participants provided written informed consent. Study 1 was conducted at Celerion (Tempe, Arizona) from 15 June 2017 (first participant first visit) to 22 September 2017 (last participant last visit) and Study 2 was conducted at ProSciento (Chula Vista, California) and Catalina Research Institute (Montclair, California) from 11 June 2019 to 20 January 2020.
2.3.1. Study 1
Healthy men (age 18−55 years, body mass index [BMI] 25−32 kg/m2 and body weight 50−100 kg) were enrolled. Exclusion criteria included history or presence of clinically significant abnormalities (eg, haematological, renal, pulmonary, hepatic, skin, eye, alopecia, or allergic conditions), fasting serum cholesterol >10.35 mmol/L (400 mg/dL), TG >5.65 mmol/L (500 mg/dL), platelet count <150 000 mL3 and glycated haemoglobin (HbA1c) ≥48 mmol/mol (6.5%).
2.3.2. Study 2
Men and women (age 18−75 years, BMI 25−45 kg/m2) with NAFLD (MRI‐PDFF ≥10%) were enrolled. People with type 2 diabetes were eligible if they had HbA1c <75 mmol/mol (9%), fasting plasma glucose <13.3 mmol/L (240 mg/dL) and were on a stable treatment with diet and exercise and/or metformin (7‐day washout of sulphonylureas was allowed, insulin therapy was excluded). Exclusion criteria included: type 1 diabetes, Model for End‐stage Liver Disease (MELD) score ≥ 10, FibroSURE result >0.75, diabetic complications, chronic liver diseases other than NAFLD, chronic skin and eye conditions and alopecia, alanine aminotransferase >5 times and total bilirubin >1 times the upper limit of normal, fasting serum TG level >3.39 mmol/L (300 mg/dL), and platelet count <100 000 mL3.
2.4. Assessments
Safety assessments consisted of physical examinations, vital signs measurements, clinical laboratory tests, 12‐lead electrocardiogram (ECG) and evaluation of AEs. Plasma FT‐4101 concentrations were measured using a validated high‐performance liquid chromatography‐tandem mass spectrometry method (Charles River Laboratories, Inc., Worcester, Massachusetts and KCAS LLC, Shawnee, Kansas). MRI was used to assess hepatic steatosis (PDFF) and liver volume (Antaros Medical, Mölndal, Sweden). Sebum for DNL (University of California, Berkeley, California) and sapienate content analyses (Metabolon Inc, Morrisville, North Carolina) was collected using Sebutape® (CuDerm Corp., Dallas, Texas). The amount of sebum produced was assessed using a sebumeter SM 815 (Courage + Khazaka Electronic GmbH, Cologne, Germany). Blood samples for liver function biomarkers, glucose and lipid metabolism were analysed by a central laboratory (Cenetron, Austin, Texas). Details of the methods used are described in the Supplementary Appendix.
2.5. Statistical analysis and calculations
Safety populations included all participants who received any study treatment. PK values were determined using non‐compartmental methods (Phoenix WinNonlin® 8.0). The maximum observed plasma concentration (Cmax) and time to reach Cmax (Tmax) were taken directly from the individual's data. The linear‐log trapezoidal method was used to calculate the area under the concentration−time curve (AUC0‐6 and AUC0‐30). In Study 1, fructose‐stimulated DNL was calculated by subtracting the pre‐fructose DNL value (average of −0.5, 0 and 0.5 hour DNL values) from each post‐fructose DNL value 19 and percent DNL inhibition was calculated as:
The DNL inhibition between doses was compared using a one‐way ANOVA with Bonferroni correction. In Study 2, total liver fat index was calculated by multiplying PDFF times liver volume and changes in PD variables were evaluated using paired t‐tests (within‐group comparison), unpaired t‐tests (two‐group comparison) or one‐way ANOVA with Bonferroni correction (multiple timepoint comparison). Simple linear regression was used to evaluate the relationship between changes in DNL and MRI‐PDFF. Data are mean ± SD unless stated otherwise.
3. RESULTS
3.1. Participant characteristics and disposition
For Study 1, 30 healthy men were randomized to study treatment and 29 completed the study (Supplementary Figure S1). Participant characteristics were comparable between cohorts (Table 1). The participants (n = 29) were overweight or obese, but otherwise healthy, with a mean (range) age, weight, and BMI of 37 years (20−53), 83.2 kg (61.8−98.4), 28.1 kg/m2 (25.1−31.9), respectively.
TABLE 1.
Participant characteristics and demographics at baseline (Study 1 and 2) and after 12 weeks of treatment (Study 2)
| Characteristic | Study 1 (Single dose) | Study 2 (Multiple dose) | |||||
|---|---|---|---|---|---|---|---|
| Cohort 1 (n = 10) | Cohort 2 (n = 9) | Cohort 3 (n = 10) | 3 mg FT‐4101 (n = 9) | Placebo (n = 5) | |||
| Baseline | Baseline | Baseline | Baseline | Week 12 | Baseline | Week 12 | |
| Male, n (%) | 10 (100) | 9 (100) | 10 (100) | 2 (22) | 3 (60) | ||
| White race, n (%) | 10 (100) | 8 (89) | 9 (90) | 9 (100) | 5 (100) | ||
| Hispanic or Latino, n (%) | 9 (90) | 7 (78) | 9 (90) | 8 (89) | 5 (100) | ||
| Type 2 diabetes, n (%) | 0 (0) | 0 (0) | 0 (0) | 2 (22) | 2 (40) | ||
| Age, years | 39 ± 9 | 34 ± 12 | 38 ± 8 | 44 ± 11 | 47 ± 16 | ||
| Weight, kg | 78.2 ± 10.8 | 84.9 ± 5.0 | 86.1 ± 6.8 | 94.2 ± 18.0 | 94.7 ± 19.2 | 91.8 ± 6.8 | 93.2 ± 6.8 |
| BMI, kg/m2 | 27.5 ± 2.2 | 28.0 ± 1.7 | 28.4 ± 1.8 | 35.7 ± 5.3 | 35.9 ± 5.8 | 33.1 ± 4.2 | 33.6 ± 4.5 |
| Glucose, mmol/L | 5.2 ± 0.3 | 5.2 ± 0.2 | 5.1 ± 0.3 | 6.2 ± 1.5 | 6.6 ± 2.3 | 6.9 ± 2.4 | 7.4 ± 3.0 |
| HbA1c, % | 5.3 ± 0.3 | 5.4 ± 0.3 | 5.5 ± 0.3 | 6.2 ± 1.0 | 6.1 ± 1.1 | 6.3 ± 1.3 | 6.8 ± 2.0 |
| Insulin, pmol/L | 164 ± 46# | 173 ± 76 | 94 ± 32 | 122 ± 81 | |||
| HOMA‐IR | 6.5 ± 2.1 | 7.4 ± 3.9 | 4.3 ± 2.2 | 6.1 ± 5.7 | |||
| Total cholesterol, mmol/L | 5.6 ± 1.4 | 4.2 ± 0.7* | 4.9 ± 0.9 | 4.4 ± 1.2 | 4.3 ± 0.9 | 5.5 ± 0.6 | 5.1 ± 1.0 |
| LDL cholesterol, mmol/L | 3.8 ± 1.2 | 2.7 ± 0.6* | 3.3 ± 0.8 | 2.6 ± 0.7## | 2.5 ± 0.7 | 4.0 ± 0.8 | 3.4 ± 1.0 |
| HDL cholesterol, mmol/L | 1.3 ± 0.4 | 1.1 ± 0.2 | 1.2 ± 0.3 | 1.3 ± 0.2 | 1.2 ± 0.2 | 1.1 ± 0.2 | 1.0 ± 0.1 |
| Triglycerides, mmol/L | 1.8 ± 1.4 | 1.3 ± 0.6 | 1.7 ± 0.7 | 2.4 ± 2.5 | 2.0 ± 1.4 | 2.2 ± 0.7 | 2.9 ± 0.9 |
| ALT, U/L | 21.7 ± 8.1 | 24.2 ± 13.2 | 25.8 ± 12.5 | 31.9 ± 14.4 | 30.8 ± 11.0 | 19.4 ± 5.9 | 23.6 ± 10.6 |
| AST, U/L | 18.3 ± 4.3 | 18.1 ± 4.5 | 20.6 ± 5.4 | 22.8 ± 6.3 | 23.0 ± 5.9 | 17.2 ± 4.7 | 18.6 ± 3.9 |
| ALP, U/L | 77.2 ± 25.2 | 73.0 ± 19.1 | 74.1 ± 16.6 | 62.6 ± 23.2 | 66.4 ± 24.6 | 67.2 ± 5.1 | 74.6 ± 18.8 |
| GGT, U/L | 30.5 ± 21.5 | 30.2 ± 20.2 | 26.8 ± 9.4 | 40.2 ± 28.0 | 42.0 ± 30.2 | 26.6 ± 0.1 | 30.8 ± 11.1 |
| Bilirubin, μmol/L | 10.6 ± 5.6 | 8.9 ± 4.5 | 10.3 ± 2.5 | 8.7 ± 3.2 | 8.0 ± 2.4 | 7.2 ± 1.7 | 5.3 ± 1.2 |
| BUN, mmol/L | 4.5 ± 0.8 | 3.6 ± 1.0 | 4.1 ± 1.2 | 4.2 ± 1.4 | 4.2 ± 0.5 | 5.1 ± 2.0 | 4.9 ± 1.2 |
| Platelet count, 109/L | 224 ± 40 | 203 ± 32 | 235 ± 43 | 280 ± 59 | 309 ± 69 | 292 ± 70 | 322 ± 79 |
| Systolic BP, mmHg | 118 ± 16 | 118 ± 6 | 117 ± 6 | 116 ± 19 | 119 ± 16 | 123 ± 15 | 125 ± 14 |
| Diastolic BP, mmHg | 76 ± 11 | 77 ± 5 | 77 ± 6 | 75 ± 10 | 77 ± 9 | 82 ± 12 | 78 ± 14 |
| MRI‐PDFF, % | 20.1 ± 7.0 | 16.7 ± 7.0 $ | 17.5 ± 8.0 | 21.7 ± 8.4 $ | |||
| FibroScan CAP, dB/m | 326 ± 25 | 333 ± 30 | 344 ± 32 | 335 ± 65 | |||
| FibroScan liver stiffness measure, kPa | 6.5 ± 1.5 | 6.3 ± 2.9 | 6.8 ± 1.8 | 5.7 ± 1.6 | |||
| Liver volume, L | 1.95 ± 0.28 | 1.91 ± 0.20 | 2.04 ± 0.26 | 2.16 ± 0.35 | |||
| Total Liver Fat Volume Index, L | 0.37 ± 0.13 | 0.33 ± 0.15 | 0.36 ± 0.18 | 0.48 ± 0.24 $ | |||
| Liver Fibrosis Score (FibroSURE) | 0.133 ± 0.125 | 0.128 ± 0.119 | 0.088 ± 0.028 | 0.060 ± 0.035 | |||
Note: Results are mean ± SD. Blood measurements were performed after an overnight fast. Baseline group differences were assessed using one‐way ANOVA with Bonferroni correction (Study 1) and unpaired t‐tests (Study 2).
Abbreviations: ALP, alkaline phosphatase; ALT, alanine aminotransferase; AST, aspartate aminotransferase; BMI, body mass index; BP, blood pressure; BUN, blood urea nitrogen; CAP, controlled attenuation parameter; GGT, gamma‐glutamyl transferase; HbA1c, glycated haemoglobin; HOMA‐IR, homeostatic model assessment of insulin resistance; MRI‐PDFF, magnetic resonance imaging‐proton density fat fraction.
Baseline value significantly different (P < 0.05) versus cohort 1.
P < 0.05 and ## P < 0.01 indicating significantly different from placebo at baseline.
P < 0.05 indicates that the week 12 value is significantly different compared to the baseline value within each group.
In Study 2, nine randomized participants received 3 mg FT‐4101 and five received placebo (Supplementary Figure S1). All participants completed the study. Participant baseline characteristics were similar in the two treatment groups; except for insulin and LDL cholesterol (Table 1). All participants were obese, White and had elevated liver fat (MRI‐PDFF of 20.0 ± 7.0% for the FT‐4101 group and 17.5 ± 8.0% for the placebo group; nonsignificant), and two subjects in each group had type 2 diabetes (22% in the FT‐4101 group and 40% in the placebo group). Participants had early or no fibrosis according to FibroScan liver stiffness measure and FibroSURE results.
3.2. Safety
Single (3, 6 and 9 mg) and 12 weeks of intermittent (3 mg) oral dosing of FT‐4101 was safe and well tolerated. There were no deaths, no serious or other significant AEs and no discontinuations due to AEs in either study. All reported AEs resolved spontaneously. In Study 1, a total of 76 treatment‐emergent AEs (TEAEs; 69 unrelated, one unlikely related and six possibly related to treatment) were experienced by 26 participants (90%), of which 73 were mild and three were moderate in intensity. Number of subjects with TEAEs was similar for subjects receiving FT‐4101 (n = 23/29) or placebo (n = 25/30). Diarrhoea was the most common event and similarly reported for FT‐4101 and placebo treatments and considered to be related to large fructose administration (Supplementary Table S1). 9 , 19 In Study 2, there were six participants with TEAEs (three treated with FT‐4101 and three treated with placebo). Four of the nine reported TEAEs were considered drug‐related, of which two were related to FT‐4101 and two were related to placebo (Supplementary Table S2). All drug‐related TEAEs were mild. There were no clinically meaningful changes in ECG, clinical laboratory results, physical examinations, or vital signs.
3.3. Pharmacokinetics
FT‐4101 was rapidly absorbed with a mean Tmax of less than 2 hours post‐dose and a terminal half‐life ranging from 14.4 to 15.7 hours (Figure 1). Exposure, as measured by AUC and Cmax, increased in a dose‐proportional fashion. Following multiple doses in NASH patients, the AUC accumulation ratios were compared from pre‐dose to 6 hours post‐dose as PK samples were only collected up to 6 hours on Cycle 1, Day 1. A mean accumulation ratio of 2 was demonstrated for both Cmax and AUC0‐6h. Inter‐participant variability for Cmax and AUC0‐t was moderate (<40% coefficient of variation) for both studies.
FIGURE 1.
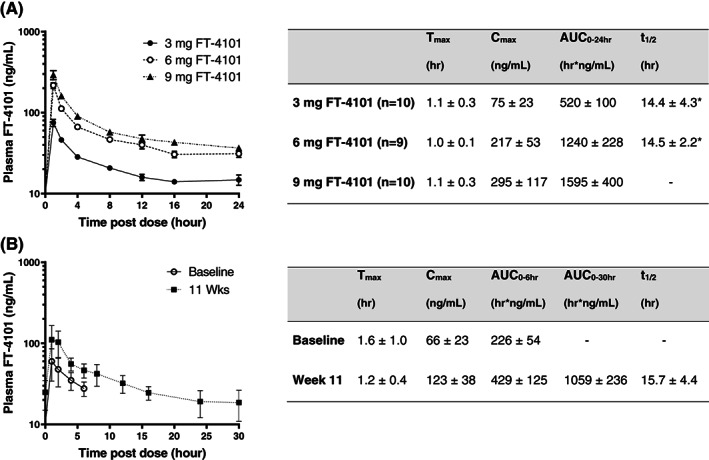
Plasma concentration−time profiles and pharmacokinetic characteristics of FT‐4101 following A, single oral doses and B, before and after intermittent repeat dosing for 11 weeks. Data (n = 9) for Study 2 were collected after the first dose of FT‐4101 at baseline (Cycle 1, Day 1) and after the last dose at week 11 (Cycle 4, Day 14). *Data based on n = 2. Data are mean ± SEM in the figures and mean ± SD in the accompanying tables. AUC, area under the concentration−time curve; Cmax, maximum observed plasma concentration; Tmax, time to reach Cmax
3.4. Hepatic DNL
In healthy participants, fractional hepatic DNL increased from pre‐fructose levels by ~25% with fructose stimulation and was dose‐dependently inhibited with single oral doses of FT‐4101 (Figure 2A‐C). Single oral doses of 3, 6 and 9 mg FT‐4101 achieved fructose‐stimulated DNL inhibition of 17.6 ± 17.7% (nonsignificant vs. placebo), 41.8 ± 21.9% (P = 0.01 vs. placebo) and 68.4 ± 18.2% (P < 0.0001 vs. placebo), respectively (Figure 2D). In participants with NAFLD, steady‐state hepatic DNL after 14 days of deuterated water labelling at pre‐treatment baseline was 44.2 ± 11.1% for FT‐4101 (Figure 3A) and 39.3 ± 5.7% for placebo (Figure 3B). After 11 weeks of intermittent treatment, steady‐state hepatic DNL decreased to 39.1 ± 14.4% for FT‐4101 (P = 0.11 vs. baseline) and increased to 45.4 ± 4.8% for placebo (P = 0.06 vs. baseline). This resulted in a significant treatment difference for DNL inhibition; percent change from baseline was 16.3 ± 12.8% for placebo versus −12.0 ± 20.9% for FT‐4101 (P = 0.012; Figure 3C).
FIGURE 2.
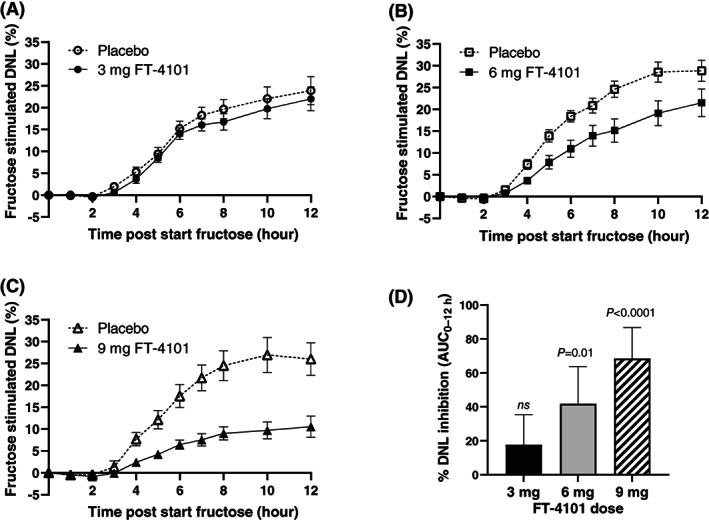
Time‐course of fructose stimulated de novo lipogenesis (DNL) following single oral doses of A, 3 mg FT‐4101, B, 6 mg FT‐4101, C, 9 mg FT‐4101 or placebo. Fructose stimulated DNL represents the fraction of newly synthesized palmitate in plasma triglycerides, corrected for pre‐fructose DNL values and measured during short‐term 1‐13C1 acetate labelling. D, Percent DNL inhibition was calculated using the fructose stimulated area under the concentration−time curve (AUC)0‐12h. Data are mean ± SEM (A‐C) and mean ± SD (D)
FIGURE 3.
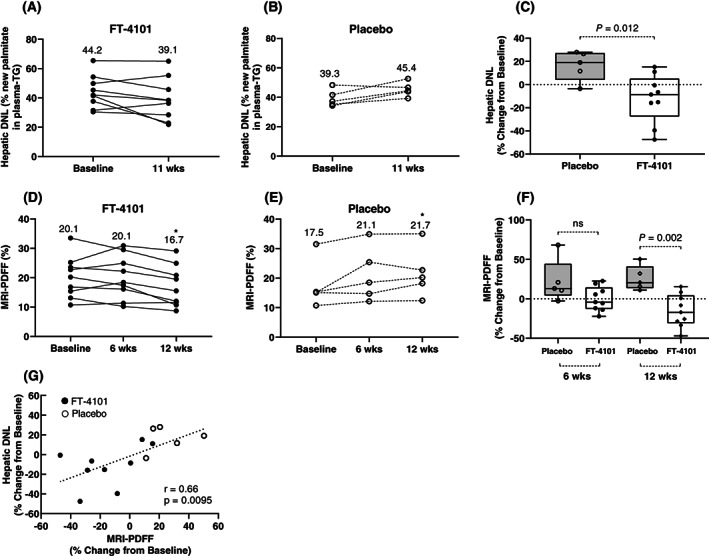
Repeat dosing of 3 mg FT‐4101 inhibits hepatic de novo lipogenesis (DNL) and steatosis in subjects with non‐alcoholic fatty liver disease. Hepatic DNL represents the steady‐state fraction of newly synthesized palmitate in fasting plasma triglycerides measured after 2 weeks deuterated water labelling. Individual hepatic DNL measured at baseline and in responses to 11 weeks of A, 3 mg FT‐4101 or B, placebo intermittent treatment. Individual magnetic resonance imaging (MRI)‐proton density fat fraction (PDFF) measured at baseline and in responses to 6 and 12 weeks of D, 3 mg FT‐4101 or E, placebo intermittent treatment. Percent change from baseline in hepatic DNL (C) and MRI‐PDFF (F) after repeat intermittent dosing with placebo or 3 mg FT‐4101. G, Relationship between percent changes in steady‐state hepatic DNL and hepatic steatosis (MRI‐PDFF) after 11 to 12 weeks of placebo and FT‐4101 treatment. The box plots provide medians with 25% and 75% quartiles and minimum and maximum values as whiskers. Linear regression was used to evaluate the relationship between DNL and MRI‐PDFF. Round symbols are individual values and values in panels A‐D are means. *P = 0.05 versus baseline (week 0)
3.5. Hepatic steatosis
In participants with NAFLD, MRI‐PDFF increased from 17.5% ± 8.0% at baseline to 21.7% ± 8.4% at week 12 (P < 0.05) with repeat dosing of placebo and decreased from 20.1 ± 7.0 at baseline to 16.7 ± 7.0 at week 12 (P < 0.05) with FT‐4101 (Figure 3D,E and Table 1). There were no changes in observed MRI‐PDFF values from baseline to week 6 (Figure 3D and E). Overall, there was a 41% difference in percent change from baseline in MRI‐PDFF between the FT‐4101 and placebo responses at week 12 (26.0% ± 15.7% for placebo vs. −15.1% ± 20.7% for FT‐4101; P = 0.002 [Figure 3F]). The percent change from baseline at week 6 was not significant (22.1% ± 27.2% for placebo vs. −0.03% ± 15.4% for FT‐4101; nonsignificant). Similar results were observed for liver fat index which considers potential changes in liver volume over time (Table 1). Six out of the 9 participants in the FT‐4101 group had reduced liver fat at week 12 compared to baseline (Figure 3D) but only 2 of the 9 (22%) participants treated with FT‐4101 and no participants treated with placebo achieved ≥30% relative reduction in MRI‐PDFF at week 12 (nonsignificant). The percent changes in MRI‐PDFF at week 12 were significantly correlated with percent changes in steady‐state hepatic DNL measured at week 11 (r = 0.66, P = 0.0095 [Figure 3G]).
3.6. Sebum variables
Changes in sebum lipid variables were measured to evaluate potential on‐target safety effects of FT‐4101 on skin lipids. Total sebum secretion did not significantly change after 12 weeks of 3 mg FT‐4101 or placebo treatments. Percent changes from baseline were −8% ± 39% for placebo versus −4% ± 44% for FT‐4101 at week 11 (nonsignificant) and −11% ± 18% for placebo versus −33% ± 49% for FT‐4101 at week 12 (nonsignificant). A small but non‐significant reduction from baseline in sebum sapienate content with FT‐4101 treatment was observed at week 11 but not week 12 (Figure 4B). The percent changes from baseline for this variable were not significantly different between FT‐4101 and placebo at either week 11 or 12 (Figure 4C). Sebum sapienate was almost completely derived from the DNL pathway as indicated by fractional sebum DNL results of 95% ± 3% for the FT‐4101 group and 95% ± 7% for the placebo cohort (nonsignificant). Treatment had no effect on the fractional DNL contribution to sebum sapienate.
FIGURE 4.
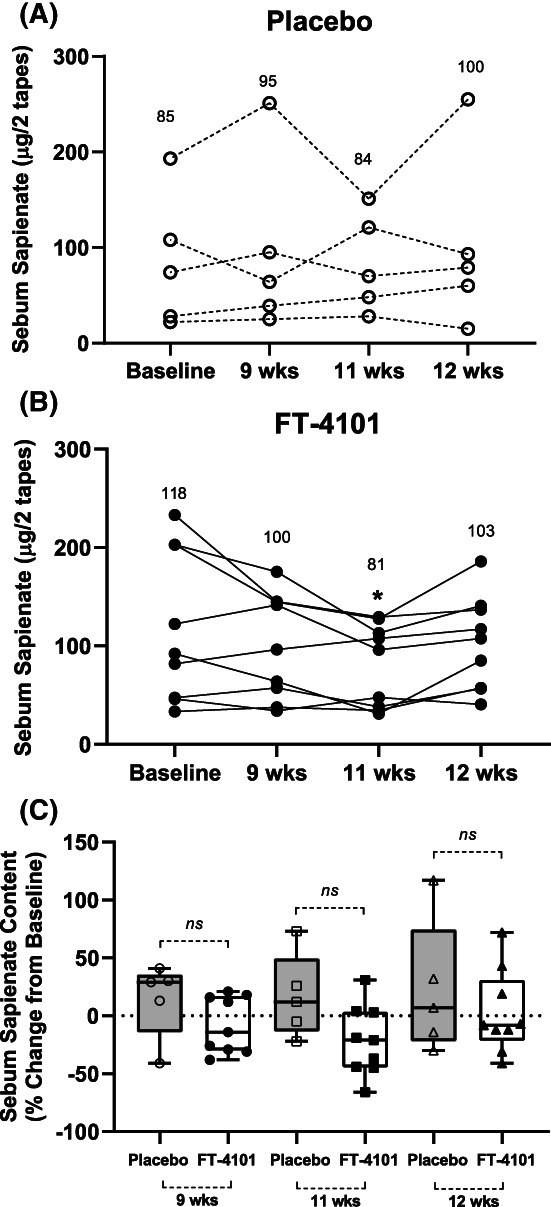
Effect of intermittent repeat dosing of A, placebo and B, 3 mg FT‐4101 on sebum sapienate content of individuals with non‐alcoholic fatty liver disease and C, percent change from baseline in sebum sapienate content with FT‐4101 compared to placebo. *P = 0.098 versus baseline (week 0). The box plots provide medians with 25% and 75% quartiles and minimum and maximum values as whiskers. Values in panels A‐B are means
3.7. Body weight and circulating biomarkers
FT‐4101 did not change weight, BMI, or any circulating biomarkers throughout Study 2, including fasting plasma TG and platelet concentrations (Table 1). Individual fasting plasma TG concentrations throughout the study and percent change from baseline in plasma TG at week 11 and week 12 are presented in Figure 5.
FIGURE 5.
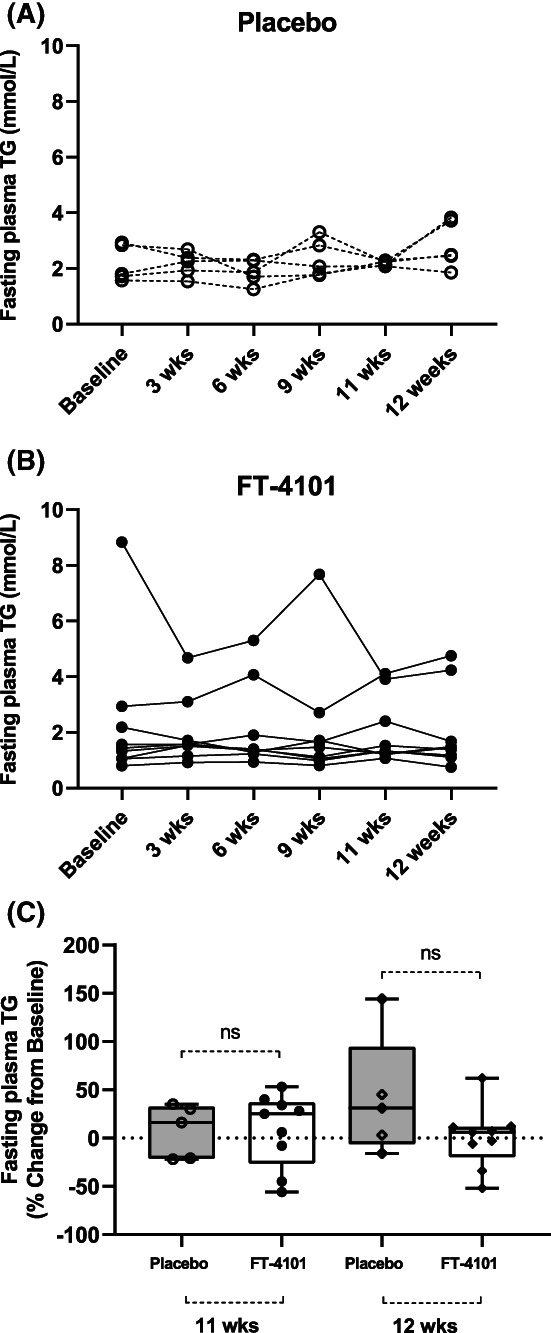
Effect of intermittent repeat dosing of A, placebo and B, 3 mg FT‐4101 on fasting plasma triglycerides (TG) of individuals with non‐alcoholic fatty liver disease and C, percent change from baseline in fasting plasma TG with FT‐4101 compared to placebo. The box plots provide medians with 25% and 75% quartiles and minimum and maximum values as whiskers
4. DISCUSSION
In the present study, we describe the results of two clinical trials investigating FT‐4101, a potent, selective, orally bioavailable, small‐molecule inhibitor of FASN, intended for the treatment of NASH. A phase 1 study in healthy participants was first carried out to establish the degree of hepatic DNL inhibition with single oral doses of FT‐4101. A subsequent phase 1/2 study was performed to assess the safety, tolerability, and efficacy on hepatic steatosis after 12 weeks of intermittent treatment with 3 mg FT‐4101 in an NAFLD population.
Oral administration of FT‐4101was safe and well tolerated. PK profiles were similar in healthy participants and those with NAFLD, and plasma FT‐4101 concentrations increased rapidly and proportionally following single doses, with a half‐life of ~15 hours, and an AUC accumulation ratio of 2 supported once‐daily dosing in the phase 1/2 study.
Single doses of FT‐4101 dose‐dependently inhibited hepatic DNL, with the highest dose of 9 mg inhibiting DNL by 68%. Similar DNL inhibition was observed with single (12%) and repeat (18%) dosing of 3 mg FT‐4101. Dose‐dependent DNL inhibition has been demonstrated with other direct inhibitors of DNL9, 11, 12, 13 but results have not always been consistent when evaluating single‐ versus multiple‐dosing regimens. 5 , 9 In a previous study, a single dose of 20 mg GS‐0976, an ACC inhibitor, reduced fructose‐stimulated DNL by 70% in a healthy population 9 while steady‐state DNL decreased by 22% only with repeat dosing in NASH subjects. 5
Partial inhibition of FASN with 12 weeks of repeat dosing of 3 mg FT‐4101 resulted in a small but significant reduction in hepatic steatosis as measured by MRI‐PDFF (relative change of −15%). The effects of 3 mg FT‐4101 on hepatic DNL and steatosis were of a similar magnitude and correlated significantly, confirming that the improvement in liver fat burden was driven by changes in hepatic DNL with FT‐4101. Twenty two percent of the participants achieved a relative MRI‐PDFF reduction of ≥30% with repeat dosing of 3 mg FT‐4101, which is considered clinically relevant 22 compared to 43% of NAFLD patients receiving 20 mg GS‐0976 for 12 weeks. 5 A recent publication describing a different FASN inhibitor also reported dose‐dependent DNL reductions in a small group of subjects. 12 In that study, 50‐, 100‐ and 150‐mg daily dosing of TVB‐2640 for 10 days resulted in 23%, 65%, 77% DNL inhibition, respectively, and changes in hepatic DNL were correlated with changes in hepatic fat. The reductions in liver fat with 3 mg FT‐4101 were small and higher doses and/or longer treatment with FT‐4101 using an intermittent schedule are likely needed to achieve greater clinical meaningful benefits. However, it is unknown if this approach will be effective without unacceptable on‐target AEs. Nonetheless, results with FT‐4101 and TVB‐2640 demonstrate that FASN inhibition can robustly improve hepatic steatosis through DNL inhibition.
The basis for intermittent FT‐4101 dosing was to minimize anticipated safety issues with systemic (dry skin, dry eye and alopecia) and liver (plasma TG increases) DNL inhibition and was selected based on data from a previously completed multiple‐ascending‐dose study demonstrating a safe profile of 3 mg FT‐4101 administered daily for 28 days in healthy obese adult volunteers. Recent studies in rodents and humans describe an increase in circulating TG with ACC inhibition, despite reductions in hepatic DNL and hepatic steatosis. 11 , 16 , 23 FASN and DNL inhibition with FT‐4101 did not result in plasma TG increases. The differential effects of ACC and FASN inhibition on circulating TGs, even though they both inhibit DNL, may be explained by opposing effects on hepatic malonyl concentrations, an intermediate which is essential for the synthesis of polyunsaturated fatty acids. ACC inhibition decreases malonyl CoA levels which may affect the synthesis of polyunsaturated fatty acids, which in turn leads to increased expression of LXR/SREBP1c target genes and subsequent stimulation of VLDL secretion and plasma TG concentrations. 16 , 23 This is not expected to occur with FASN inhibition as malonyl CoA levels rapidly increase under these conditions. It is unknown, however, whether higher doses and/or longer treatment with FT‐4101 will ultimately affect VLDL secretion or other pathways, such as adipose TG clearance, that may potentially lead to hypertriglyceridaemia. 23 It is also unknown how pharmacological inhibition of FASN and its subsequent increases in malonyl‐CoA will impact lipotoxic hepatocellular injury. We speculate that decreases in liver fat burden, limited increases in malonyl‐CoA and potential beneficial effects on liver inflammation and fibrosis with pharmacological FASN inhibition will all contribute to improvements in liver health.
Novel mechanistic studies have revealed a critical role for DNL in platelet formation 17 and sebum production in humans, 13 suggesting that DNL inhibition with systemic agents may lead to non‐hepatic effects such as thrombocytopenia, 17 dry skin and alopecia. 12 While in vitro studies have demonstrated platelet production blockage with pharmacological inhibition of ACC and FASN, 17 we did not find a reduction in platelet count in Study 2 or in human subjects receiving FT‐4101 at doses of up to 27 mg for 14 days. Differences between the two compounds in tissue distribution, the degree of DNL inhibition, continuous versus intermittent dosing and inhibition of different steps of the DNL pathway may all contribute to these discrepant effects on platelets in vivo.
We observed minor sensitivity to skin lipids with FT‐4101 treatment as indicated by the decrease in sebum sapienate content with FT‐4101. These changes, however, were small and not significantly different from pretreatment or effects seen in the placebo group. Also, effects on sebum sapienate content did not alter total sebum production and did not lead to clinically significant AEs such as skin dryness or hair loss. Interestingly, sebum sapienate levels recovered after 1 week off‐treatment, supporting the use of an intermittent approach to balance benefits and risks of systemic DNL inhibition.
There are some limitations to this study. We did not include liver biopsies, nor did we include participants with confirmed NASH or hepatic fibrosis as the main study objectives were related to DNL and hepatic steatosis, and therefore we cannot draw any conclusions regarding the effectiveness of FT‐4101 on NASH resolution and improvements in fibrosis. Additionally, the sample size in Study 2 was small and findings regarding MRI‐PDFF should be regarded as preliminary. Further studies are also needed to evaluate efficacy and safety of higher doses and longer treatment.
In summary, FT‐4101, a potent, selective, orally bioavailable, small‐molecule inhibitor of FASN, robustly and dose‐dependently reduced hepatic DNL and improved hepatic steatosis without significant safety concerns.
CONFLICTS OF INTEREST
PS, EW, JB, MR, PK are employees and shareholders of Forma Therapeutics. WL and KD were employees of Forma Therapeutics at the time of contribution. CB receives consultancy fees from Forma Therapeutics and ProSciento, Inc. TER is an employee of Celerion. LM received consultancy fees from ProSciento, Inc. MH is an employee and shareholder of ProSciento, Inc. MKH and KL are employees of UCB. MKH receives consultancy fees from Forma Therapeutics. LJ is an employee and shareholder of Antaros Medical.
AUTHOR CONTRIBUTIONS
CB, PS, WL, KD, LM, MH, MKH, PK designed the studies. CB, PS, EW, JB, MR, WL, MKH, KL, LJ analyzed data. CB wrote the manuscript. All authors were involved in data interpretation and critically revising the manuscript. All authors have read, reviewed, and agreed to the final version.
PEER REVIEW
The peer review history for this article is available at https://publons.com/publon/10.1111/dom.14272.
Supporting information
Appendix S1. Supporting Information
ACKNOWLEDGMENTS
The authors thank the study participants and the clinical site staff who executed these studies. The authors also thank the staff at Metabolon, University of California at Berkeley, Metabolic Solutions and Antaros, Inc. for contributions to analysing samples and MRI images. The presented work was supported by Forma Therapeutics.
Beysen C, Schroeder P, Wu E, et al. Inhibition of fatty acid synthase with FT‐4101 safely reduces hepatic de novo lipogenesis and steatosis in obese subjects with non‐alcoholic fatty liver disease: Results from two early‐phase randomized trials. Diabetes Obes Metab. 2021;23:700–710. 10.1111/dom.14272
Funding information Forma Therapeutics
DATA AVAILABILITY STATEMENT
The data that support the findings of this study are available from the corresponding authors upon reasonable request.
REFERENCES
- 1. Lambert JE, Ramos‐Roman MA, Browning JD, Parks EJ. Increased de novo lipogenesis is a distinct characteristic of individuals with nonalcoholic fatty liver disease. Gastroenterology. 2014;146(3):726‐735. 10.1053/j.gastro.2013.11.049. [DOI] [PMC free article] [PubMed] [Google Scholar]
- 2. Hellerstein MK. De novo lipogenesis in humans: metabolic and regulatory aspects. Eur J Clin Nutr. 1999;53(Suppl 1):S53‐S65. [DOI] [PubMed] [Google Scholar]
- 3. Smith GI, Shankaran M, Yoshino M, et al. Insulin resistance drives hepatic de novo lipogenesis in nonalcoholic fatty liver disease. J Clin Invest. 2020;130(3):1453‐1460. 10.1172/JCI134165. [DOI] [PMC free article] [PubMed] [Google Scholar]
- 4. Donnelly KL, Smith CI, Schwarzenberg SJ, Jessurun J, Boldt MD, Parks EJ. Sources of fatty acids stored in liver and secreted via lipoproteins in patients with nonalcoholic fatty liver disease. J Clin Invest. 2005;115(5):1343‐1351. 10.1172/JCI23621. [DOI] [PMC free article] [PubMed] [Google Scholar]
- 5. Lawitz EJ, Coste A, Poordad F, et al. Acetyl‐CoA carboxylase inhibitor GS‐0976 for 12 weeks reduces hepatic de novo lipogenesis and steatosis in patients with nonalcoholic steatohepatitis. Clin Gastroenterol Hepatol. 2018;16(12):1983‐1991. 10.1016/j.cgh.2018.04.042. [DOI] [PubMed] [Google Scholar]
- 6. Neuschwander‐Tetri BA. Hepatic lipotoxicity and the pathogenesis of nonalcoholic steatohepatitis: The central role of nontriglyceride fatty acid metabolites. Hepatology. 2010;52(2):774‐788. 10.1002/hep.23719. [DOI] [PubMed] [Google Scholar]
- 7. Berod L, Friedrich C, Nandan A, et al. De novo fatty acid synthesis controls the fate between regulatory T and T helper 17 cells. Nat Med. 2014;20(11):1327‐1333. 10.1038/nm.3704. [DOI] [PubMed] [Google Scholar]
- 8. Sawada K, Ohtake T, Hasebe T, et al. Augmented hepatic Toll‐like receptors by fatty acids trigger the pro‐inflammatory state of non‐alcoholic fatty liver disease in mice. Hepatol Res. 2014;44(8):920‐934. 10.1111/hepr.12199. [DOI] [PubMed] [Google Scholar]
- 9. Stiede K, Miao W, Blanchette HS, et al. Acetyl‐coenzyme A carboxylase inhibition reduces de novo lipogenesis in overweight male subjects: A randomized, double‐blind, crossover study. Hepatology. 2017;66(2):324‐334. 10.1002/hep.29246. [DOI] [PMC free article] [PubMed] [Google Scholar]
- 10. Loomba R, Kayali Z, Noureddin M, et al. GS‐0976 reduces hepatic steatosis and fibrosis markers in patients with nonalcoholic fatty liver disease. Gastroenterology. 2018;155(5):1463‐1473. 10.1053/j.gastro.2018.07.027. [DOI] [PMC free article] [PubMed] [Google Scholar]
- 11. Bergman A, Carvajal‐Gonzalez S, Tarabar S, Saxena AR, Esler WP, Amin NB. Safety, tolerability, pharmacokinetics, and pharmacodynamics of a liver‐targeting acetyl‐CoA carboxylase inhibitor (PF‐05221304): A three‐part randomized phase 1 study. Clin Pharmacol Drug Dev. 2020;9(4):514‐526. 10.1002/cpdd.782. [DOI] [PMC free article] [PubMed] [Google Scholar]
- 12. Syed‐Abdul MM, Parks EJ, Gaballah AH, et al. Fatty acid synthase inhibitor TVB‐2640 reduces hepatic de novo lipogenesis in males with metabolic abnormalities. Hepatology. 2020;72(1):103‐118. 10.1002/hep.31000. [DOI] [PubMed] [Google Scholar]
- 13. Esler WP, Tesz GJ, Hellerstein MK, et al. Human sebum requires de novo lipogenesis, which is increased in acne vulgaris and suppressed by acetyl‐CoA carboxylase inhibition. Sci Transl Med. 2019;11(492):eaau8465 10.1126/scitranslmed.aau8465. [DOI] [PubMed] [Google Scholar]
- 14. Wu X, Huang T. Recent development in acetyl‐CoA carboxylase inhibitors and their potential as novel drugs. Future Med Chem. 2020;12(6):533‐561. 10.4155/fmc-2019-0312. [DOI] [PubMed] [Google Scholar]
- 15. Bates J, Vijayakumar A, Ghoshal S, et al. Acetyl‐CoA carboxylase inhibition disrupts metabolic reprogramming during hepatic stellate cell activation. J Hepatol. 2020;73(4):896–905. 10.1016/j.jhep.2020.04.037. [DOI] [PubMed] [Google Scholar]
- 16. Kim C‐W, Addy C, Kusunoki J, et al. Acetyl CoA carboxylase inhibition reduces hepatic steatosis but elevates plasma triglycerides in mice and humans: A bedside to bench investigation. Cell Metab. 2017;26(2):394‐406. 10.1016/j.cmet.2017.07.009. [DOI] [PMC free article] [PubMed] [Google Scholar]
- 17. Kelly KL, Reagan WJ, Sonnenberg GE, et al. De novo lipogenesis is essential for platelet production in humans. Nat Metab. 2020;2(10):1163‐1178. 10.1038/s42255-020-00272-9. [DOI] [PubMed] [Google Scholar]
- 18. Dorn C, Riener M‐O, Kirovski G, et al. Expression of fatty acid synthase in nonalcoholic fatty liver disease. Int J Clin Exp Pathol. 2010;3(5):505‐514. [PMC free article] [PubMed] [Google Scholar]
- 19. Beysen C, Ruddy M, Stoch A, et al. Dose‐dependent quantitative effects of acute fructose administration on hepatic de novo lipogenesis in healthy humans. Am J Physiol Endocrinol Metab. 2018;315(1):E126‐E132. 10.1152/ajpendo.00470.2017. [DOI] [PubMed] [Google Scholar]
- 20. Hellerstein MK, Neese RA. Mass isotopomer distribution analysis at eight years: theoretical, analytic, and experimental considerations. Am J Physiol. 1999;276(6 Pt 1):E1146‐E1170. [DOI] [PubMed] [Google Scholar]
- 21. Hellerstein MK, Christiansen M, Kaempfer S, et al. Measurement of de novo hepatic lipogenesis in humans using stable isotopes. J Clin Invest. 1991;87(5):1841‐1852. 10.1172/JCI115206. [DOI] [PMC free article] [PubMed] [Google Scholar]
- 22. Patel J, Bettencourt R, Cui J, et al. Association of noninvasive quantitative decline in liver fat content on MRI with histologic response in nonalcoholic steatohepatitis. Therap Adv Gastroenterol. 2016;9(5):692‐701. 10.1177/1756283X16656735. [DOI] [PMC free article] [PubMed] [Google Scholar]
- 23. Goedeke L, Bates J, Vatner DF, et al. Acetyl‐CoA carboxylase inhibition reverses NAFLD and hepatic insulin resistance but promotes hypertriglyceridemia in rodents. Hepatology. 2018;68:2211 10.1002/hep.30097. [DOI] [PMC free article] [PubMed] [Google Scholar]
Associated Data
This section collects any data citations, data availability statements, or supplementary materials included in this article.
Supplementary Materials
Appendix S1. Supporting Information
Data Availability Statement
The data that support the findings of this study are available from the corresponding authors upon reasonable request.