

Abstract
In humans, brain oscillations support critical features of memory formation. However, understanding the molecular mechanisms underlying this activity remains a major challenge. We measured memory-sensitive oscillations using intracranial electroencephalography recordings from the temporal cortex of patients performing an episodic memory task. When these patients undergo resection subsequently, we employ transcriptomics on the temporal cortex to link gene expression with brain oscillations, identifying genes correlated with oscillatory signatures of memory formation across six frequency bands. A co-expression analysis isolated oscillatory signature-specific modules associated with neuropsychiatric disorders as well as ion channel activity, with highly correlated genes exhibiting strong connectivity within these modules. Using single-nuclei transcriptomics, we further revealed that these modules are enriched for specific classes of both excitatory and inhibitory neurons, and immunohistochemistry confirmed expression of highly correlated genes. This unprecedented dataset of patient-specific brain oscillations coupled to genomics unlocks new insights into the genetic mechanisms that support memory encoding.
Introduction
Genome-wide association studies and gene expression profiling of the human brain have unlocked the ability to investigate the genetic basis of complex brain phenomena. These datasets have principally been applied to non-invasive imaging studies especially correlations with structural MRI or resting state fMRI1–4. Existing methods have relied on published datasets of gene expression from post-mortem brains, meaning that neurophysiological and behavioral data did not come from the same individuals contributing gene expression data5,6. This limits the potential impact of such approaches to determine how genes support key cognitive processes such as episodic memory and highlights the need to develop new datasets in which individuals contribute both neurophysiological and gene expression data7. Another issue affecting previous studies is that neurophysiological measurements such as resting state fMRI are not directly linked to cognitive phenomenon. Thus, we previously attempted to correlate gene expression levels with oscillatory signatures of successful memory encoding8, as the fundamental role of these oscillations in supporting memory behavior has been well-established in rodents and humans9,10. These oscillatory signatures are measures of the degree to which memory encoding success modulates oscillatory power in a given frequency band. They were quantified using intracranial electrodes implanted for seizure mapping purposes, with recordings made as participants perform an episodic memory task. We used a large database of intracranial EEG (iEEG) recordings obtained over 10 years to piece together a distribution of these oscillatory signatures across brain regions. We identified genes correlated with these oscillatory signatures including those previously linked to memory formation in rodent investigations, genes linked to cognitive disorders such as autism, and novel genes that are prime targets for further investigation. However, as with other studies, this dataset did not have the benefit of both neurophysiological and gene expression information from the same individuals.
With the goal of explicating links between gene expression and brain oscillations and identifying propitious targets for neuromodulation to treat memory disorders, here, we compiled an unprecedented dataset of 16 human subjects who first underwent iEEG during which we measured oscillatory signatures of episodic memory encoding using a well-refined signal processing pipeline. These subjects then underwent a temporal lobectomy, during which an en bloc resection of the lateral temporal lobe permitted the acquisition of high quality tissue specimens that were processed immediately upon removal from a common brain region (Brodmann area 38, BA38) from which in vivo recordings had been previously obtained. This approach allowed us to identify genes linked with mnemonic oscillatory signatures by correlating gene expression information with iEEG data obtained from the same individuals. Prioritization was performed by different steps: multivariate analyses followed by decomposition by brain oscillation using correlations, gene regulatory network connectivity, and cell-type specific expression and/or epigenomic state, and immunofluorescence staining confirmations. This robust analytical approach to combine human electrophysiological data by iEEG and genomic data from the same subjects highlighted genes that might be relevant for mechanisms of episodic memory.
We made the a priori decision to focus on BA38 in this analysis for the following reasons: 1) the region has been shown to exhibit strong memory related oscillatory signatures in multiple investigations11,12; 2) resection of this region is standardized in an en bloc temporal lobectomy operation allowing preservation of blood supply to the region until a period less than five minutes from procurement of tissue for processing, maximizing the quality of the specimen; and 3) iEEG investigations preceding temporal lobectomy in this patient population invariably include sampling from this region.
An inevitable feature of our data set was that subjects suffered from intractable epilepsy, which presents an important caveat to the interpretations of the results. However, recent experiments have shown that BOLD patterns elicited during successful encoding in epilepsy patients participating in cognitive studies did not show significant differences compared with healthy controls13. Moreover, since we examined gene/oscillatory signature correlations across these individuals rather than in comparison to some alternative cohort of data, we could institute control methodologies partially accounting for this concern. These included strict artifact rejection routines and the exclusion of data from regions of seizure onset, as well as using matched post-mortem gene expression samples from both unaffected individuals and persons with epilepsy to adjust gene expression levels.
Results
Generation of a within-subjects memory oscillatory signatures and gene expression dataset
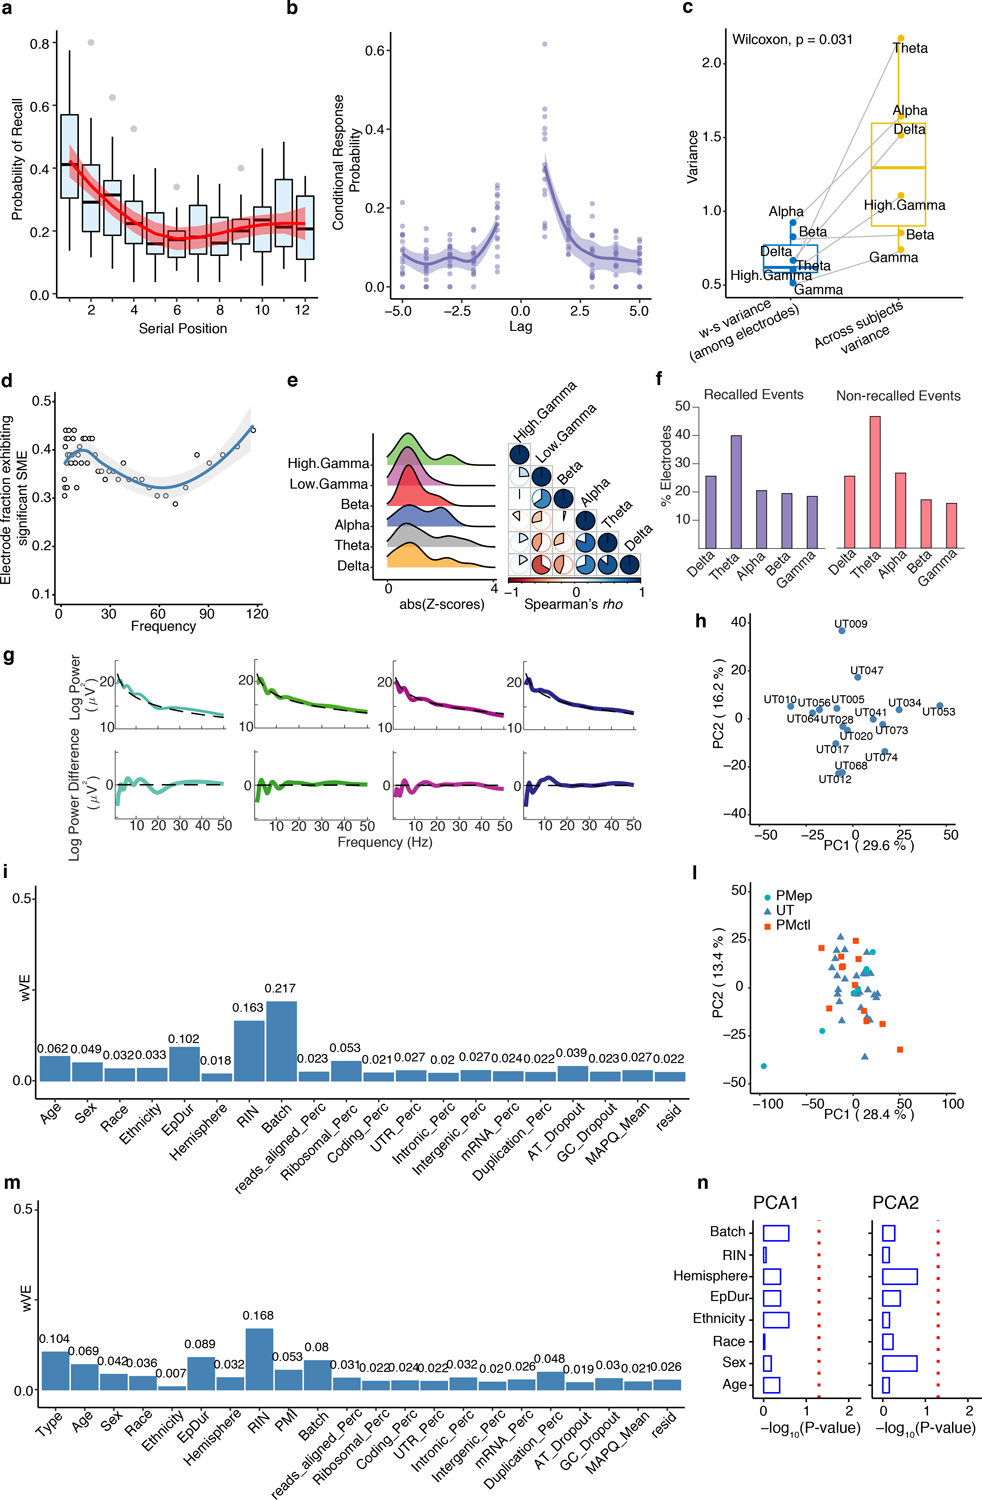
To determine the relationship between memory-related brain oscillations and gene expression, we analyzed iEEG recorded as subjects encoded episodic memories along with gene expression data from the same 16 individuals (see Supplementary Table 1). Oscillatory signatures of successful memory encoding (subsequent memory effects or SMEs), were calculated from recorded iEEG signal by comparing oscillatory patterns during successful versus unsuccessful memory encoding. We use the term “oscillations” to describe oscillatory power extracted in pre-defined frequency bands, but address issues related to the use of this term in the Discussion section. We used the free recall task, a standard test of episodic memory for which oscillatory patterns have been well-described14, and calculated oscillatory signatures utilizing our well-established signal processing pipeline8,15,16 (Fig. 1 and see Methods). On average, subjects remembered 24.3% of memory items, with a rate of list intrusion (erroneous recollection) of 5.4%. These characteristics are consistent with previous publications of the performance of intracranial EEG subjects on this task11. Further behavioral characteristics, including response probability curves by serial position and conditional response probability curves, are shown in Extended Data Fig. 1a,b. These reveal expected patterns for free recall, including primacy and recency effects and temporal contiguity for immediate lags.
Fig 1: Within-subject study design and quality control.
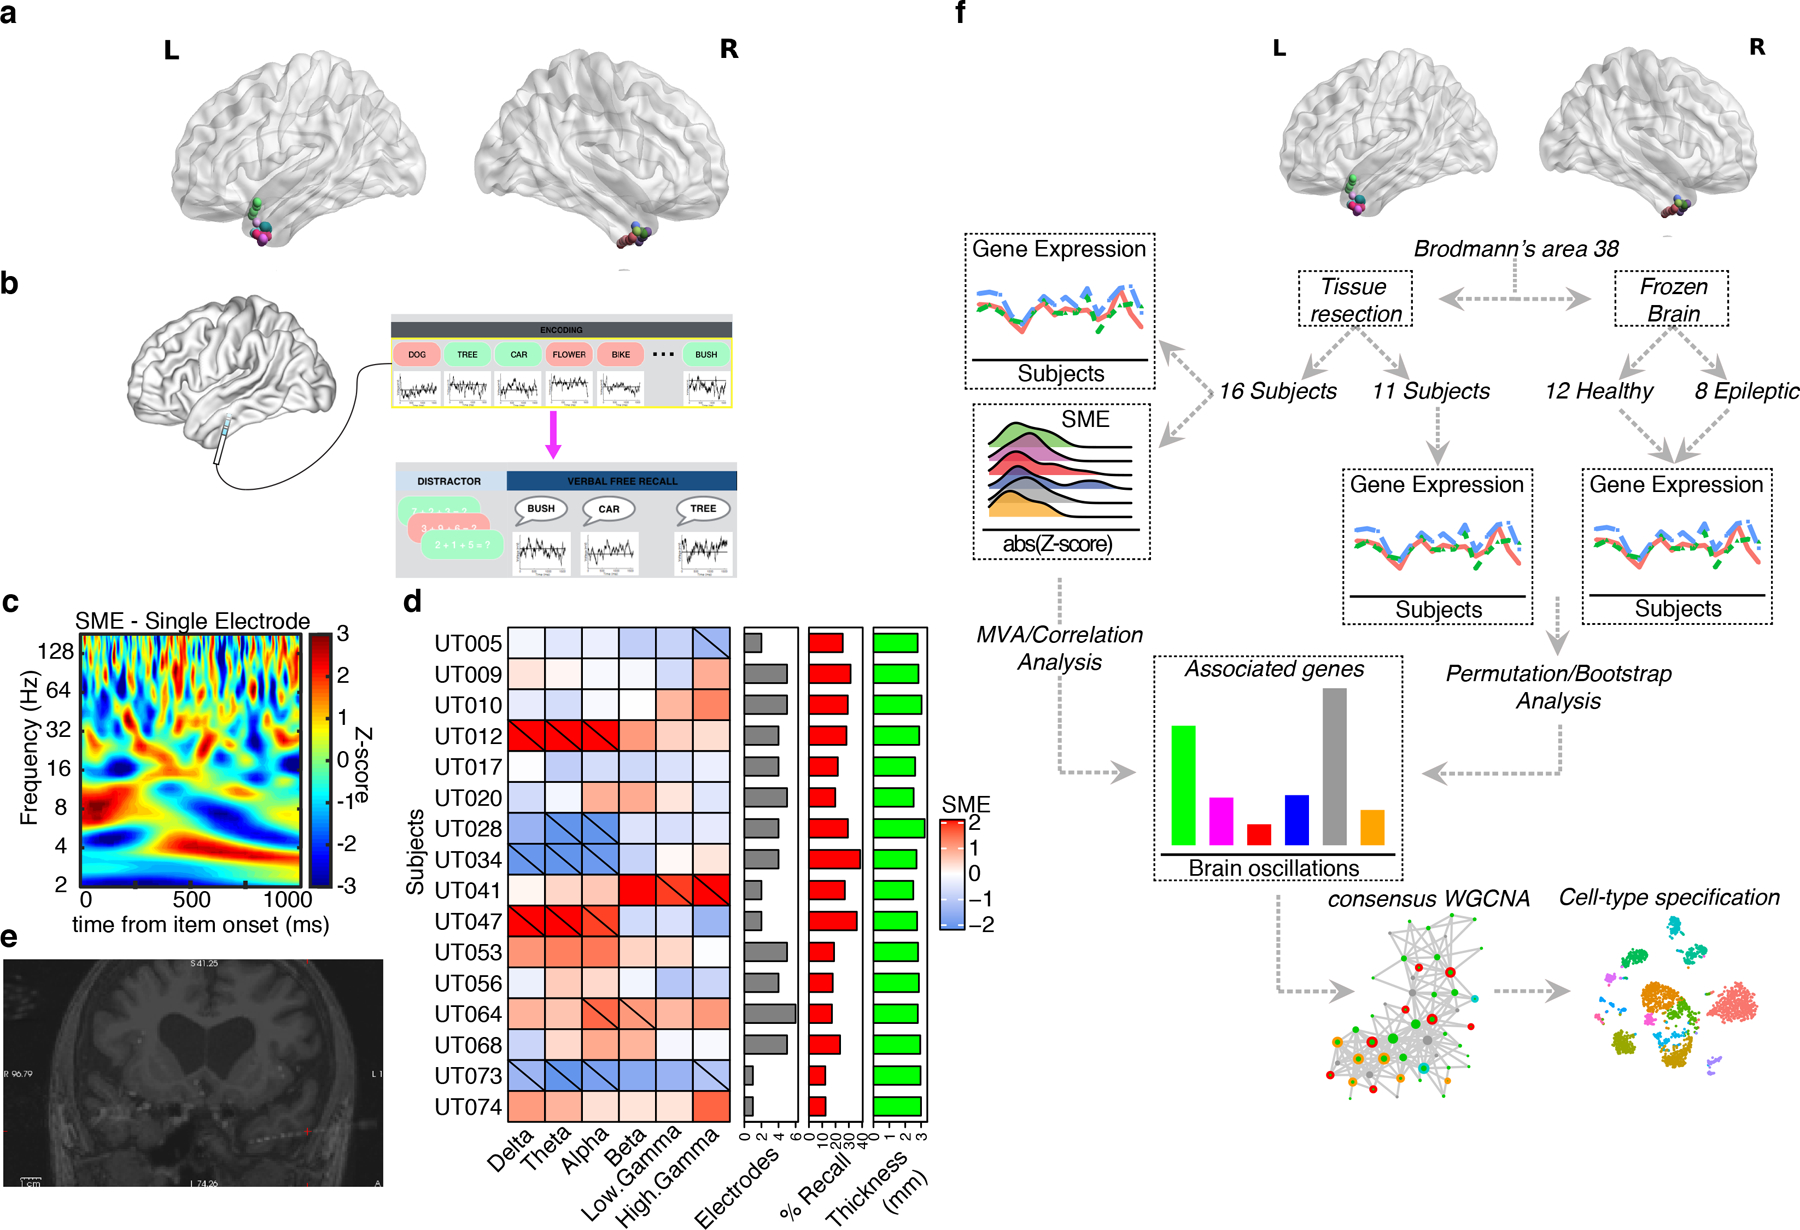
a, Representation of the position of each electrode in BA38 for the 16 subjects. b, Schematic of iEEG memory testing. Intracranial electrodes are used to record oscillations as subjects perform an episodic memory task. Oscillatory signatures of successful encoding (subsequent memory effects) are calculated by contrasting brain activity recorded as individuals either remembered (green) or forgot (red) each item. c, Example of oscillatory signatures of success encoding (subsequent memory effect) recorded from BA38 (full time frequency representation, color axis is z transformed p value for successful/unsuccessful contrast). d, Subject – level subsequent memory effect (SME) values in our data. Hash marks indicate significant SME (p < 0.05; two-sided student’s t-test with permutation procedure) at the subject level. Warm colors indicate power increases during successful encoding. Gray bar plot indicates the total number of electrodes localized to BA38 for each subject. Red bar plot indicates the recall fraction for each individual, and green bar plot indicates the measured cortical thickness in mm as determined using the FreeSurfer volume extraction routine. e, Postoperative MR/CT overlay after implantation of intracranial electrodes, used for localization. f, Human BA38 RNA-seq from resected tissue was integrated with brain oscillation data derived from subsequent memory effect (SME) analysis, identifying protein-coding genes whose gene expression support SMEs (SME genes). Permutations/bootstraps with additional human BA38 samples from independent sources were performed. SME genes were prioritized using co-expression networks and specified at the cell-type level using snRNA-seq/snATAC-seq from BA38.
SMEs were extracted from electrodes located in the temporal pole by first normalizing the iEEG signal following wavelet decomposition and statistically comparing oscillatory values between successful versus unsuccessful encoding events across 56 log spaced frequencies from 2 to 120 Hz. This was done using a permutation procedure, shuffling trial labels 1000 times within each recording electrode. We made the a priori decision to average oscillatory data for each individual across all electrodes localized to the anterior temporal pole (BA38) by expert neuroradiology review, as this seemed the most generalizable approach. Extended Data Fig. 1c shows that the variance of SME values across subjects for all bands is greater than the variance within subjects, supporting the validity of this approach. Data were averaged over a mean of 3.6 electrodes per subject. The resulting oscillatory signatures were averaged into six predefined frequency bands prior to entering these data into our model to estimate gene correlation values (Fig. 1d,f). The proportion of electrodes exhibiting significant differences in oscillatory power between successful and unsuccessful encoding demonstrated that significant memory-related oscillatory patterns were present (see Extended Data Fig. 1d). Significant effects at the subject level are also shown (Fig. 1d), and results were consistent with previous work related to memory patterns in the anterior temporal lobe21. In addition, correlation between observed SME values revealed an expected relationship between low and high frequency SME (see Extended Data Fig. 1e). We note that observed differences may be due to functional changes in narrowband oscillations or broadband power shifts (or a mix of the two). Extended Data Fig. 1f,g show the results of an oscillation detection analysis indicating that narrowband oscillations were present in our data, and we comment on this issue in the Discussion section. These 16 subjects then underwent a temporal lobectomy operation. This surgery was performed by a single surgeon (BL) using a technique that was standardized across these patients for obtaining tissue from BA38 (Fig. 1e). None of the individuals included in the study had gross or radiographic lesions such as temporal sclerosis or cortical dysplasia. Subjects with seizure onset in the temporal pole were not included in our data.
We generated whole transcriptome RNA-sequencing (RNA-seq) data from the 16 BA38 samples. In addition to the 16 individuals with matched oscillatory signature measurements and gene expression, we generated BA38 RNA-seq data from an additional 11 temporal lobectomies from patients for whom we did not obtain oscillation measurements, and post-mortem tissue from 12 healthy individuals and 8 epileptic patients to validate our predictions using permutations/bootstraps (Fig. 1f and see Methods). Principal component analysis revealed that gene expression was uniform across samples with no outliers (see Extended Data Fig. 1h–m). Variance explained by technical, biological and sequencing covariates was analyzed and removed prior to further analyses (see Extended Data Fig. 1n). These adjusted gene expression values were used to calculate gene/oscillatory signature correlations across individuals for each frequency band and co-expression networks.
Memory oscillatory signatures are correlated with gene expression
To determine the relationship between memory oscillatory signatures and gene expression, we performed a multivariate analysis (MVA) followed by decomposition by brain oscillation using a Spearman’s rank correlation that included the aforementioned permutations/bootstraps (see Methods). Correlations between gene expression and brain oscillations were performed across subjects, with each subject contributing a single gene expression value and single SME value per frequency band. MVA detected 753 total genes with FDR corrected p value < 0.05 (Fig. 2a) for SME/gene expression correlations. The F-statistics for the significant genes we identified were robust and greater compared with non-significant genes (see Extended Data Fig. 2a). We next decomposed the MVA analysis by a correlative analysis identifying genes whose expression correlated with memory-related oscillatory signatures in each of the six frequency bands (“SME genes”; Multivariate, FDR < 0.05; Spearman’s rank correlation p and permutations p < 0.05). Of the 753 genes detected by MVA, we found 300 genes linked with memory effects in specific frequency bands, with a high proportion associated with 2–4 Hz delta band oscillations (Fig. 2a; Supplementary Table 2). The majority of the identified genes were specific to one frequency band with primarily only a small number of genes shared by delta and one other frequency band (Fig. 2b). Spearman’s rho values were robust and greater compared with random expectation (see Extended Data Fig. 2b,c). These results further confirmed the significance of the genes identified.
Fig. 2: Genes associated with SMEs are distinct.

a, Heatmap showing the F-statistics for the initial SME genes (753 genes; FDR < 0.05). We next use the correlation analysis to decompose the genes by brain oscillations (Spearman’s rank correlation, p < 0.05, permutations/bootstraps p < 0.05). We identified a total of 300 genes using this iterative filtering process that represents brain oscillation/gene expression correlations by wavelength. b, Upset plot indicating shared and specific SME genes between brain oscillations. Most genes are uniquely correlated to a specific wavelength. c, Venn diagram showing shared and specific genes between genes associated with memory effect (SME), genes associated with math task (Math), genes associated with cortical thickness (Thickness), and genes associated with recalled words (Memory Performance). Only one gene overlaps between SME and memory performance.
Data from these 16 individuals also included a control behavioral paradigm in which individuals perform simple mathematical problems, allowing us to observe oscillatory signatures linked to this separate cognitive domain (see Methods). We performed the same analysis as above, to test whether oscillatory signatures/gene associations were specific for mnemonic processing. Our data set also included cortical thickness estimates for BA38 for each patient extracted from our FreeSurfer processing routine, allowing us to perform an additional control analysis looking for genes correlated with this measurement. We observed no overlap with these alternative data, and all genes emphasized below using co-expression network analysis were memory specific (i.e., gene/oscillation correlations are specific for memory-related oscillatory effects). Finally, we looked for gene correlations with memory performance (i.e. behavioral data without regard to any oscillatory signature observations). Only one gene associated with oscillatory signatures overlapped with those identified in these control analyses, reinforcing the unique memory-relevant information obtained by examining gene oscillatory signature correlations (Fig. 2c).
Networks refine molecular pathways associated with memory
We sought to understand the functional properties of the genes identified as correlated with oscillatory signatures of successful memory encoding. We performed consensus weighted gene co-expression network analysis (consWGCNA; see Methods, Extended Data Fig. 3a, and Supplementary Table 3) using gene expression from resected temporal lobe tissue together with the post-mortem gene expression datasets. We placed the memory genes into a systems-level context identifying co-expression networks (e.g. modules of highly correlated genes) linked with brain oscillations to further prioritize genes. We required that identified modules were robust across these multiple expression data sets (see Methods), identifying 26 total modules. Of these, six were significantly associated with oscillatory signature correlated genes (Fig. 3a and see Extended Data Fig. 3b).
Fig. 3: Gene co-expression networks highlight cellular processes implicated in memory encoding.

a, Bubble-chart showing the module eigengene association with brain oscillations (Spearman’s |rho| > 0.5, p < 0.05). Six modules have significant correlation. Positive correlations are indicated by red bubbles and negative correlations are indicated by blue bubbles. The size of the bubble corresponds to the strength of the correlation. b, Bubble-chart showing the module eigengene association with MATH associated brain oscillations, Percentage of Recall values, and thickness values (Spearman’s |rho| > 0.5, p < 0.05). Only two modules are significantly associated with MATH and no modules are significantly associated with memory performance or cortical thickness. c, Bubble-chart showing the enrichment for previously identified SME genes from a population-based study. Gradient color represents the −log10(FDR). Boldface type indicates the six modules significantly associated with brain oscillations as indicated in panel a. d, Representation of the top 10 hub genes for the six modules significantly associated with SME signals. SME genes significantly associated with brain oscillations are highlighted in red. Edges represent co-expression (rho^2 > 0.25). Scatterplots represent the top 3 molecular functions of each module as assessed by gene ontology analyses. Y-axis = Odds Ratio, X-axis = −log10(FDR).
Two modules were significantly associated with delta oscillatory signatures, one module with both delta and low gamma oscillations, and three modules were significantly associated with beta oscillatory signatures (Fig. 3a). Notably, we did not detect module association for genes correlated with cortical thickness or recall fraction (behavioral measurement) whereas genes correlated with oscillations during math tasks were associated with two independent modules, further confirming that genes associated with memory encoding and their networks are distinct (Fig. 3b). In addition, in three of these modules (WM4, WM12, and WM21), we identified statistically significant enrichment for the SME genes (see Extended Data Fig. 3c). Moreover, SME genes within these three modules showed higher connectivity compared with other genes, suggesting a central role of oscillatory signature associated genes in the transcriptome of BA38 (see Extended Data Fig. 3d). We also observed convergence of genes and modules associated with oscillatory signature correlated genes from our previous work examining gene/oscillatory signature associations across cortical regions8 (Fig. 3c). The convergence of these findings using different patient populations and methods gives confidence to our inferences regarding the link between these genes and mnemonic processes. The two modules positively associated with delta oscillatory signatures (WM4 and WM12 respectively) are enriched for genes implicated in ion channel activity (Fig. 3d). Notably, WM4 contains previously identified genes correlated with memory oscillatory signatures8 (Fisher’s exact test, FDR corrected; p = 0.003, OR = 4.4), whereas WM12 is enriched for a previously identified synaptic related module correlated with memory oscillatory signatures8 (Fisher’s exact test, FDR corrected; p = 1.0×10−07, OR = 4.1) (Fig. 3c).
Because “hub genes”, genes with high intramodular connectivity, have been previously shown to drive module and network structure, we examined the correlated modules for any hub genes that might have previously been linked to memory or cognition. SHANK2, one of the WM12 hub genes, encodes for a synaptic scaffolding protein. Mutations in SHANK2 have been linked with autism spectrum disorders, intellectual disability and schizophrenia17,18. Moreover, SHANK2 has been associated with learning and memory deficits19, further confirming the pivotal role of this WM12 hub gene in memory encoding. Importantly, modules associated with different oscillatory frequency bands exhibited different functional properties. Different than the delta associated modules, modules linked with beta oscillatory signatures (WM11 and WM22) were significantly associated with alternative splicing and chromatin remodeling (Fig. 3d). In accordance with previous results8, we observed that both modules are enriched for genes in SME15, a module linked to beta oscillatory signatures containing genes implicated in splicing (Fisher’s exact test, FDR corrected; p = 2.2×10⁻¹⁰, OR = 3.9 and p = 2.1×10−05, OR = 3.8 respectively) (Fig. 3c). These data may support alternative splicing regulation as a mechanism for variation in oscillatory signatures observed across individuals.
Modules of memory oscillatory signatures are linked with neuropsychiatric disorders
We next investigated the association of SME modules with genomic data from brain disorders. Using comprehensive transcriptomic and genetic data from multiple disorders (see Methods), we assessed enrichment for genes dysregulated in neuropsychiatric disorders and GWAS enrichment using LD score regression. The WM4 module associated with delta oscillatory signatures was significantly enriched for down-regulated genes in autism spectrum disorder (ASD; Fisher’s exact test, FDR corrected, p = 4.3×10⁻⁴, OR = 2.95) and variants associated with ASD (Fisher’s exact test, FDR corrected, p = 0.001) (Fig. 4a,b and see Supplementary Table 4). WM12 showed enrichment for GWAS associated with attention deficit hyperactivity disorder (ADHD; FDR = 0.001), bipolar disorder (BD; FDR = 0.003), major depressive disorder (MDD; FDR = 0.006), schizophrenia (SCZ_2018; FDR = 5.8×10⁻⁶) and variants associated with educational attainment (FDR = 0.03) and intelligence (FDR = 0.002) (Fig. 4b and see Supplementary Table 4). Most importantly, we did not detect any significant enrichment for epilepsy associated loci in the memory related modules (Fig. 4b) and the enrichment for variants associated with non-brain related traits and disorders was minimal (Extended Data Fig. 4a). We also found an enrichment for WM4 (FDR = 8.9×10−07, OR = 3.3) and WM12 (ASD: FDR = 3.9×10−06, OR = 3.4, ASD (scored 1–3): FDR = 3.2×10−04, OR = 4.5) in ASD associated genes from the SFARI Gene database (Fig. 4c).
Fig. 4: SME-specific modules capture genes dysregulated in neuropsychiatric disorders.

a, Bubble-chart showing the enrichment for genes dysregulated in multiple disorders. Up/Down are genes that are up or down regulated in these disorders compared with healthy individuals. Gradient color represents the −log10(FDR) and bubble size represents the odds ratio (OR) from a Fisher’s exact enrichment test of each module with disease-relevant gene lists. Y-axis shows the acronyms for the disorders (ASD = autism spectrum disorder, BD = bipolar disorder, and SCZ = schizophrenia). X-axis indicates the modules of the present study. b, Bubble-chart showing the enrichment for risk-loci and loci associated with neuropsychiatric disorders and complex traits (see Methods for description of acronyms). Gradient color represents the −log10(FDR) from linkage disequilibrium gene set analysis performed by MAGMA. Blue border corresponds to the Bonferroni correction threshold (Bonferroni p < 0.05). Y-axis shows the acronyms for the GWAS data utilized for this analysis. X-axis shows the modules of the present study. c, Bubble-chart showing the enrichment for genes associated with ASD in the SFARI database. Gradient color represents the −log10(FDR) and bubble size represents the odds ratio (OR) from a Fisher’s exact enrichment test. Y-axis shows the acronyms for the complete SFARI database (ASD) and highly scored ASD genes (categories 1–3). X-axis shows the modules of the present study.
We next compared the correlated modules with those found in a meta-analysis of transcriptomic data across neuropsychiatric disorders. Both WM4 and WM12 are enriched for a module severely affected in ASD with RBFOX1 as a predominant hub (geneM1; FDR = 1.5×10⁻²⁹, OR = 7.9 and FDR = 2.0×10⁻¹⁰, OR = 3.92 respectively; Extended Data Fig. 4b). Interestingly, RBFOX1 is also a hub in WM12 (Fig. 3d), further supporting the role of this gene in neuropsychiatric disorders and memory. The beta module WM21 is enriched for schizophrenia variants (SCZ_2018; FDR = 0.03) (Fig. 4a,b and see Supplementary Table 4) whereas the beta module WM22 is enriched for a splicing module affected in SCZ (geneM19; FDR = 2.6×10−09, OR = 6.6; see Extended Data Fig. 4b). Overall, the association of delta and beta oscillatory signature correlated modules with neuropsychiatric disorders where memory is impaired provide further support for the role of these genes and pathways in episodic memory.
Modules of memory oscillatory signatures are associated with specific cell-types
To develop cell-type specific associations for the identified correlated genes, we performed single nuclei RNA-seq (snRNA-seq) analysis on tissue from six subjects, four of whom contributed oscillatory data (see Supplementary Table 1). We sequenced the transcriptomes of 17632 nuclei (see Extended Data Fig. 5a), detecting an overall median of 11498 UMIs and 4069 genes (see Extended Data Fig. 5b,c). We accounted for technical and biological covariates prior to dimensionality reduction (see Methods). We initially identified 24 clusters. We next used a publicly available snRNA-seq data from middle temporal gyri to further define our initial clusters by both cell-type and layer specificity (see Methods and Supplementary Table 5). After the comparison based on marker enrichment (see Methods), we focused on a robust set of 20 transcriptionally-defined clusters (Fig. 5a). The proportion of cells were similarly distributed by subject in all clusters (see Extended Data Fig. 5d,e). In total, we defined nine inhibitory neuron, eight excitatory neuron and three major non-neuronal clusters (see Extended Data Fig. 5f,g). These clusters showed high expression of known major markers for their respective cell types (Fig. 5b and see Supplementary Table 5).
Fig. 5: SME-specific modules are enriched for excitatory and inhibitory neurons.

a, Uniform manifold approximation and projection (UMAP) representation of the 20 classes of cell-types using the BA38 snRNA-seq. Each dot represents a nucleus. Excitatory neurons are highlighted in blue gradient, the inhibitory neurons in red gradient, and the non-neuronal cells in light blue gradient. Cell-types were annotated using a publicly available single cell data. A Fisher’s exact enrichment test between cell markers of the two datasets was performed. Major cell types tend to cluster near one another. b, Violin-plots representing gene markers for the major cell-types detected. Y-axis represents the log normalized expression (log(Norm Exp)) of each marker gene in each cluster. The markers for excitatory neurons (e.g. CUX, RORB) are highlighted in blue. The markers for inhibitory neurons (e.g. GAD1, RELN) are highlighted in red. The markers for non-neuronal cells (e.g. FGFR3, MOBP, VCAN) are highlighted in green. c, Bubble-chart showing the enrichment of the SME modules for cell-type markers defined by Seurat. Color gradient represents the −log10(FDR) and bubble size represent the odds ratio (OR) from a Fisher’s exact enrichment test of genes in modules from this study with genes expressed in specific cell types defined by our snRNA-seq data. X-axis represents the SME-specific modules. Y-axis represents the cell classes of the present study. Boldface type indicates the six modules significantly associated with memory-related brain oscillations. d, Violin plot representing the log normalized expression (log(Norm Exp)) level of IL1RAPL2. Adjacent dot plot represents the average expression (gradient) and percentage of cells (size) expressing IL1RAPL2. The order of cell types follows the labels of panel c. e,f, Immunohistochemistry of independent human temporal lobe specimens demonstrates the specific expression of IL1RAPL2 in excitatory (CAMKII-α+) and inhibitory neurons (GAD67+) in BA38 (e), not in oligodendrocytes (OLIG2+) or astrocytes (GFAP+) (f).
We found that the delta-correlated modules WM4 and WM12 are strongly enriched for excitatory and inhibitory neurons (Fig. 5c). Specifically, WM4 and WM12 were highly enriched for combinations of RORB+/THEMIS+/FEZF2+ deep layer excitatory neurons. These deep-layer neurons have been associated with memory encoding circuitry receiving GABAergic inputs from the hippocampus20. In addition, delta rhythmicity might arise from deeper layer intrinsic bursting neurons which project to other subcortical regions22. Therefore, these results further underscore the importance of these deep-layers excitatory neurons in episodic memory encoding. Moreover, both modules showed enrichments for combinations of SST+/VIP+/PVALB+ inhibitory neurons. Interestingly, fast-spiking parvalbumin (PVALB)-containing basket cells decisively control excitatory output and they are required for memory consolidation regulating neocortical-hippocampal circuitry23. On the other hand, somatostatin (SST) expressing neurons target distal dendrites of pyramidal cells24 and they play a role in memory circuitry and cortical oscillatory synchronization25. While SST+/PVALB+ interneurons specifically inhibit pyramidal neurons, VIP+ neurons both inhibit and disinhibit pyramidal neurons26,27 and might be implicated in working memory circuitry28.
In addition, the module negatively associated with delta oscillatory signatures, WM21, was enriched for glia cells, with a predominance of oligodendrocyte-related genes (Fig. 5c), supporting a possible role for oligodendrocytes in memory circuits and neuronal synchrony previously reported elsewhere29. Moreover, using snRNA-seq data from brain tissue of patients with ASD or Alzheimer disease (see Methods), we found that WM4 is significantly enriched for genes dysregulated in layer 2–4 excitatory neurons and SST+ inhibitory neurons in ASD whereas WM21 is significantly enriched for oligodendrocyte markers affected in Alzheimer disease (Extended Data Fig. 5h,i). These results confirm the role of the modules associated with delta oscillatory signatures as linked to cognitive disorders at the cell-type level.
WM4 and WM12 are both enriched for delta oscillatory signature correlated genes, cognitive-disease related variants, and multiple neuronal types. To validate our approach for the purpose of identifying targets for future development of neuromodulation strategies specific to brain disorders and cell types, we selected one hub gene from one of the delta modules. IL1RAPL2, an interleukin (IL)-1 receptor accessory protein, is a hub gene in the WM4 module. Intriguingly, along with its paralog IL1RAPL1, IL1RAPL2 promotes functional excitatory synapse and dendritic spine formation30 and it is associated with ASD31. Our snRNA-seq data showed IL1RAPL2 has the greatest expression in RORB+ deep-layer excitatory neurons but is also expressed in SST+/LAMP5+ upper layer inhibitory neurons (Fig. 5d). Using fluorescent immunohistochemistry from independently obtained tissue resections, we found that IL1RAPL2 has the greatest overlapping expression with a marker of excitatory neurons, CAMKII, some overlap with a marker of inhibitory neurons, GAD67, and no overlap with a marker of astrocytes, GFAP or a marker of oligodendrocytes, OLIG2 (Fig. 5e,f). Along with the role in excitatory synapse formation, the snRNA-seq and memory oscillatory signature association indicated that IL1RAPL2 might play an essential role in regulation of memory encoding in humans. Together, these results underscore the importance of further studies focused on the role of IL1RAPL2 in memory and excitatory – inhibitory synaptic etiologies.
Single-nuclei ATAC-seq reveals transcription factors as key regulators of memory-correlated modules.
We next sought to understand what transcription factors (TFs) regulate modules of memory oscillatory signatures. We performed single nuclei ATAC-seq (snATAC-seq) analysis on the tissue from three unique subjects (see Supplementary Table 1). We assessed the chromatin state of 22177 nuclei (see Extended Data Fig. 6a) with a median of 7733 identified peaks (see Extended Data Fig. 6b–c). We identified 17 clusters that were labeled by integrating snATAC-seq with the snRNA-seq data (Fig. 6a; see Extended Data Fig. 6d; see Methods). The proportion of nuclei from the three subjects were similarly distributed among the clusters (see Extended Data Fig. 6e). We noted differences between the resolution of the snRNA-seq and snATAC-seq in terms of cell-types identified with a high percentage of non-neuronal cells in the snATAC-seq dataset (see Extended Data Fig. 6f–g). We speculate that this difference might be due to a bias in snRNA-seq caused by a larger amount of RNA and expressed genes in neuronal cell-types32. Indeed, the glia to neuron ratio (GNR) in the human gray matter vary between 1.13 and 1.6433. GNR resolved by snATAC-seq is in line with this assumption (~1) whereas snRNA-seq data underestimate the GNR (~0.15) (see Extended Data Fig. 5g and 6g).
Fig. 6: snATAC-seq highlights transcription factors regulating SME-correlated modules.

a, Visualization of the 14 classes of cell-types identified from BA38 snATAC-seq data. Nuclei are displayed based on UMAP. Each dot represents a nucleus. Cell classes were annotated using the BA38 snRNA-seq data generated in this study. Excitatory neurons are highlighted in a gradient of blue colors, the inhibitory neurons in a gradient of red colors, and the non-neuronal cells in a gradient of turquoise colors. b, Transcription factor (TF) binding site enrichment for the three modules associated with cell-types (WM4, WM12, and WM21). Only WM12 tends to have enrichment of TF binding motifs (dots to the right of the dashed line). SMAD3 is shown as a top TF whose motif is enriched in WM12 module. Y-axis represents the −log2(FC) of the motif enrichment reported by FindMotifs in Seurat. X-axis represents the −log10(FDR) of the motif enrichment reported by FindMotifs in Seurat. Dashed line corresponds to FDR = 0.05. c, Genome visualization tracks of snATAC-seq open chromatin regions representing SMAD3 binding sites in the promoter of the WM12 hub gene SHANK2. The red ridge plot represents the snATAC-seq data. The SMAD3 binding sites are indicated in blue. d, Violin plot representing the log normalized expression (log(Norm Exp)) level (Y-axis) of SMAD3 for each cell-type defined by snRNA-seq. Adjacent dot plot represents the average expression (gradient) and percentage of cells (size) expressing SMAD3. e,f, Immunohistochemistry of independent human temporal lobe specimens demonstrates the specific expression of SMAD3 in excitatory (CAMKII-α+; e) but not in inhibitory (GAD67+; e) neurons, oligodendrocytes (OLIG2+; f), nor astrocytes (GFAP+; f) in BA38.
Overall, this multi-omics method allowed us to detect cell-type specific regulatory loci whose accessibility profiles were consistent with the cell-type gene expression. Using motif analysis, we explored the enrichment of TFs in the cell-type specific regulatory loci associated with the identified modules of memory oscillatory signatures. Among the modules with cell-type association, motif enrichment was detected only in WM12 (Fig. 6b; see Supplementary Table 6). Interestingly, we found WM12 showed enrichment for SMAD3 motifs, a WM12 hub gene (Fig. 6b; see Supplementary Table 6). Most remarkably, SMAD3 motifs were observed in the promoter regions of other WM12 hub genes associated with neuropsychiatric disorders and memory such as SHANK218 (Fig. 6c). In addition, WM12 contains genes associated with neuronal etiologies, and we found that SMAD3 is primarily expressed in excitatory neurons (Fig. 6d). This result was further confirmed using fluorescent immunohistochemistry from independently obtained tissue resections (Fig. 6e–f). Overall, these results highlight the role of specific transcription factors in the regulation of the chromatin landscape necessary to express putative genes associated with memory oscillatory signatures and provide novel molecular entry points for understanding human memory.
Discussion
We set out to understand the genomic underpinnings of oscillatory patterns that support episodic memory encoding in humans, with the goal of identifying genes that are propitious targets for neuromodulation strategies to treat memory disorders. Using an unparalleled data set of 16 human subjects from which we obtained measurements of brain oscillations linked to successful episodic memory encoding and transcriptomic data from the temporal pole in the same individuals, we identified modules of genes that link specific cell types and cellular functions with memory-related oscillatory signatures.
Our analysis is fundamentally different than previous attempts to correlate gene expression with behavioral measurements such as memory performance34,35. Oscillatory correlates of successful memory encoding represent an “intermediate step” between gene regulation and memory behavior. Oscillations are localized to the brain region in which they are recorded using intracranial depth electrodes and are dissociable into frequency bands with distinct properties. Linking neurophysiological measurements (such as these oscillatory signatures) with gene expression data will establish specific testable hypotheses in subsequent investigations for these identified genes. The hub genes described in Figure 3d may represent the most propitious targets for subsequent testing using animal models or other approaches.
Our work sheds light on the molecular mechanisms that give rise to oscillatory correlates of successful memory encoding36. Our observation that delta oscillatory signatures are linked to ion channel genes and that these genes tend to be expressed in oligodendrocytes leads to the fascinating implication that the generation of low-frequency oscillatory patterns linked to mnemonic processing in humans is at least partially dependent upon glial modulation of oscillations. This is based upon our observations across all subjects as well as the single nuclei expression analysis. This conclusion is supported by the role of oligodendrocytes in learning and memory acting on depolarization of membrane potential29,37, which accelerates axonal conduction and ion channel activity as reflected by the delta-associated modules with positive association (WM4 and WM12). Moreover, genes expressed in these positively associated modules are overrepresented in deep-layers of excitatory neurons implicated in memory encoding circuitry and delta rhythmicity formation38–40 and SST+/VIP+/PVALB+ expressing interneurons important for mediating cortical-hippocampal communication during memory encoding41. These results further support the role of the identified genes in memory encoding and specifically highlight cell-types that might be implicated in episodic memory.
We observed interesting properties for genes correlated with delta oscillations, but not theta oscillations which prima fascia runs contrary to rodent data that universally implicate theta frequency activity in successful memory formation. However, in the human temporal lobe, oscillations outside of the 4–9 Hz range routinely exhibit memory—relevant properties, including cross-frequency coupling, and thus our findings are in line with previous observations using oscillatory signatures of successful memory encoding in humans42. In humans these low frequency oscillations represent a consistent feature of oscillatory signatures of memory formation, including influence on the timing of single unit activity42–44. The significant representation of genes correlated with delta oscillatory signatures in our analysis may reflect the functional importance of these low frequency components in humans.
One caveat in interpreting our data is that all subjects suffer from intractable epilepsy. Clearly, the use of such a subject population is necessary to generate these highly valuable data with both in vivo oscillations and gene expression data from the same individuals in humans. However, several features of our analysis such as under-enrichment for genetic variants associated with epilepsy and the data integration with epileptic and healthy tissues give us confidence that the insights we have uncovered represent more generalizable associations between gene expression and brain oscillations. Further, numerous human studies have established that observations in iEEG patients have correlates using noninvasive studies in normal controls and in animal models45–47. Additionally, we employed strict artifact rejection criteria and eliminated electrodes located in the seizure onset zone in our analysis, reducing the impact of abnormal activity on observed oscillatory signatures48. We also integrated several control steps in our analysis including incorporation of duration of epilepsy to adjust gene expression values. Finally, several of the key genes we have identified (e.g. IL1RAPL2 and SMAD3) have been independently shown to be linked to memory processing in data from non-epileptic individuals and genetically modified rodent models. Even though these correlative analyses do not imply causality, these genes have been highlighted by stringent correlative statistics, by high connectivity in the modules associated with memory oscillations, and by cell-type expression specificity. Using this analytical approach, we defined IL1RAPL2 and SMAD3 as genomic markers for episodic memory for further investigation at the molecular level in model systems.
An important issue one must consider when using neurosurgical patients to obtain both oscillation and gene expression data relates to timing. Specifically, the use of human subjects simply does not allow collection of tissue specimens immediately after behavior-related oscillations are observed. Brain oscillations are dynamic, occurring during specific behavior, but gene expression “snapshots” are taken later in time, when patients underwent temporal lobectomy. Practically, this means that genes we identify as being linked to oscillatory signatures of successful memory formation necessarily must persist in their expression at least over a period of weeks, and that our study cannot identify genes whose expression is differentially induced (across subjects) due to mnemonic stimuli over shorter time scales. We also note that while we use the term “oscillations” to describe power extracted in six pre-defined frequency bands, we acknowledge that the measurement of subsequent memory effects may reflect power differences that arise due to differences in both narrowband oscillations and broadband power shifts. We include examples of narrowband oscillations detected in our data using the MODAL algorithm (see Methods). Future investigations may establish whether gene expression correlation patterns are additionally correlated with such “broadband” power shifts during encoding49, incorporating slope shifts or a quantification of episodes in which bursts of oscillations occur. Broadly stated, this area remains an active area of investigation in human electrophysiology50.
Collectively, this translational work establishes an experimental and analytical approach for deconstructing human behavioral and cognitive traits such as memory using integrative physiological and multi-omics techniques. Integration of single nucleus transcriptomic and epigenomic data allowed us to identify the cell type specificity of the memory-related gene co-expression modules as well as potential regulators of these modules. This molecular characterization of human memory highlights key genes that can be further studied in model systems. We anticipate that this within-subjects approach can be used in future studies to highlight molecular pathways of other human complex traits with the goal of identifying therapeutic targets and linking clinical and genomic data at the individual subject level. Importantly, investigations using animal and in vitro models will be necessary to definitively characterize the memory related properties of the genes identified in our analysis.
Methods
Experimental Model and subject details.
Participants and memory task.
The research protocol was approved by the Institutional Review Board at UT Southwestern and informed consent was obtained from each participant. Participants contributing gene expression data were recruited from the UT Southwestern surgical epilepsy program during a preoperative visit prior to temporal lobectomy. These participants underwent intracranial EEG to map seizure onset location. Participants needed to complete a full session of the free recall task with a minimum performance (recall fraction >10%) in order to be included. Participants preformed a free recall task consisting of multiple study/test cycles. During the study period, 12 words from a pre-selected pool of high-frequency, single-syllable, common nouns were visually presented, one at a time, on a computer screen for a duration of 1.6 s followed by a blank screen of 4 s with 100 msec of random jitter. Subjects were instructed to study each word as it appeared on the screen. The presentation of the last item in a list was followed by a 30 s period during which a math distractor task (A + B + C = ??) was performed to limit rehearsal. Participants were then instructed to verbally recall as many items as possible from the immediately prior list in no particular order. A full session consists of 12 full study/test cycles and 1 practice study/test cycle which was excluded from analysis. One complete session yielded electrophysiological recordings from 144 word encoding epochs (12 lists × 12 words) and a variable number of retrieval epochs. Participants performed between 1 and 9 sessions of the free-recall task over several days (median number 2). Behavioral performance was measured by calculating the fraction of successfully recalled memory items. List intrusion rate was measured for each subject (proportion of recall attempts that were classified as list intrusions relative to veridical recall). List intrusions constitute items seen on previous lists incorrectly recalled on the list being tested.
Intracranial Electroencephalography (iEEG) processing.
Intracranial-EEG data were recorded using a Nihon Kohden EEG-1200 clinical system. Signals were sampled at 1000 Hz and referenced to a common intracranial contact. Raw signals were subsequently re-referenced to an average reference montage, after excluding channels with frequent interictal activity or other noise following. All analyses were conducted using MATLAB with both built-in and custom-made scripts. We employed an automated artifact rejection algorithm to exclude interictal activity and abnormal trials (kurtosis threshold greater than 4), in line with previous publications using similar iEEG datasets51.
We compared oscillatory power the 1600 msec immediately following study item presentation for subsequently recalled and non-recalled words. The iEEG signal from each encoding epoch along with a 1500 msec flanking buffer was notch filtered at from 58 to 62 Hz to reduce possible line noise contamination (Butterworth, 1st order). The filtered signal was then subjected to spectral decomposition using the wavelet transform (width = 6) with log-spaced frequencies from 2 to 120 Hz. The decomposed spectral power values were then averaged across the entire 1600 msec period. Oscillatory power values were divided into trials for which items were later remembered (recalled) and trials for which items were not remembered (non-recalled). Oscillatory power for the recalled trials was compared to non-recalled trials at each frequency using a two-sample t-test to determine the subsequent memory effect (SME). We incorporated a permutation procedure, shuffling trial labels between the two classes 1000 times to generate an unbiased estimate of the type 1 error rate52. We obtained an estimate of the magnitude of the subsequent memory effect (SME) by identifying the position of the true t-statistic from the distribution of 1000 t-statistics resulting from randomly shuffled recalled and non–recalled event labels to generate a p value. We then applied normal inverse transformation to the p-values matrices of each electrode to convert them to SME Z-values to combine across frequency bands. In order to limit the overall number of comparisons in our analysis, we averaged the SME Z-values into six frequency bands (delta 2–4Hz, theta 4–8Hz, alpha 8–16Hz, beta 16–30Hz, low gamma 30–70Hz, and high gamma 70–120Hz). Because our goal was to determine how variance in memory related oscillatory patterns may depend on differences in gene expression, there was no SME threshold applied to filter which electrodes were included in the gene correlation analysis (we included all electrodes’ data). We made the a priori decision to average all SME estimates (Z values) across the region of interest (BA38) within each subject prior to calculating gene correlations, which we believed was the most unbiased method for this analysis. Data distribution was assumed to be normal but this was not formally tested.
We measured oscillatory power differences for successful versus unsuccessful math trials as well, for use in the control analysis described below. This utilized the same shuffle procedure as described above and same methods for extraction of signal across electrodes. To identify the presence of narrowband oscillations during successfully events during memory encoding, we used an oscillation detection algorithm. Artifact-free trials from BA38 region electrodes were used to identify peak frequencies using the Multiple Oscillation Detection Algorithm (MODAL) for frequency ranges from 2 to 50 Hz. This algorithm included a procedure to remove 1/f fit from the power spectrum and adaptively identify frequency bands53,54.
Anesthetic.
For all samples, we calculated the time under anesthetic prior to procurement of tissue using the time of initial anesthetic induction as documented in the “Anesthesia event” encounter in Epic patient care software. All cases were the first of the day, and a standardized anesthetic induction was utilized incorporating remifentanyl, propofol and rocuronium with desflurane as an inhalational agent during the procedure (0.5 MAC). All patients received dexamethasone prior to induction. The mean interval between induction and tissue processing from the temporal pole was 219+/−21 minutes (95% CI).”
FreeSurfer Segmentation.
FreeSurfer extraction form T1 mprage volume acquisition was used to quantify cortical thickness in the temporal pole55. Volume data for the temporal pole were identified from the aseg.stats files (in millimeters) for each subject (one value per subject).
Resected brain samples.
All surgical samples included in this study were BA38 resections from patients with temporal lobe epilepsy. The brain specimen was dropped into ice-cold 1X PBS in a 50mL conical tube immediately after removal from the patient. After 4–5 inversions, the tissue sample was transferred to a fresh tube with ice-cold 1X PBS for a second wash. The specimen was then moved to a petri dish and dissected grossly by scalpel into ~12 sub-samples and frozen immediately in individual Eppendorf tubes in liquid nitrogen as the tubes were filled. Care was taken to avoid major blood vessels. Gray matter was prioritized over tracts of white matter in an attempt to increase homogeneity and consistency of results across all samples. Time from removal of brain to flash freezing ranged from roughly two minutes for the first piece to about seven minutes for the last sub-sample. Three to four of the sub-samples were extracted for RNA, and the sub-sample with the highest RIN value was selected for RNA-sequencing. See Supplementary Table 1 for detailed demographic information.
Tissue preparation for sequencing.
Postmortem brain samples.
Twelve samples of BA38 were obtained from the Dallas Brain Collection. These tissue samples were donated from individuals without a history of neurological or psychiatric disorders as previously published56. Eight samples of BA38 were obtained from the University of Maryland Brain and Tissue Bank. These samples were donated from individuals with epilepsy. See Supplementary Table 1 for detailed demographic information.
RNA-sequencing (RNA-seq).
Total RNA was purified using an miRNeasy kit (#217004, Qiagen) following the manufacturer’s recommendations. RNA-seq libraries from mRNA were prepared in-house as previously described57. Sequencing was performed on randomly pooled samples by the McDermott Sequencing Core at UT Southwestern on an Illumina NextSeq 500 sequencer. Single-end, 75-base-pair (bp) reads were generated. Data collection and analysis were not performed blind to the conditions of the experiments.No statistical methods were used to pre-determine sample sizes because of the limitation of availability of human brain surgical tissues
Isolation of nuclei from resected brain tissues (snRNA-seq).
Nuclei were isolated as previously described58 https://www.protocols.io/view/rapid-nuclei-isolation-from-human-brain-scpeavn. Surgically resected cortical tissue was homogenized using a glass Dounce homogenizer in 2 ml of ice-cold Nuclei EZ lysis buffer (#EZ PREP NUC-101, Sigma) and was incubated on ice for 5 min. Nuclei were centrifuged at 500 × g for 5 min at 4 °C, washed with 4 ml ice-cold Nuclei EZ lysis buffer and, incubated on ice for 5 min. Nuclei were centrifuged at 500 × g for 5 min at 4 °C. After centrifugation, the nuclei were resuspended in 1 ml of nuclei suspension buffer (NSB) consisting of 1XPBS, 1%BSA (#AM2618, Thermo Fisher Scientific) and 0.2U/ul RNAse inhibitor (#AM2694, Thermo Fisher Scientific) and were filtered through a 40-μm Flowmi Cell Strainer (#H13680–0040, Bel-Art). Nuclei concentration was determined using 0.4% Trypan Blue (#15250061, Thermo Fisher Scientific). Final concentration of 1000 nuclei/μl was adjusted with NSB. Droplet-based snRNA-seq libraries for the first batch were prepared using the Chromium Single Cell 3’ v2 (#120237, 10x Genomics) according to the manufacturer’s protocol59. Libraries were sequenced using an Illumina NextSeq 500 at the McDermott Sequencing Core (UT Southwestern). Droplet-based snRNA-seq libraries for the second batch were prepared using the Chromium Single Cell 3’ v3 (#1000075, 10x Genomics) according to the manufacturer’s protocol. Libraries were sequenced using an Illumina NovaSeq 6000 at the North Texas Genome Center (UT Arlington).
Isolation of nuclei from resected brain tissue (snATAC-seq).
For snATAC-seq, nuclei were isolated as described above. After lysis, the nuclei were washed once in 500 μl of nuclei wash buffer consisting of 10mM Tris-HCl (pH 7.4), 10mM NaCl, 3mM MgCl2, 1% BSA and, 0.1% Tween-20. Nuclei were resuspended in 500 μl of 1X Nuclei Buffer (10X Genomics). Debris was removed with a density gradient centrifugation using the Nuclei PURE 2M Sucrose Cushion Solution and Nuclei PURE Sucrose Cushion Buffer from Nuclei PURE Prep Isolation Kit (#NUC201–1KT, Sigma Aldrich). Nuclei PURE 2M Sucrose Cushion Solution and Nuclei PURE Sucrose Cushion Buffer were first mixed in 9:1 ratio. 500 μl of the resulting sucrose buffer was added to a 2 ml Eppendorf tube. 900 μl of the sucrose buffer was added to 500 μl of isolated nuclei in NSB. 1400 μl nuclei suspension was layered to the top of sucrose buffer. This gradient was centrifuged at 13, 000 × g for 45 min at 4 °C. Nuclei pellets were resuspended and washed once in nuclei wash buffer. Nuclei concentration and integrity were determined using Ethidium Homodimer-1 (EthD-1) (#E1169, Thermo Fisher Scientific). Finally, nuclei were resuspended in 1X Nuclei Buffer at concentration of 4000 nuclei/μl for single-cell ATAC-sequencing. Droplet-based single-cell ATACseq libraries were prepared using the Chromium Single Cell ATAC Kit Solution v1.0 (10X Genomics) and following the Chromium Single Cell ATAC Reagent Kits User Guide: CG000168 Rev B. The library was sequenced using an Illumina NextSeq 500 at the McDermott Sequencing Core at UT Southwestern.
Immunofluorescence staining of human tissue.
Fresh surgically resected tissue was fixed in 4% PFA in 1x PBS 24–48h at 4C and then cryoprotected in a 30% sucrose solution. The tissue was sectioned at 7 µm using a cryostat (Leica). Sections underwent heat induced antigen retrieval in a citrate buffer (pH 6.0) for 10 min at 95 C. Sections were blocked with 2% fetal bovine serum (FBS) in 0.1M Tris (pH 7.6) for 1hour at room temperature. After blocking, the sections were incubated with primary antibodies in 0.1 M Tris pH 7.6/2% FBS overnight at 4C and subsequently incubated with secondary antibodies in 0.1M Tris pH pH 7.6/2% FBS for 1 h at room temperature. Sections were immersed in 0.25% Sudan Black solution to quench lipofuscin auto-fluoresce and counterstained with 4′−6-diamidino-2-phenylindole (DAPI). Sections were mounted and cover slipped using ProLong Diamond Antifade Mountant (#P36970, Thermo Fisher Scientific). The following antibodies and dilutions were used: goat α-IL1RAPL2 (#PA5–47039, Thermo Fisher Scientific 1:20), rat α-SMAD3 (#MAB4038, R&D Systems, 1:100), rabbit α-CaMKII alpha (#PA514315, Thermo Fisher Scientific, 1:50), chicken α-GFAP (#ab4674, Abcam, 1:400), mouse α-GAD67 (#MAB5406, Millipore, 1:200), mouse α-OLIG2 (#MABN50,Millipore, 1:200), species-specific secondary antibodies produced in donkey and conjugated to Alexa Fluor 488, Alexa Fluor 555, or Alexa Fluor 647 (Thermo Fisher Scientific, 1:800). Images were acquired using a 63X oil objective on a Zeiss LSM 880 confocal microscope. Secondary antibody only experiments were conducted for each antibody to ensure specificity. ILRAPL2 antibody was validated by Thermo Fisher Scientific using flow cytometry of human HepG2 cells. SMAD3 antibody was validated by R&D Systems using flow cytometry in human PC-3 cells and IHC in human pancreatic cancer tissue and human MDA-MB-231 cells60. CamKII antibody was validated by Thermo Fisher Scientific using IHC in human brain and western blotting in human 293 cells61. GFAP antibody was validated by Abcam across many species including human. Protocol validations include IHC and immunofluorescence. 211 references are provided for this antibody at https://www.abcam.com/gfap-antibody-ab4674.html. GAD67 antibody was validated by Millipore in human brain via immunohistochemistry. Over 75 references are provided at http://www.emdmillipore.com/US/en/product/Anti-GAD67-Antibody-clone-1G10.2,MM_NF-MAB5406#anchor_BRO. OLIG2 antibody has been validated by Millipore in human via IHC. 15 references are provided at http://www.emdmillipore.com/US/en/product/Anti-Olig2-Antibody-clone-211F1.1,MM_NF-MABN50#documentation. Immunofluorescence staining was performed in 4 different surgically resected tissues (N=4). A representative optimized image is shown.
Computational Methods.
Bulk RNA-seq mapping, QC and expression quantification.
Quality control was performed using FastQC (v0.11.9). Reads were aligned to the human hg38 reference genome using STAR (v2.5.2b)62. For each sample, a BAM file including mapped and unmapped reads that spanned splice junctions was produced. Secondary alignment and multi-mapped reads were further removed using in-house scripts. Only uniquely mapped reads were retained for further analyses. Quality control metrics were performed using RSeQC (v2.6.4)63 with the hg38 gene model provided. These steps include: number of reads after multiple-step filtering, ribosomal RNA reads depletion, and defining reads mapped to exons, UTRs, and intronic regions. Picard tool was implemented to refine the QC metrics (http://broadinstitute.github.io/picard/) and calculate sequencing statistics. Gencode annotation for hg38 (version 24) was used as reference alignment annotation and downstream quantification. Gene level expression was calculated using HTseq (v0.9.1)64 using intersection-strict mode by gene. Counts were calculated based on protein-coding genes from the annotation file.
Covariate adjustment.
Counts were normalized using counts per million reads (CPM) with edgeR (v3.32.0) package in R65. Normalized data were log2 scaled with an offset of 1. Genes with no reads were removed. A total of 15192 genes were used for the downstream analysis.
Normalized data were assessed for effects from known biological covariates (Sex, Age, Race, Ethnicity, Hemisphere, Epilepsy Duration), technical variables related to sample processing (RNA integrity number: RIN, Batch). PMI (post-mortem interval) was not considered in the analysis because it was confounded with the brain resected data from living individuals.
Residualizations were calculated using the following model:
| Gene Expression ~ Age + Sex + Race + Ethnicity + EpDur + RIN + Hemisphere + Batch |
Residuals were extracted and average gene expression added:
| Adjusted Gene Expression = residuals + average gene expression |
We applied two residualizations:
Resected Tissues
Resected Tissues + Frozen Tissues
The adjusted CPM from the 16 subjects were used for SME correlation and quantile regression. The adjusted CPM from resected tissue and frozen tissue were used for the consensus WGCNA analysis and permutations/bootstraps analysis.
Multivariate Analysis.
We performed a multivariate analysis based on the following model:
| Gene Expression ~ SME:Band + EpDur + RIN + Batch + (1/Subjects) |
Due to the limited sample size and because we did not want to over-parametrize the model, we utilized the three fixed covariates that explained the highest variance in the data (EpDur, RIN, Batch). Contrasts were used to compare SME association between waves. Genes with FDR < 0.05 were considered to be differentially associated with SME. The analysis was performed using edgeR (v3.32.0)65. These results were integrated with the correlative analysis to define the final 300 SME genes. The code used for this analysis is available in GitHub.
Correlation analysis and permutation analysis.
Spearman’s rank correlation was performed between each of the six memory brain oscillations and gene expression. We also utilized this method for six math brain oscillations, thickness and behavioral performances.
For this analysis we used:
Within Subject: bulk RNA-seq from Brodmann’s area 38 resected tissue of 16 subjects with calculated SME (WrS).
We next performed permutations/bootstraps analysis using data from:
Additional Subjects: additional 11 subjects of bulk RNA-seq from Brodmann’s area 38 resected tissue without SME (ArS).
Independent Data Healthy: bulk RNA-seq from Brodmann’s area 38 frozen tissue of 12 subjects (HfS).
Independent Data Epilepsy: bulk RNA-seq from Brodmann’s area 38 frozen tissue of 8 subjects with Epilepsy (EfS).
Bootstrap was applied randomly subsampling 16 subjects (as WrS) from the composite data and recalculating the correlation 100 times. We then calculated a Monte Carlo p-value comparing the observed effect with the simulated effects for each gene by:
| sum(abs(simulated rho) >= abs(observed rho))/100 |
We calculated two Monte Carlo p-values:
BootP based on WrS + ArS (only resected tissues)
BootP_All based on WrS + ArS + HfS + EfS (resected tissues and frozen tissues)
We additionally applied a permutation approach shuffling the gene expression of WS and recalculating 100 times the correlation between oscillations and gene expression. We then calculated a Monte Carlo p-value (PermP). Nominal p.value < 0.05, PermP < 0.05, BootP < 0.05 and BootP_All < 0.05 were used to filter for significant correlations as reported in Table S2.
Co-expression network analysis.
To identify modules of co-expressed genes in the RNA-seq data, we carried out weighted gene co-expression network analysis (WGCNA v1.69)66. We applied a consensus analysis based on WrS + ArS + HfS + EfS data defining modules highly preserved across multiple datasets. This method was applied to reduce the potential noise between different types of data. A soft-threshold power was automatically calculated to achieve approximate scale-free topology (R2>0.85). Networks were constructed with blockwiseConsensusModules function with biweight midcorrelation (bicor). The modules were then determined using the dynamic tree-cutting algorithm. To ensure robustness of the observed network, we used a permutation approach recalculating the networks 200 times and comparing the observed connectivity per gene with the randomized one. None of the randomized networks showed similar connectivity, providing robustness to the network inference. Module sizes were chosen to detect small modules driven by potential noise on the adjusted data. Deep split of 4 was used to more aggressively split the data and create more specific modules. Spearman’s rank correlation was used to compute module eigengene – memory oscillatory signature associations.
Single-nuclei RNA-seq analysis.
Single-nuclei RNA-seq data from BA38 was processed using mkfastq command from 10X Genomics CellRanger (v3.0.1). Extracted paired-end fastq files (26/28 bp (v2, v3) long R1 - cell barcode and UMI sequence information, 124 bp long R2 - transcript sequence information) were checked for read quality using FastQC (v0.11.9). Gene counts were obtained by aligning reads to the hg38 genome using an in-house pipeline. UMI-tools (v1.0.0)67 was used to generate a whitelist of barcodes and extract reads to match the detected barcodes. Reads were aligned to the human hg38 reference genome using STAR 2.5.2b62. Gencode annotation for hg38 (version 24) was used as reference alignment annotation. Gene level expression was calculated using featureCounts (v1.6.0)68 by gene. UMIs per gene across all detected nuclei were further calculated using UMI-tools. Two batches of three subjects were processed for a total of six subjects. Nuclei with > 10000 UMI and > 5% of mitochondrial gene expressed were removed. Downstream analysis was performed with Seurat (v3.9.9)69. Briefly we normalized the expression data using and integrated the two different batches of sequencing by SCtransform, retaining 3,000 variable genes. We constructed a k-nearest neighbor graph based on Euclidian distance in 30 PCs space and identified distinct clusters of cells using the Leiden algorithm (resolution = 0.8). Clusters visualization was performed by applying the function RunUMAP() based on Uniform Manifold Approximation and Projection (UMAP)70 in two dimensions. Cell-type markers were identified by Wilcoxon’s rank sum test (two-sided; Benjamini-Hochberg adjusted; FDR < 0.05, log2(FC) > 0.3, pct.1 > 0.5). Clusters were annotated based on markers enrichment with markers defined by middle temporal gyrus data71. Briefly, data was downloaded from the Allen portal (https://portal.brain-map.org/atlases-and-data/rnaseq). Seurat was used to define the markers for each clusters by Wilcoxon’s rank sum test (two-sided; Benjamini-Hochberg adjusted; FDR < 0.05, log2(FC) > 0.3, pct.1 > 0.5). Statistics for the overlap between BA38 and MTG markers was performed by Fisher’s Exact test (one-sided with alternative greater; Benjamini-Hochberg adjusted). Labels for BA38 cell types were selected by using the highest significant enrichment defined by an odds ratio with FDR < 0.05. These labels were used for all downstream analysis and snATAC-seq integration. The code used for this analysis is available in the GitHub.
Single-nuclei ATAC-seq analysis.
Single-nuclei ATAC-seq data from BA38 of three subjects were processed using Cell Ranger ATAC pipeline. Seurat extension Signac (v1.1.0)69 was used for additional filtering, clustering and annotation. Cells with total fragments in peaks less than 1500 or less than 15% of the total fragments were not considered for further analysis. Clustering and creating a gene activity matrix were done with the default parameters. Only the cells with >0.5 confidence in annotation were considered for downstream analysis. Gene activity matrix was produced counting fragments in gene body + 2kb upstream. Identified clusters were cross-referenced to the snRNA-seq data using Seurat integration workflow. Clusters visualization was performed by applying Uniform Manifold Approximation and Projection (UMAP)70 in two dimensions. Motif enrichment testing was applied to the upstream regions of the genes in each module. Motif analysis was performed only for the modules with cell-type enrichment (WM4/WM12: excitatory-inhibitory clusters, WM21: oligodendrocyte-OPC clusters). Fragments for excitatory-inhibitory clusters and oligodendrocyte-OPC clusters were extracted separately from Cell Ranger’s fragments.tsv file. For each cut site, the fragments.tsv file was adjusted to contain 200bp around the cut site and peaks were called using MACS2 (v2.1.1)72. The CIS-BP database for human was used for enrichment (http://cisbp.ccbr.utoronto.ca/index.php)73. Only TFs with directly determined motifs were kept. TFs were filtered for presence in > 30% of cells in the cluster that is tested for enrichment. A motif matrix (peaks in rows, motifs in columns) was created with CreateMotifMatrix from Signac. Using the FindMotifs function from Signac, enrichment of each TF was tested for the upstream peaks of module genes versus upstream peaks of all genes using all the peaks as background. Peak visualization was done using IGV (v2.8.13)74. The code used for this analysis is available in the GitHub.
Functional Enrichment.
The functional annotation of the genes within the modules was performed using GOstats (v2.56.0)75 and confirmed by ToppGene76. We used GO and KEGG databases. Expressed genes (15192) were used as background. A one-sided hypergeometric test was performed to test overrepresentation of functional categories. A Benjamini-Hochberg adjusted p-value was applied as a multiple comparisons adjustment.
Neuropsychiatric genes.
Autism spectrum disorders associated genes used for Figure 4c were downloaded from SFARI database77. ASD (1–3) are ASD genes with score between 1–3. Modules and genes differentially expressed in ASD, SCZ, and BD were downloaded from an independent source78. Differentially expressed cell-type markers from single-nuclei RNA-seq of ASD and AD were downloaded from independent sources79,80.
GWAS data and enrichment.
We used genome-wide gene-based association analysis implementing MAGMA (v1.07)81. We used the 19346 protein-coding genes from human gencode v19 as background for the gene-based association analysis. SNPs were selected within exonic, intronic, and UTR regions as well as SNPs within 10kb up/down-stream the protein-coding gene. SNP association revealed 18988 protein-coding genes with at least one SNP. Gene based association tests were performed using linkage disequilibrium between SNPs. Benjamini-Hochberg correction was applied and significant enrichment is reported for FDR < 0.05. Summary statistics for GWAS studies on neuropsychiatric disorders and non-brain disorders were downloaded from Psychiatric Genomics Consortium and GIANT Consortium82–96. Supplementary Table 4 reports MAGMA statistics for each of the GWAS data analyzed. GWAS acronyms were used for the figures (e.g. ADHD = attention deficit hyperactivity disorder, ASD = autism spectrum disorders, AD = Alzheimer’s disease, BIP = bipolar disorder, EP = epilepsy, MDD = major depressive disorder, SZ = schizophrenia, EduAtt = educational attainment, Intelligence = Intelligence, CognFunc = cognitive functions, BMI = body mass index, CHD = coronary artery disease, DIAB = diabetes, HGT = height, OSTEO = osteoporosis).
Gene set enrichment.
Gene set enrichment was applied to correlated genes and SME genes from our previous study as shown in Fig. 3c, SME genes from the current study as shown in Extended Data Fig. 3c, neuropsychiatric DEGs as shown in Fig. 4a and Extended Data Fig. 4b, ASD genes as shown in Fig. 4c, and cell-type markers as shown in Fig. 5c and Extended Data Fig. 5h–i. We used a Fisher’s exact test in R with the following parameters: alternative = “greater”, conf.level = 0.95. We reported Odds Ratios (OR) and Benjamini-Hochberg adjusted P-values (FDR).
Extended Data
Extended Data Fig. 1. Data quality control.
a, Box plots depicting the probability of recall for items presented at each serial position. Primacy and recency effects are visible, consistent with expectations for performance in the free recall episodic memory paradigm. Whiskers on box plots represent maximum and minimum values. Boxes extend from the 25th to the 75th percentiles, the center lines represent the median. Loess regression with confidence intervals is superimposed to depict the overall distribution. Smooth curves are shown with 95% confidence bands b, Lag conditional response probability curves in our data (lag CRP), indicating expected temporal clustering behavior. Loess regression with confidence intervals depicts the overall distribution. Smooth curves are shown with 95% confidence bands. c, Boxplot showing the comparison of within-subject variance (across all measured electrodes at each band, blue box plot,) with the variance across subjects (at each band, yellow box plot). Across subjects variance is significantly greater than within-subject variance. Reported p-value from Wilcoxon rank sum test (one-sided with alternative greater). Boxplots extend from the 25th to the 75th percentiles, the center lines represent the median. d, Scatter plot showing the fraction of all BA38 electrodes exhibiting a significant subsequent memory effect at each frequency. We observed significant differences predicting recall success across the frequency spectrum, including the delta and gamma bands. Loess regression with confidence intervals depicts the overall distribution. Smooth curves are shown with 95% confidence bands. e, Distribution of SME values for each brain oscillation and cross-correlation based on Spearman’s rank correlation. f, Barplots showing the fraction of electrodes at which oscillations were detected in each frequency band in the recalled and non-recalled conditions. 85% of electrodes exhibited an oscillation in at least one of the delta, theta, or alpha frequency bands. g, Scatter plot showing individual electrode examples of power curves used for oscillation detection via the MODAL algorithm, both before and after subtraction of the best fit line. h, Principal component analysis of the subjects used for the within-subject analysis. Variance explained by each principal component is highlighted in the axis. i, Barplot showing the variance explained by each covariate adjusted across 10 principal components (wVE) for the within-subject data. Technical, biological and sequencing covariates calculated by PICARD (see Methods) are included. l, Principal component analysis of all the subjects used in this study. PMep = post-mortem epileptic subjects, UT = within-subjects, PMctl = post-mortem healthy subjects. m, Variance explained by each covariate adjusted across 10 principal components (wVE). Type corresponds to the three different types of data included in the analysis (PMep, UT, PMctl). Technical, biological and sequencing covariates calculated by PICARD (see Methods) are included. n, Association between the first two components and covariates based on adjusted gene expression. X-axis corresponds to the −log10(P-value) from linear regression modeling between PCs and covariates.
Extended Data Fig. 2. SME gene robustness and overlap with other tasks.
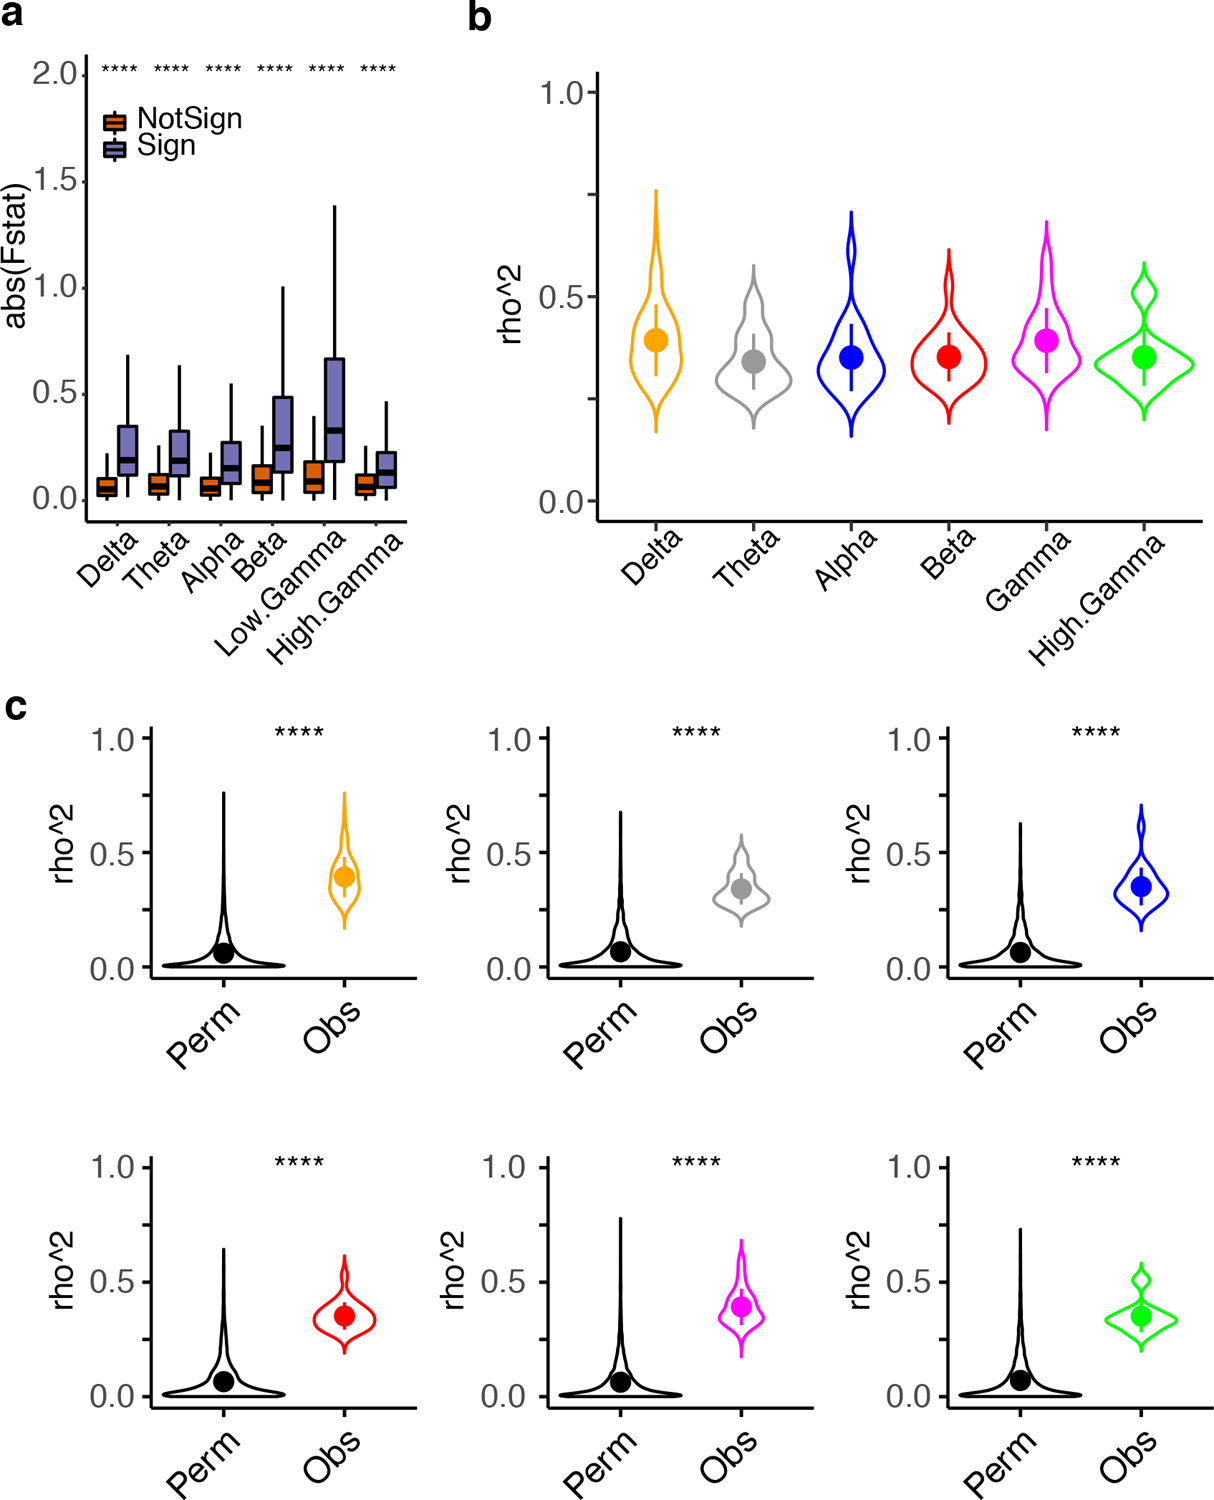
a, Boxplot showing the difference between F-statistics of the SME genes (Multivariate analysis) compared with the other genes. Stars correspond to the Wilcoxon’s rank sum test (N, Sign = 753, NotSign = 14439; one-sided with alternative greater; p < 0.0001 = ****; Benjamini-Hochberg adjusted: Delta, FDR = 2.3×10−249, Theta, FDR = 3.2×10−205, Alpha, FDR = 4.1×10−140, Beta, FDR = 2.1×10−159, Low Gamma, FDR = 7.2×10−207, High Gamma, FDR = 1.3×10−63). Boxes extend from the 25th to the 75th percentiles and the center lines represent the median. b, Violin plots showing the rho^2 of the genes significantly associated with each brain oscillation. Standard errors are calculated based on the rho^2 distribution of the significantly correlated genes. Dots represent the median rho^2 for the specific brain oscillation. c, Violin plots showing the rho^2 of the genes significantly associated with each brain oscillation (Obs = observed) compared with rho^2 derived from the permutation control analyses (Perm = Permutation). Standard errors are calculated based on the rho^2 distribution of the significantly correlated genes. Dots represent the median rho^2 for the specific brain oscillation. 100 random permutations were applied to calculate the Perm values (see Methods). Stars correspond to the Wilcoxon’s rank sum test (unadjusted, one-sided with alternative greater; p < 0.0001 = ****).
Extended Data Fig. 3. WGCNA highlights modules associated with memory oscillations.

a, Representative network dendrogram for the consensus WGCNA. Heatmap shows the correlation between memory oscillatory signatures and genes. Red = positively correlated, Blue = negatively correlated. b, Heatmap showing the module association between memory oscillatory signatures and module eigengenes (Spearman’s rank correlation). Warm colors represent positive correlations and cool colors represent negative correlations. P-values for each correlation together with exact correlation values are contained within each box. c, Bubble-chart showing the enrichment for 300 SME genes decomposed by brain oscillation. Gradient color represents the −log10(FDR) and bubble size represents the odds ratio (OR) from a Fisher’s exact enrichment test of each module with disease-relevant gene lists. Y-axis shows the brain oscillations labels. X-axis indicates the modules of the present study. d, Boxplots showing the differential connectivity (e.g. number of edges) between SME genes and non-SME genes in the modules associated with memory oscillatory signatures with SME genes enriched. Stars correspond to the results of a Wilcoxon’s rank sum test (one-side test with alternative greater; p < 0.001 = ****, p < 0.01 = **, p < 0.05 = *; Benjamini-Hochberg adjusted: WM4, FDR = 0.016, WM12, FDR = 0.048, WM21, FDR = 4.5×10⁻⁴). Boxes extend from the 25th to the 75th percentiles and the center lines represent the median.
Extended Data Fig. 4. Memory-related modules are enriched for gene co-expression modules associated with neuropsychiatric disorders.
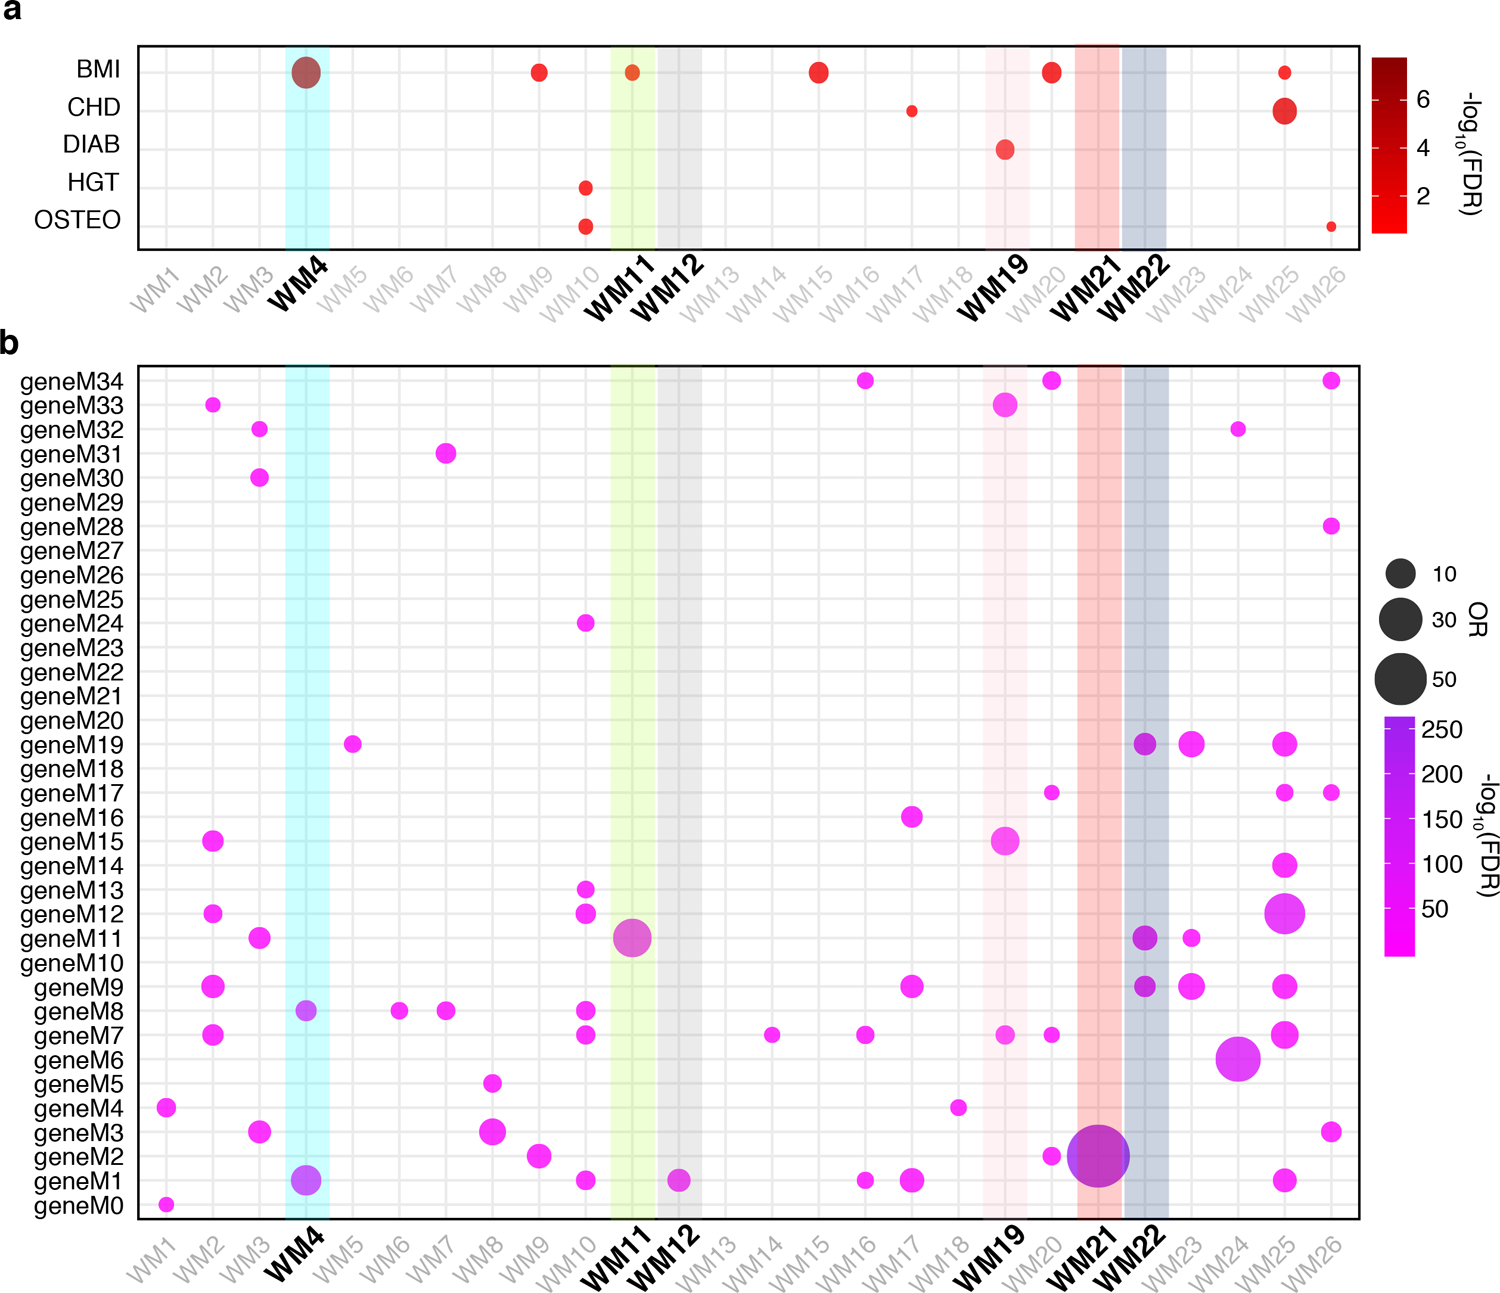
a, Bubble-chart showing the enrichment for loci associated with human traits used as negative controls. Gradient color represents the −log10(FDR) from linkage disequilibrium gene set analysis performed by MAGMA. Y-axis shows the acronyms for the GWAS data utilized for this analysis (see Methods). b, Bubble-chart showing the enrichment for modules of co-expressed genes dysregulated in ASD, SCZ or BD. Gradient color represents the −log10(FDR) and bubble size represents the odds ratio (OR) from a Fisher’s exact enrichment test. Y-axis shows the acronyms for the modules associated with neuropsychiatric disorders utilized for this analysis (see Methods). X-axis shows the modules of the present study. Modules significantly correlated with memory-related oscillations are highlighted in bold text.
Extended Data Fig. 5. snRNA-seq quality control metrices and module enrichment for cell-types dysregulated in cognitive disorders.

a, Barplot showing the total number of nuclei identified per subject. Colors correspond to the two different batches. b, Quality control boxplots for snRNA-seq with number of genes detected, number of UMIs and percentage of mitochondrial genes. Colors correspond to the two different batches. Boxes extend from the 25th to the 75th percentiles and the center lines represent the median. Dots represent outliers. c, Scatter plot showing the relationship between number of UMIs (X-axis) and detected genes (Y-axis). Each sample is indicated in a different color. d, UMAP plots showing the distribution of nuclei in each subject. Colors correspond to the two different batches. e, Proportion of nuclei representing the identified clusters. Colors correspond to the six different subjects analyzed. f, UMAP plots showing the distribution of the three major cell-classes: GABAergic (blue), Glutamatergic (red), and non-neuronal (green). g, Pie chart showing the proportion of the three major cell-type classes (GABAergic, Glutamatergic, and non-neuronal cells). h, Bubble-chart showing the enrichment of the SME modules for cell-type markers dysregulated in ASD. Color gradient represents the −log10(FDR) and bubble size represent the odds ratio (OR) from a Fisher’s exact enrichment test. Y-axis shows the acronyms for the cell-types defined in the ASD study. i, Bubble-chart showing the enrichment of the SME modules for cell-type markers dysregulated in Alzheimer disease (AD). Color gradient represents the −log10(FDR) and bubble size represent the odds ratio (OR) from a Fisher’s exact enrichment test. Y-axis shows the acronyms for the cell-types defined in the AD study.
Extended Data Fig. 6. snATAC-seq quality control metrices.
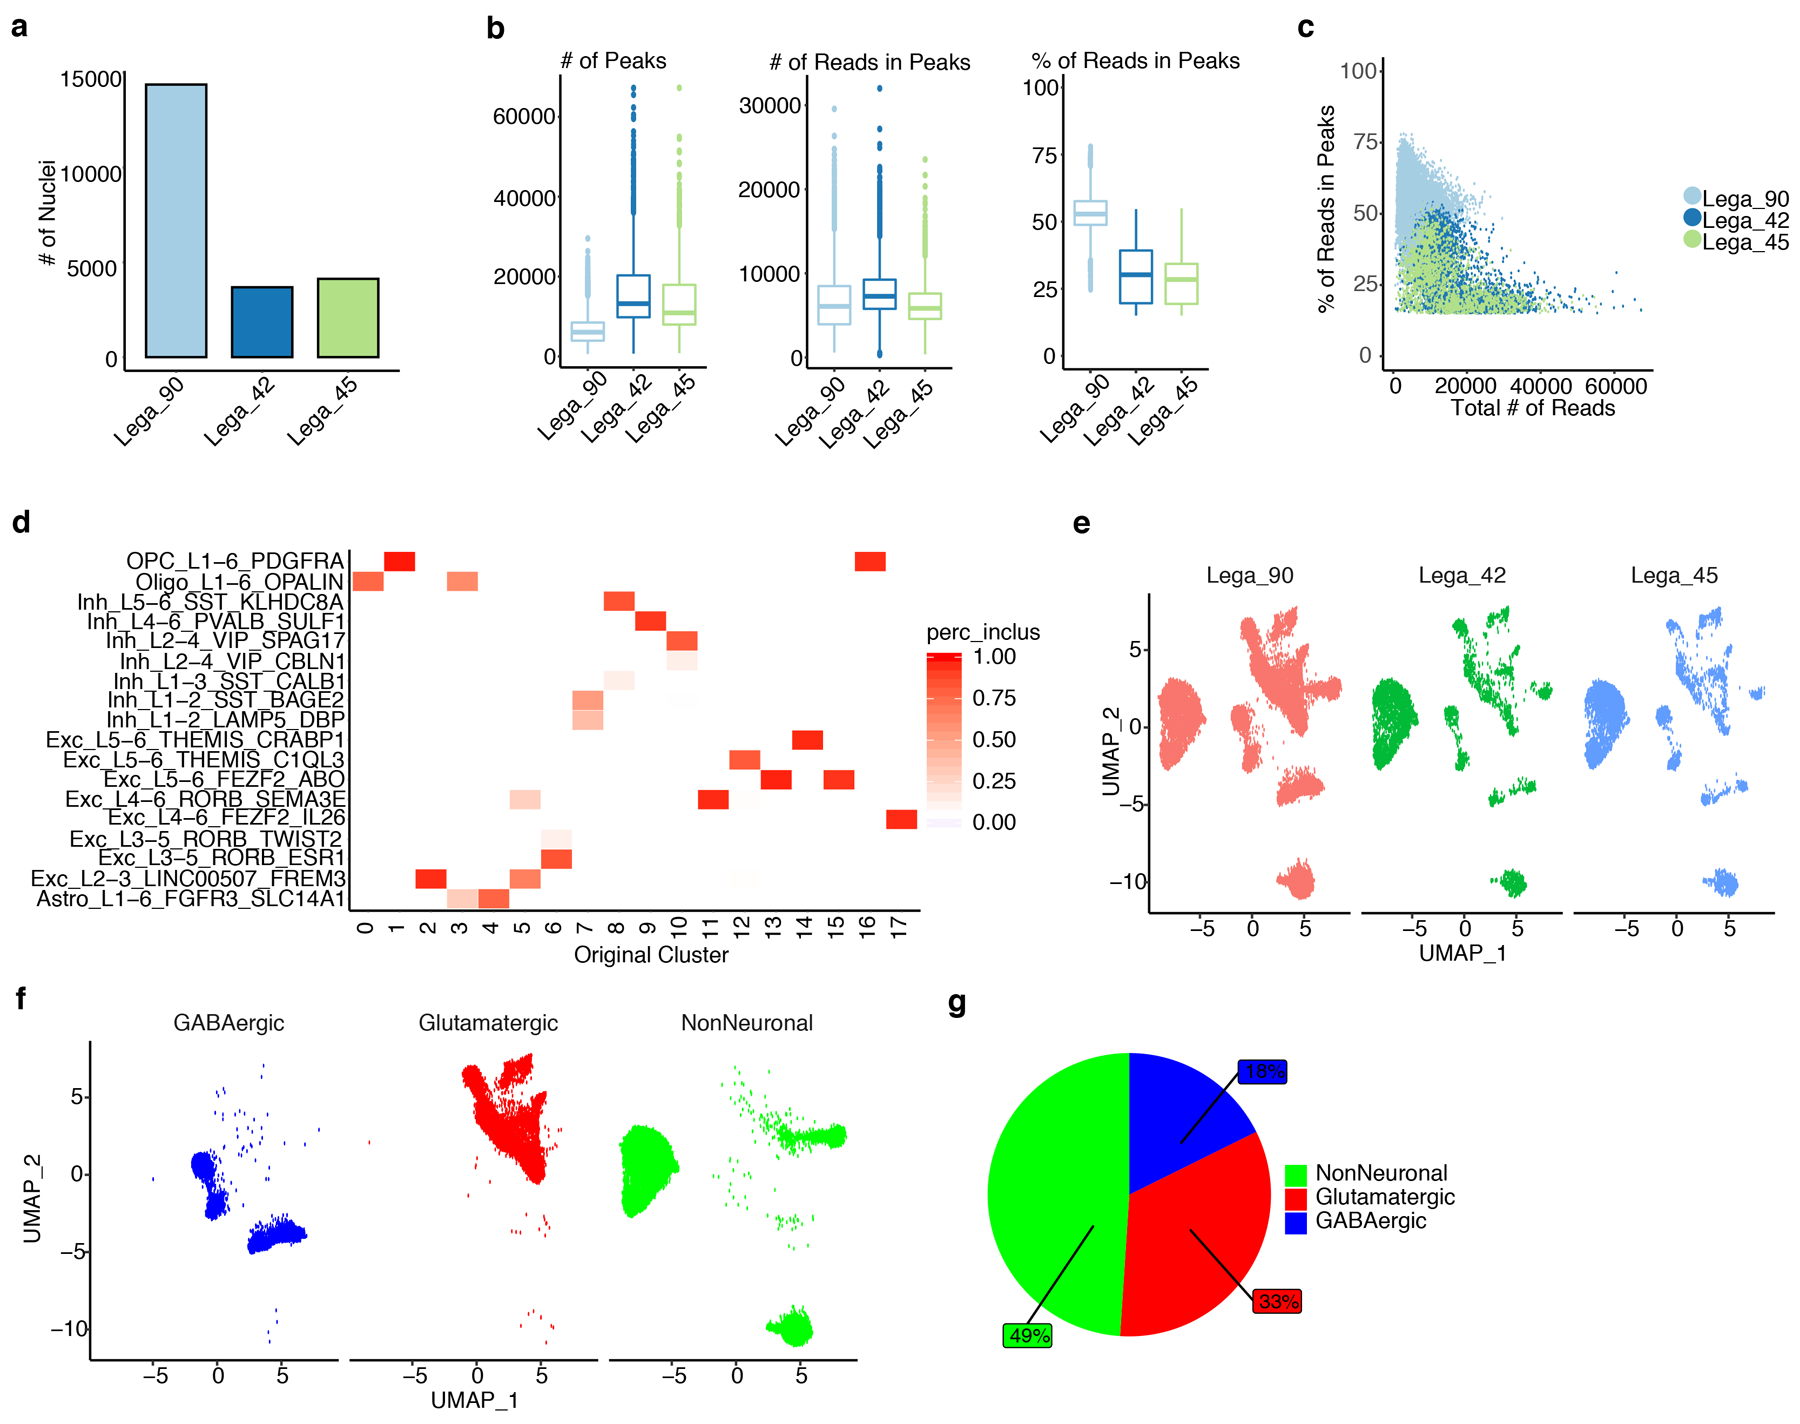
a, Barplot showing the total number of nuclei identified per subject. b, Quality control boxplots for each snATAC-seq sample demonstrating the total number of peaks, the number of reads in the peaks and the percentage of reads in peaks. Boxes extend from the 25th to the 75th percentiles and the center lines represent the median. Dots represent outliers. c, Scatter plot showing the relationship between total number of reads (X-axis) and percentage of reads in the peaks (Y-axis). Each sample is indicated in a different color. d, Heatmap of the pairwise similarity between cluster identities. Y-axis shows the snRNA-seq clusters. X-axis shows the snATAC-seq clusters. Gradient corresponds to the percentage of cells for the corresponding prediction label. e, UMAP plots showing the distribution of nuclei in each subject. f, UMAP plots showing the distribution of the three major cell-classes: GABAergic (blue), Glutamatergic (red), and non-neuronal (green). g, Pie chart showing the proportion of the three major cell-type classes.
Supplementary Material
All statistics for GWAS enrichment in memory associated modules.
Genes differentially expressed in each cell-type with relative statistics.
Motif enrichment statistics for memory modules associated with specific cell-types.
Demographic data with subjects, technical covariates, biological covariates, sequencing covariates, SME data, MATH data, MRI data, and behavioral performance metrices.
All statistics for module detection, overlap with memory correlated genes, and database for association with previous studies.
All statistics for genes correlated with each brain oscillation and database for association with previous studies.
Acknowledgments
We thank the patients for participating in the study and the donors and their families for the additional tissue samples. We also thank Kelly Gleason for assistance with post-mortem samples. G. K. is a Jon Heighten Scholar in Autism Research at UT Southwestern. This work was supported by NIMH (F30MH105158) to M.F.; NIDA (5T32DA007290–25) and NHBLI (1T32HL139438–01A1) to F.A.; NINDS (NS106447), a UT BRAIN Initiative Seed Grant (366582), the Chilton Foundation, and the National Center for Advancing Translational Sciences of the NIH under the Center for Translational Medicine’s award number UL1TR001105, to B.L. and G.K.; NINDS (NS107357) to B.L.; and NIMH (103517), The Chan Zuckerberg Initiative, an advised fund of Silicon Valley Community Foundation (HCA-A-1704–01747), and the James S. McDonnell Foundation 21st Century Science Initiative in Understanding Human Cognition – Scholar Award (220020467) to G.K. Post-mortem human tissue samples were obtained from the NIH NeuroBioBank (The Harvard Brain Tissue Resource Center, funded through HHSN-271–2013–537 00030C; the Human Brain and Spinal Fluid Resource Center, VA West Los Angeles Healthcare Center; and the University of Miami Brain Endowment Bank) and the UT Neuropsychiatry Research Program (Dallas Brain Collection). We also thank the UT Southwestern Neuroscience Microscopy Facility for providing imaging resources.
Footnotes
Competing interests
The authors declare no competing interests.
Code Availability
Custom R codes for the quality control, multivariate analysis, correlative analysis, permutation/bootstraps, WGCNA analysis, snRNA-seq analysis, snATAC-seq analysis, visualizations, functional enrichments, GWAS enrichment, and gene set enrichments are available at https://github.com/konopkalab/Within_Subject
Statistical Analysis and Reproducibility
No statistical methods were used to pre-determine sample sizes because of the limited availability of human brain surgical tissues. Subjects were not randomly selected for inclusion in the study based on the availability of human tissue/oscillation data. However, tissue pieces were randomized for processing for RNA-seq. Data collection and analysis of human subjects were not performed blind to the conditions of the experiments. However, separate individuals carried out wet-bench and dry-bench analyses. Thus, the researcher was blinded to patient/oscillation characterization while processing tissue for RNA and data analysis. The final analysis required including subject covariate information, so the researcher was unblinded to subject characteristics and oscillation data at that point. For SME values, bulk RNA-seq transcriptomic data, snRNA-seq transcriptomic data, and scATAC-seq epigenomic data distribution was assumed to be normal but this was not formally tested. Non-parametric tests have been used to avoid uncertainty when possible. Data collection and analysis were not performed blind to the conditions of the experiments.
Reporting Summary
Further information on research design is available in the Life Sciences Reporting Summary linked to this article.
Data Availability
The RNA-seq dataset used for memory oscillatory signature analysis in this study are available at GEO with accession number: GSE139914.
References
- 1.Morgan SE et al. Cortical patterning of abnormal morphometric similarity in psychosis is associated with brain expression of schizophrenia-related genes. Proc Natl Acad Sci U S A 116, 9604–9609, doi: 10.1073/pnas.1820754116 (2019). [DOI] [PMC free article] [PubMed] [Google Scholar]
- 2.Lombardo MV et al. Large-scale associations between the leukocyte transcriptome and BOLD responses to speech differ in autism early language outcome subtypes. Nat Neurosci 21, 1680–1688, doi: 10.1038/s41593-018-0281-3 (2018). [DOI] [PMC free article] [PubMed] [Google Scholar]
- 3.Romero-Garcia R, Warrier V, Bullmore ET, Baron-Cohen S & Bethlehem RAI Synaptic and transcriptionally downregulated genes are associated with cortical thickness differences in autism. Mol Psychiatry 24, 1053–1064, doi: 10.1038/s41380-018-0023-7 (2019). [DOI] [PMC free article] [PubMed] [Google Scholar]
- 4.Wang GZ et al. Correspondence between Resting-State Activity and Brain Gene Expression. Neuron 88, 659–666, doi: 10.1016/j.neuron.2015.10.022 (2015). [DOI] [PMC free article] [PubMed] [Google Scholar]
- 5.Patania A et al. Topological gene expression networks recapitulate brain anatomy and function. Netw Neurosci 3, 744–762, doi: 10.1162/netn_a_00094 (2019). [DOI] [PMC free article] [PubMed] [Google Scholar]
- 6.Le BD & Stein JL Mapping causal pathways from genetics to neuropsychiatric disorders using genome-wide imaging genetics: Current status and future directions. Psychiatry Clin Neurosci 73, 357–369, doi: 10.1111/pcn.12839 (2019). [DOI] [PMC free article] [PubMed] [Google Scholar]
- 7.Konopka G Cognitive genomics: Linking genes to behavior in the human brain. Netw Neurosci 1, 3–13, doi: 10.1162/NETN_a_00003 (2017). [DOI] [PubMed] [Google Scholar]
- 8.Berto S, Wang GZ, Germi J, Lega BC & Konopka G Human Genomic Signatures of Brain Oscillations During Memory Encoding. Cereb Cortex 28, 1733–1748, doi: 10.1093/cercor/bhx083 (2018). [DOI] [PMC free article] [PubMed] [Google Scholar]
- 9.Long NM, Burke JF & Kahana MJ Subsequent memory effect in intracranial and scalp EEG. Neuroimage 84, 488–494, doi: 10.1016/j.neuroimage.2013.08.052 (2014). [DOI] [PMC free article] [PubMed] [Google Scholar]
- 10.Mukamel R & Fried I Human intracranial recordings and cognitive neuroscience. Annu Rev Psychol 63, 511–537, doi: 10.1146/annurev-psych-120709-145401 (2012). [DOI] [PubMed] [Google Scholar]
- 11.Sederberg PB et al. Hippocampal and neocortical gamma oscillations predict memory formation in humans. Cereb Cortex 17, 1190–1196, doi: 10.1093/cercor/bhl030 (2007). [DOI] [PubMed] [Google Scholar]
- 12.Nakamura K & Kubota K The primate temporal pole: its putative role in object recognition and memory. Behav Brain Res 77, 53–77, doi: 10.1016/0166-4328(95)00227-8 (1996). [DOI] [PubMed] [Google Scholar]
- 13.Hill PF, King DR, Lega BC & Rugg MD Comparison of fMRI correlates of successful episodic memory encoding in temporal lobe epilepsy patients and healthy controls. Neuroimage 207, 116397, doi: 10.1016/j.neuroimage.2019.116397 (2020). [DOI] [PMC free article] [PubMed] [Google Scholar]
- 14.Sederberg PB, Howard MW & Kahana MJ A context-based theory of recency and contiguity in free recall. Psychol Rev 115, 893–912, doi: 10.1037/a0013396 (2008). [DOI] [PMC free article] [PubMed] [Google Scholar]
- 15.Arora A et al. Comparison of logistic regression, support vector machines, and deep learning classifiers for predicting memory encoding success using human intracranial EEG recordings. J Neural Eng 15, 066028, doi: 10.1088/1741-2552/aae131 (2018). [DOI] [PMC free article] [PubMed] [Google Scholar]
- 16.Lin JJ et al. Theta band power increases in the posterior hippocampus predict successful episodic memory encoding in humans. Hippocampus 27, 1040–1053, doi: 10.1002/hipo.22751 (2017). [DOI] [PMC free article] [PubMed] [Google Scholar]
- 17.Berkel S et al. Mutations in the SHANK2 synaptic scaffolding gene in autism spectrum disorder and mental retardation. Nat Genet 42, 489–491, doi: 10.1038/ng.589 (2010). [DOI] [PubMed] [Google Scholar]
- 18.Peykov S et al. Rare SHANK2 variants in schizophrenia. Mol Psychiatry 20, 1487–1488, doi: 10.1038/mp.2015.122 (2015). [DOI] [PMC free article] [PubMed] [Google Scholar]
- 19.Won H et al. Autistic-like social behaviour in Shank2-mutant mice improved by restoring NMDA receptor function. Nature 486, 261–265, doi: 10.1038/nature11208 (2012). [DOI] [PubMed] [Google Scholar]
- 20.Dembrow NC, Zemelman BV & Johnston D Temporal dynamics of L5 dendrites in medial prefrontal cortex regulate integration versus coincidence detection of afferent inputs. J Neurosci 35, 4501–4514, doi: 10.1523/JNEUROSCI.4673-14.2015 (2015). [DOI] [PMC free article] [PubMed] [Google Scholar]
- 21.Silva LR, Amitai Y & Connors BW Intrinsic oscillations of neocortex generated by layer 5 pyramidal neurons. Science 251, 432–435, doi: 10.1126/science.1824881 (1991). [DOI] [PubMed] [Google Scholar]
- 22.Kim EJ, Juavinett AL, Kyubwa EM, Jacobs MW & Callaway EM Three Types of Cortical Layer 5 Neurons That Differ in Brain-wide Connectivity and Function. Neuron 88, 1253–1267, doi: 10.1016/j.neuron.2015.11.002 (2015). [DOI] [PMC free article] [PubMed] [Google Scholar]
- 23.Xia F et al. Parvalbumin-positive interneurons mediate neocortical-hippocampal interactions that are necessary for memory consolidation. Elife 6, doi: 10.7554/eLife.27868 (2017). [DOI] [PMC free article] [PubMed] [Google Scholar]
- 24.Naka A et al. Complementary networks of cortical somatostatin interneurons enforce layer specific control. Elife 8, doi: 10.7554/eLife.43696 (2019). [DOI] [PMC free article] [PubMed] [Google Scholar]
- 25.Veit J, Hakim R, Jadi MP, Sejnowski TJ & Adesnik H Cortical gamma band synchronization through somatostatin interneurons. Nat Neurosci 20, 951–959, doi: 10.1038/nn.4562 (2017). [DOI] [PMC free article] [PubMed] [Google Scholar]
- 26.Pi HJ et al. Cortical interneurons that specialize in disinhibitory control. Nature 503, 521–524, doi: 10.1038/nature12676 (2013). [DOI] [PMC free article] [PubMed] [Google Scholar]
- 27.Lee S, Kruglikov I, Huang ZJ, Fishell G & Rudy B A disinhibitory circuit mediates motor integration in the somatosensory cortex. Nat Neurosci 16, 1662–1670, doi: 10.1038/nn.3544 (2013). [DOI] [PMC free article] [PubMed] [Google Scholar]
- 28.Kamigaki T & Dan Y Delay activity of specific prefrontal interneuron subtypes modulates memory-guided behavior. Nat Neurosci 20, 854–863, doi: 10.1038/nn.4554 (2017). [DOI] [PMC free article] [PubMed] [Google Scholar]
- 29.Pepper RE, Pitman KA, Cullen CL & Young KM How Do Cells of the Oligodendrocyte Lineage Affect Neuronal Circuits to Influence Motor Function, Memory and Mood? Front Cell Neurosci 12, 399, doi: 10.3389/fncel.2018.00399 (2018). [DOI] [PMC free article] [PubMed] [Google Scholar]
- 30.Um JW & Ko J LAR-RPTPs: synaptic adhesion molecules that shape synapse development. Trends Cell Biol 23, 465–475, doi: 10.1016/j.tcb.2013.07.004 (2013). [DOI] [PubMed] [Google Scholar]
- 31.Kantojarvi K et al. Fine mapping of Xq11.1-q21.33 and mutation screening of RPS6KA6, ZNF711, ACSL4, DLG3, and IL1RAPL2 for autism spectrum disorders (ASD). Autism Res 4, 228–233, doi: 10.1002/aur.187 (2011). [DOI] [PubMed] [Google Scholar]
- 32.Tasic B et al. Adult mouse cortical cell taxonomy revealed by single cell transcriptomics. Nat Neurosci 19, 335–346, doi: 10.1038/nn.4216 (2016). [DOI] [PMC free article] [PubMed] [Google Scholar]
- 33.Azevedo FA et al. Equal numbers of neuronal and nonneuronal cells make the human brain an isometrically scaled-up primate brain. J Comp Neurol 513, 532–541, doi: 10.1002/cne.21974 (2009). [DOI] [PubMed] [Google Scholar]
- 34.Zhang Y et al. Polymorphisms in human dopamine D2 receptor gene affect gene expression, splicing, and neuronal activity during working memory. Proc Natl Acad Sci U S A 104, 20552–20557, doi: 10.1073/pnas.0707106104 (2007). [DOI] [PMC free article] [PubMed] [Google Scholar]
- 35.Papassotiropoulos A et al. Common Kibra alleles are associated with human memory performance. Science 314, 475–478, doi: 10.1126/science.1129837 (2006). [DOI] [PubMed] [Google Scholar]
- 36.Jacobs J & Kahana MJ Direct brain recordings fuel advances in cognitive electrophysiology. Trends Cogn Sci 14, 162–171, doi: 10.1016/j.tics.2010.01.005 (2010). [DOI] [PMC free article] [PubMed] [Google Scholar]
- 37.Yamazaki Y et al. Oligodendrocytes: facilitating axonal conduction by more than myelination. Neuroscientist 16, 11–18, doi: 10.1177/1073858409334425 (2010). [DOI] [PubMed] [Google Scholar]
- 38.Baker A et al. Specialized Subpopulations of Deep-Layer Pyramidal Neurons in the Neocortex: Bridging Cellular Properties to Functional Consequences. J Neurosci 38, 5441–5455, doi: 10.1523/JNEUROSCI.0150-18.2018 (2018). [DOI] [PMC free article] [PubMed] [Google Scholar]
- 39.Carracedo LM et al. A neocortical delta rhythm facilitates reciprocal interlaminar interactions via nested theta rhythms. J Neurosci 33, 10750–10761, doi: 10.1523/JNEUROSCI.0735-13.2013 (2013). [DOI] [PMC free article] [PubMed] [Google Scholar]
- 40.Jinno S et al. Neuronal diversity in GABAergic long-range projections from the hippocampus. J Neurosci 27, 8790–8804, doi: 10.1523/JNEUROSCI.1847-07.2007 (2007). [DOI] [PMC free article] [PubMed] [Google Scholar]
- 41.Kim D et al. Distinct Roles of Parvalbumin- and Somatostatin-Expressing Interneurons in Working Memory. Neuron 92, 902–915, doi: 10.1016/j.neuron.2016.09.023 (2016). [DOI] [PubMed] [Google Scholar]
- 42.Jacobs J Hippocampal theta oscillations are slower in humans than in rodents: implications for models of spatial navigation and memory. Philos Trans R Soc Lond B Biol Sci 369, 20130304, doi: 10.1098/rstb.2013.0304 (2014). [DOI] [PMC free article] [PubMed] [Google Scholar]
- 43.Yaffe RB et al. Reinstatement of distributed cortical oscillations occurs with precise spatiotemporal dynamics during successful memory retrieval. Proc Natl Acad Sci U S A 111, 18727–18732, doi: 10.1073/pnas.1417017112 (2014). [DOI] [PMC free article] [PubMed] [Google Scholar]
- 44.Rutishauser U, Ross IB, Mamelak AN & Schuman EM Human memory strength is predicted by theta-frequency phase-locking of single neurons. Nature 464, 903–907, doi: 10.1038/nature08860 (2010). [DOI] [PubMed] [Google Scholar]
- 45.Duzel E, Penny WD & Burgess N Brain oscillations and memory. Curr Opin Neurobiol 20, 143–149, doi: 10.1016/j.conb.2010.01.004 (2010). [DOI] [PubMed] [Google Scholar]
- 46.Kahana MJ The cognitive correlates of human brain oscillations. J Neurosci 26, 1669–1672, doi: 10.1523/JNEUROSCI.3737-05c.2006 (2006). [DOI] [PMC free article] [PubMed] [Google Scholar]
- 47.Vaz AP, Inati SK, Brunel N & Zaghloul KA Coupled ripple oscillations between the medial temporal lobe and neocortex retrieve human memory. Science 363, 975–978, doi: 10.1126/science.aau8956 (2019). [DOI] [PMC free article] [PubMed] [Google Scholar]
- 48.Lega B, Burke J, Jacobs J & Kahana MJ Slow-Theta-to-Gamma Phase-Amplitude Coupling in Human Hippocampus Supports the Formation of New Episodic Memories. Cereb Cortex 26, 268–278, doi: 10.1093/cercor/bhu232 (2016). [DOI] [PMC free article] [PubMed] [Google Scholar]
- 49.Donoghue T, Haller M, Peterson EJ, Varma P, Sebastian P, Gao R, Noto T, Lara AH, Wallis JD, Knight RT, Shestyuk A, Voytek B. Parameterizing neural power spectra into periodic and aperiodic components. Nat Neurosci. 2020. December;23(12):1655–1665. doi: 10.1038/s41593-020-00744-x. Epub 2020 Nov 23. [DOI] [PMC free article] [PubMed] [Google Scholar]
- 50.Herweg NA, Solomon EA & Kahana MJ Theta Oscillations in Human Memory. Trends Cogn Sci 24, 208–227, doi: 10.1016/j.tics.2019.12.006 (2020). [DOI] [PMC free article] [PubMed] [Google Scholar]
Methods-only References
- 51.Natu VS et al. Stimulation of the Posterior Cingulate Cortex Impairs Episodic Memory Encoding. J Neurosci 39, 7173–7182, doi: 10.1523/JNEUROSCI.0698-19.2019 (2019). [DOI] [PMC free article] [PubMed] [Google Scholar]
- 52.Sederberg PB, Kahana MJ, Howard MW, Donner EJ & Madsen JR Theta and gamma oscillations during encoding predict subsequent recall. J Neurosci 23, 10809–10814 (2003). [DOI] [PMC free article] [PubMed] [Google Scholar]
- 53.Goyal A et al. Functionally distinct high and low theta oscillations in the human hippocampus. Nat Commun 11, 2469, doi: 10.1038/s41467-020-15670-6 (2020). [DOI] [PMC free article] [PubMed] [Google Scholar]
- 54.Watrous AJ, Miller J, Qasim SE, Fried I & Jacobs J Phase-tuned neuronal firing encodes human contextual representations for navigational goals. Elife 7, doi: 10.7554/eLife.32554 (2018). [DOI] [PMC free article] [PubMed] [Google Scholar]
- 55.Fischl B et al. Whole brain segmentation: automated labeling of neuroanatomical structures in the human brain. Neuron 33, 341–355, doi: 10.1016/s0896-6273(02)00569-x (2002). [DOI] [PubMed] [Google Scholar]
- 56.Ghose S, Gleason KA, Potts BW, Lewis-Amezcua K & Tamminga CA Differential expression of metabotropic glutamate receptors 2 and 3 in schizophrenia: a mechanism for antipsychotic drug action? Am J Psychiatry 166, 812–820, doi: 10.1176/appi.ajp.2009.08091445 (2009). [DOI] [PMC free article] [PubMed] [Google Scholar]
- 57.Takahashi JS et al. ChIP-seq and RNA-seq methods to study circadian control of transcription in mammals. Methods in enzymology 551, 285–321, doi: 10.1016/bs.mie.2014.10.059 (2015). [DOI] [PMC free article] [PubMed] [Google Scholar]
- 58.Habib N et al. Massively parallel single-nucleus RNA-seq with DroNc-seq. Nat Methods 14, 955–958, doi: 10.1038/nmeth.4407 (2017). [DOI] [PMC free article] [PubMed] [Google Scholar]
- 59.Zheng GX et al. Massively parallel digital transcriptional profiling of single cells. Nat Commun 8, 14049, doi: 10.1038/ncomms14049 (2017). [DOI] [PMC free article] [PubMed] [Google Scholar]
- 60.Yeh YH et al. Transforming growth factor-beta and oxidative stress mediate tachycardia-induced cellular remodelling in cultured atrial-derived myocytes. Cardiovasc Res 91, 62–70, doi: 10.1093/cvr/cvr041 (2011). [DOI] [PubMed] [Google Scholar]
- 61.Del Cid-Pellitero E, Plavski A, Mainville L & Jones BE Homeostatic Changes in GABA and Glutamate Receptors on Excitatory Cortical Neurons during Sleep Deprivation and Recovery. Front Syst Neurosci 11, 17, doi: 10.3389/fnsys.2017.00017 (2017). [DOI] [PMC free article] [PubMed] [Google Scholar]
- 62.Dobin A et al. STAR: ultrafast universal RNA-seq aligner. Bioinformatics 29, 15–21, doi: 10.1093/bioinformatics/bts635 (2013). [DOI] [PMC free article] [PubMed] [Google Scholar]
- 63.Wang L, Wang S & Li W RSeQC: quality control of RNA-seq experiments. Bioinformatics 28, 2184–2185, doi: 10.1093/bioinformatics/bts356 (2012). [DOI] [PubMed] [Google Scholar]
- 64.Anders S, Pyl PT & Huber W HTSeq--a Python framework to work with high-throughput sequencing data. Bioinformatics 31, 166–169, doi: 10.1093/bioinformatics/btu638 (2015). [DOI] [PMC free article] [PubMed] [Google Scholar]
- 65.Robinson MD, McCarthy DJ & Smyth GK edgeR: a Bioconductor package for differential expression analysis of digital gene expression data. Bioinformatics 26, 139–140, doi: 10.1093/bioinformatics/btp616 (2010). [DOI] [PMC free article] [PubMed] [Google Scholar]
- 66.Langfelder P & Horvath S WGCNA: an R package for weighted correlation network analysis. BMC Bioinformatics 9, 559, doi: 10.1186/1471-2105-9-559 (2008). [DOI] [PMC free article] [PubMed] [Google Scholar]
- 67.Smith T, Heger A & Sudbery I UMI-tools: modeling sequencing errors in Unique Molecular Identifiers to improve quantification accuracy. Genome Res 27, 491–499, doi: 10.1101/gr.209601.116 (2017). [DOI] [PMC free article] [PubMed] [Google Scholar]
- 68.Liao Y, Smyth GK & Shi W featureCounts: an efficient general purpose program for assigning sequence reads to genomic features. Bioinformatics 30, 923–930, doi: 10.1093/bioinformatics/btt656 (2014). [DOI] [PubMed] [Google Scholar]
- 69.Stuart T et al. Comprehensive Integration of Single-Cell Data. Cell 177, 1888–1902 e1821, doi: 10.1016/j.cell.2019.05.031 (2019). [DOI] [PMC free article] [PubMed] [Google Scholar]
- 70.Becht E et al. Dimensionality reduction for visualizing single-cell data using UMAP. Nat Biotechnol, doi: 10.1038/nbt.4314 (2018). [DOI] [PubMed]
- 71.Hodge RD et al. Conserved cell types with divergent features in human versus mouse cortex. Nature 573, 61–68, doi: 10.1038/s41586-019-1506-7 (2019). [DOI] [PMC free article] [PubMed] [Google Scholar]
- 72.Zhang Y et al. Model-based analysis of ChIP-Seq (MACS). Genome Biol 9, R137, doi: 10.1186/gb-2008-9-9-r137 (2008). [DOI] [PMC free article] [PubMed] [Google Scholar]
- 73.Weirauch MT et al. Determination and inference of eukaryotic transcription factor sequence specificity. Cell 158, 1431–1443, doi: 10.1016/j.cell.2014.08.009 (2014). [DOI] [PMC free article] [PubMed] [Google Scholar]
- 74.Robinson JT et al. Integrative genomics viewer. Nat Biotechnol 29, 24–26, doi: 10.1038/nbt.1754 (2011). [DOI] [PMC free article] [PubMed] [Google Scholar]
- 75.Falcon S & Gentleman R Using GOstats to test gene lists for GO term association. Bioinformatics 23, 257–258, doi: 10.1093/bioinformatics/btl567 (2007). [DOI] [PubMed] [Google Scholar]
- 76.Chen J, Bardes EE, Aronow BJ & Jegga AG ToppGene Suite for gene list enrichment analysis and candidate gene prioritization. Nucleic Acids Res 37, W305–311 (2009). [DOI] [PMC free article] [PubMed] [Google Scholar]
- 77.Banerjee-Basu S & Packer A SFARI Gene: an evolving database for the autism research community. Dis Model Mech 3, 133–135, doi: 10.1242/dmm.005439 (2010). [DOI] [PubMed] [Google Scholar]
- 78.Gandal MJ et al. Transcriptome-wide isoform-level dysregulation in ASD, schizophrenia, and bipolar disorder. Science 362, doi: 10.1126/science.aat8127 (2018). [DOI] [PMC free article] [PubMed] [Google Scholar]
- 79.Velmeshev D et al. Single-cell genomics identifies cell type-specific molecular changes in autism. Science 364, 685–689, doi: 10.1126/science.aav8130 (2019). [DOI] [PMC free article] [PubMed] [Google Scholar]
- 80.Mathys H et al. Single-cell transcriptomic analysis of Alzheimer’s disease. Nature 570, 332–337, doi: 10.1038/s41586-019-1195-2 (2019). [DOI] [PMC free article] [PubMed] [Google Scholar]
- 81.de Leeuw CA, Mooij JM, Heskes T & Posthuma D MAGMA: generalized gene-set analysis of GWAS data. PLoS Comput Biol 11, e1004219, doi: 10.1371/journal.pcbi.1004219 (2015). [DOI] [PMC free article] [PubMed] [Google Scholar]
- 82.Grove J et al. Identification of common genetic risk variants for autism spectrum disorder. Nat Genet 51, 431–444, doi: 10.1038/s41588-019-0344-8 (2019). [DOI] [PMC free article] [PubMed] [Google Scholar]
- 83.Jansen IE et al. Genome-wide meta-analysis identifies new loci and functional pathways influencing Alzheimer’s disease risk. Nat Genet 51, 404–413, doi: 10.1038/s41588-018-0311-9 (2019). [DOI] [PMC free article] [PubMed] [Google Scholar]
- 84.International League Against Epilepsy Consortium on Complex, E. Genome-wide mega-analysis identifies 16 loci and highlights diverse biological mechanisms in the common epilepsies. Nat Commun 9, 5269, doi: 10.1038/s41467-018-07524-z (2018). [DOI] [PMC free article] [PubMed] [Google Scholar]
- 85.Lee JJ et al. Gene discovery and polygenic prediction from a genome-wide association study of educational attainment in 1.1 million individuals. Nat Genet 50, 1112–1121, doi: 10.1038/s41588-018-0147-3 (2018). [DOI] [PMC free article] [PubMed] [Google Scholar]
- 86.Savage JE et al. Genome-wide association meta-analysis in 269,867 individuals identifies new genetic and functional links to intelligence. Nat Genet 50, 912–919, doi: 10.1038/s41588-018-0152-6 (2018). [DOI] [PMC free article] [PubMed] [Google Scholar]
- 87.Bipolar D, Schizophrenia Working Group of the Psychiatric Genomics Consortium. Electronic address, d. r. v. e., Bipolar, D. & Schizophrenia Working Group of the Psychiatric Genomics, C. Genomic Dissection of Bipolar Disorder and Schizophrenia, Including 28 Subphenotypes. Cell 173, 1705–1715 e1716, doi: 10.1016/j.cell.2018.05.046 (2018). [DOI] [PMC free article] [PubMed] [Google Scholar]
- 88.Davies G et al. Study of 300,486 individuals identifies 148 independent genetic loci influencing general cognitive function. Nat Commun 9, 2098, doi: 10.1038/s41467-018-04362-x (2018). [DOI] [PMC free article] [PubMed] [Google Scholar]
- 89.Wray NR et al. Genome-wide association analyses identify 44 risk variants and refine the genetic architecture of major depression. Nat Genet 50, 668–681, doi: 10.1038/s41588-018-0090-3 (2018). [DOI] [PMC free article] [PubMed] [Google Scholar]
- 90.Pardinas AF et al. Common schizophrenia alleles are enriched in mutation-intolerant genes and in regions under strong background selection. Nat Genet 50, 381–389, doi: 10.1038/s41588-018-0059-2 (2018). [DOI] [PMC free article] [PubMed] [Google Scholar]
- 91.Martin J et al. A Genetic Investigation of Sex Bias in the Prevalence of Attention-Deficit/Hyperactivity Disorder. Biol Psychiatry 83, 1044–1053, doi: 10.1016/j.biopsych.2017.11.026 (2018). [DOI] [PMC free article] [PubMed] [Google Scholar]
- 92.Sohail M et al. Polygenic adaptation on height is overestimated due to uncorrected stratification in genome-wide association studies. Elife 8, doi: 10.7554/eLife.39702 (2019). [DOI] [PMC free article] [PubMed] [Google Scholar]
- 93.Hoffmann TJ et al. A Large Multiethnic Genome-Wide Association Study of Adult Body Mass Index Identifies Novel Loci. Genetics 210, 499–515, doi: 10.1534/genetics.118.301479 (2018). [DOI] [PMC free article] [PubMed] [Google Scholar]
- 94.Morris AP et al. Large-scale association analysis provides insights into the genetic architecture and pathophysiology of type 2 diabetes. Nat Genet 44, 981–990, doi: 10.1038/ng.2383 (2012). [DOI] [PMC free article] [PubMed] [Google Scholar]
- 95.Estrada K et al. Genome-wide meta-analysis identifies 56 bone mineral density loci and reveals 14 loci associated with risk of fracture. Nat Genet 44, 491–501, doi: 10.1038/ng.2249 (2012). [DOI] [PMC free article] [PubMed] [Google Scholar]
- 96.Schunkert H et al. Large-scale association analysis identifies 13 new susceptibility loci for coronary artery disease. Nat Genet 43, 333–338, doi: 10.1038/ng.784 (2011). [DOI] [PMC free article] [PubMed] [Google Scholar]
Associated Data
This section collects any data citations, data availability statements, or supplementary materials included in this article.
Supplementary Materials
All statistics for GWAS enrichment in memory associated modules.
Genes differentially expressed in each cell-type with relative statistics.
Motif enrichment statistics for memory modules associated with specific cell-types.
Demographic data with subjects, technical covariates, biological covariates, sequencing covariates, SME data, MATH data, MRI data, and behavioral performance metrices.
All statistics for module detection, overlap with memory correlated genes, and database for association with previous studies.
All statistics for genes correlated with each brain oscillation and database for association with previous studies.
Data Availability Statement
The RNA-seq dataset used for memory oscillatory signature analysis in this study are available at GEO with accession number: GSE139914.