

Abstract
Cell-cell communication is a fundamental process that shapes biological tissue. Historically, studies of cell-cell communication have been feasible for one or two cell types and a few genes. With the emergence of single-cell transcriptomics, we are now able to examine the genetic profiles of individual cells at unprecedented scale and depth. The availability of such data presents an exciting opportunity to construct a more comprehensive description of cell-cell communication. This review discusses the recent explosion of methods that have been developed to infer cell-cell communication from non-spatial and spatial single-cell transcriptomics, two promising technologies which have complementary strengths and limitations. We propose several avenues to propel this rapidly expanding field forward in meaningful ways.
Introduction
Cell-cell communication (CCC)---cell-cell interactions that are regulated by biochemical signaling---is an important aspect of tissue structure and function, regulating individual cell processes and intercellular relationships. Historically, CCC could only be studied in in vitro experiments consisting of one or two cell types and a select few genes. These studies paint an incomplete picture, as CCC involves many cell types and invokes a large number of genes. A new, powerful method to probe tissue heterogeneity is single-cell RNA sequencing (scRNA-seq), which measures gene expression at a single-cell resolution. As the number of cells that can be sequenced increases [1], computational tools mature, allowing researchers to analyze scRNA-seq data with increasing efficiency [2]. Thus, the study of single-cell transcriptomics has begun to shift from only focussing on what cells are present to further focussing on what relationships between cells are present. Dissecting these relationships (lineage trajectories, cell-cell interactions) is crucial to understanding the “landscape” of biological systems. The availability of single-cell transcriptomics presents an exciting opportunity to study CCC in ways that have previously been impossible. Conversely, CCC inference presents as a meaningful way to utilize single-cell transcriptomics. As such, the number of tools that infer CCC from scRNA-seq, which lacks spatial resolution, has increased rapidly over recent years. Spatial transcriptomics (ST) has emerged as an alternative resource for CCC inference, albeit with complementary advantages and limitations.
The aim of this review is twofold: 1) to summarize the emerging and novel field of CCC inference at the single-cell resolution and 2) highlight possible research avenues to improve on current limitations of CCC inference. We first describe the general principles governing CCC inference from non-spatial scRNA-seq data. The current state of the art for CCC analysis and visualization are outlined. We then describe how CCC can be inferred from ST alone or by integrating it with scRNA-seq. We close with a list of pertinent avenues for future investigations.
Inferring CCC from single-cell genomics data
CCC is facilitated through various biochemical reactions that comprise signaling pathways. For a given signaling pathway, ligands expressed by a “sender cell” bind to corresponding receptor proteins expressed on the surface of a “receiver cell”, triggering downstream gene responses (Fig. 1(a)). There are two types of signaling: autocrine, when the sender and receiver are the same cell; and paracrine, when the sender and receiver are two different cells. From gene expression data, one can use corresponding ligand and receptor gene expression levels as indirect measures of protein expression. By scrutinizing the gene expression levels of a group of sender and receiver cells, where the ground truth is masked by biological and technical noise, communication is often quantitatively defined in a probabilistic sense. For example, one assigns an “interaction score” based on ligand and receptor expressions. As such, CCC inference will be most beneficial when there are sufficiently many cells from which one can sample the relevant ligand and receptor expressions.
Figure 1. Principles of cell-cell communication inference.

(a) Cells can secrete ligands that diffuse and can bind to receptors expressed on the surface of nearby cells. This is likelier to occur for receiver cells that are closest to the sender cell and when there is sufficient receptor expression. Cell-cell communication only occurs when the bound ligand triggers a downstream response. The blue and orange cells represent different cell types. For the blue cells, darker shades represent stronger ligand expression. (b) Cell-cell communication can be inferred from scRNA-seq at either the individual cell or cell cluster level, but spatial distances between cells are lost. (c) Using spatial transcriptomics to infer cell-cell communication preserves spatial distances between cells but potentially at the loss of single-cell or gene resolution.
While the core principle of CCC inference is intuitive to understand, it is overly simplistic and can overestimate communication activity for several reasons. First, cell signaling occurs at the protein level, not the gene level. As gene expression does not always translate directly to protein expression, it is possible that communication determined using ligand or receptor gene expression data alone may not have occurred at the protein level. In the case of receptor gene expression, communication can be further evaluated by examining the downstream target gene response caused by ligand-receptor binding (Fig. 1(a)). Second, cell signaling is spatially constrained. Many signaling pathways are activated through ligands diffusing from sender cells to nearby receiver cells. Hence, the number of cells with which the sender cell can communicate is limited by the finite spatial diffusivity of the ligand (Fig. 1(a)). Other pathways are activated by physical contact between adjacent cells. These spatial aspects of biological tissue are lost in scRNA-seq but preserved in ST (Fig. 1(b)-(c)). Considering these limitations or caveats, numerous approaches have been devised to improve the accuracy of CCC inference from scRNA-seq data.
A summary of the different methods for CCC
Computational tools have been developed to infer CCC from scRNA-seq at both the individual cell and cell cluster levels. SoptSC is one of few methods to infer CCC between individual cells [3]; most methods infer CCC between cell clusters [4–5] (Table 1). We highlight the unique features of different methods. Some methods, such as SoptSC [3], CellChat [5], and SingleCellSignalR [6], calculate interaction scores using nonlinear modeling approaches, e.g. CellChat uses Hill-function-based mass action models, while other methods, such as CellPhoneDB [7] and ICELLNET [8], simply calculate the product of ligand and receptor expressions. To predict statistically significant and cell-cluster-specific communications, CellChat [5], CellPhoneDB [7] and SingleCellSignalR [6] assign a p-value to each interaction by generating a score null distribution. To better recapitulate known ligand-receptor interactions, CellChat [5], CellPhoneDB [7], and ICELLNET [8] consider multi-subunit structure of ligands and receptors to represent heteromeric complexes accurately. Additionally, CellChat [5] modulates interactions due to cofactors (agonists and antagonists). Methods such as SoptSC [3], NicheNet [9], scMLnet [10] and CytoTalk [11] account for intracellular interactions in receiver cells that arise from CCC to improve inference. While most methods focus on pairwise analysis of signaling between cell clusters, scTensor models higher-order interactions, using tensor decomposition to detect many-to-many CCC involving multiple cell clusters and ligand-receptor pairs [12].
Table 1. Current packages developed to infer cell-cell communication from single-cell transcriptomics.
For each method, we specify the literature reference; whether or not the method requires additional input alongside scRNA-seq; a brief description of the methods used to infer CCC; the programming language used for implementation; and the format and dimensions of the method output.
| Package | Reference | Additional input? | Methods | Implementation | Output |
|---|---|---|---|---|---|
| Methods that only require non-spatial scRNA-seq as input. | |||||
| CellChat | Jin et al. [5] | None. | • Curated database; multiple ligand/receptor sub-units and cofactors. • Communication probabilities calculated using law of mass action, considering the geometric means of ligand and receptor expressions (with their subunits), weighted by their agonists/antagonists. |
R | • CellChat object containing Ncluster-by-Ncluster communication probability matrices for each constituent ligand-receptor pairs of significant signaling pathways. |
| CellPhoneDB | Efremova et al. [7] | None. | • Curated database; multiple ligand/receptor sub-units. • Permutes cell cluster labels to generate null distribution, from which enriched ligand-receptor interactions for each cell type are determined. |
Python | • List of most statistically significant ligand-receptor interactions. |
| COMUNET | Solovey et al. [47] | None. | • CCC network is modeled as multiplex network, where each layer corresponds to a ligand-receptor interaction. | R | • List of Ncluster-by-Ncluster interaction matrices for each interacting ligand-receptor pair. |
| iCELLNET | Noël et al. [8] | None. | • Manually curated database; multiple ligand/receptor sub-units. • Interactions determined by multiplying the geometric means of ligand and receptor expressions. |
R | • Ncluster-by-Ncluster matrix of CCC probabilities. |
| iTALK | Wang et al. [40] | None. | • Manually curated database. • Significant interactions are determined by considering differentially expressed genes. |
R | • Ncluster-by-Ncluster matrix of CCC probabilities for most significant ligand-receptor interactions. |
| NATMI | Hou et al. [48] | None. | • Manually curated database. • Interactions between clusters are modeled as network edge weights, which are calculated by the product of normalized ligand and receptor expressions of the two clusters. |
Python | • Ncluster-by-Ncluster matrix of CCC probabilities. |
| PyMINEr | Tyler et al. [49] | None. | • Constructs gene co-expression networks determined from Spearman correlation, which are then integrated with protein-protein interaction networks. • Enriched interactions are determined with respect to a Gaussian null distribution between cell clusters. |
Python | • List of gene-gene interaction networks for each cell cluster. |
| scTensor | Tsuyuzaki et al. [12] | None. | • Manually curated database. • CCC network constructed as a directed hypergraph with multiple edge types representing different ligand-receptor pairs. • Interactions modelled using tensor decomposition, which are then scored. |
R | • Hypergraph of Ncluster nodes, consisting of ligand patterns, receptor patterns, and ligand-receptor pairs. |
| SingleCellSignalR | Cabello-Aguilar et al. [6] | None. | • Manually curated database. • Probabilities are calculated using a nonlinear function of the product of ligand and receptor expressions. |
R | • Ncluster-by-Ncluster matrix of CCC probabilities. |
| Methods that consider downstream response. | |||||
| CytoTalk | Hu et al. [11] | None. | • Constructs integrated network of intercellular and intracellular gene-gene interactions based on mutual information. | MATLAB/Python/R | • Integrated signal transduction gene network where edge types indicate intercellular and intracellular interactions between cell clusters. |
| scMLnet | Cheng et al. [10] | Downstream responses modeled by interlayer network edges. | • Manually curated database. • Multilayer network is constructed using ligand, receptor, and target genes as nodes of network layers. |
R | • List of multilayer signaling networks for each cell cluster. |
| NicheNet | Browaeys et al. [9] | Must specify candidate downstream targets. | • Manually curated database. • Ligand-target potential scores determined using Personalised PageRank to infer ligand-target signaling importance. |
R | • List of potential ligand-target interactions. |
| SoptSC | Wang et al. [3] | Can specify upstream/downstr eam genes to refine probabilities. | • Individual cell CCC probabilities are calculated using nonlinear functions of the products of ligand and receptor expressions, which can be weighted by target gene response. | MATLAB/R | • Ncell-by-Ncell matrix of individual cell CCC probabilities. • Ncluster-by-Ncluster matrix of cell cluster CCC probabilities. |
| Methods that accept ST as sole data input or in conjunction with scRNA-seq. | |||||
| Cell2Cell | Armingol et al. [30] | Can specify intercellular distances via ST. | • Curated database. • Bray-Curtis-like score to model interactions and optimizes Spearman correlation between distances and interaction scores • Infers communication distance using Gaussian mixture model. |
Python | • List of enriched and depleted ligand-receptor interactions. • Ncluster-by-Ncluster matrix of cell-cell interaction distances. |
| Giotto | Dries et al. [24] | Requires ST as data input. | • Spatial network is constructed from ST data, which is used to filter for interactions between cells that are sufficiently close. • Interactions between clusters scored by average ligand and receptor expressions. |
Python/R | • Ncluster-by-Ncluster matrix of CCC probabilities. • List of most significant ligand-receptor interactions. |
| MISTY | Tanevski et al. [32] | Requires ST at data input. | • Significant marker genes at specific locations are determined using random forest methods. • Interactions are calculated by weighting the gene expressions of local cell neighborhood. |
R | • Clustered network of signaling gene interactions within cell clusters and between cell clusters. |
| SpaOTsc | Cang and Nie [22] | Requires intercellular distances or ST as data input. | • Optimal transport is used to infer CCC between cell clusters from scRNA-seq data. • Optimal transport maps CCC from scRNA-seq to spatial position. |
Python | • List of inferred ligand and receptor expressions at ST coordinates. • Ncell-by−Ncell CCC matrix for a given signaling pathway. |
| stLearn | Pham et al. [21] | Requires ST as data input. | • Gene expression is normalized across spatial location. • Significant ligand-receptor pairs are determined using CellPhoneDB on normalized gene expression. |
Python | • Nspot-by-Nspotot matrix representing ligand-receptor expression across discretized tissue. |
| SVCA | Arnol et al. [31] | Requires ST as data input. | • Models gene expression as Gaussian mixed effects model that accounts for intrinsic effects, environmental effects, and cell-cell interactions | Python/R | • Variance contributions for significantly expressed genes to predict genes with significant spatial variation. |
In addition to quantifying CCC, these tools provide several ways to visualize the inferred intercellular communication network. CellChat is one such representation tool and includes powerful visualization features for different analytical tasks [5]. Figure 2 shows several common methods, including visualization of signaling networks mediated by a single ligand-receptor pair (Fig. 2(a)-(d)) and multiple ligand-receptor pairs (Fig. 2(e)). Unique to CellChat is a customized hierarchical visualization tool, which is especially useful to dissect complex signaling networks by explicitly specifying sender and receiver cells to distinguish paracrine from autocrine signaling (Fig. 2(d)).
Figure 2. Visualization and analysis of cell-cell communication from scRNA-seq data.
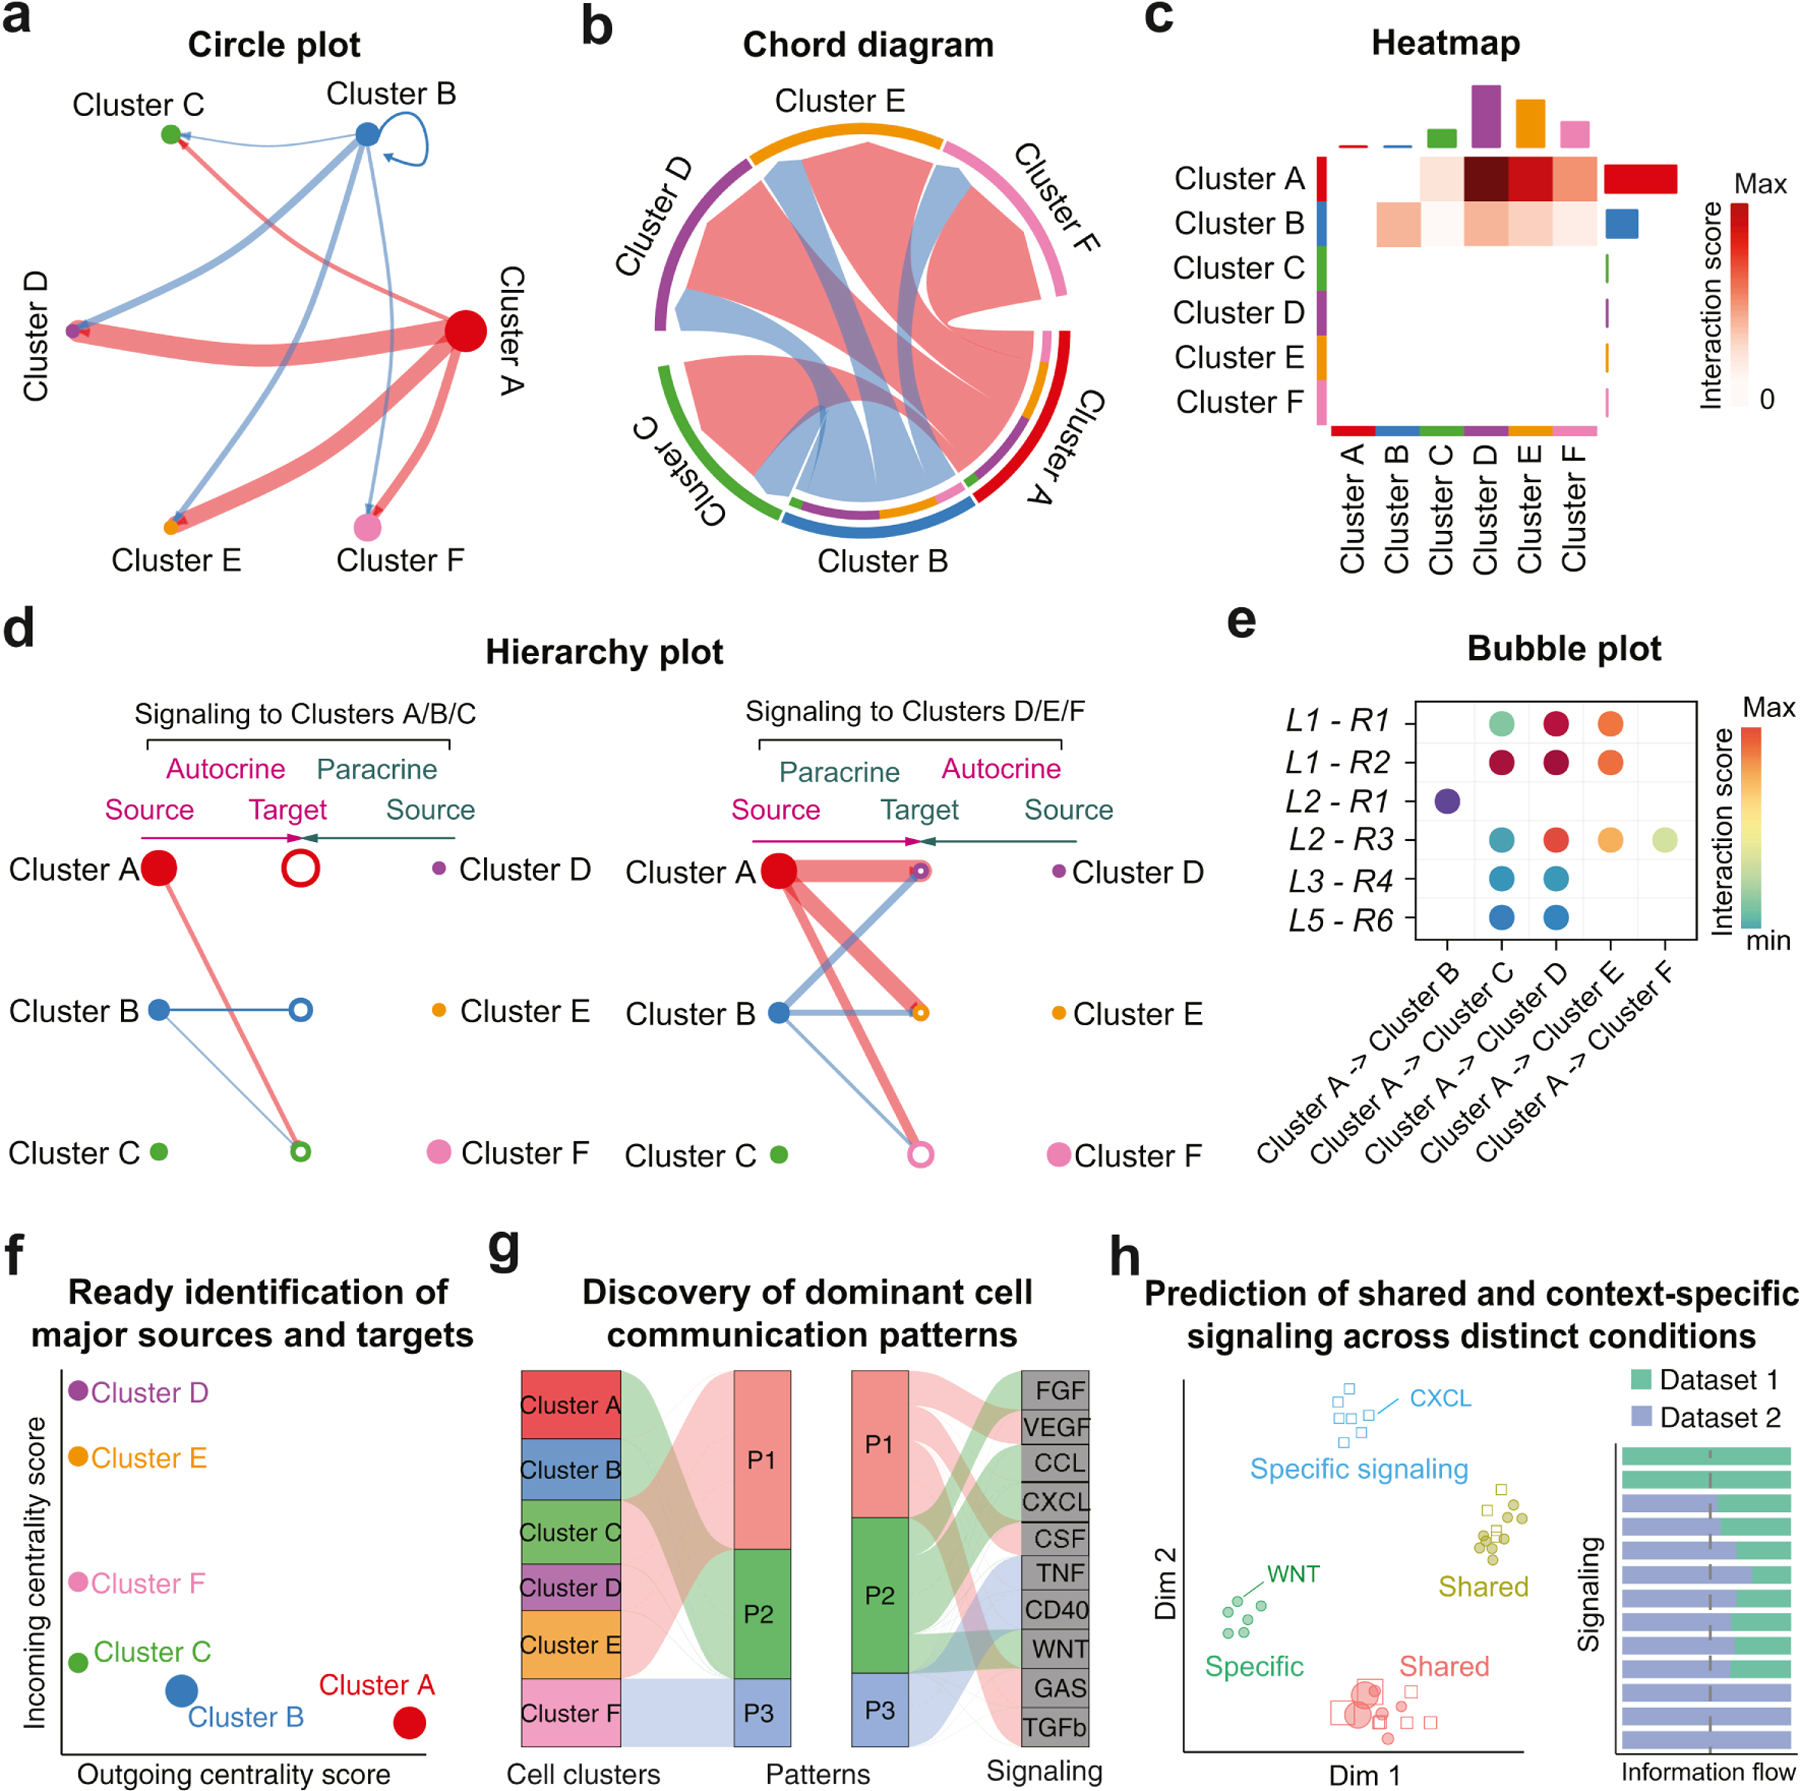
(a-e) Common visualization methods for cell-cell communication. (a) Circle plot: Circle size and edge width are proportional to the number of cells in each cell cluster and the communication score between interacting cell clusters, respectively. (b) Chord diagram. (c) Heatmap: Rows and columns represent sources and targets, respectively. Bar plots on the right and top represent the total outgoing and incoming interaction scores respectively. (d) The hierarchical plot consists of two parts: Left and right portions highlight the autocrine and paracrine signaling to clusters A/B/C and to clusters D/E/F, respectively. Solid and open circles represent source and target, respectively. Circle sizes are proportional to the number of cells in each cell group and edge width represents the communication score. (e) Bubble plot shows the ligand-receptor pairs contributing to the signaling from cell cluster A to other clusters. (f-h) Examples of analysis techniques of cell-cell communication from CellChat. (f) Ready identification of major signaling sources and targets using network centrality analysis. For a given cell-cell communication network, the outgoing and incoming centrality scores are computed for each cell cluster and then visualized in a two-dimensional space. Circle size represents the total number of interactions associated with each cell cluster. (g) Alluvial plot shows the correspondence between the inferred latent patterns and cell clusters as well as signaling pathways. These patterns reveal how the cell clusters coordinate with each other as well as how they coordinate with certain signaling pathways. The thickness of the flow indicates the contribution of the cell group or signaling pathway to each latent pattern. (h) CellChat also delineates signaling changes across different contexts by jointly projecting signaling networks from two datasets onto a two-dimensional space, and quantitatively comparing the information flow of each signaling pathway between two datasets. The overall information flow of a signaling network is calculated by summarizing all the communication scores in that network.
The majority of tools focus exclusively on the inference of CCC. More recently, to facilitate the analysis and interpretation of the complex intercellular communication networks, CellChat utilizes methods from social network analysis, pattern recognition and manifold learning, allowing for: identification of major signaling sources and targets (Fig. 2(f)); prediction of coordination between cells and signals for function (Fig. 2(g)); and delineation of conserved and context-specific signaling across different datasets (Fig. 2(h)). Together, these tools provide an unprecedented opportunity to comprehensively probe underlying CCC that often drive heterogeneity and cell state transitions.
CCC tools have been applied successfully to a diverse range of systems to dissect mechanisms of cell fate decisions and disease [4]. For example: CellChat predicted key signaling mechanisms of dermal condensate and melanocyte cell migration during early hair follicle development [5] and elevated inflammatory signaling from brain-barrier cells during COVID-19 infection [13]; CellPhoneDB inferred significant interactions that prevent harmful immune responses during early human pregnancy [14]; and NicheNet predicted upstream niche signals that regulate the liver macrophage niche [16].
Integration of scRNA-seq and spatial data
Using only scRNA-seq data to infer CCC often introduces false-positive links, because cells only communicate directly over a limited spatial distance---critical information lost in the scRNA-seq data. This limitation can be mitigated by integrating scRNA-seq with emerging ST technologies [17–19] that retain spatial information, but often, at the cost of compromised cellular resolution, coverage, or sequencing depth [20] (Fig. 3(a)). General-purpose methods for integrating two heterogeneous datasets, representing different measurements of the same biological system, may be used [2]. More specialized methods to integrate spatial imaging or transcriptomics with scRNA-seq data have been developed to exploit the spatial structure of the former [21–26]. These methods rely on commonly measured genes to estimate similarity between positions and single cells, improving data integration with spatial information. For example, SpaOTsc refines data integration using structured optimal transport, utilizing both gene expression similarities and spatial distances between cells from scRNA-seq and ST, respectively [22]. Alternatively, a hidden Markov random field-based method utilizes the spatial neighborhood information when transferring labels from scRNA-seq data [25]. There are also methods for de novo spatial placement of scRNA-seq data without a spatial reference [27–29]. These methods place single cells in space based on different assumptions. For example, cells with similar gene expression profiles are considered to be nearby [27], or cells co-expressing ligands and receptors are assumed to be colocalized [29].
Figure 3. Integrating scRNA-seq with spatial transcriptomics.

(a) The major tasks involved in integrating scRNA-seq with spatial transcriptomics are: imputing gene expression in spatial data; assigning cell types to spatial data; inferring spatial origins of scRNA-seq data; and estimating spatial interactions in scRNA-seq. (b) The main outputs of current spatial cell-cell communication inference methods include: a cell-cell or cluster-cluster network due to ligand-receptor binding (for a specified signaling pathway) and more general intercellular gene regulatory networks in space.
CCC inference using Spatial Transcriptomics
Spatial transcriptomics or ST integrated with scRNA-seq empowers CCC analysis in spatial contexts (Fig. 3(b)). While CCC inferred from scRNA-seq can be further refined by spatial constraints, there are specialized methods that use the spatial data directly to analyze CCC. To examine CCC through membrane-bound ligand and receptor expression, Giotto uses a spatial proximal graph to quantify signaling between clusters by restricting the average ligand and receptor expressions of the two clusters to cells that are connected in the spatial proximal graph [24]. To improve the confidence of identified CCC, cell2cell uses a Bray-Curtis-like score over hundreds of ligand-receptor pairs followed by a spatial distance-based filter to identify interacting cells [30]. Rather than infer pairwise cell-cell interactions, stLearn computes a ligand-receptor co-expression score related to cell type diversity at individual “spots” to identify spatial regions with intensive signaling activity [21]. Taking a global perspective such that a lone receptor-expressing cell is likelier to receive a signal than a cell surrounded by many receptor-expressing cells, SpaOTsc derives two spatial distributions for signal senders and receivers, based on the ligand, receptor, and downstream genes, and finds an optimal transport plan from the sender distribution to receiver distribution with a minimum total transportation distance in space [22]. In a more general setting, SVCA uses probabilistic models to infer how cell-specific genes are impacted by neighboring cells and the external environment [31]. Using a machine learning model, MISTy identifies predictor genes in the spatial neighborhood for target genes [32].
There are three functions of the current methods. First, they can identify interactions between cells through specified signaling pathways with known ligands, receptors, and downstream genes. Second, they can predict novel gene pairs that interact across neighbouring cells. Third, they can infer physical properties of CCC from spatial data. For example, SpaOTsc can estimate the spatial “diffusivity” of a signaling pathway by modeling downstream gene expression based on signals received over a range of distances [22]. Although CCC is a temporal process, there are no methods that consider this dynamical aspect inherent in ST data. With the advancements in ST resolution, it will be possible to develop spatiotemporal CCC inference methods based on spatiotemporal trajectories constructed from ST data [6, 22, 33].
Benchmarking and validation
To infer the most significant CCCs, a wide range of methodologies along with different underlying assumptions have clearly been developed (Table 1). To validate these methods, it is important to establish appropriate benchmarks. Generally, CCC inference methods may be validated by prior biological knowledge and evaluated using indicators such as robustness and enrichment analysis [7, 18, 34, 35]. However, it is difficult to completely benchmark identified CCC networks against the biological ground truth, which is often unknown. Besides being used as constraints to improve CCC inference, ST can also be used as a benchmark to evaluate false positive rates [11]. When applied as a hypothesis-generating tool for specific biological systems, the inferred CCC can be validated by parallel experiments, such as proteomics, and downstream functional studies that perturb certain CCC experimentally [35–36]. Additionally, assuming transcriptomics reflects proteomics well, which can be validated using emerging technologies [37–39], the algorithmic aspects of CCC inference methods can be benchmarked by in silico CCC simulations [32].
Outlook
We have described the current capabilities of CCC inference from single-cell transcriptomics. While CCC inference has advanced considerably in recent years, there are a number of limitations and future opportunities that warrant further studies.
1. Multiscale linking of CCC to downstream response and gene regulatory networks
Most CCC methods focus on the existence and likelihood of various signaling pathways. For example, CellChat [5], SingleCellSignalR [6], CellPhoneDB [7], ICELLNET [8], and iTALK [40] predict the potential CCC based on the expression of ligands and receptors---a major assumption of all CCC methods. Methods such as SpaOTsc [22] reduce false positive predictions by accounting for spatial distance between cells. However, very few methods account for the coupling between the downstream response and CCC, where the downstream responses indicate the cell processes regulated by the inferred signaling pathways. Within-cell gene regulatory networks (GRNs) also drive cell fate and decision-making. While there are tools to infer GRNs from scRNA-seq [41], GRN inference is generally separate from CCC inference. So far, there are only rudimentary efforts to link CCC to GRNs [11, 42, 43]. Improved linking of CCC to downstream response and GRNs in a coherent way will improve understanding of cell-type-specific responses to cell signaling.
2. Coupling with (lineage) trajectory analysis for landscape reconstruction
Another popular application of single-cell transcriptomics is trajectory inference, showing the capacity for one or more cell types to differentiate into other cell types within the population. Numerous trajectory inference methods have been developed for scRNA-seq [44], but, like GRN inference, trajectory inference is performed separately from CCC inference. However, differentiation trajectories can clearly be influenced by cell-cell signaling, and vice versa [4].
3. Simulating scRNA-seq data with realistic underlying CCC
A significant issue in CCC inference is the current lack of benchmarks, which are needed to validate the wide range of methodologies. Current approaches include using “high-quality” datasets [6] or ST [11]. A common approach for inference benchmarking is validation on synthetic data. However, it is not clear how to best generate synthetic scRNA-seq with a well-defined underlying CCC network, as the ground truth is unknown. While there exist methods to simulate synthetic scRNA-seq data [12, 32], there are no methods to generate CCC networks with realistic spatial constraints.
4. Integration with mathematical modeling
CCC is a spatiotemporal process, but neither its dynamic nor spatial aspects are fully captured by single-cell transcriptomics. Mathematical models can be harnessed to validate temporal and spatial effects and simulate perturbed variants of the studied system.
5. Multi-omics integration
In addition to scRNA-seq and ST, there are now other emerging single-cell technologies that provide protein [37–39] and epigenetic [45] information. For example, integrating scRNA-seq with scATAC-seq provides additional insight into cell clustering and transcriptional regulation [46]. CCC will clearly benefit from such integration. As CCC involves both protein-specific and gene-specific responses, but neither scRNA-seq nor ST capture protein-level information, it is pertinent that CCC methods be extended to incorporate these multi-omics data to improve and validate CCC inference and enable better method benchmarking.
Single-cell transcriptomics has yielded enormous amounts of biological data, allowing for new insights into CCC. As more technologies and inference methods emerge and are refined, the field of CCC inference holds great promise for many exciting opportunities and insights.
Acknowledgments
We apologize for unintentionally excluding any current CCC methods in the literature, due to the constraint on the number of references. This work is partially supported by a NSF grant DMS1763272, a grant from the Simons Foundation (594598, QN), and a NIH grant U01AR073159.
Footnotes
Publisher's Disclaimer: This is a PDF file of an unedited manuscript that has been accepted for publication. As a service to our customers we are providing this early version of the manuscript. The manuscript will undergo copyediting, typesetting, and review of the resulting proof before it is published in its final form. Please note that during the production process errors may be discovered which could affect the content, and all legal disclaimers that apply to the journal pertain.
Declaration of interests
The authors declare that they have no known competing financial interests or personal relationships that could have appeared to influence the work reported in this paper.
References
Publications that are of special (•) or outstanding (••) interest have been annotated.
- [1].Svensson V, Vento-Tormo R, and Teichmann SA, “Exponential scaling of single-cell RNA-seq in the past decade,” Nat. Protoc, vol. 13, no. 4, pp. 599–604, 2018, doi: 10.1038/nprot.2017.149. [DOI] [PubMed] [Google Scholar]
- [2].Hie B, Peters J, Nyquist SK, Shalek AK, Berger B, and Bryson BD, “Computational Methods for Single-Cell RNA Sequencing,” Annu. Rev. Biomed. Data Sci, vol. 3, no. 1, pp. 339–364, 2020, doi: 10.1146/annurev-biodatasci-012220-100601. [DOI] [Google Scholar]
- (••)[3].Wang S, Karikomi M, Maclean AL, and Nie Q, “Cell lineage and communication network inference via optimization for single-cell transcriptomics,” Nucleic Acids Res, vol. 47, no. 11, pp. 1–13, 2019, doi: 10.1093/nar/gkz204.One of the few works to focus specifically on individual cell-cell communication, using a pairwise function based on ligand and receptor expression.
- [4].Lewis N, Armingol E, Officer A, and Harismendy O, “Deciphering cell-cell interactions and communication from gene expression,” Nat. Rev. Genet, 2020, doi: 10.1038/s41576-020-00292-x. [DOI] [PMC free article] [PubMed] [Google Scholar]
- (••)[5].Jin S et al. , “Inference and analysis of cell-cell communication using CellChat,” Nat. Commun, no. 2021, pp. 1–20, 2021, doi: 10.1101/2020.07.21.214387.State of the art for cell-cell communication visualization and demonstrates how various methods from other fields can be adapted to facilitate the interrogation of complex cell-cell communication methods.
- [6].Cabello-Aguilar S, Alame M, Kon-Sun-Tack F, Fau C, Lacroix M, and Colinge J, “SingleCellSignalR: inference of intercellular networks from single-cell transcriptomics,” Nucleic Acids Res, vol. 48, no. 10, 2020, doi: 10.1093/nar/gkaa183. [DOI] [PMC free article] [PubMed] [Google Scholar]
- (••)[7].Efremova M, Vento-Tormo M, Teichmann SA, and Vento-Tormo R, “CellPhoneDB: inferring cell–cell communication from combined expression of multi-subunit ligand–receptor complexes,” Nat. Protoc, vol. 15, no. 4, pp. 1484–1506, 2020, doi: 10.1038/s41596-020-0292-x.A pioneering work that demonstrates how cell-cell communication can be inferred from scRNA-seq data by considering possible ligand-receptor interactions.
- [8].Noël F et al. , “Dissection of intercellular communication using the transcriptome-based framework ICELLNET,” Nat. Commun, no. 2021, pp. 1–6, 2021, doi: 10.1038/s41467-021-21244-x. [DOI] [PMC free article] [PubMed] [Google Scholar]
- (••)[9].Browaeys R, Saelens W, and Saeys Y, “NicheNet: modeling intercellular communication by linking ligands to target genes,” Nat. Methods, vol. 17, no. 2, pp. 159–162, 2020, doi: 10.1038/s41592-019-0667-5.One of the first works that systematically considers the downstream response of receiver cells and infers possible ligand-target links between senders and receivers.
- [10].Cheng J, Zhang J, Wu Z, and Sun X, “Inferring microenvironmental regulation of gene expression from single-cell RNA sequencing data using scMLnet with an application to COVID-19,” Brief. Bioinform, vol. 00, no. July, pp. 1–18, 2020, doi: 10.1093/bib/bbaa327. [DOI] [PMC free article] [PubMed] [Google Scholar]
- [11].Hu Y, Peng T, Gao L, and Tan K, “CytoTalk: De novo construction of signal transduction networks using single-cell RNA-Seq data,” pp. 1–22, 2020, doi: 10.1101/2020.03.29.014464. [DOI] [PMC free article] [PubMed] [Google Scholar]
- [12].Tsuyuzaki K, Ishii M, and Nikaido I, “Uncovering hypergraphs of cell-cell interaction from single cell RNA-sequencing data,” bioRxiv, no. Cci, p. 566182, 2019, doi: 10.1101/566182. [DOI] [Google Scholar]
- [13].Yang AC et al. , “Broad transcriptional dysregulation of brain and choroid plexus cell types with COVID-19,” bioRxiv, vol. 2, no. October, p. 2020.10.22.349415, 2020, doi: 10.1101/2020.10.22.349415. [DOI] [Google Scholar]
- [14].Vento-Tormo R et al. , “Single-cell reconstruction of the early maternal–fetal interface in humans,” Nature, vol. 563, no. 7731, pp. 347–353, 2018, doi: 10.1038/s41586-018-0698-6. [DOI] [PMC free article] [PubMed] [Google Scholar]
- [15].Abbasi S et al. , “Distinct Regulatory Programs Control the Latent Regenerative Potential of Dermal Fibroblasts during Wound Healing,” Cell Stem Cell, pp. 1–17, 2020, doi: 10.1016/j.stem.2020.07.008. [DOI] [PubMed] [Google Scholar]
- [16].Bonnardel J et al. , “Stellate Cells, Hepatocytes, and Endothelial Cells Imprint the Kupffer Cell Identity on Monocytes Colonizing the Liver Macrophage Niche,” Immunity, vol. 51, no. 4, pp. 638–654.e9, 2019, doi: 10.1016/j.immuni.2019.08.017. [DOI] [PMC free article] [PubMed] [Google Scholar]
- [17].Rodriques SG et al. , “Slide-seq: A scalable technology for measuring genome-wide expression at high spatial resolution,” Science (80-. ), vol. 363, no. 6434, pp. 1463–1467, 2019, doi: 10.1126/science.aaw1219. [DOI] [PMC free article] [PubMed] [Google Scholar]
- [18].Eng CHL et al. , “Transcriptome-scale super-resolved imaging in tissues by RNA seqFISH+,” Nature, vol. 568, no. 7751, pp. 235–239, 2019, doi: 10.1038/s41586-019-1049-y. [DOI] [PMC free article] [PubMed] [Google Scholar]
- [19].Ståhl PL et al. , “Visualization and analysis of gene expression in tissue sections by spatial transcriptomics,” Science (80-. ), vol. 353, no. 6294, pp. 78–82, 2016, doi: 10.1126/science.aaf2403. [DOI] [PubMed] [Google Scholar]
- [20].Waylen LN, Nim HT, Martelotto LG, and Ramialison M, “From whole-mount to single-cell spatial assessment of gene expression in 3D,” Commun. Biol, vol. 3, no. 1, pp. 1–11, 2020. [DOI] [PMC free article] [PubMed] [Google Scholar]
- [21].Pham DT et al. , “stLearn: integrating spatial location, tissue morphology and gene expression to find cell types, cell-cell interactions and spatial trajectories within undissociated tissues,” bioRxiv, 2020. [Google Scholar]
- (••)[22].Cang Z and Nie Q, “Inferring spatial and signaling relationships between cells from single cell transcriptomic data,” Nat. Commun, pp. 1–13, 2020, doi: 10.1038/s41467-020-15968-5.Uses optimal transport to map cell-cell communication inferred from scRNA-seq to spatial transcriptomics to account for spatial distances between cells.
- [23].Lopez R et al. , “A joint model of unpaired data from scRNA-seq and spatial transcriptomics for imputing missing gene expression measurements,” arXiv Prepr. arXiv1905.02269, 2019. [Google Scholar]
- [24].Dries R et al. , “Giotto, a pipeline for integrative analysis and visualization of single-cell spatial transcriptomic data,” Genome Biol, pp. 1–31, 2021, doi: 10.1101/701680.33397451 [DOI] [Google Scholar]
- [25].Zhu Q, Shah S, Dries R, Cai L, and Yuan G-C, “Identification of spatially associated subpopulations by combining scRNAseq and sequential fluorescence in situ hybridization data,” Nat. Biotechnol, vol. 36, no. 12, p. 1183, 2018. [DOI] [PMC free article] [PubMed] [Google Scholar]
- [26].Andersson A et al. , “Single-cell and spatial transcriptomics enables probabilistic inference of cell type topography,” Commun. Biol, vol. 3, no. 1, pp. 1–8, 2020, doi: 10.1038/s42003-020-01247-y. [DOI] [PMC free article] [PubMed] [Google Scholar]
- [27].Nitzan M, Karaiskos N, Friedman N, and Rajewsky N, “Gene expression cartography,” Nature, vol. 576, no. 7785, pp. 132–137, Dec. 2019, doi: 10.1038/s41586-019-1773-3. [DOI] [PubMed] [Google Scholar]
- [28].Bravo González‐Blas C et al. , “Identification of genomic enhancers through spatial integration of single‐cell transcriptomics and epigenomics,” Mol. Syst. Biol, vol. 16, no. 5, p. e9438, 2020. [DOI] [PMC free article] [PubMed] [Google Scholar]
- [29].Ren X, Zhong G, Zhang Q, Zhang L, Sun Y, and Zhang Z, “Reconstruction of cell spatial organization from single-cell RNA sequencing data based on ligand-receptor mediated self-assembly,” Cell Res, vol. 30, no. 9, pp. 763–778, 2020. [DOI] [PMC free article] [PubMed] [Google Scholar]
- [30].Armingol E et al. , “Inferring the spatial code of cell-cell interactions and communication across a whole animal body Graphical abstract,” bioRxiv, p. 2020.11.22.392217, 2020. [Google Scholar]
- [31].Arnol D, Schapiro D, Bodenmiller B, Saez-Rodriguez J, and Stegle O, “Modeling Cell-Cell Interactions from Spatial Molecular Data with Spatial Variance Component Analysis,” Cell Rep, vol. 29, no. 1, pp. 202–211.e6, 2019, doi: 10.1016/j.celrep.2019.08.077. [DOI] [PMC free article] [PubMed] [Google Scholar]
- [32].Tanevski J, Gabor A, Flores ROR, Schapiro D, and Saez-Rodriguez J, “Explainable multi-view framework for dissecting inter-cellular signaling from highly multiplexed spatial data,” 2020, doi: 10.1101/2020.05.08.084145. [DOI] [Google Scholar]
- [33].Huang X, Chen D, Ren T, and Wang D, A survey of community detection methods in multilayer networks Springer US, 2020. [Google Scholar]
- [34].Cabello-Aguilar S, Alame M, Kon-Sun-Tack F, Fau C, Lacroix M, and Colinge J, “SingleCellSignalR: inference of intercellular networks from single-cell transcriptomics,” Nucleic Acids Res, pp. 1–12, 2020, doi: 10.1093/nar/gkaa183. [DOI] [PMC free article] [PubMed] [Google Scholar]
- [35].Sheikh BN et al. , “Systematic Identification of Cell-Cell Communication Networks in the Developing Brain,” iScience, vol. 21, pp. 273–287, 2019. [DOI] [PMC free article] [PubMed] [Google Scholar]
- [36].Wang L et al. , “Single-cell reconstruction of the adult human heart during heart failure and recovery reveals the cellular landscape underlying cardiac function,” Nat. Cell Biol, vol. 22, no. 1, pp. 108–119, 2020. [DOI] [PubMed] [Google Scholar]
- [37].Stoeckius M et al. , “Simultaneous epitope and transcriptome measurement in single cells,” Nat. Methods, vol. 14, no. 9, pp. 865–868, 2017, doi: 10.1038/nmeth.4380. [DOI] [PMC free article] [PubMed] [Google Scholar]
- [38].Chung H et al. , “Simultaneous single cell measurements of intranuclear proteins and gene expression,” bioRxiv, 2021. [Google Scholar]
- [39].Katzenelenbogen Y et al. , “Coupled scRNA-Seq and Intracellular Protein Activity Reveal an Immunosuppressive Role of TREM2 in Cancer,” Cell, vol. 182, no. 4, pp. 872–885.e19, 2020, doi: 10.1016/j.cell.2020.06.032. [DOI] [PubMed] [Google Scholar]
- [40].Wang Y et al. , “iTALK: an R Package to Characterize and Illustrate Intercellular Communication,” bioRxiv, p. 507871, 2019, doi: 10.1101/507871. [DOI] [Google Scholar]
- [41].Pratapa A, Jalihal AP, Law JN, Bharadwaj A, and Murali TM, “Benchmarking algorithms for gene regulatory network inference from single-cell transcriptomic data,” Nat. Methods, vol. 17, no. 2, pp. 147–154, 2020, doi: 10.1038/s41592-019-0690-6. [DOI] [PMC free article] [PubMed] [Google Scholar]
- [42].Cheng J, Zhang J, Wu Z, and Sun X, “Inferring microenvironmental regulation of gene expression from single-cell RNA sequencing data using scMLnet with an application to SARS-CoV-2 receptor gene,” Briefings Bioinforma. (Under Rev, 2020. [DOI] [PMC free article] [PubMed] [Google Scholar]
- [43].Sha Y, Wang S, Zhou P, and Nie Q, “Inference and multiscale model of epithelial-to-mesenchymal transition via single-cell transcriptomic data,” Nucleic Acids Res, vol. 48, no. 17, pp. 9505–9520, 2020, doi: 10.1093/nar/gkaa725. [DOI] [PMC free article] [PubMed] [Google Scholar]
- [44].Saelens W, Cannoodt R, Todorov H, and Saeys Y, “A comparison of single-cell trajectory inference methods,” Nat. Biotechnol, vol. 37, no. 5, pp. 547–554, 2019, doi: 10.1038/s41587-019-0071-9. [DOI] [PubMed] [Google Scholar]
- [45].Buenrostro JD et al. , “Single-cell chromatin accessibility reveals principles of regulatory variation,” Nature, vol. 523, no. 7561, pp. 486–490, 2015, doi: 10.1038/nature14590. [DOI] [PMC free article] [PubMed] [Google Scholar]
- [46].Jin S, Zhang L, and Nie Q, “scAI: an unsupervised approach for the integrative analysis of parallel single-cell transcriptomic and epigenomic profiles,” Genome Biol, vol. 21, no. 1, pp. 1–19, 2020, doi: 10.1186/s13059-020-1932-8. [DOI] [PMC free article] [PubMed] [Google Scholar]
- [47].Solovey M and Scialdone A, “COMUNET: A tool to explore and visualize intercellular communication,” Bioinformatics, vol. 36, no. 15, pp. 4296–4300, 2020, doi: 10.1093/bioinformatics/btaa482. [DOI] [PMC free article] [PubMed] [Google Scholar]
- [48].Hou R, Denisenko E, Ong HT, Ramilowski JA, and Forrest ARR, “Predicting cell-to-cell communication networks using NATMI,” Nat. Commun, vol. 11, no. 1, p. 5011, 2020, doi: 10.1038/s41467-020-18873-z. [DOI] [PMC free article] [PubMed] [Google Scholar]
- [49].Tyler SR et al. , “PyMINEr Finds Gene and Autocrine-Paracrine Networks from Human Islet scRNA-Seq,” Cell Rep, vol. 26, no. 7, pp. 1951–1964.e8, 2019, doi: 10.1016/j.celrep.2019.01.063. [DOI] [PMC free article] [PubMed] [Google Scholar]