

Abstract
Objective:
To assess whether ictal electric source imaging (ESI) on low-density scalp EEG can approximate the seizure onset zone (SOZ) location and predict surgical outcome in children with refractory epilepsy undergoing surgery.
Methods:
We examined 35 children with refractory epilepsy. We dichotomized surgical outcome into seizure- and non-seizure-free. We identified ictal onsets recorded with scalp and intracranial EEG and localized them using equivalent current dipoles and standardized low-resolution magnetic tomography (sLORETA). We estimated the localization accuracy of scalp EEG as distance of scalp dipoles from intracranial dipoles. We also calculated the distances of scalp dipoles from resection, as well as their resection percentage and compared between seizure-free and non-seizure-free patients. We built receiver operating characteristic curves to test whether resection percentage predicted outcome.
Results:
Resection distance was lower in seizure-free patients for both dipoles (p = 0.006) and sLORETA (p = 0.04). Resection percentage predicted outcome with a sensitivity of 57.1% (95% CI, 34–78.2%), a specificity of 85.7% (95% CI, 57.2–98.2%) and an accuracy of 68.6% (95% CI, 50.7–83.5%) (p = 0.01).
Conclusion:
Ictal ESI performed on low-density scalp EEG can delineate the SOZ and predict outcome.
Significance:
Such an application may increase the number of children who are referred for epilepsy surgery and improve their outcome.
Keywords: Electroencephalography, Pediatric Epilepsy, Source Localization
1. Introduction
For patients with refractory epilepsy, surgical resection of the epileptogenic zone is a major therapeutic option, which may result in significant seizure improvement or freedom (Rosenow and Lüders, 2001; Téllez-Zenteno et al., 2005). To be successful, epilepsy surgery requires a comprehensive presurgical evaluation, which includes semiology, EEG, magnetic resonance imaging (MRI), and in some cases, functional neuroimaging with several techniques, such as single-photon emission computed tomography (SPECT), 18F-fluorodeoxyglucose positron emission tomography (FDG-PET), and magnetoencephalography (MEG) (Rosenow and Lüders, 2001). However, presurgical tests are often insufficient to accurately localize the seizure onset zone, which is the most reliable estimator of the epileptogenic zone (Lüders et al., 2006; Ryvlin et al., 2014). Intracranial EEG is needed to serve this purpose (Engel, 1993a, 1993b), but is not free from surgical complications and only offers partial brain coverage (Cossu et al., 2005). The possibility to localize the SOZ with full-head non-invasive techniques would offer a decisive advantage in the surgical management of patients with refractory epilepsy.
Electric and magnetic source imaging are currently used for the non-invasive localization of the irritative zone, the brain area that generates interictal discharges. However, the irritative zone is relatively large and may overlap with the eloquent cortex. Moreover, it does not necessarily coincide with the SOZ (Rosenow and Lüders, 2001; Lüders et al., 2006). Electric source imaging on high-density EEG and magnetic source imaging with MEG have been shown to localize the SOZ with high precision (Pellegrino et al., 2016; Nemtsas et al., 2017; Duez et al., 2019; Plummer et al., 2019; Sohrabpour et al., 2020). Among others, Sohrabpour and colleagues (2020) recently showed that with high-density EEG and an advanced source imaging algorithm an averaged localization error for ictal imaging of ~7 mm can be obtained in adult patients with epilepsy. Similarly, Duez et al. (2019) showed that source imaging of ictal and interictal discharges using high-density EEG and MEG has accuracy similar to established imaging methods and provides clinically useful, new information in 34% of the patients. Nevertheless, MEG is limited by its short recording time that restricts the number of captured stereotyped seizures, its elevated cost, and the need for highly trained personnel. On the other hand, high-density EEG allows long-term monitoring, which enhances the likelihood to capture several stereotyped seizures, but requires high frequency of maintenance, time-consuming patient preparation, and long time to review the data (Chu, 2015).
Low-density scalp EEG is low cost and widely available to numerous epilepsy centers, but it has been long considered inadequate for a reliable localization of the SOZ (Song et al., 2015). Only recently, a few studies demonstrated the potential benefit of electric source imaging via low-density scalp EEG (ldESI) for the localization of interictal discharges (Russo et al., 2016; Baroumand et al., 2018; Tamilia et al., 2019) and the delineation of the SOZ in adults (Staljanssens et al., 2017; Sharma et al., 2018; Foged et al., 2020). Nevertheless, it has not been demonstrated yet the use of ldESI for delineating the SOZ non-invasively and offering prognostic information at the individual patient’s level. The goal of this study is to assess the clinical utility of ldESI to localize the SOZ in children with refractory epilepsy prior to surgery. We hypothesize that ldESI can delineate the SOZ non-invasively before implanting intracranial EEG and its resection predicts outcome. To test our hypothesis, we: (i) localized the onsets of clinical seizures in children with known surgical outcome using ldESI; (ii) quantified their localization accuracy against the ground-truth given by electric source imaging on intracranial EEG (icESI); and (iii) evaluated whether resection of the SOZ defined by ldESI predicted outcome. We further estimated the added value of ldESI on ictal onset data compared to other presurgical evaluation techniques.
2. Material and methods
2.1. Patient cohort
We retrospectively reviewed the data of children with refractory epilepsy who underwent presurgical evaluation at the Epilepsy Center of Boston’s Children Hospital (BCH) between April 2010 and February 2017. We selected patients who met the following criteria: (i) underwent long-term monitoring with low-density scalp EEG and intracranial EEG; (ii) had at least one focal seizure during both scalp EEG and intracranial EEG; (iii) had post-implantation computerized tomography (CT) and pre-operative MRI; (iv) underwent surgical resection and post-operative MRI; and (v) their two-years postsurgical follow-up was available. Patients were included without a priori selection of their surgical outcome. The study protocol received approval by BCH Institutional Review Board (IRB-P00022114).
2.2. Acquisition of scalp EEG and intracranial EEG
All patients underwent long-term monitoring with scalp EEG using the standard clinical setup with 19 electrodes, plus two fronto-temporal leads (FT9 and FT10) and four optionally added electrodes (i.e. F9, F10, P9, and P10). Data were recorded using the XLTEK EMU40 system (Natus Inc., USA) with a rate of 512 or 1024 Hz. Individual leads were placed according to the international 10/20 system. Impedances were kept < 10 KΩ. Reference and ground electrodes were placed in frontocentral areas.
Long-term monitoring with intracranial EEG was performed and planned after consensus of BCH multidisciplinary epilepsy team due to a perceived need for better definition of the SOZ and/or eloquent regions. Intracranial EEG was recorded with subdural grids and strips (2.3-mm exposure diameter, 10-mm distance; Ad-Tech., USA) and/or depth electrodes (10 contacts: 1.1-mm diameter, 3–5 mm inter-distance; Ad-Tech., USA), using LTEK NeuroWorks (Natus Inc., USA) and sampling rate between 500 and 2000 Hz. Both ldESI and icESI were performed retrospectively; thus, they did not influence surgical planning.
2.3. MRI and co-registration with EEG
MRIs were acquired before and after surgical resection with magnetization-prepared rapid acquisition gradient-echo sequences (MPRAGE; TE = 1.74 ms, TR = 2, 520 ms, voxel size = 1 × 1 × 1 mm) using a 3 T scanner (TIM TRIO, Siemens AG, Germany) (Prabhu and Mahomed, 2015). No head tracking data were collected for scalp EEG. The electrode locations were manually co-registered with the patient’s pre-operative MRI (Tamilia et al., 2019) based on the MNI coordinates of the 10–20 system, as defined on the Colin27 brain (Holmes et al., 1998). For intracranial EEG, we determined the location of each contact by co-registering post-implantation CT (voxel size = 0.5 × 0.5 × 0.5 mm) with pre-operative MRI (Tamilia et al., 2018, 2019, 2020; Alhilani et al., 2020) on Brainstorm (Tadel et al., 2011).
2.4. Resection and post-surgical outcome
The resection margins were decided prospectively based on patient’s presurgical evaluation and long-term intracranial EEG monitoring, independently from this study. We delineated the resection by co-registering pre- and post-operative MRIs. Post-surgical outcome was determined based on the most recent follow-up visit using Engel scale (Engel, 1993a, 1993b) and dichotomized into seizure-free (SF; Engel 1) and non-seizure-free (NSF; Engel ≥ 2).
2.5. Identification of seizure onset
The scalp and intracranial EEG were reviewed for electroclinical seizures by two neurophysiologists blind to the clinical data and to each other’s marking (L.R. and A.A.). Scalp and intracranial EEG seizures were then furtherly reviewed for the correct marking of the seizure onset by a senior epileptologist (J.M.P.). The seizure onset was defined as a sudden change of activity that was distinct from the preceding background, followed by an evolution of this activity in both frequency and amplitude (Verma and Radtke. 2006). Offline data pre-processing was performed with Brainstorm (Tadel et al., 2011) and included: DC removal, 60-Hz notch filter, bandpass filter between 1 and 70 Hz, removal of bad channels, EEG re-reference to average, and correction for heartbeat and eye-blink artifacts using Independent Component Analysis (Nemtsas et al., 2017).
2.6. Forward models
We extracted the cortical surfaces from each patient’s pre-operative MRI using Freesurfer (Dale et al., 1999) and constructed a realistic head model (boundary elementary model) with Open-MEEG (Gramfort et al., 2010) using three layers (scalp, outer skull, and inner skull) for scalp EEG and one layer (inner skull) for intracranial EEG (Tamilia et al., 2019). A grid of volume points that sampled the full brain was generated in Brainstorm (Tadel et al., 2011).
2.7. Electric source imaging of ictal onset activity
Electric source imaging was performed for each seizure (separately for scalp and intracranial EEG) by a neurophysiologist (L. R.) not involved in any aspects of the clinical care of patients under examination and blind to the clinical data and the surgical outcome. We aimed to localize epileptiform activity during the epochs of earliest ictal changes (Fig. 1A). To identify the frequency band of each earliest ictal change (or predominant ictal frequency), we computed the time-frequency decomposition of each channel around seizure onset (Fig. 1B). Then, we selected the channel showing the largest energy change at seizure onset (Gotman et al., 1993; Fujiwara et al., 2012; Pellegrino et al., 2016) and the frequency band showing the largest energy change determined the predominant ictal frequency (Fig. 1B). Seizures where the onset was diffused to several distant electrodes or masked by extensive muscular artifacts were not considered. By following previously described methodology (Beniczky et al., 2013; Nemtsas et al., 2017), we band-pass filtered the signals ± 1 Hz around the predominant ictal frequency (Fig. 1C). For each seizure, we marked the timing of all negativity peaks with similar voltage map distributions by looking at the earliest onset channel (Alhilani et al., 2020) (Fig. 1C). Ictal waves with similar voltage map distributions within each seizure were then averaged aligned to the negative peak. We localized each seizure onset with equivalent current dipole (ECD) (Hämäläinen et al., 1993), the localization method with the longest history in clinical practice (Barth et al., 1982; Knowlton et al., 1997; Stefan et al., 2003), using dipole scanning performed from the initial ascending slope to the negativity peak of the averaged signal (Beniczky et al., 2013). The dipole with the highest goodness-of-fit (GOF) (Tamilia et al., 2019) was selected for each seizure and defined the location of each seizure source (Fig. 1D). Only dipoles with GOF ≥ 60% or forming a cluster (Almubarak et al., 2014) (Fig. 2A) were used for further analysis (Rikir et al., 2014; Tamilia et al., 2019).
Fig. 1. Identification of ictal onset and seizure onset zone (SOZ) localization.
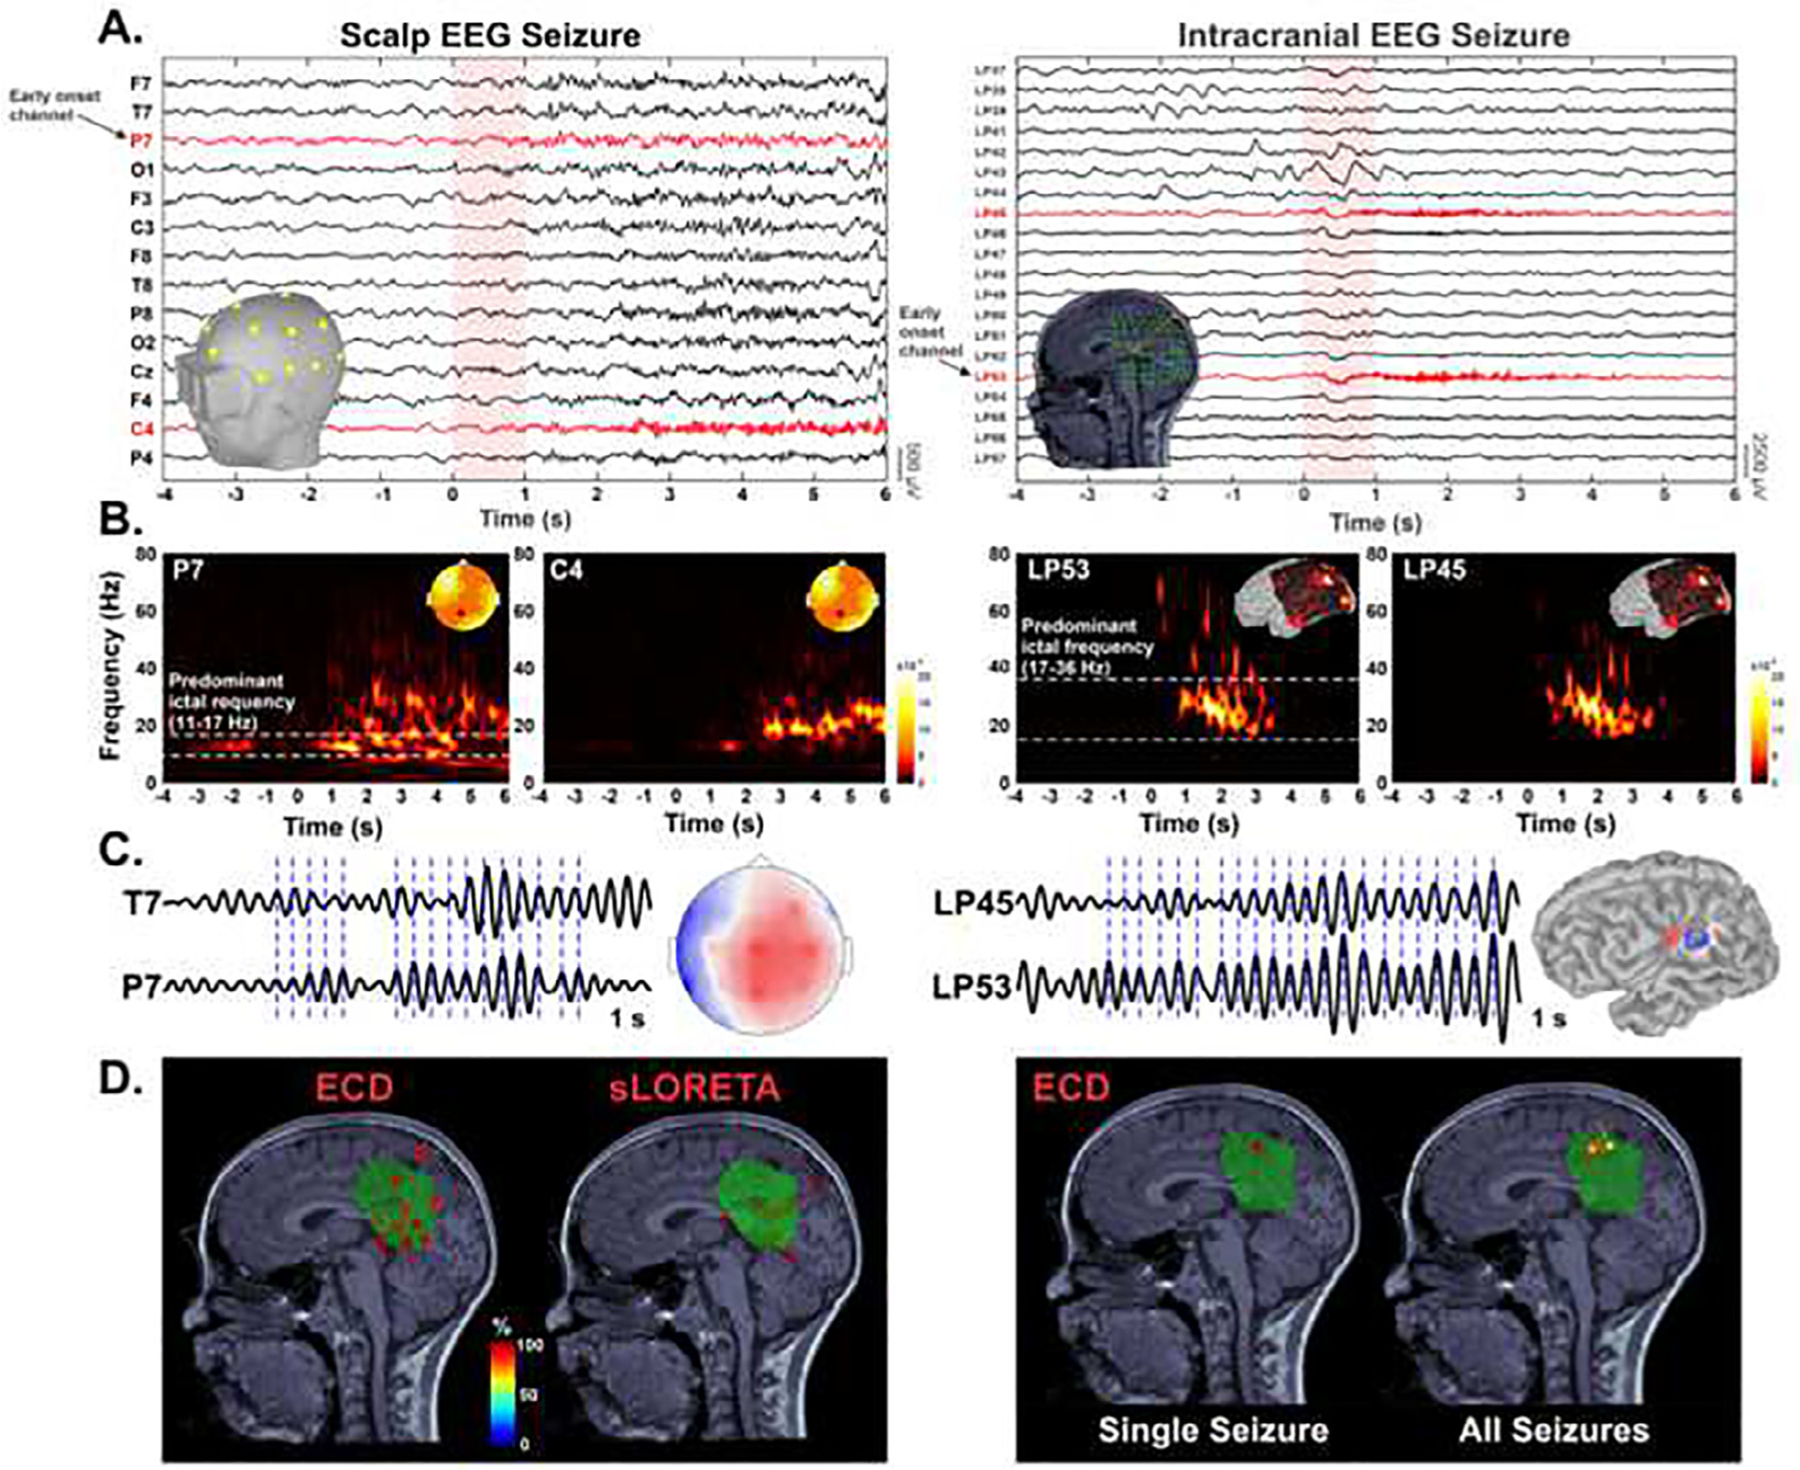
A. Seizure onset (vertical red highlight area) on low-density scalp EEG and intracranial EEG (selection of a −4 s to 6 s time window). B. Morlet time–frequency decomposition for identification of the frequency band of interest (white horizontal dotted lines). C. Ictal waves filtered ± 1 Hz around the predominant frequency and corresponding voltage map distribution. Ictal discharges are marked at the negativity peak for averaging (blue vertical dotted lines). D. Source localization of SOZ: comparison between Equivalent Current Dipole (ECD) and Standardized Low-Resolution Electromagnetic Tomography sLORETA in a patient with focal medical refractory epilepsy. Left: Source localization of all seizures from patient #27 using ECD and sLORETA. ECDs are color-coded based on their goodness of fit (GOF). The sLORETA panel displays the volume points showing > 90% of the maximum sLORETA value. Resected volume (green volume) defined by marking volume points corresponding to resection cavity on the postsurgical MRI co-registered with the presurgical MRI. Right: Source localization (ECD) of averaged ictal waveform peak for the intracranial seizure shown in panel A. Source localization (ECD) of all intracranial seizures for this patient.
Fig. 2. Electric source imaging localization metrics.

A. Equivalent Current Dipoles (ECDs) of ictal discharges classified as forming a cluster when displaying a group of ≥ 5 dipoles within the same anatomical sublobe. B. Ground-truth seizure onset zone (icESI-SOZ) defined by dipoles (orange) localized from intracranial EEG electrodes (green). C. Localization accuracy (Errloc) defined as the Euclidean distance (red arrow) of each Electric Source Imaging on Low-Density Scalp EEG (ldESI-SOZ) dipole (yellow) from the closest ground-truth SOZ dipole (orange). D. Distance of each SOZ dipole from resection cavity defined by the Euclidean distance of each dipole from the closest points of the resected volume (Dres, light blue arrow). Resected volume (orange volume) defined by marking volume points corresponding to resection cavity on the postsurgical MRI co-registered with the presurgical MRI. icEEG = intracranial EEG.
Finally, the coordinates of all seizures’ sources localized with the ldESI defined the patient’s non-invasively localized SOZ (ldESI-SOZ). Similarly, all the seizures captured during the long-term intracranial EEG were localized with icESI. The sources of these seizures defined the ground-truth SOZ (icESI-SOZ). Further details about the icESI method can be found in our previous work (Alhilani et al., 2020).
2.8. Localization accuracy of ldESI-SOZ to ground-truth SOZ
The localization accuracy of ldESI-SOZ (Errloc) was calculated as the minimum Euclidean distance of each ldESI-SOZ dipole from the ground-truth given by the icESI-SOZ (Fig. 2B–C). Only SF patients were considered in this analysis as proof of successful delineation and coverage of the SOZ. We also estimated the localization precision of ldESI within three different ranges of accuracy by calculating the percentage of dipoles showing an accuracy below 15 mm, 25 mm, and 35 mm.
2.9. Prognostic value for outcome
The distance of each ldESI dipole from the resection was calculated as its minimum Euclidean distance from the resected volume (Dres, Fig. 2D). The resection percentage was calculated as the proportion of dipoles showing Dres < 10 mm, to account for the spatial resolution of electrical source imaging (ESI) (cm-range), and the brain shift that can occur after resective surgery. To assess whether the ldESI-SOZ resection predicts the outcome of each individual patient, we built receiver operating characteristic (ROC) curves on the resection percentage. We considered seizure freedom following resection to be the ground truth, i.e. unambiguous proof of resection of the epileptogenic zone. Thus, we regarded as: (i) true positives (TP), SF patients with high resection percentage (i.e. complete resection); (ii) true negatives (TN), NSF patients with low resection percentage (i.e. incomplete resection); (iii) false positives (FP), NSF patients with complete resection; and (iv) false negatives (FN), SF patients with incomplete resection. The following performance metrics were estimated in terms of outcome prediction: (i) sensitivity (TP/TP + FN), (ii) specificity (TN/TN + FP), (iii) positive predictive value [PPV = TP/(TP + FP)], (iv) negative predictive value [NPV = TN/(TN + FN)]; and (v) accuracy [(TN + TP)/(TP + FP + TN + FN)]. The ROC curve point showing the highest combination of predictive values was selected as the optimum cut-off value to differentiate low vs. high resection percentage (incomplete vs. complete resection). Finally, we build the non-parametric ROC curve in order to estimate the 95% confidence interval (CI) for the Area Under the Curve (AUC), sensitivity, specificity, and accuracy of the ldESI-SOZ resection using the “pROC” package in R. CIs were computed with the method defined by DeLong et al (1988).
2.10. Standardized Low-Resolution Electromagnetic tomography (sLORETA)
Each seizure was also localized using sLORETA, a source imaging technique which belongs to a family of inverse solution procedures modelling 3D distributions of EEG sources over the brain volume (Pascual-Marqui et al., 1994). For each patient, we determined the sources of each seizure’s onset that was captured by low-density EEG as the volume points showing > 99% of the maximum sLORETA value. Then, all these volume points were merged into a single sLORETA solution per patient (sLORETA-SOZ). The distance of sLORETA-SOZ from the resection was calculated as its minimum Euclidean distance from the resected volume (Dres). We also calculated the Euclidean distance between the sLORETA and the ECD solution for each patient. Fig. 1D shows an example of the sLORETA findings compared to ECD for patient #27.
2.11. Clinically defined SOZ (clinical-SOZ)
The clinical-SOZ was prospectively determined during the long-term intracranial EEG monitoring. Pediatric epileptologists identified the SOZ contact/s as those showing the earliest change from the background activity associated with each clinical seizure captured, independently from this study. For each patient, we determined the clinical-SOZ location as the coordinates of all SOZ contact/s (Alhilani et al., 2020).
2.12. Additive value of ldESI-SOZ
To estimate the additive clinical value of ldESI-SOZ before intracranial EEG implantation, we evaluated its anatomical concordance with the standard reference provided by intracranial EEG coverage, with respect to the other non-invasive tests typically performed in clinical practice (Fig. 3): (i) long-term video EEG monitoring (clinical reading of ictal onset at the sensor level); (ii) MRI (structural lesions); (iii) interictal FDG-PET (area/s of low metabolism); and (iv) ictal SPECT (area/s of ictal activation). The concordance of these tests with the reference was classified as following: (i) sublobar concordance (findings in same sublobe/s); (ii) lobar concordance (findings in same lobe/s but different sublobe/s); (iii) partial concordance (findings in same lobe/s but also different lobe/s); or (iv) discordance (findings in different lobe/s or negative results). We defined in total 20 sublobar regions (Agirre-Arrizubieta et al., 2009; Rikir et al., 2014).
Fig. 3. Presurgical evaluation process for localizing the epileptogenic zone and assessing patient’s suitability for surgery.
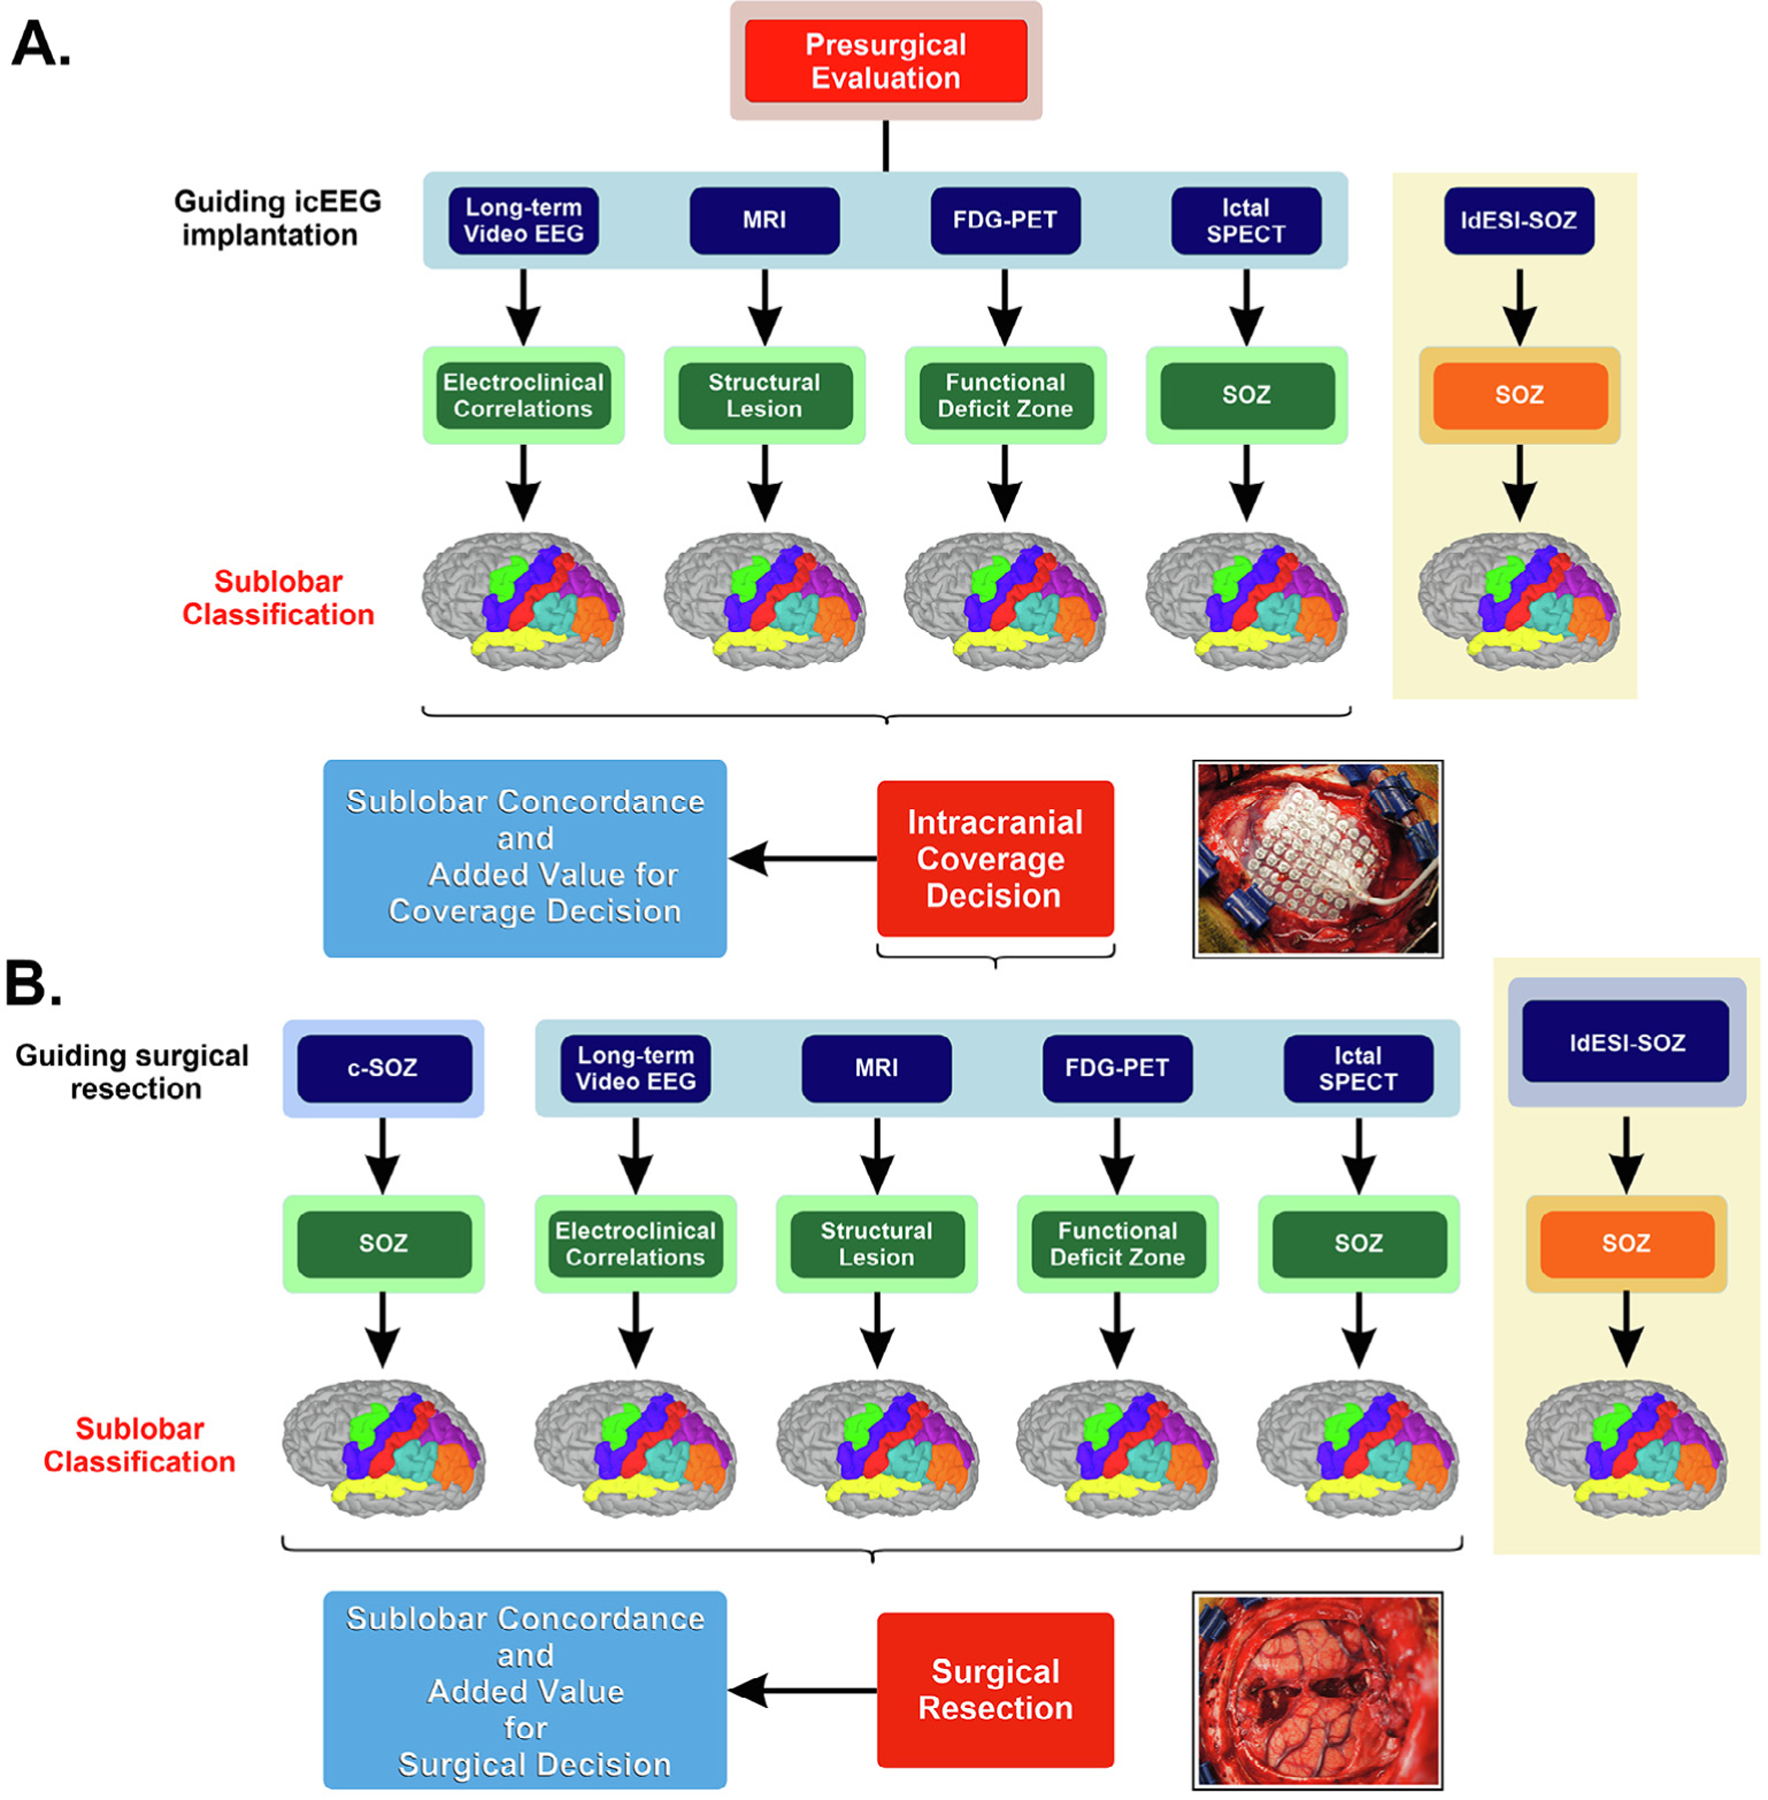
A. Phase 1 investigations. Non-invasive techniques include clinical reading of ictal conventional scalp EEG long-term monitoring, Magnetic Resonance imaging (MRI), ictal Single-Photon Emission Computed Tomography (SPECT) and interictal 18F-fluorodeoxyglucose positron emission tomography (FDG-PET) imaging. Localization results of each technique and Electric Source Imaging on Low-Density Scalp EEG (ldESI-SOZ) compared in terms of anatomical concordance with intracranial EEG coverage (phase 1 reference standard) to assess whether ldESI-SOZ may offer additional non-redundant information about intracranial EEG coverage decision. B. Phase 2 investigations. Intracranial EEG refers to clinical reading of SOZ from intracranial EEG recordings that display the earliest ictal changes from background activity. Non-invasive investigation techniques and ldESI-SOZ compared in terms of anatomical concordance with the surgical resected area (phase 2 reference standard) to assess whether ldESI-SOZ may offer additional non-redundant information about decision on surgical resection margins. icEEG = intracranial EEG; c-SOZ = clinical reading of SOZ from intracranial electrodes; SOZ = seizure onset zone.
To estimate the additive clinical value of ldESI-SOZ before surgery, we evaluated its anatomical concordance with the resection in respect to the other non-invasive techniques typically performed in clinical practice (Fig. 3). Concordance with the resection was determined as aforementioned. To estimate the value of the different techniques in guiding intracranial coverage and resection, we built a ROC curve on the level of concordance to predict surgical outcome (SF vs. NSF). We estimated the sensitivity, specificity, PPV, NPV, and accuracy of each localization technique. Finally, we evaluated the anatomical concordance of ldESI-SOZ with the clinical reading of SOZ (clinical-SOZ) and built a ROC curve on the level of concordance to predict surgical outcome (SF vs. NSF). We estimated its sensitivity, specificity, PPV, NPV, and accuracy.
2.13. Cross-validation and performance estimation
ROC curve analysis was employed as feature optimization method to determine the optimal threshold that differentiates SF from NSF patients. Feature optimization methods require cross-validation to be generalizable to the entire population in exam (Zhdanov et al., 2020). For this reason, we designed a classification method based on the combination of radial basis function kernel-based support vector machines (SVMs) and leave-one-out cross-validation using the Statistics and Machine Learning Toolbox in Matlab (2010). We trained a radial basis function SVM classifier for each of our ROC curve features’ source (i.e. ldESI-SOZ resection percentage; concordance of ldESI-SOZ, long-term video EEG interpretation, MRI, FDG-PET, SPECT with the reference standards) to achieve maximum balanced accuracy (mean of sensitivity and specificity) and estimated its performance using cross-validation. To evaluate the gain in predictive power provided by the ldESI-SOZ we performed SVM classification and cross-validation using different combinations of ESI and presurgical techniques (i.e. ldESI-SOZ + PET; ldESI-SOZ + SPECT; ldESI-SOZ + MRI, ldESI-SOZ + long-term video EEG interpretation).
2.14. Statistical analysis
Mann-Whitney U test was used to compare continuous variables between SF and NSF patients, while χ2 test was used to compare categorical variables. Wilcoxon sing-rank test was used to compare continuous variables for ldESI-SOZ. Fisher’s exact test was used to test the association between the use of combined subdural grids and depth electrodes and the concordance of ldESI-SOZ with the resection.
Wilcoxon sing-rank test was then used to compare the averaged Dres between sLORETA and dipoles ldESI-SOZ for all patients. Logistic regression was used to assess the association between Dres and the patient’s outcome including other confounding variables (i.e. age, gender, duration of epilepsy, seizures’ frequency, resection volume, lesion on MRI, and temporal vs. extra-temporal/multilobar resection). Fisher’s exact test was used to verify the association between the resection (above optimum cut-off) of ldESI-SOZ and outcome. Furthermore, Fisher’s exact test was used for each presurgical evaluation technique (i.e. ldESI-SOZ, clinical EEG reading, MRI, FDG-PET, SPECT, and clinical-SOZ) to assess whether concordance with the reference standard was associated with the outcome. We also performed ordered logistic regression, where the level of concordance (sublobar > lobar > partial > discord ant) with the reference was set as predictor of outcome. Finally, the results of cross-validated areas under the curves (AUCs) of each presurgical evaluation technique were compared with ldESI-SOZ using Wilcoxon sign-rank test.
Statistical analysis was performed using SPSS v. 20 (Chicago, IL). Significance level was set at p < 0.05. Bonferroni correction for multiple comparisons was applied when needed. Results are reported as mean ± standard deviation, or median (interquartile range) for non-normally distributed data. Shapiro-Wilk W test was used to check for normality.
3. Results
3.1. Patient cohort
Thirty-five patients (14 females) satisfied all selection criteria. Clinical and demographic characteristics of our cohort are reported in Table 1. Twenty-one patients (60%) were SF after surgery. The age at surgery was 11.88 ± 5.67 years and the duration from epilepsy onset to surgery was 7.26 ± 5.26 years, without differences between SF and NSF patients (p = 0.85 and p = 0.21). Twenty-five patients (71.4%) had abnormal MRI with different histopathological diagnoses (Table 1), without association with outcome (p = 0.44). No association between the outcome and limited resection due to overlap with the eloquent cortex and/or vascular structures was found (p = 0.49). Ictal SPECT and FDG-PET results were available for 29 and 30 patients respectively. The mean resection volume did not differ between SF and NSF patients (28.75 ± 18.8 8 cm3 and 23.69 ± 29.24 cm3; p = 0.54). Scalp EEG was performed with 25 electrodes in 10 patients and 21 electrodes in 25 patients. Intracranial EEG was performed with an average of 117 ± 6.2 electrodes per patient.
Table 1.
Patient clinical characteristics, outcome, and standard diagnostic work-up.
| No. | Sex | Duration epilepsy to surgery (years) | Age at surgery (years) | Seizure pattern | Semiology suspected focus | MRI | LTM | FDG-PET | SPECT | Pathology | # icEEG electrodes (SDE + DE) | Resection | Engel Outcome | Follow-up months | Ictal events | Ictal events after screening for GOF and clusters | ||||
|---|---|---|---|---|---|---|---|---|---|---|---|---|---|---|---|---|---|---|---|---|
| Total, n | ldEEG, n | icEEG, n | Total, n | ldEEG, n | icEEG, n | |||||||||||||||
| 1 | F | 2 | 5 | Multiple daily | Left T | Left T | Left F C T | Not done | Left T | FCD | 90 (DE) | Left: LT, OI | 1a | 24 | 9 | 1 | 8 | 9 | 1 | 8 |
| 2 | M | 1 | 10 | Multiple daily | Right F C | Right F | Right F C | Not done | Right C P | DNET | 144 + 10 | Right: MsF | 1a | 31 | 9 | 5 | 4 | 8 | 5 | 3 |
| 3 | F | 9 | 9 | Daily to weekly | Left hemisphere | Left MT | Bi-temporal L > R | Left T | Left T | Subependymal heterotopia + HS | 140 (DE) | Left: MT | 4 | 24 | 24 | 2 | 22 | 21 | 1 | 20 |
| 4 | M | 8 | 17 | Multiple daily | Non-localizing | Left T | Left F C T | Left T | Left ST | Ganglioglioma grade I | 72 + 20 | Left: LT, MT | 1a | 28 | 11 | 6 | 5 | 10 | 6 | 4 |
| 5 | F | 2 | 15 | Daily to weekly | Left T | Left T O | Left T | Left T | Non-conclusive | FCD + vascular malformation | 96 + 10 | Left: MT | 1a | 53 | 6 | 4 | 2 | 6 | 4 | 2 |
| 6 | M | 2 | 2 | Multiple daily | Left F | Left F C | Left F C | Left F C | Non-conclusive | FCD + Low grade Glioma | 80 (SDE) | Left: IF, IP, OI | 1a | 74 | 14 | 13 | 1 | 14 | 13 | 1 |
| 7 | F | 2 | 18 | Daily to weekly | Left T | Negative | Left F T | Left T | Left T | NS | 88 (SDE) | Left: MT | 1a | 29 | 10 | 5 | 5 | 9 | 5 | 4 |
| 8 | M | 4 | 6 | Multiple daily | Left hemisphere | Left F | Left hemisphere | Left T P | Non-localizing | FCD | 120 (SDE) | Left: IF | 3 | 74 | 35 | 10 | 25 | 14 | 10 | 4 |
| 9 | M | 4 | 16 | Multiple daily | Left T | Left T | Left T | Left T | Left MT | HS | 80 (SDE) | Left: MT | 1a | 39 | 8 | 3 | 5 | 8 | 3 | 5 |
| 10 | M | 11 | 15 | Weekly to monthly | Left F | Negative | Left F | Left MT | Bi-temporal | FCD | 88 (SDE) | Left: MT | 2b | 25 | 3 | 1 | 2 | 3 | 1 | 2 |
| 11 | M | 12 | 16 | Daily to weekly | Left F | Negative | Left T | Left T | Left T | NS | 88 (SDE) | Left: IF | 3 | 36 | 7 | 5 | 2 | 7 | 5 | 2 |
| 12 | M | 16 | 17 | Daily to weekly | Non-localizing | Right PO | R posterior quadrant | Not done | Right P | NS | 128 (SDE) | Right: LT, MT | 3 | 48 | 4 | 2 | 2 | 4 | 2 | 2 |
| 13 | F | 8 | 9 | Daily to weekly | Right F | Right MsF | Bi-frontal R > L | Left F | Left T | FCD | 112 + 10 | Right: MsF | 1b | 42 | 2 | 1 | 1 | 2 | 1 | 1 |
| 14 | F | 14 | 18 | Daily to weekly | Non-localizing | Left F | Bi-frontal L > R | Non-localizing | Left F | FCD | 144 + 10 | Left: IF | 2a | 24 | 26 | 4 | 22 | 18 | 4 | 14 |
| 15 | F | 8 | 14 | Weekly to monthly | Left C | Negative | Left C P | Left MT | Bi-temporal mesial | NS | 72 (SDE) | Left: MP, SP | 1a | 24 | 23 | 2 | 21 | 11 | 2 | 9 |
| 16 | M | 3 | 3 | Multiple daily | Non-localizing | Negative | L posterior quadrant | Left T | Not done | FCD | 96 (SDE) | Left: LT, MT, IP, OL | 1a | 24 | 21 | 8 | 13 | 11 | 8 | 3 |
| 17 | M | 3 | 11 | Multiple daily | Right hemisphere | Left T P | Bi-frontalL > R | Left T P | Left P | Encephalomalacia | 72 + 30 | Left: IF, SMG | 1a | 40 | 14 | 5 | 9 | 14 | 5 | 9 |
| 18 | F | 2 | 3 | Multiple daily | Non-localizing | Multifocal | L anterior quadrant | Multifocal | Left T, Right F | TSC II | 120 (SDE) | Left: IF, OF | 1a | 24 | 10 | 8 | 2 | 10 | 8 | 2 |
| 19 | M | 3 | 4 | Daily to weekly | Left F | Left AC | Left F | Non-localizing | Right T | FCD | 56 + 10 | Left: MsF, AC | 3 | 24 | 29 | 12 | 17 | 26 | 12 | 14 |
| 20 | M | 4 | 11 | Daily to weekly | L hemisphere | Left T | Left FT | Left MT | Left MT | NS | 112 + 10 | Left: MT | 3 | 24 | 13 | 8 | 5 | 13 | 8 | 5 |
| 21 | M | 11 | 11 | Daily to weekly | Temporal | Left F T P | Left T | Not done | Non-lateralizing | Perinatal stroke + FCD | 136 (SDE) | Left: LT, MT | 2 | 37 | 6 | 4 | 2 | 6 | 4 | 2 |
| 22 | M | 17 | 22 | Weekly to monthly | L hemisphere | Left C P | Left F C | L hemisphere | Left MT | FCD | 88 + 30 | Left: LC | 1a | 24 | 7 | 1 | 6 | 4 | 1 | 3 |
| 23 | F | 11 | 12 | Daily to weekly | Non-localizing | Negative | Left F | Left F | Left FT | FCD | 70 (DE) | Left: OF, MF | 1a | 24 | 8 | 5 | 3 | 8 | 5 | 3 |
| 24 | M | 10 | 11 | Weekly to monthly | Left T | Left MT | Left T | Left T | Left T | FCD + HS | 92 (SDE) | Left: MT | 1a | 46 | 4 | 3 | 1 | 4 | 3 | 1 |
| 25 | M | 11 | 16 | Daily to weekly | Frontal | Negative | Left F | L inferior frontal | Left MT, Right F P O | FCD | 227 (DE) | Left: OI | 3 | 24 | 14 | 4 | 10 | 6 | 4 | 2 |
| 26 | F | 8 | 22 | Weekly to monthly | R hemisphere | Multifocal | Right F | Right T | Right T | NS | 120 (SDE) | Right: SF, MF | 2 | 24 | 3 | 2 | 1 | 3 | 2 | 1 |
| 27 | M | 1 | 9 | Daily to weekly | Left C P | Left F P | Left C P | Left SP, IP | Not done | Polymicrogyria | 64 + 60 | Left: SP, IP | 1b | 60 | 17 | 10 | 7 | 16 | 10 | 6 |
| 28 | F | 1 | 6 | Multiple daily | R hemisphere | Right: OI | Right F | Not done | Right OI | FCD | 72 + 40 | Right: IF, OI | 2 | 31 | 11 | 5 | 6 | 9 | 5 | 4 |
| 29 | M | 1 | 3 | Multiple daily | Right F | Right SF | Right F C P | Right F | Right F | FCD | 138 (SDE) | Right: SF, MF, MsF, OF | 3 | 24 | 16 | 6 | 10 | 7 | 6 | 1 |
| 30 | F | 12 | 15 | Multiple daily | Frontal | Negative | Left F T | Bi-temporalL > R | Not done | NS | 212 (DE) | Lerft: MF, OF | 2 | 27 | 12 | 1 | 11 | 8 | 1 | 7 |
| 31 | M | 18 | 20 | Daily to weekly | Non-localizing | Left MO | Left T | Left MO | Not done | FCD | 162 (DE) | Left: IP, MO | 1a | 24 | 39 | 12 | 27 | 32 | 12 | 20 |
| 32 | F | 1 | 7 | Weekly to monthly | Left T | Left MF, IF, OI | Left F T | Left OI, LT | Left T | FCD | 164 (DE) | Left: OI | 1a | 25 | 9 | 3 | 6 | 6 | 3 | 3 |
| 33 | M | 8 | 14 | Daily to weekly | Right F P | Right P | Right C | Right F P | Right P | FCD | 102 (DE) | Right: SP, IP | 1a | 24 | 15 | 7 | 8 | 14 | 7 | 7 |
| 34 | F | 15 | 18 | Daily to weekly | L hemisphere | Left F | Left F | Left F | Left F | FCD | 72 + 40 | Left: MF | 1a | 24 | 9 | 8 | 1 | 7 | 6 | 1 |
| 35 | M | 11 | 11 | Weekly to monthly | Left C | Left IF | Left MT | Non-localizing | Left IF | NS | 72 + 24 | Left: IF, LT | 1a | 24 | 8 | 7 | 1 | 8 | 7 | 1 |
| All. | 456 | 183 | 273 | 357 | 180 | 177 | ||||||||||||||
M: male, F: Female; L: left, R: right; MRI: Magnetic Resonance Imaging; LTM: LTM video EEG monitoring; FDG-PET = 18F-fluorodeoxyglucose positron emission tomography; SPECT = Single-Photon Emission Computed Tomography; ldEEG: low-density scalp EEG; icEEG: intracranial EEG; SDE = subdural electrodes; DE: depth electrodes; GOF = Goodness of Fit; FCD: focal cortical dysplasia; NS: non-specific changes; DNET: dysembrioplastic neuroepithelial tumor; HS: hippocampal sclerosis; TSC: tuberous sclerosis complex; F = frontal, T = temporal, C = central, P = parietal, O = occipital, FC = fronto-central; LT = lateral temporal, MT = mesial temporal, SF = superior frontal, MF = middle frontal, IF = inferior frontal, MsF = Mesial Frontal, LC = lateral central, SP = superior parietal, IF = inferior parietal, MP = mesial parietal, MO = mesial occipital, OI = opercoloinsular region, SMG = supramarginal gyrus.
3.2. Localization accuracy and precision of ldESI
A total of 183 scalp EEG seizures and 273 intracranial EEG seizures were analyzed for all patients (total = 456; Table 1). Among them, 180 scalp EEG seizures and 177 intracranial EEG seizures met the GOF and/or clustering selection criteria and were further analyzed (total = 357, Table 1). The number of seizures recorded was not associated with outcome (scalp EEG: p = 0.41; intracranial EEG: p = 0.85). The localization accuracy of ldESI-SOZ to ground-truth (Errloc) was 30.7 ± 17.5 mm. We found a localization precision to ground-truth of 6% for an accuracy below 10 mm, 20% for an accuracy below 15 mm, 41% for an accuracy below 25 mm, and 68% for an accuracy below 35 mm (Fig. 4A).
Fig. 4. Source localization results for Electric Source Imaging on Low-Density Scalp EEG (ldESI-SOZ).

A. Localization precision of ldESI-SOZ. B. Boxplot distributions of distance from resection (Dres) between non-seizure-free (NSF) and seizure-free (SF) patients comparing ldESI-SOZ results. We found significant differences in Dres based on surgical outcome. Circles denote values that are farther than 1.5 interquartile ranges. C. Boxplot distributions of resection percentage for ldESI-SOZ dipoles. We found that SF patients had resected significantly more SOZ dipoles compared to NSF patients. Circles denote mean resection percentage values for each patient. D. Receiver operating characteristic (ROC) curve analysis of the resection percentage of ldESI-SOZ dipoles for the prediction of outcome (black line). Non-parametric ROC curve (blue line) and 95% Confidence Interval (C.I.; dotted black lines) are shown. AUC = Area Under the Curve. E. Boxplot and violin plot distributions of ldESI-SOZ distance from resection (Dres) between SF and NSF patients derived from Equivalent Current Dipole (ECD) (red) and Standardized Low-Resolution Electromagnetic Tomography sLORETA (blue). Circles denote values that are farther than 1.5 interquartile ranges. No differences in Dres were found between ECD and sLORETA. For both techniques, we found significant differences in Dres based on surgical outcome. SOZ = seizure onset zone.
3.3. Resection and post-surgical outcome
We observed that ldESI-SOZ was closer to the resected volume in SF compared to NSF patients (Fig. 4B): Dres was 9.1 mm (5.6–22.5 mm) in SF patients and 24.2 mm (14.8–34 mm) in NSF patients (p = 0.004). Logistic regression showed that Dres of ldESI-SOZ dipoles predicts outcome (OR: 0.91; CI: 0.83–0.99; p = 0.04) without interaction between Dres and clinical covariates on outcome (Table 2): a shorter Dres was associated with better outcome (seizure-freedom). The resection percentage was higher in SF than NSF patients (61.5% [16.5–88.7%] vs. 16.5% [0–42.5%]; p = 0.04; Fig. 4C). ROC curve analysis showed that resection percentage of ldESI-SOZ predicted outcome (Fig. 4D) with a sensitivity of 57.1% (95% CI, 34–78.2%), a specificity of 85.7% (95% CI, 57.2–98.2%), and an accuracy of 68.6% (95% CI, 50.7–83.5%) (AUC = 0.71; 95% CI, 0.53–0.88%; p = 0.01) (Table 2).
Table 2.
Logistic regression and ROC curve analysis.
| Logistic Regression | ldESI-SOZ | ||
|---|---|---|---|
| Predictor of outcome | Adjusted Odds Ratio | 95% C.I. | p-value |
| Dres [mm] | 0.91 | 0.83–0.99 | 0.04 |
| Gender (female vs male) | 2.14 | 0.27–17.05 | 0.47 |
| Duration of epilepsy to surgery (years) | 0.96 | 0.79–1.16 | 0.7 |
| Seizure frequency (md vs dw) | 0.91 | 0.11–7.56 | 0.93 |
| Seizure frequency (md vs wm) | 3.73 | 0.24–57.29 | 0.34 |
| Resection volume (cm3) | 1.00 | 0.96–1.04 | 0.82 |
| MRI lesion (l vs nl) | 0.32 | 0.04–2.7 | 0.29 |
| Type of resection (T vs extraT) | 1.57 | 0.29–9.32 | 0.62 |
| ROC curve analysis | Resected* | Not Resected* |
|---|---|---|
| SF (%) | 12 (57) | 9 (43) |
| NSF (%) | 2 (14) | 12 (86) |
| AUC (95% C.I.) * | 0.71 | (0.53–0.88) |
| NPV (95% C.I.) | 57.1 | (34–92.5) |
| PPV (95% C.I.) | 85.7 | (57.2–94.2) |
| Specificity (95% C.I.) | 85.7 | (57.2–98.2) |
| Sensitivity (95% C.I.) | 57.1 | (34–78.2) |
| Accuracy (95% C.I.) | 68.6 | (50.7–83.5) |
| p-value | 0.01 |
Dres = Distance of ldESI-SOZ from surgical resection (mm); Md = multiple daily; dw = daily-weekly; wm = weekly-monthly;
T = temporal; extraT = extra-Temporal; l = lesional; nl = non-lesional; NPV = negative predictive value; PPV = positive predictive value;
C.I. = Confidence Interval; MRI = Magnetic Resonance Imaging; ROC = Receiver operating characteristic; SF = seizure-free;
NSF = non seizure-free; AUC = area under the curve; NPV = Negative Predictive Value; PPV = Positive Predictive Value.
Resected above optimal cut-off (60%).
3.4. Comparison of ECD with distributed source modelling
The mean distance of sLORETA solution from the corresponding source localization through ECD was 25.6 mm. We found no difference between the Dres derived from ECD model and sLORETA-SOZ for both NSF (p = 0.26) and SF (p = 0.11) patients (Fig. 4E). We also found that, similarly to ECDs, sLORETA-SOZ were closer to the resection in SF compared to NSF patients (Fig. 4E): Dres was 20.1 mm (11.3–25.5 mm) in SF patients and 38.6 mm (12.8–48.1 mm) in NSF patients (p = 0.04).
3.5. Additive value of ldESI-SOZ for intracranial coverage decision and surgical decision
The levels of concordance of each non-invasive technique with the intracranial coverage are summarized in Fig. 5A and listed in Supplementary Table 1. Cross-validated ROC curves showed that ldESI-SOZ presented the best classification performance among non-invasive localization techniques (PPV = 60%; NPV = 75%; Fig. 5B) and the highest AUC (AUC = 0.7; 95% CI, 0.69–0.72; p < 0.0001; see Table 3). The gain in prognostic accuracy given by the combination of ldESI-SOZ with other techniques is summarized in Table 3. The ordered logistic regression on the level of concordance (sublobar > lobar > partial > discordant) showed an association between outcome and level of concordance of ldESI-SOZ with the reference (OR: 2.2; 95% CI: 1.1–4.6; p = 0.03; Fig. 5C); this was not found for all the other techniques (Table 3).
Fig. 5. Added clinical value of Electric Source Imaging on Low-Density Scalp EEG (ldESI-SOZ) compared to other localization methods.

A. Frequency distribution of the level of concordance with the intracranial coverage decision (ICD) between different presurgical evaluations in seizure-free (SF) (left) and non-seizure-free (NSF) (right) patients. B. Receiver operating characteristic (ROC) curve analysis of every localization methods (sublobar concordance with ICD vs. outcome). Notice how the ldESI-SOZ presents the highest area under the curve (AUC = 0.7) among all the other localization techniques. C. Odds ratio and 95% confidence intervals for SF patients as defined by the sublobar concordance with the intracranial coverage area. By localization technique, the results indicate better prediction of good outcome for the ldESI-SOZ sublobar concordance with ICD (OR = 2.2). D. Frequency distribution of the level of concordance with surgical resection between different presurgical evaluations in SF (left) and NSF (right) patients. E. ROC curve analysis of every localization methods (sublobar concordance with surgical resection vs. surgical outcome). ldESI-SOZ presents the highest AUC (0.82) among all the other localization techniques and even compared to the standard clinical reading of seizure onset zone (SOZ) from intracranial electrodes (c-SOZ). F. Odds ratio and 95% confidence interval for SF patients as defined by the sublobar concordance with surgical resection. The results indicate significantly better prediction of good outcome for the ldESI-SOZ sublobar concordance with surgical resection (OR = 3.3). LTM EEG: long-term video EEG monitoring; MRI = Magnetic Resonance Imaging; PET = 18F-fluorodeoxyglucose positron emission tomography; SPECT = Single-Photon Emission Computed Tomography.
Table 3.
Additive value of electrical source imaging compared to other presurgical evaluations and clinical SOZ.
| Modality | AUC(95% C. I.)* | NPV (%) | PPV (%) | Specificity (%) | Sensitivity (%) | Accuracy (%) | p-value (ROC) | Adjusted Odds Ratio(95% C.I.) | p-value (regression) |
|---|---|---|---|---|---|---|---|---|---|
| Concordance with Intracranial Coverage Decision vs. Outcome | |||||||||
| MRI | 0.5 (0.47–0.52) | 43.7 | 63.1 | 50 | 57.1 | 54.3 | 0.7 | 1.2 (0.7–2.2) | 0.6 |
| PET† (n = 22) | 0.49 (0.47–0.52) | 47.6 | 71.4 | 71.4 | 47.6 | 57.1 | 0.31 | 1.1 (0.6–2.1) | 0.6 |
| SPECT† (n = 21) | 0.49 (0.48–0.50) | 40 | 60 | 71.4 | 28.6 | 45.7 | 1 | 1.1 (0.6–2) | 0.8 |
| LTM EEG | 0.49 (0.48–0.50) | 45.5 | 69.2 | 72.4 | 42.8 | 54.3 | 0.49 | 1.2 (0.5–2.5) | 0.7 |
| ldESI-SOZ | 0.7 (0.69–0.71) | 75 | 60 | 64.3 | 71.4 | 68.6 | 0.08 | 2.2 (1.1–4.6) | 0.03 |
| PET + ldESI-SOZ† (n = 22) | 0.72 (0.69–0.73) | 57.1 | 64.3 | 28.6 | 85.7 | 62.9 | <0.0001 (ldESI-SOZ vs. PET)‡ | ||
| SPECT + ldESI-SOZ† (n = 21) | 0.7 (0.69–0.71) | 50 | 62 | 21.4 | 85.7 | 60 | <0.0001 (ldESI-SOZ vs. SPECT)‡ | ||
| MRI + ldESI-SOZ | 0.69 (0.68–0.7) | 57.1 | 64.3 | 28.6 | 85.7 | 62.9 | <0.0001 (ldESI-SOZ vs. MRI)‡ | ||
| LTM EEG + ldESI-SOZ | 0.71 (0.7–0.71) | 57.1 | 64.3 | 28.6 | 85.7 | 62.9 | <0.0001 (ldESI-SOZ vs. LTM EEG)‡ | ||
Empirical ROC analysis and ordered logistic regression for “Concordance with surgery vs. surgical outcome”; LTM EEG: long-term video EEG monitoring; AUC: area under the curve; NPV: negative prefictive value;
PPV: positive predictive value; C.I.: confidence interval; MRI = Magnetic Resonance Imaging; FDG-PET = 18F-fluorodeoxyglucose positron emission tomography; SPECT = Single-Photon Emission Computed Tomography;
ldESI-SOZ = Seizure Onset Zone localized with Electric Source Imaging on Low-Density Scalp EEG.
Derived by SVM classification and leave-one-out cross validation, optimal threshold = sublobar concordance with the reference.
Patients with missing information were excluded from ROC curve and logistic regression analysis.
Wilocoxon rank sum test between cross-validated AUCs.
The levels of concordance of each different technique with the surgical decision are summarized in Fig. 5D and listed in Supplementary Table 1. Cross-validated ROC curves showed that sublobar concordance of ldESI-SOZ with resection presented the best classification performances in predicting outcome: ldESI-SOZ showed PPV of 91.7% and NPV of 56.5% (AUC = 0.82; 95% CI, 0.82–0.83; p = 0.01). Fig. 5E shows the ROC curves for all presurgical techniques. ldESI-SOZ presented the highest AUCs among other localization techniques (AUC = 0.82; 95% CI, 0.82–0.83; p < 0.0001; see Table 3). The gain in prognostic accuracy given by the combination of ldESI-SOZ with other techniques is summarized in Table 3. Logistic regression also showed significant OR for ldESI-SOZ (OR: 3.3; 95% CI: 1.5–7.2; p = 0.003) (Fig. 5F), but not for any of the other presurgical techniques (Table 3). The use of both subdural grids and depth electrodes for intracranial coverage was not associated with the sublobar concordance of ldESI-SOZ with the surgical resection (31.8% vs. 38.5%, p = 0.73; subdural grids or depth electrodes vs. both).
Finally, the sublobar concordance of ldESI-SOZ with the clinical reading of SOZ from intracranial electrodes also predicted seizure-freedom with a sensitivity of 76.2%, a specificity of 71.4%, and an accuracy of 74.3% (AUC = 0.79).
4. Discussion
This study shows that ESI performed on ictal recordings with the widely available low-density EEG can delineate the SOZ non-invasively with adequate precision and has the potential to predict the surgical outcome of children with refractory epilepsy undergoing surgery. This notion derives from our main findings showing that: (i) ldESI-SOZ has good concordance with the ground-truth SOZ (68% within 35 mm); (ii) ldESI-SOZ localizes the area to resect for achieving seizure freedom with ~10 mm accuracy; (iii) resection percentage of ldESI-SOZ predicts outcome; (iv) the concordance between the ldESI-SOZ and intracranial coverage predicts outcome; and (v) the concordance between ldESI-SOZ with the resection predicts outcome.
4.1. Localization accuracy of ldESI-SOZ
ESI requires adequate sampling and coverage of the electric field at the head surface in order to be sufficiently accurate (Song et al., 2015). Several previous studies highlighted the clinical value of ESI with high-density EEG in localizing the SOZ (Pellegrino et al., 2016; Nemtsas et al., 2017; Duez et al., 2019; Plummer et al., 2019; Sohrabpour et al., 2020). The International Federation of Clinical Neurophysiology recommends the use of the 10–10 system with 64–128 electrodes for source localization purposes also for pediatric cohorts (Seeck et al., 2017). This notion is supported by recent studies showing that ESI with high-density EEG can localize the SOZ with an error of ~7 mm (Sohrabpour et al., 2020). Yet, the possibility to localize the SOZ with simple source localization methods, such as the ECD, and low-cost neuroimaging techniques (i.e. scalp low-density EEG with ≤ 20 channels and no co-registration between patient’s head anatomy and sensor’s location) would offer a significant diagnostic boost for all epilepsy centers that lack access to advanced neurophysiological methods.
Previous studies demonstrated that low-density scalp EEG can localize spikes accurately and facilitate presurgical evaluation (van Mierlo et al., 2017; Sharma et al., 2018; Tamilia et al., 2019). Unlike spikes, seizures represent an arduous challenge for source imaging mainly due to their low signal-to-noise ratio and high temporal dynamics (ictal activity propagates rapidly). Despite these challenges, the potential clinical value of ldESI on ictal patterns has recently gained ground (Beniczky et al., 2013; Staljanssens et al., 2017; Sharma et al., 2018; Foged et al., 2020). Among others, Sharma et al., showed that ictal ESI using low-density scalp EEG has high feasibility and its localization accuracy is similar to conventional neuroimaging methods (i.e. MRI, PET and SPECT) (Sharma et al., 2018). Similarly, Foged et al. (2020), suggested that ldESI-SOZ can provide non-redundant information in one third of patients undergoing presurgical evaluation. Yet, there is a lack of knowledge concerning the clinical utility of ldESI to quantitatively delineate the SOZ margins in children. Our study shows for the first time that a well-established and widely used technology (i.e. low-density scalp EEG), which is available in every epilepsy center, can provide comparable findings with more advanced and costly methods that require well-trained personnel and tedious experimental procedures, which are often unsuitable for pediatric use. We present here solid evidence that ESI with low-density EEG can achieve an accuracy of ~30 mm in localizing the SOZ for pediatric patients with refractory epilepsy. Considering the mean width of the parahippocampal gyrus as 11–21 mm (Ono et al., 1990), we can assume that ldESI-SOZ grants a localization precision of ~2 times a gyral width, which is within the two most proximal gyri. Such a precision highlights the capacity of ldESI-SOZ to localize primary epileptic foci with sufficient accuracy for guiding the placement of intracranial recordings. These findings indicate that simple source localization techniques, such as the ECD, and low-cost neuroimaging methods (i.e. low-density EEG) can provide useful clinical information regarding the localization of the epileptogenic zone during the presurgical evaluation of children undergoing epilepsy surgery.
4.2. Resecting the SOZ localized via low-density scalp EEG predicts seizure freedom
Electric source imaging is currently performed in few epilepsy centers (Mouthaan et al., 2016). Two perceived barriers are preventing its use on a larger scale: skepticism from epileptologists regarding its usefulness and apprehension regarding its practical implementation in clinical setting. Only recently, few prospective studies challenged this notion by showing that ldESI can provide additional non-redundant information in the presurgical evaluation of patients with epilepsy (Sharma et al., 2018; Foged et al., 2020). Our findings show that electric source imaging performed with ldEEG can localize the SOZ with sufficient accuracy in order to guide the placement of intracranial EEG leads. Yet, this does not help to determine the predictive value of ldEEG for each individual patient. To address this challenge, we first tested whether electric source imaging can localize epileptic generators, whose vicinity to resection may help in assessing the patient’s prognosis. We found an association between ldESI-SOZ resection and outcome: the closer the ldESI-SOZ source locations were to resection, the better was the outcome (OR: 0.91), regardless form other clinical confounding variables. Secondly, we found that resection of at least 60% of the scalp dipoles allowed the prediction of good outcome with a sensitivity of 57.1% (95% CI, 34–78.2%), a specificity of 85.7% (95% CI, 57.2–98.2%) and an accuracy of 68.6% (95%CI, 50.7–83.5%). This finding highlights the reliability of ldESI-SOZ to non-invasively localize the epileptogenic zone with high precision, while preserving its predictive value in terms of outcome.
Our main findings are further supported by results from a recent meta-analysis which analyzed 25 ESI studies, of which six were ictal-ESI studies (Sharma et al., 2019). They found an overall accuracy of the source imaging methods varying between 50 and 74.84%, which is very close to the accuracy of ldESI-SOZ reported in the present study (68.6%; 95% CI, 50.7–83.5%). These results contribute to the translation of ldESI-SOZ as prognostic biomarker of the epileptogenic zone for guiding surgery and highlight its predictive value in terms of outcome.
4.3. Comparison of ECD with sLORETA
ECD is limited to localize multiple epileptic generators overlapping in time. Distributed source localization methods, such as sLORETA, may be superior alternatives in these scenarios (Iwasaki et al., 2002). We found here comparable results in the localization performance of ldESI-SOZ with ECD and sLORETA (Fig. 4E). Our findings are in line with previous studies showing similar localization performance for the irritative zone between ECD and distributed methods (dMSI and dSPM) (Tamilia et al., 2019; Pellegrino et al., 2018), and a large body of literature indicating that distributed source imaging methods are not necessarily superior to ECD, despite their high complexity level, but rather complementary (Plummer et al., 2010; Kovac et al., 2014; Beniczky et al., 2016). In our cohort, we observed a mean distance of 25.6 mm between sLORETA-SOZ and ECD. The two source imaging solutions yet presented a similar distance from resection: this notion suggests that ECD and sLORETA may point out at different proximal areas, which however present similar spatial relationship to the resection, indicating that the presurgical information provided by these techniques is comparable. Our findings further strengthen our hypothesis that ldESI-SOZ can predict each patient’s surgical outcome and provide critical clinical information in guiding the placement of intracranial implantation in children with refractory epilepsy undergoing surgery. This is independent of whether the ECD or a distributed source localization method (i.e. sLORETA) would be used for the ESI.
4.4. ldESI-SOZ guides intracranial implantation and surgical planning
We found an association between ldESI-SOZ concordance with intracranial EEG implantation and seizure freedom (OR: 2.2), in contrast to other localization techniques, which showed non-significant results (Fig. 5C). Moreover, as hypothesized, combining ldESI-SOZ with other localization techniques resulted in more accurate prognostic prediction; results from leave-one-out cross validation also suggest the superiority of ldESI-SOZ compared to other techniques. This finding highlights the additive value of ldESI-SOZ compared to the standard presurgical diagnostic workup performed in most epilepsy centers. Such additional information may have expanded or modified the zones to consider for intracranial sampling in NSF patients.
We also found that ldESI offers additive information about resection planning with respect to other presurgical evaluation techniques. This is in line with a recent study showing that ldESI-SOZ can provide non-redundant information in one third of surgical patients with refractory epilepsy (Foged et al., 2020). In particular, logistic regression showed that only ldESI-SOZ was predictive of patient’s outcome compared to the other evaluation techniques. Interestingly, the concordance of the SOZ clinical reading (which was actually used to guide surgery) with the resection was not predictive of outcome, unlike ldESI-SOZ; this further highlights the additional value of the proposed methodology with respect to clinical standard. Finally, we found that the sublobar concordance of ldESI-SOZ with the clinical reading of SOZ from intracranial electrodes also predicted seizure-freedom with high accuracy (74.3%). This notion further confirms that ldESI-SOZ may provide additional pieces of information in guiding the clinical delineation of the SOZ.
4.5. Limitations
The first limitation of our study is the non-randomized, retrospective nature of the study’s design: although we could establish the statistical relationship between ESI results and seizure outcome in retrospection, we were not able to directly evaluate the effect that ESI had on resection planning, and thus, on seizure outcome. Future prospective studies will reveal whether ldESI-SOZ will effectively improve the surgical management of children undergoing epilepsy surgery. Only patients who underwent intracranial EEG at our center and who had seizures with focal onset were included. This introduces a selection bias, since seizures with generalized discharges, electrodecremental pattern, or obscured by the presence of extensive artifacts were ultimately excluded. Furthermore, our eligible patients may represent another possible bias, since we excluded patients who had a one-stage resection without invasive long-term monitoring. Although possibly biased, our sample includes those cases where non-invasive tests did not provide enough information to plan surgery and that would possibly benefit the most from an additional analytical approach, as we propose in our study. Moreover, scalp EEG and intracranial EEG seizures were recorded during separate long-term monitoring sessions, which may have affected the localization accuracy estimation of ldESI-SOZ. Moreover, we employed a boundary elementary method for the forward model estimation; more detailed models (i.e. finite element models) may potentially achieve more precise localization results (Birot et al., 2014). ESI still presents technical challenges that may hamper clinical implementation as many epilepsy centers lack the necessary expertise to perform pre- and post-processing of ictal data. Fully automated source imaging methods may potentially minimize these technical obstacles (Baroumand et al., 2018; Koren et al., 2018; Vespa et al., 2020).
4.6. Conclusion
This study shows that non-invasive ESI performed on ictal recordings with low-density EEG can facilitate the estimation of the seizure onset zone and offer additive information on the placement of intracranial EEG electrodes and the margins of resection in children with refractory epilepsy undergoing epilepsy surgery. The resection of the seizure onset zone localized non-invasively with low-density scalp EEG is predictive of seizure freedom after epilepsy surgery. The use of ictal source imaging to interpret long-term EEG monitoring may offer a boost in the diagnostic armamentarium of several epilepsy centers who lack more advanced localization techniques (i.e. MEG or high-density EEG). Such an application may eventually increase the number of patients who are referred for epilepsy surgery and possibly improve their outcome.
Supplementary Material
HIGHLIGHTS.
Electric source imaging with low-density scalp EEG can approximate the seizure onset zone location in children with epilepsy.
Electric source imaging with low-density scalp EEG can offer additive information about intracranial EEG placement and resection margins.
Resection of the seizure onset zone localized non-invasively with low-density scalp EEG can predict outcome in children with epilepsy.
Acknowledgments
This study was supported by the National Institute of Neurological Disorders & Stroke (RO1NS104116-01A1, PI: C. Papadelis; and R21NS101373-01A1, PIs: C. Papadelis and S. Stufflebeam), the American Epilepsy Society Junior Investigator Research Award (PI: Papadelis; 2015) and the Faculty Career Development Award from Harvard Medical School (PI: Papadelis; 2014).
Abbreviations:
- AUC
Area Under the Curve
- CI
Confidence Interval
- CT
Computerized Tomography
- ESI
Electric Source Imaging
- ldESI
Electric Source Imaging on Low-Density Scalp EEG
- ldESI-SOZ
Seizure Onset Zone localized with Electric Source Imaging on Low-Density Scalp EEG
- ECD
Equivalent Current Dipole
- FDG-PET
18F-fluorodeoxyglucose positron emission tomography
- FP
false positives
- FN
false negatives
- ICD
intracranial coverage decision
- icESI-SOZ
Seizure Onset Zone localized with Electric Source Imaging on Intracranial EEG
- MEG
Magnetoencephalography
- NPV
Negative Predictive Value
- NSF
Non Seizure-Free
- OR
Odds Ratio
- PPV
Positive Predictive Value
- ROC
Receiver Operating Characteristic
- SF
Seizure-Free
- SOZ
Seizure Onset Zone
- sLORETA
Standardized Low Resolution Electromagnetic Tomography
- sLORETA-SOZ
Seizure Onset Zone localized with sLORETA Electric Source Imaging
- SPECT
Single-Photon Emission Computed Tomography
- SVM
Support Vector Machine
- TN
True Negatives
- TP
True Positives
Footnotes
Conflict of interest
None of the authors have potential conflict of interest to be disclosed. We confirm that we have read the Journal’s position on issues involved in ethical publication and affirm that this report is consistent with those guidelines.
Ethical Publication Statement
All the authors confirm that they have read the journal’s position on issues involved in ethical publication and affirm that this report is consistent with those guidelines.
Appendix A. Supplementary data
Supplementary data to this article can be found online at https://doi.org/10.1016/j.clinph.2021.03.043.
References
- Agirre-Arrizubieta Z, Huiskamp GJM, Ferrier CH, Van Huffelen AC, Leijten FSS. Interictal magnetoencephalography and the irritative zone in the electrocorticogram. Brain 2009;132(11):3060–71. [DOI] [PubMed] [Google Scholar]
- Alhilani M, Tamilia E, Ricci L, Ricci L, Grant PE, Madsen JR, et al. Ictal and interictal source imaging on intracranial EEG predicts epilepsy surgery outcome in children with focal cortical dysplasia. Clin Neurophysiol 2020;131(3):734–43. [DOI] [PMC free article] [PubMed] [Google Scholar]
- Almubarak S, Alexopoulos A, Von-Podewils F, Wang ZI, Kakisaka Y, Mosher JC, et al. The correlation of magnetoencephalography to intracranial EEG in localizing the epileptogenic zone: a study of the surgical resection outcome. Epilepsy Res 2014;108(9):1581–90. [DOI] [PubMed] [Google Scholar]
- Baroumand AG, van Mierlo P, Strobbe G, Pinborg LH, Fabricius M, Rubboli G, et al. Automated EEG source imaging: A retrospective, blinded clinical validation study. Clin Neurophysiol 2018;129(11):2403–10. [DOI] [PubMed] [Google Scholar]
- Barth DS, Sutherling W, Engel J, Beatty J. Neuromagnetic localization of epileptiform spike activity in the human brain. Science 1982;218(4575):891–4. [DOI] [PubMed] [Google Scholar]
- Beniczky S, Lantz G, Rosenzweig I, Åkeson P, Pedersen B, Pinborg LH, et al. Source localization of rhythmic ictal EEG activity: a study of diagnostic accuracy following STARD criteria. Epilepsia 2013;54(10):1743–52. [DOI] [PubMed] [Google Scholar]
- Beniczky S, Rosenzweig I, Scherg M, Jordanov T, Lanfer B, Lantz G, et al. Ictal EEG source imaging in presurgical evaluation: high agreement between analysis methods. Seizure 2016;43:1–5. [DOI] [PMC free article] [PubMed] [Google Scholar]
- Birot G, Spinelli L, Vulliémoz S, Mégevand P, Brunet D, Seeck M, et al. Head model and electrical source imaging: a study of 38 epileptic patients. NeuroImage Clin 2014;5:77–83. [DOI] [PMC free article] [PubMed] [Google Scholar]
- Chu CJ. High density EEG—What do we have to lose?. Clin Neurophysiol 2015;126(3):433. [DOI] [PMC free article] [PubMed] [Google Scholar]
- Cossu M, Cardinale F, Castana L, Citterio A, Francione S, Tassi L, et al. Stereoelectroencephalography in the presurgical evaluation of focal epilepsy: a retrospective analysis of 215 procedures. Neurosurgery 2005;57(4):706–18. [PubMed] [Google Scholar]
- Dale AM, Fischl B, Sereno MI. Cortical surface-based analysis: I. Segmentation and surface reconstruction. Neuroimage 1999;9(2):179–94. [DOI] [PubMed] [Google Scholar]
- DeLong ER, DeLong DM, Clarke-Pearson DL. Comparing the areas under two or more correlated receiver operating characteristic curves: a nonparametric approach. Biometrics 1988:837–45. [PubMed] [Google Scholar]
- Duez L, Tankisi H, Hansen PO, Sidenius P, Sabers A, Pinborg LH, et al. Electromagnetic source imaging in presurgical workup of patients with epilepsy: A prospective study. Neurology 2019;92(6):e576–86. [DOI] [PMC free article] [PubMed] [Google Scholar]
- Engel J Jr Intracerebral recordings: organization of the human epileptogenic region. J Clin Neurophysiol 1993a;10(1):90–8. [DOI] [PubMed] [Google Scholar]
- Engel J Jr Outcome with respect to epileptic seizures. Surgical Treatment of the. Epilepsies 1993:609–21. [Google Scholar]
- Foged MT, Martens T, Pinborg LH, Hamrouni N, Litman M, Rubboli G, et al. Diagnostic added value of electrical source imaging in presurgical evaluation of patients with epilepsy: A prospective study. Clin Neurophysiol 2020;131(1):324–9. 10.1016/j.clinph.2019.07.031. [DOI] [PubMed] [Google Scholar]
- Fujiwara H, Greiner HM, Hemasilpin N, Lee KH, Holland-Bouley K, Arthur T, et al. Ictal MEG onset source localization compared to intracranial EEG and outcome: improved epilepsy presurgical evaluation in pediatrics. Epilepsy Res 2012;99(3):214–24. [DOI] [PMC free article] [PubMed] [Google Scholar]
- Gotman J, Levtova V, Farine B. Graphic representation of the EEG during epileptic seizures. Electroencephalogr Clin Neurophysiol 1993;87(4):206–14. [DOI] [PubMed] [Google Scholar]
- Gramfort A, Papadopoulo T, Olivi E, Clerc M. OpenMEEG: opensource software for quasistatic bioelectromagnetics. Biomed Eng Online 2010;9(1):45. [DOI] [PMC free article] [PubMed] [Google Scholar]
- Hämäläinen M, Hari R, Ilmoniemi RJ, Knuutila J, Lounasmaa OV. Magnetoencephalography—theory, instrumentation, and applications to noninvasive studies of the working human brain. Rev Mod Phys 1993;65(2):413. [Google Scholar]
- Holmes CJ, Hoge R, Collins L, Woods R, Toga AW, Evans AC. Enhancement of MR images using registration for signal averaging. J Comput Assist Tomogr 1998;22(2):324–33. [DOI] [PubMed] [Google Scholar]
- Iwasaki M, Nakasato N, Shamoto H, Nagamatsu K, Kanno A, Hatanaka K, et al. Surgical implications of neuromagnetic spike localization in temporal lobe epilepsy. Epilepsia 2002;43(4):415–24. [DOI] [PubMed] [Google Scholar]
- Knowlton RC, Laxer KD, Aminoff MJ, Roberts TP, Wong ST, Rowley HA. Magnetoencephalography in partial epilepsy: clinical yield and localization accuracy. Ann Neurol 1997;42(4):622–31. [DOI] [PubMed] [Google Scholar]
- Koren J, Gritsch G, Pirker S, Herta J, Perko H, Kluge T, et al. Automatic ictal onset source localization in presurgical epilepsy evaluation. Clin Neurophysiol 2018;129(6):1291–9. [DOI] [PubMed] [Google Scholar]
- Kovac S, Chaudhary UJ, Rodionov R, Mantoan L, Scott CA, Lemieux L, et al. Ictal EEG source imaging in frontal lobe epilepsy leads to improved lateralization compared with visual analysis. J Clin Neurophysiol 2014;31(1):10–20. [DOI] [PubMed] [Google Scholar]
- Lüders HO, Najm I, Nair D, Widdess-Walsh P, Bingman W. The epileptogenic zone: general principles. Epileptic Disord. 2006;8(2):1–9. [PubMed] [Google Scholar]
- van Mierlo P, Strobbe G, Keereman V, Birot G, Gadeyne S, Gschwind M, et al. Automated long-term EEG analysis to localize the epileptogenic zone. Epilepsia Open 2017;2(3):322–33. [DOI] [PMC free article] [PubMed] [Google Scholar]
- Mouthaan BE, Rados M, Barsi P, Boon P, Carmichael DW, Carrette E, et al. Current use of imaging and electromagnetic source localization procedures in epilepsy surgery centers across Europe. Epilepsia 2016;57(5):770–6. [DOI] [PubMed] [Google Scholar]
- Nemtsas P, Birot G, Pittau F, Michel CM, Schaller K, Vulliemoz S, et al. Source localization of ictal epileptic activity based on high-density scalp EEG data. Epilepsia 2017;58(6):1027–36. [DOI] [PubMed] [Google Scholar]
- Ono M, Kubik S, Abernathey CD. Atlas of the cerebral sulci. New York: Thieme Medical Publishers Inc; 1990. [Google Scholar]
- Pascual-Marqui RD, Michel CM, Lehmann D. Low resolution electromagnetic tomography: a new method for localizing electrical activity in the brain. Int J Psychophysiol 1994;18(1):49–65. [DOI] [PubMed] [Google Scholar]
- Pellegrino G, Hedrich T, Chowdhury R, Hall JA, Lina JM, Dubeau F, et al. Source localization of the seizure onset zone from ictal EEG/MEG data. Hum Brain Mapp 2016;37(7):2528–46. [DOI] [PMC free article] [PubMed] [Google Scholar]
- Pellegrino G, Hedrich T, Chowdhury RA, Hall JA, Dubeau F, Lina J, et al. Clinical yield of magnetoencephalography distributed source imaging in epilepsy: A comparison with equivalent current dipole method. Hum Brain Mapp 2018;39(1):218–31. [DOI] [PMC free article] [PubMed] [Google Scholar]
- Plummer C, Vogrin SJ, Woods WP, Murphy MA, Cook MJ, Liley DTJ. Interictal and ictal source localization for epilepsy surgery using high-density EEG with MEG: a prospective long-term study. Brain 2019;142(4):932–51. [DOI] [PMC free article] [PubMed] [Google Scholar]
- Plummer C, Wagner M, Fuchs M, Harvey AS, Cook MJ. Dipole versus distributed EEG source localization for single versus averaged spikes in focal epilepsy. J Clin Neurophysiol 2010;27(3):141–62. [DOI] [PubMed] [Google Scholar]
- Prabhu S, Mahomed N. Imaging of intractable paediatric epilepsy. SA J Radiol 2015;19(2). [Google Scholar]
- Rikir E, Koessler L, Gavaret M, Bartolomei F, Colnat-Coulbois S, Vignal J, et al. Electrical source imaging in cortical malformation–related epilepsy: A prospective EEG-SEEG concordance study. Epilepsia 2014;55(6):918–32. [DOI] [PubMed] [Google Scholar]
- Rosenow F, Lüders H. Presurgical evaluation of epilepsy. Brain 2001;124 (9):1683–700. [DOI] [PubMed] [Google Scholar]
- Russo A, Jayakar P, Lallas M, Miller I, Hyslop A, Korman B, et al. The diagnostic utility of 3D electroencephalography source imaging in pediatric epilepsy surgery. Epilepsia 2016;57(1):24–31. [DOI] [PubMed] [Google Scholar]
- Ryvlin P, Cross JH, Rheims S. Epilepsy surgery in children and adults. Lancet Neurol 2014;13(11):1114–26. [DOI] [PubMed] [Google Scholar]
- Seeck M, Koessler L, Bast T, Leijten F, Michel C, Baumgartner C, et al. The standardized EEG electrode array of the IFCN. Clin Neurophysiol 2017;128(10):2070–7. [DOI] [PubMed] [Google Scholar]
- Sharma P, Scherg M, Pinborg LH, Fabricius M, Rubboli G, Pedersen B, et al. Ictal and interictal electric source imaging in pre-surgical evaluation: a prospective study. Eur J Neurol 2018;25(9):1154–60. [DOI] [PubMed] [Google Scholar]
- Sharma P, Seeck M, Beniczky S. Accuracy of Interictal and Ictal Electric and Magnetic Source Imaging: A Systematic Review and Meta-Analysis. Front Neurol 2019;10:1250. 10.3389/fneur.2019.01250. [DOI] [PMC free article] [PubMed] [Google Scholar]
- Sohrabpour A, Cai Z, Ye S, Brinkmann B, Worrell G, He B. Noninvasive electromagnetic source imaging of spatiotemporally distributed epileptogenic brain sources. Nat Commun 2020;11(1):1–15. [DOI] [PMC free article] [PubMed] [Google Scholar]
- Song J, Davey C, Poulsen C, Luu P, Turovets S, Anderson E, et al. EEG source localization: sensor density and head surface coverage. J Neurosci Methods 2015;256:9–21. [DOI] [PubMed] [Google Scholar]
- Staljanssens W, Strobbe G, Van Holen R, Keereman V, Gadeyne S, Carrette E, et al. EEG source connectivity to localize the seizure onset zone in patients with drug resistant epilepsy. NeuroImage Clin 2017;16:689–98. [DOI] [PMC free article] [PubMed] [Google Scholar]
- Stefan H, Hummel C, Scheler G, Genow A, Druschky K, Tilz C, et al. Magnetic brain source imaging of focal epileptic activity: a synopsis of 455 cases. Brain 2003;126(11):2396–405. [DOI] [PubMed] [Google Scholar]
- Tadel F, Baillet S, Mosher JC, Pantazis D, Leahy RM. Brainstorm: a user-friendly application for MEG/EEG analysis. Comput Intell Neurosci 2011;2011:8. [DOI] [PMC free article] [PubMed] [Google Scholar]
- Tamilia E, AlHilani M, Tanaka N, Tsuboyama M, Peters JM, Grant PE, et al. Assessing the localization accuracy and clinical utility of electric and magnetic source imaging in children with epilepsy. Clin Neurophysiol 2019;130(4):491–504. 10.1016/j.clinph.2019.01.009. [DOI] [PMC free article] [PubMed] [Google Scholar]
- Tamilia E, Dirodi M, Alhilani M, Grant PE, Madsen JR, Stufflebeam SM, et al. Scalp ripples as prognostic biomarkers of epileptogenicity in pediatric surgery. Ann Clin Transl Neurol 2020;7(3):329–42. 10.1002/acn3.50994. [DOI] [PMC free article] [PubMed] [Google Scholar]
- Tamilia E, Park EH, Percivati S, Bolton J, Taffoni F, Peters JM, et al. Surgical resection of ripple onset predicts outcome in pediatric epilepsy. Ann Neurol 2018;84(3):331–46. [DOI] [PubMed] [Google Scholar]
- Téllez-Zenteno JF, Dhar R, Wiebe S. Long-term seizure outcomes following epilepsy surgery: a systematic review and meta-analysis. Brain 2005;128(5):1188–98. [DOI] [PubMed] [Google Scholar]
- Verma A, Radtke R. EEG of partial seizures. J Clin Neurophysiol 2006;23(4):333–9. [DOI] [PubMed] [Google Scholar]
- Vespa S, Baroumand AG, Santos SF, Vrielynck P, de Tourtchaninoff M, Feys O, et al. Ictal EEG source imaging and connectivity to localize the seizure onset zone in extratemporal lobe epilepsy. Seizure 2020;78:18–30. [DOI] [PubMed] [Google Scholar]
- Zhdanov A, Atluri S, Wong W, Vaghei Y, Daskalakis ZJ, Blumberger DM, et al. Use of Machine Learning for Predicting Escitalopram Treatment Outcome From Electroencephalography Recordings in Adult Patients With Depression. JAMA Netw Open 2020;3(1). e1918377–e1918377. [DOI] [PMC free article] [PubMed] [Google Scholar]
Associated Data
This section collects any data citations, data availability statements, or supplementary materials included in this article.