

ABSTRACT
Importance
The prevalence and characteristics of short stature (SS) among children in China should be assessed to provide guidance for planning and implementation of nationwide public health policies. Thus far, there have been no accurate estimates of the prevalence of SS in China.
Objective
To analyze the prevalence of SS among children in China and to explore the influences of sex, area, age, study year, and study site on prevalence rates.
Methods
Relevant literature was identified by searching the following databases: PubMed, Embase, The Cochrane Library, Chinese Biomedical Literature, China Knowledge Resource Integrated, WeiPu, and WanFang databases. Meta‐analysis was carried out using STATA 11.2.
Results
This meta‐analysis included 39 studies with 348 326 Chinese participants; the studies covered 20 provinces, municipalities, and autonomous regions. The pooled prevalence of SS was 3.2% (95% confidence interval [CI], 2.6%–3.7%; I 2 = 99.8%). The prevalence of SS in boys and girls were 3.1% (95% CI, 2.5%–3.7%) and 3.2% (95% CI, 2.6%–3.9%), respectively. The sex difference was not statistically significant (P > 0.05). The prevalence of SS was higher in rural areas than in urban areas (4.7% [95% CI, 3.6%–5.8%] vs. 2.8% [95% CI, 2.2%–3.4%]; P < 0.001). The prevalence of SS was higher in West China (5.2%; 95% CI, 4.4%–6.0%) than in Northeast China (0.6%; 95% CI, 0.3%–0.8%), East China (2.3%; 95% CI, 1.9%–2.8%), or Central China (2.9%; 95% CI, 1.9%–3.9%).
Interpretation
The prevalence of SS among children was higher in western and rural areas of China. Close attention to children’s growth and development is needed to prevent the occurrence of SS.
Keywords: Prevalence, Short stature, Meta‐analysis, China
INTRODUCTION
Short stature (SS) is individual height that is <2 standard deviations below (or below the third percentile of) the average height among children with the same ethnicity, age, and sex under similar living conditions. 1 , 2 Individual height is affected by genetic and environmental factors such as nutrition, disease, and physiology. Hormonal therapy, nutritional regulation, and reasonable exercise can promote height growth before epiphyseal closure. Many studies have shown that children with SS lack confidence and have different degrees of adjustment disorder, cognitive disorders, and self‐consciousness disturbance. Moreover, treatment for SS is both extensive and expensive, constituting an economic burden for families and society. 3 , 4 , 5
Numerous investigations of stature characteristics have been performed at different sites and areas of China. These investigations showed that in 2018, the total rate of SS among children ages 6–23 months in the middle region of China (i.e., Anhui, Henan, Hubei, Hunan, Jiangxi, and Shanxi Provinces) was 5.9%. 6 Wang et al 1 found that the average detection rate of SS in primary and middle school students was 3.16% in Anhui province in 2015. A recent investigation of 213 795 Han school children from 30 provinces/municipalities/autonomous regions showed that the prevalence of SS was 3.70% of children aged 7–18 years in China. 7 To the best of our knowledge, there has been no systematic review of the stature characteristics of children in China; no exact statistical data are available regarding the prevalence of SS in these children. Here, we performed a systematic review and meta‐analysis of published literature regarding SS among children in China. Specifically, we explored the prevalence with respect to various characteristics including sex, area, age, study time, and study site in subgroup analyses.
METHODS
Search strategy
The literature search process is shown in Figure 1. Two investigators (Qianlong Zhao and Junyi Chen) independently searched the literature using the following databases: PubMed, Embase, Cochrane Library, Chinese Biomedical Literature, China Knowledge Resource Integrated, WeiPu, and WanFang databases; databases were searched from inception until February 2019. Search terms included “short stature”, “stunting”, “growth retardation”, “incidence”, “prevalence”, “epidemiology”, and “China”. The literature search included original articles, review articles, and meta‐analyses. Literature search strategy was shown in Figure S1.
FIGURE 1.
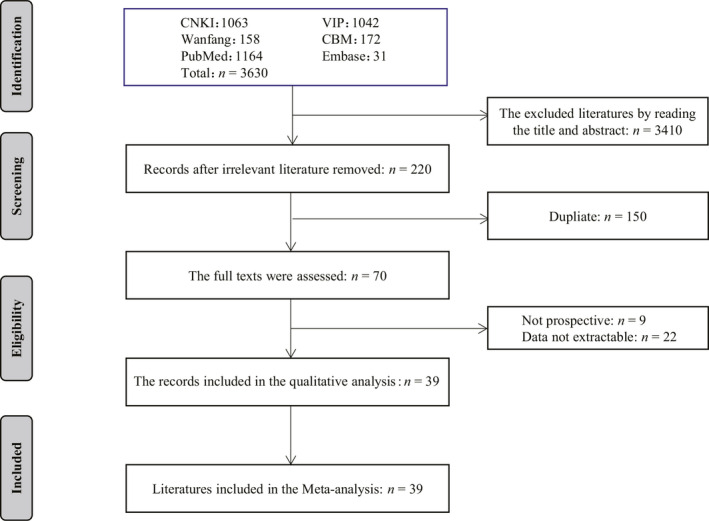
Flow diagram for the included studies in this meta‐analysis.
Inclusion and exclusion criteria
Articles were included if they met the following criteria: 1) they described a cross‐sectional survey conducted in China (only baseline data were extracted); 2) participants were <18 years of age; 3) the diagnosis of SS was established in accordance with the guidelines of the genetic metabolic endocrine group of pediatrics branch in Chinese Medical Association, 2 such that one of the following conditions was met: i) height < 2 standard deviations of average height for children of the same ethnicity, sex, and age; ii) height below the third percentile of average height (−1.88 standard deviations) for children of the same ethnicity, sex, and age; iii) bone age less than chronological age by > 2 years; iv) height growth rate below the 25th percentile based on bone age (annual growth rate of 4.5‐year‐old children to adolescent children ≥ 5 cm; annual growth rate of adolescent children ≥ 6 cm).
Data collection and extraction
After removal of duplicate references, two investigators (Fulun Li and Ke Liu) independently screened the titles and abstracts of all records to identify articles that met the inclusion criteria. Any disagreements were resolved by consensus or by consultation with a senior researcher (Jing Yang). We used a predefined form to extract relevant characteristics of included literature such as title, the first author, study year, sample size, and age and sex of participants.
Quality assessment
The methodological quality of the included literature was evaluated using the Joanna Briggs Institute Prevalence Critical Appraisal Tool (Table 1), 8 which incorporates 10 domains. A study was considered to be of low quality if 0–5 criteria were met, whereas it was considered to be of high quality if 5–10 criteria were met. Two reviewers (Fulun Li and Ke Liu) independently assessed methodological quality. Disagreements were resolved by consultation with a senior researcher (Jing Yang).
TABLE 1.
Characteristics of the included studies
| Study year | First author | Reference number | Events | Sample size | Age range (year) | Region | Sampling methods | Diagnostic criteria | Quality appraisal |
|---|---|---|---|---|---|---|---|---|---|
| 2014 | Wang Q | 1 | 380 | 12 009 | 7–18 | Central of China | Stratified random cluster sampling | <2SD or <P3rd | 9 |
| 2014 | Yang X | 10 | 26 662 | 581 016 | 0–5 | West of China | Cluster sampling | <2SD | 9 |
| 2014 | Chen XJ | 11 | 172 | 6082 | 7–12 | Central of China | Stratified cluster sampling | <2SD or <P3rd | 9 |
| 2015 | Wang LF | 12 | 735 | 63 049 | 3–14 | East of China | Cluster sampling | <2SD | 10 |
| 2012 | Cao LF | 13 | 301 | 4930 | 6–11 | East of China | Random cluster sampling | <2SD or <P3rd | 9 |
| 2000 | Chen AY | 14 | 75 | 7455 | 6–12 | East of China | Cluster sampling | <2SD or <P3rd | 8 |
| 2003 | Cheng RQ | 15 | 2658 | 70 431 | 6–18 | East of China | Cluster sampling | <2SD | 10 |
| 2012 | Dou YR | 16 | 3325 | 54 743 | 6–18 | West of China | Stratified cluster sampling | <2SD | 10 |
| 2010 | Fu DL | 17 | 107 | 5374 | 6–13 | East of China | Cluster sampling | <2SD | 9 |
| 2000 | Liu HJ | 18 | 99 | 15 479 | 7–13 | East of China | Random cluster sampling | <2SD | 9 |
| 2013 | Li SL | 19 | 770 | 8043 | 7–13 | West of China | Cluster sampling | <2SD or <P3rd | 7 |
| 2014 | Liu SS | 20 | 287 | 9095 | 6–16 | East of China | Random cluster sampling | <2SD or <P3rd | 10 |
| 2014 | Liu Y | 21 | 94 | 3593 | 7–18 | Central of China | Stratified random cluster sampling | <P3rd | 9 |
| 2000 | Lou XM | 22 | 104 | 3240 | 12–16 | Central of China | Cluster sampling | <2SD | 8 |
| 2014 | Ma FF | 23 | 18 | 2267 | 3–6 | East of China | Random sampling | <2SD | 8 |
| 2016 | Qin Y | 24 | 1640 | 30 000 | 3–14 | Central of China | Cluster sampling | — | 9 |
| 2003 | Qiu XG | 25 | 230 | 23 512 | 6–12 | East of China | Cluster sampling | <2SD or <P3rd | 9 |
| 2015 | Rui QQ | 26 | 58 | 2069 | 6–12 | East of China | Cluster sampling | <2SD | 9 |
| 2018 | Sang MY | 27 | 272 | 14 179 | 7–18 | Central of China | Cluster sampling | <P3rd | 10 |
| 2016 | Tao XG | 28 | 210 | 9338 | 0–14 | East of China | Cluster sampling | <2SD | 10 |
| 2018 | Wang M | 29 | 73 | 8090 | 6–12 | Northeast of China | Stratified random cluster sampling | <P3rd | 9 |
| 2012 | Wang ZH | 30 | 52 | 3722 | 3–5 | Mixed | Multi‐stage stratified cluster sampling | <P3rd | 9 |
| 2018 | Wen YH | 31 | 586 | 9214 | 6–14 | West of China | Random cluster sampling | <2SD or <P3rd | 9 |
| 2017 | Wu LH | 32 | 98 | 2000 | 0–7 | West of China | Random cluster sampling | <2SD | 8 |
| 2011 | Xiang J | 33 | 1553 | 70 918 | 6–18 | West of China | Cluster sampling | <2SD | 10 |
| 2015 | Xu JJ | 34 | 194 | 10 436 | 6–12 | Central of China | Cluster sampling | <2SD | 10 |
| 2016 | Yao X | 35 | 118 | 8336 | 6–18 | West of China | Cluster sampling | <2SD | 10 |
| 2011 | Ye ZZ | 36 | 4746 | 109 600 | 3–6 | West of China | Cluster sampling | <2SD | 9 |
| 1989 | Zhang JH | 37 | 126 | 8783 | 6–13 | Northeast of China | Cluster sampling | <2SD | 9 |
| 2017 | Zhou LH | 38 | 54 | 3106 | 6–12 | West of China | Random sampling | — | 8 |
| 2012 | Du FF | 39 | 299 | 3394 | 6–14 | West of China | Cluster sampling | <2SD | 8 |
| 2012 | Gao G | 40 | 279 | 38 005 | 7–12 | East of China | Cluster sampling | <2SD | 10 |
| 2013 | Liu J | 41 | 172 | 2017 | 5–19 | West of China | Cluster sampling | — | 10 |
| 2011 | 29 | 13 300 | Northeast of China | ||||||
| 2012 | Liu WD | 42 | 29 | 14 022 | 3–5 | Northeast of China | Cluster sampling | <2SD | 7 |
| 2013 | 30 | 14 676 | Northeast of China | ||||||
| 2012 | Peng HL | 43 | 98 | 2735 | 3–5 | West of China | Random sampling | <2SD | 8 |
| 2008 | 331 | 3430 | East of China | ||||||
| 2009 | Qu BX | 44 | 287 | 3054 | 3–7 | East of China | Cluster sampling | <2SD | 8 |
| 2010 | 180 | 3304 | East of China | ||||||
| 2014 | Xu HY | 45 | 90 | 4436 | 3–7 | Central of China | Cluster sampling | <2SD | 8 |
| 2010 | 180 | 5048 | West of China | ||||||
| 2011 | Yang Y | 46 | 458 | 5798 | 3–5 | West of China | Cluster sampling | <2SD | 10 |
| 2012 | 315 | 5724 | West of China | ||||||
| 2006 | 47 | 12 966 | East of China | ||||||
| 2007 | 43 | 12 922 | East of China | ||||||
| 2008 | Yu WP | 47 | 30 | 13 766 | 3–6 | East of China | Cluster sampling | <2SD | 10 |
| 2009 | 25 | 14 349 | East of China | ||||||
| 2010 | 24 | 15 271 | East of China |
Diagnostic criteria: <2SD, height <2 standard deviation (SD) of average height in same ethnicity, sex, and age; <P3rd, height below the third percentile (−1.88 SD) of average height in same ethnicity, sex, and age; —, not mentioned. Quality appraisal was evaluated using the Joanna Briggs Institute Prevalence Critical Appraisal Tool.
Statistical analysis
The pooled prevalence of SS in the included studies were determined and reported with 95% confidence intervals (CI). Statistical analyses in this study were conducted using STATA software (version 11.2; StataCorp, College Station, TX, USA). Subgroup analyses were conducted based on sex, age, area, study time, and study site. Heterogeneity between studies was assessed by the Q test and I 2 statistic (no heterogeneity: I 2 = 0%–25%; moderate heterogeneity: 25%–50%; large heterogeneity: 50%–75%; and extreme heterogeneity: 75%–100%). 9 Fixed effects model analysis was used when P ≥ 0.10 or I 2 < 50%; otherwise, random effects model analysis was used. Publication bias was assessed using Egger’s funnel plot. All P values were two‐tailed and P < 0.05 was considered statistically significant.
RESULTS
Characteristics of the included studies
In total, 3630 eligible articles were identified in the initial literature search; of these, 39 met the inclusion criteria after screening of titles, abstracts, and full texts, as well as removal of duplicates (Figure 1).
The 39 studies included a total of 1 348 326 participants (Table 1). 1 , 10 , 11 , 12 , 13 , 14 , 15 , 16 , 17 , 18 , 19 , 20 , 21 , 22 , 23 , 24 , 25 , 26 , 27 , 28 , 29 , 30 , 31 , 32 , 33 , 34 , 35 , 36 , 37 , 38 , 39 , 40 , 41 , 42 , 43 , 44 , 45 , 46 , 47 One study was published in English, while the remaining 38 were published in Chinese. Sample sizes ranged from 2000 to 581 016 participants. Participant age ranged from 6 months to 18 years old. All studies were conducted from 1989 to 2018 in 20 provinces/municipalities/autonomous regions in China. Stratification based on China’s four major economic regions revealed that five studies were conducted in Northeast China, 20 were conducted in East China, eight were conducted in Central China, and 15 were conducted in West China.
Prevalence of SS
The pooled prevalence of SS among the 39 studies with available data was 3.2% (95% CI, 2.6%–3.7%; I 2 = 99.8%) (Figure 2). The prevalence of SS in boys and girls were 3.1% (95% CI, 2.5%–3.7%) and 3.2% (95% CI, 2.6%–3.9%), respectively; the difference was not statistically significant (P = 0.775). Heterogeneity analysis showed great heterogeneity in the pooled prevalence of SS (I 2 > 95%; P < 0.05); therefore, the random effects model was used to conduct subgroup analyses.
FIGURE 2.

Forest plot of prevalence estimates of short stature with 95% confidence intervals among children in China.
The prevalence of SS was significantly higher in rural areas than in urban areas (4.7% [95% CI, 3.6%–5.8%] vs. 2.8% [95% CI, 2.2%–3.4%]). The prevalence of SS was higher in children aged 6–12 years (3.3%; 95% CI, 2.7%–3.8%) than in children aged > 12 years (3.1%; 95% CI, 2.4%–3.8%) or < 6 years (2.4%; 95% CI, 1.6%–3.3%). The prevalence of SS was higher in studies conducted after 2010 (3.3%; 95% CI, 2.7%–4.0%) than in studies conducted before 2010 (2.5%; 95% CI, 1.8%–3.2%). The prevalence of SS was higher in West China (5.2%; 95% CI, 4.4%–6.0%) than in Northeast China (0.6%; 95% CI, 0.3%–0.8%), East China (2.3%; 95% CI, 1.9%–2.8%), or Central China (2.9%; 95% CI, 1.9%–3.9%) (Table 2).
TABLE 2.
Prevalence of short stature among children in each subgroup
| Variables | Number of studies | Events | Sample size | Heterogeneity of the studies | Prevalence (%) | 95% Confidence interval | Comparison of the groups (P) | |
|---|---|---|---|---|---|---|---|---|
| I 2 (%) | P | |||||||
| Sex | 0.775 | |||||||
| boys | 25 | 7583 | 248 846 | 99.10 | <0.001 | 3.1 | 2.5–3.7 | |
| girls | 25 | 7104 | 232 014 | 99.40 | <0.001 | 3.2 | 2.6–3.9 | |
| Area | <0.001 | |||||||
| Urban | 16 | 5121 | 188 763 | 98.90 | <0.001 | 2.8 | 2.2–3.4 | |
| Rural | 16 | 8373 | 201 703 | 99.50 | <0.001 | 4.7 | 3.6–5.8 | |
| Age (years) | <0.001 | |||||||
| <6 | 20 | 33 222 | 841 883 | 99.90 | <0.001 | 2.4 | 1.6–3.3 | |
| 6–12 | 25 | 7746 | 311 889 | 99.40 | <0.001 | 3.3 | 2.7–3.8 | |
| >12 | 14 | 3036 | 104 940 | 97.60 | <0.001 | 3.1 | 2.4–3.8 | |
| Study year | <0.001 | |||||||
| <2010 | 11 | 3980 | 181 932 | 99.70 | <0.001 | 2.5 | 1.8–3.2 | |
| ≥2010 | 38 | 44 736 | 1 166 394 | 99.90 | <0.001 | 3.3 | 2.7–4.0 | |
| Study site | <0.001 | |||||||
| Northeast of China | 5 | 287 | 58 871 | 99.80 | <0.001 | 0.6 | 0.3–0.8 | |
| East of China | 20 | 6024 | 330 066 | 99.50 | <0.001 | 2.3 | 1.9–2.8 | |
| Central of China | 8 | 2946 | 83 975 | 98.70 | <0.001 | 2.9 | 1.9–3.9 | |
| West of China | 15 | 39 434 | 871 692 | 99.50 | <0.001 | 5.2 | 4.4–6.0 | |
Sensitivity analysis and publication bias
Egger’s test revealed marginal publication bias for SS (t = 2.04, P = 0.047). The results of sensitivity analysis (trim and fill method) of the prevalence of SS indicated that the results were not significantly affected by exclusion of any single study, suggesting that the results were robust (Figures S2 and S3).
DISCUSSION
SS has been identified as a major global health priority and is the focus of several high‐profile initiatives. Notably, SS is an important component of six global nutrition targets for 2025 that were adopted by the World Health Organization in 2012, 48 and may serve as an indicator for the post‐2015 development agenda. The prevalence of SS is important for the surveillance of physical growth of children over time. Thus, information regarding the prevalence and characteristics of SS among children will provide guidance for planning and implementation of nationwide public health policies. 49 , 50
Meta‐analysis, as a statistical analysis method of evidence‐based medicine, aims to increase the sample size by comprehensively analyzing the research results of multiple small samples on the same subject, thus improving the research efficiency of the original results and making the conclusions more representative. 51 This comprehensive meta‐analysis of the prevalence of SS in China included 39 studies with 1 348 326 participants, covering 20 provinces/municipalities/autonomous regions. This results showed that the pooled prevalence of SS was 3.2% in China; notably, the prevalence of SS in children < 6 years of age was 2.4%. The United Nations Children’s Fund reported the prevalence of SS in children < 5 years of age in multiple populations 52 : 37.9% in India (2015–2016), 33.4% in the Philippines (2015), 24.6% in Vietnam (2015), 10.5% in Thailand (2015–2016), 7.1% in Japan (2010), 7.0% in Brazil (2006–2007), and 2.5% in the Republic of Korea (2008–2011). The results of this meta‐analysis showed that the prevalence of SS in children < 6 years of age in China was lower than the prevalence in these developing countries.
The prevalence of SS (3.3%) was higher in primary school students (aged 6–12 years) than in students aged > 12 years (3.1%) or < 6 years (2.4%). This difference is potentially because children aged 0–6 years can fully obtain nutrition under the care of their parents (children of this age have not yet begun to attend school). Moreover, since 2009, the Chinese government has provided a free Supplementary Nutrition Program for children from 6 months to 2 years of age 53 , 54 ; this program provides a variety of vitamins and minerals for the growth and development of children. Notably, the prevalence of SS was high in primary school students (aged 6–12 years). Children of this age have begun to attend school; notably, some rural children live in boarding houses during school attendance (separate from their parents’ care) and may be unable to achieve satisfactory nutrition, thereby resulting in restricted growth and development. After the age of 13 years, students’ self‐care ability may be increased, such that they adequately monitor nutrition. In recent years, the rate of SS detection has increased, as indicated in Table 2: the prevalence of SS was slightly higher in studies conducted after 2010 than in studies conducted before 2010. This may be because with the improvement of living standards, SS in children has become an important concern to the families and society. The increase in the number of children who went to hospital for the diagnosis of SS can increase the detection rate of SS to some extent. At the same time, with the improvement of the medical level, the recognition and diagnosis of SS by specialists can further increase the prevalence of SS.
Our results showed no significant difference in the prevalence of SS between boys and girls. Similar findings regarding sex differences in SS were demonstrated in studies conducted in Arab countries. A study in Saudi Arabia showed no significant difference in the prevalence of SS between boys and girls (5–17 years of age), 55 as did a study in Ankara, Turkey regarding the prevalence of SS in 7–15‐year‐old school‐aged children. 56 However, we found that the prevalence of SS was high in rural (4.7%) and West China (5.2%). Potential explanations for this result are as follows: first, the economic progress of rural areas and West China is very uneven, which directly affects the nutritional status of children living in those areas. For example, the growth and development of school‐aged children (aged 6–12 years) in western rural areas remains suboptimal. Secondly, the educational levels of caregivers are also low in these areas. Children rely on their caregivers to prevent malnutrition; the educational levels of caregivers affect whether they use evidence‐based methods to determine how to feed and care for their children. 57 The educational level of caregivers could also affect family income, thus indirectly affect the nutritional status of their children. 58 , 59
The methodology quality of included studies was evaluated using the Joanna Briggs Institute Prevalence Critical Appraisal Tool. Of the 39 studies included in this meta‐analysis, 18 had inadequate sample size and 11 had unclear sampling methods; however, these aspects did not have substantial impact on the results of this meta‐analysis. Therefore, these studies were considered to be of high quality. In addition, the included studies did not have incomplete data reports or missing data, and all baselines were comparable.
There were some limitations in this meta‐analysis. First, heterogeneity was present among the included studies. Heterogeneity is difficult to avoid in epidemiological studies. 60 Second, the diagnosis of SS was made on the basis of the physical growth and development of children in China, excluding the National Center for Health Statistics/World Health Organization reference data. This method may have caused some bias in the resulting data. Third, publication bias was present in our meta‐analysis because of unclear randomization and concealment methodology in some studies; the prevalence of SS in the included studies demonstrated heterogeneity because of differences in age, area, sample size, study time, and study site. Fourth, the studies included in this meta‐analysis covered only 20 provinces/municipalities/autonomous regions in China; thus, they did not cover all possible areas. Finally, relevant factors (e.g., socioeconomic, nutritional, and environmental variables) were not recorded in most studies; therefore, it was difficult to evaluate their impacts on the prevalence of SS.
In conclusion, this meta‐analysis showed that the prevalence of SS among children in China was 3.2%. However, the prevalence of SS among children in western and rural areas of China was relatively high, which suggests that governmental care and support should be increased to prevent development of SS among children in these areas.
CONFLICT OF INTEREST
The author declare no conflicts of interest.
Supporting information
Supplementary Material
Li F, Liu K, Zhao Q, Chen J, Liu L, Xie Q, et al. Prevalence of short stature among children in China: A systematic review. Pediatr Invest. 2021;5:140‐147. 10.1002/ped4.12233
REFERENCES
- 1. Wang Q, Liu DY, Yang LQ, Liu Y, Chen XJ. The epidemic characteristics of short stature in school students. Ital J Pediatr. 2015;41:99‐105. [DOI] [PMC free article] [PubMed] [Google Scholar]
- 2. Genetic metabolic endocrine group of pediatrics branch in Chinese Medical Association . Guidelines for diagnosis and treatment of children with short stature. Chin J Pediatr. 2008;46:428‐430. (in Chinese) [PubMed] [Google Scholar]
- 3. Zlotkin D, Varma SK. Psychosocial effects of short stature. Indian J Pediatr. 2006;73:79‐80. [DOI] [PubMed] [Google Scholar]
- 4. Kranzler JH, Rosenbloom AL, Proctor B, Diamond FB Jr, Watson M. Is short stature a handicap? A comparison of the psychosocial functioning of referred and nonreferred children with normal short stature and children with normal stature. J Pediatr. 2000;136:96‐102. [DOI] [PubMed] [Google Scholar]
- 5. Wheeler PG, Bresnahan K, Shephard BA, Lau J, Balk EM. Short stature and functional impairment: A systematic review. Arch Pediatr Adolesc Med. 2004;158:236‐243. [DOI] [PubMed] [Google Scholar]
- 6. Wang O, Li J, Wang L, Huang J, Huo J, Sun J. Investigation on the nutrition and growth status of children aged 6–23 months in Yingyangbao used area of middle part in China. J Hyg Res. 2018;47:913‐917. (in Chinese) [PubMed] [Google Scholar]
- 7. Ma J, Pei T, Dong F, Dong Y, Yang Z, Chen J, et al. Spatial and demographic disparities in short stature among school children aged 7–18 years: A nation‐wide survey in China, 2014. BMJ Open. 2019;9:e026634. [DOI] [PMC free article] [PubMed] [Google Scholar]
- 8. Munn Z, Moola S, Riitano D, Lisy K. The development of a critical appraisal tool for use in systematic reviews addressing questions of prevalence. Int J Health Policy Manag. 2014;3:123‐128. [DOI] [PMC free article] [PubMed] [Google Scholar]
- 9. DerSimonian R, Laird N. Meta‐analysis in clinical trials. Control Clin Trials. 1986;7:177‐188. [DOI] [PubMed] [Google Scholar]
- 10. Yang X, Li M, Nie M, Huang Y, Huang Y. The 581,016 case analysis if weight and height of children under five years of age. J Basic Med Forum. 2017;21:2322‐2323. (in Chinese) [Google Scholar]
- 11. Chen XJ, Yang LQ, Liu YD, Wang Q, Liu Y. Survey of the prevalence of short stature of children in three cities of Anhui province. Chin J Child Health Care. 2017;25:401‐405. (in Chinese) [Google Scholar]
- 12. Wang LF, Gu YQ, Jia LS, Gu T, Gu Y, Lu T, et al. Incidence and influencing factors of short stature in children aged 3 to 14 years in taicang city. J Pediatr Pharm. 2018;24:20‐23. (in Chinese) [Google Scholar]
- 13. Cao LF, Mao YY, Su C, Yao HM. Sampling survey and analysis of growth and development index of children aged 6–11 in yuhang district. Chin J Rural Med Pharm. 2013;20:63‐64. (in Chinese) [Google Scholar]
- 14. Chen AY, Chen ML, Qiu XG, Chen X. Investigation on the prevalence rate and the causes of the dwarfish children at primary school in fuzhou. Strait J Prev Med. 2001;7:28. (in Chinese) [Google Scholar]
- 15. Cheng RQ, Shen SX, Tu YZ, Xia H, Wang H, Zhi DJ, et al. A cluster systematic sampling survey of the body height distribution profile and the prevalence of short stature of urban and surburban children aged from 6 to 18 years in Shanghai. Chin J Evid Based Pediatr. 2009;4:5‐11. (in Chinese) [Google Scholar]
- 16. Dou YR, CaO XY, Wang H, Cao XH. Prevalence of short stature among primary and secondary school students in Chongqing municipality. Chin J Public Health. 2016;32:469‐471. (in Chinese) [Google Scholar]
- 17. Fu DL, Yang QY, Liu GL, Deng RX, Wei Y, Jiang LH, et al. A survey on height, weight and overweight, obesity and short stature of 5 374 urban children aged from 6 to 13 years in Tianjin. J Tianjin Med Univ. 2011;17:236‐239. (in Chinese) [Google Scholar]
- 18. Liu HJ, Zhang GR, Guo SX, Ma LJ. The incidence and etiological analysis of short stature children in Zibo of Shandong Province. J Appl Clin Pediatr. 2004;19:217‐219. (in Chinese) [Google Scholar]
- 19. Li SL, Li X, Yin MP, Shi CL, Du FF, Zhang WT, et al. A survey of the height distribution of children aged 7 to 13, Yan’an. Mod Prev Med. 2015;42:3906‐3906. (in Chinese) [Google Scholar]
- 20. Liu SS, Ban B, Pan H, Zhang M, Sun HL, Li P, et al. The research of prevalence of short stature of children and adolescents aged from 6 to 16 years in Jining. Chin J Diagn (Electronic Edition). 2017;5:191‐194. (in Chinese) [Google Scholar]
- 21. Liu Y, Liu DY, Yang LQ, Wang Q, Chen XJ, Wan YH. A survey of the body height distribution profile and the prevalence of short stature of school children aged from 7 to 18 years in Hefei of Anhui province. Chin J Prim Med Pharm. 2016;23:3521‐3527. (in Chinese) [Google Scholar]
- 22. Lou XM, Li L, Cao YM, Chen J, Zhang DF, Hu QY. Analysis of factors related to short stature for middle school students in zhengzhou. Chin J Sch Health. 2004;25:21‐23. (in Chinese) [Google Scholar]
- 23. Ma FF, Ma LP, Cheng XQ. Analysis of abnormal physical detection and deviation trend of body mass index in preschool children in sanmen county of taizhou city. Pract Prev Med. 2016;23:210‐212. (in Chinese) [Google Scholar]
- 24. Qin Y, Yang LM. Prevalence study and etiological analysis of childhood dwarfism in Wuhan. Matern Child Health Care China. 2017;32:3306‐3310. (in Chinese) [Google Scholar]
- 25. Qiu XG, Chen X. Investigation on the causes of short stature of primary school students in Fuzhou. Chin J Child Health Care. 2004;12:71‐72. (in Chinese) [Google Scholar]
- 26. Rui QQ, Yu CY, Xu J, Chen YN, Shi CC. Study of physical growth levels of 2069 school‐age children in Yiwu city. Chin J Child Health Care. 2017;25:111‐114. (in Chinese) [Google Scholar]
- 27. Sang MY, Li S, Yang XJ. Investigation on the characteristics of height distribution and the prevalence of short stature in people aged 7–18 years in Datong city. Basic & Clin Med. 2018;38:1593‐1594. (in Chinese) [Google Scholar]
- 28. Tao XG, Zhao GH, Gao YQ, Yao HW, Sheng RJ, Huang LM. An analysis on height of primary school Students and factors influencing dwarfism. Jiangsu Med J. 2017;43:703‐705. (in Chinese) [Google Scholar]
- 29. Wang M, Song T, Yu XH. Prevalence of short stature in school‐age children aged 6–13 years in Ganjingzi district of Dalian city. China Health Vis. 2018;22:28. (in Chinese) [Google Scholar]
- 30. Wang ZH, Jiang JX, Yang Q, Wang FM, Yao Q, Hou QC, et al. Study on the height status among the preschool children in some cities. Chin J Child Health Care. 2016;24:1028‐1031. (in Chinese) [Google Scholar]
- 31. Wen YH, Lei HB, Feng J, Chen F. Investigation on growth and development status and prevalence of short stature of school‐age children in guangan district. China Health Care Nutr. 2018;274: (in Chinese) [Google Scholar]
- 32. Wu LH, Wei YG, Huang YB. Investigation on the growth and development of Children under 7 years of age in Qianjiang District of Chongqing. For All Health. 2017;11:18. (in Chinese) [Google Scholar]
- 33. Xiang J, Liu WJ, Luo Y, Wang WL, Li YM, Lin X, et al. Height standards and prevalence of short stature investigation for 5 to18‐year‐old children in Wanzhou, Chongqing. J Third Mil Med Univ. 2014;36:2221‐2224. (in Chinese) [Google Scholar]
- 34. Xu JJ. Investigation and analysis on prevalence rate and causes of short stature in primary school pupils in Jingdezhen city. Contemp Med. 2017;23:1‐3. (in Chinese) [Google Scholar]
- 35. Yao X, He Y. The dwarfism incidence and etiology on aged 6 to 18 children and adolescents in Dushanzi district. J Mod Med & Health. 2017;33:3242‐324. (in Chinese) [Google Scholar]
- 36. Ye ZZ, Zhang N. Analysis of 109600 kindergarten Children with body length < median‐2 standard deviation. J Baotou Med. 2013;37:34‐35. (in Chinese) [Google Scholar]
- 37. Zhang JH, Liu LJ, Liu SQ, Liu Y. Analysis of factors causing short stature in children in Qiqihar railway area. Chin J School Health. 1993;14:198‐200. (in Chinese) [Google Scholar]
- 38. Zhou LH. Analysis of the incidence of short stature in the urban and rural areas of the Shangrao region and the related etiological factors. Contemp Med. 2019;25:137‐139. (in Chinese) [Google Scholar]
- 39. Du FF. The survey of growth and development and it’s influence factors about pupils in Yanan suburb Shanxi [master’s thesis]. Shanxi, China: Yanan University; 2014. (in Chinese) [Google Scholar]
- 40. Gao G, Chen XQ. Analysis on malnutrition status among primary school students in Wuzhong District of Suzhou City in 2012. Occup Health. 2014;30:678‐680. (in Chinese) [Google Scholar]
- 41. Liu J. Growth, development and nutritional status of 2017 primary and secondary school students in Chongqing. The Third Military Medical University, Master thesis 2013. (in Chinese)
- 42. Liu WD. Monitoring and analysis of physical development of 6‐year‐old children in Ganjingzi district of Dalian city from January 2011 to December 2013. China Health Industry. 2015;1:158‐159. (in Chinese) [Google Scholar]
- 43. Peng HL, Bai Q, Wang Q. Analysis of the health condition of 2735 kindergarten children in Nanzheng County. Chin J Woman Child Health Res. 2012;23:721‐723. (in Chinese) [Google Scholar]
- 44. Qu BX, Xiao YM, Liu TS, Xian JB. Health status of the children in the kindergartens of Minzhong town of Zhongshan city from 2008 to 2010. Matern Child Health Care China. 2012;27:216‐220. (in Chinese) [Google Scholar]
- 45. Xu HY. Analysis and intervention measures of health examination of children in kindergartens in Xiangfen county in 2014. Pub Med Forum Mag. 2015;19:781‐782. (in Chinese) [Google Scholar]
- 46. Yang Y. Analysis on physical examination results of children aged 0–6 years in 2010–2012 in Daan of Zigong city. Chin J Child Health Care. 2013;21:1218‐1220. (in Chinese) [Google Scholar]
- 47. Yu WP, Sun YY. Investigation on physical development and nutrition of children in kindergartens of Yangzhou city during 2006 to 2010. Occup Health. 2011;27:2719‐2721. (in Chinese) [Google Scholar]
- 48. de Onis M , Branca F. Childhood stunting: A global perspective. Matern Child Nutr. 2016;12 Suppl 1:12‐26. [DOI] [PMC free article] [PubMed] [Google Scholar]
- 49. De Onis M, Monteiro C, Akré J, Glugston G. The worldwide magnitude of protein‐energy malnutrition: An overview from the WHO global database on child growth. Bull World Health Organ. 1993;71:703‐712. [PMC free article] [PubMed] [Google Scholar]
- 50. Dibley MJ, Staehling N, Nieburg P, Trowbridge FL. Interpretation of Z‐score anthropometric indicators derived from the international growth reference. Am J Clin Nutr. 1987;46:749‐762. [DOI] [PubMed] [Google Scholar]
- 51. Kulinskaya E, Morgenthaler S, Staudte RG. Meta analysis: A guide to calibrating and combining statistical evidence. New York: John Wiley & Sons; 2008:3. [Google Scholar]
- 52. Joint Malnutrition dataset from UNICEF, World Bank and WHO: http://data.unicef.org/nutrition/malnutrition.html. Accessed January 6, 2020.
- 53. Xu J, Huo JS, Zhang J, Huang J. Complementary food supplements interventions for 6 to 24 months old infants in poverty areas. Chin J Food Hyg. 2017;29:550‐555. (in Chinese) [Google Scholar]
- 54. Liu W. Effect of YYB on prevalence of anemia among infants and young children aged 6 to 23 months and its problem analysis [master’s thesis]. Hubei, China: Wuhan University; 2018. (in Chinese) [Google Scholar]
- 55. El Mouzan MI, Al Herbish AS, Al Salloum AA, Al Omer AA, Qurachi MM Regional prevalence of short stature in Saudi school‐age children and adolescents. ScientificWorldJournal. 2012;2012:505709. [DOI] [PMC free article] [PubMed] [Google Scholar]
- 56. Özdemir O, Erçevik E, Çalışkan D. Evaluation of pupil growth and development in two primary schools with different socioeconomic status. Ankara Univ Med Sch J. 2005;58:23‐29. [Google Scholar]
- 57. Fertig A, Glomm G, Tchernis R. The connection between maternal employment and childhood obesity: Inspecting the mechanisms. Rev Econ Househ. 2009;7:227‐255. [Google Scholar]
- 58. Orlonski S, Dellagrana RA, Rech CR, Araujo ED. Nutricional status and associated factors of low stature in children attended by a regular school of integral time. Rev Bras Crescimento Desenvolv Hum. 2009;19:54‐62. [Google Scholar]
- 59. Lakshman R, Zhang J, Zhang J, Koch FS, Marcus C, Ludvigsson J, et al. Higher maternal education is associated with favourable growth of young children in different countries. J Epidemiol Community Health. 2013;67(7):595‐602. [DOI] [PMC free article] [PubMed] [Google Scholar]
- 60. Hu C, Ye D, Li Y, Huang Y, Li L, Gao Y, et al. Evaluation of a kindergarten‐based nutrition education intervention for pre‐school children in China. Public Health Nutr. 2010;13:253‐260. [DOI] [PubMed] [Google Scholar]
Associated Data
This section collects any data citations, data availability statements, or supplementary materials included in this article.
Supplementary Materials
Supplementary Material