

Abstract
The ability to tune RNA and gene expression dynamics is greatly needed for biotechnological applications. Native RNA stabilizers or engineered 5’ stability hairpins have been utilized to regulate transcript half-life to control recombinant protein expression. However, these methods have been mostly ad-hoc and hence lack predictability and modularity. Here, we report a library of RNA modules called degradation-tuning RNAs (dtRNAs) that can increase or decrease transcript stability in vivo and in vitro. dtRNAs enable modulation of transcript stability over a 40-fold dynamic range in Escherichia coli with minimal influence on translation initiation. We harness dtRNAs in mRNAs and noncoding RNAs to tune gene circuit dynamics and enhance CRISPR interference in vivo. Use of stabilizing dtRNAs in cell-free transcription-translation reactions also tunes gene and RNA aptamer production. Finally, we combine dtRNAs with toehold switch sensors to enhance the performance of paper-based norovirus diagnostics, illustrating the potential of dtRNAs for biotechnological applications.
Precise regulation of gene expression is essential to basic cell function, appropriate responses, and even robust therapeutics and diagnostics1–4. Therefore, effective strategies are required to enable accurate and predictable control of both the production and degradation of RNA and protein molecules5–7. In bacteria, such control has largely been focused on the production of RNA (transcription) or protein (translation), including synthetic transcriptional terminators8,9, riboregulators10–13, thermosensors14, ribozymes15, CRISPR activation and interference systems16,17, switchable guide RNAs18,19, engineering regions nearby open reading frames (ORFs)20–22, and optimization of codon usage23.
RNA molecules in prokaryotes are typically unstable, with half-lives on the minute timescale, to allow for rapid adaptation to changes in the environment24. This rapid degradation is orchestrated by an ensemble of bacterial RNases25,26. In E. coli, the endonucleases RNase E or RNase III target the underlying RNA molecule for primary cleavage followed by complete degradation via 3’ → 5’ exonucleases27–29. Previously discovered naturally occurring 5’ UTRs, termed RNA stabilizers, or rationally designed synthetic DNA cassettes can increase RNA half-life by forming 5’ secondary structures30–33. These 5’ hairpin structures have been shown to be able to control heterologous mRNA half-life and used to regulate recombinant protein expression without introducing stress to host cells33. However, most engineered 5’ stabilizing elements have been designed and tested on an ad-hoc basis. The relationship between stabilizer structural features and mRNA half-life remains elusive.
Here, we explore the structural space and report a library of modular degradation-tuning RNAs (dtRNAs) that can be inserted at the 5’ end of a transcript of interest to manipulate its stability. Based on in silico analysis, these RNA modules can form secondary structures that impact RNA degradation without interfering with downstream RNA features, including RBS context. We systematically characterize dtRNA structures and find that RNA stability is strongly correlated with structural features such as stem length and GC content, loop size, 5’ spacing sequence and the presence of RNase cleavage sites. Integrating dtRNAs with the highest stability enhancements into gene circuits enables us to tune the dynamics of a positive feedback loop and increase noncoding RNA levels for improved CRISPR interference. We further apply synthetic dtRNAs to cell-free systems and confirm their ability to tune gene and RNA aptamer production in vitro. Lastly, we demonstrate the utility of dtRNAs by integrating them with toehold switch sensors to implement improved paper-based viral diagnostics, illustrating the potential of dtRNAs for medical and biotechnological applications.
Results
Modulation of RNA stability by ompA stabilizer variants.
Inspired by previous studies that demonstrated that naturally occurring stabilizers can be used to tune gene expression in synthetic gene circuits31,33, we inserted the 5’ UTR sequence from the E. coli ompA transcript between the promoter and RBS region to tune downstream GFP expression20,34,35 (Fig. 1a, right). The RNA sequence of the stabilizer forms secondary structures to stabilize the mRNA following transcription (Fig. 1a, left). Fig. 1b shows that the wild-type (WT) stabilizer does indeed increase GFP levels moderately compared to a control (Ctrl) mRNA lacking the stabilizer sequence. Sequence analysis shows that the ompA stabilizer forms two hairpins and two single-stranded sequences between the two hairpins (ss1) and downstream of hairpin_2 (ss2) (Extended Data Fig. 1a). To investigate the contribution of these components to maintaining RNA stability, we designed two variants of the ompA stabilizer: “Hp1” includes hairpin_1 and the first 7 nucleotides of ss1, and “Hp2” includes hairpin_2 and the first 7 nucleotides of ss2 (details in Supplementary Dataset 1). Both “Hp1” and “Hp2” displayed greater GFP expression than WT ompA sequence, with “Hp1” providing about a 2-fold increase in GFP over the control (Fig. 1b), when each cassette was driven by a weak promoter. Cassettes on high-copy plasmids driven by strong promoters did not show significant fluorescence enhancements (Extended Data Fig 1b), potentially due to saturation of the transcription and degradation process.
Fig. 1 |. Modulation of RNA stability by native ompA stabilizer variants.

a, Schematic showing the stabilizer protection mechanism and the plasmid constructed for fluorescence measurements. The structure depicted by a red dashed line indicates the small hairpin structure design nearby the RBS of WT_I, Hp1_I and Hp2_I. For the plasmid map, the gray arrow represents the constitutive promoter; the blue rectangle represents the RNA stabilizer; the orange oval represents the RBS; the green box represents GFP gene; the gray T represents the transcriptional terminator. b, Plate reader measurement shows that GFP fluorescence is affected by engineered stabilizer variants. The designs adopt the whole (WT, P = 0.0264) or part (Hp1, P = 0.0048 and Hp2, P = 0.00048) of the native ompA stabilizer and exhibit GFP fluorescence enhancement. Low GFP expression is observed for circuits WT_I (P = 0.0004), Hp1_I (P =0.00037) and Hp2_I (P = 0.00039) with small hairpin structures nearby the RBS region. The gray bar represents the control circuit result (Ctrl). Data represent the mean ± SD of four biological replicates. * P < 0.05, ** P < 0.01, *** P < 0.001, P value is measured by two-tailed student’s t test. c, Comparison between relative mRNA level and relative GFP fluorescence for circuit WT, Hp1 and Hp2. The result shows a strong correlation between these two factors (R2 = 0.8997). Data represent the mean ± SD of at least three biological replicates.
To explore the impact of extra secondary structures formed close to the RBS on GFP expression, another three stabilizer variants were synthesized: “WT_I”, “Hp1_I” and “Hp2_I” which, compared to above designs, form an extra short hairpin structure near the RBS (red structure in Fig. 1a). These three designs showed weaker or no fluorescence (Fig. 1b and Extended Data Fig. 1c), demonstrating that RNA secondary structure can interfere with translation when it is too close to the RBS, consistent with previous reports36.
To rule out the possibility that observed increase in GFP fluorescence was due to enhanced translation rather than increased RNA stability, RT-qPCR experiments were carried out for Ctrl, WT, Hp1, and Hp2 to measure their RNA levels. Fig. 1c shows that RNA level variations can explain about 90% of the change of their corresponding GFP fluorescence (R2 = 0.8997), indicating that the observed fluorescence enhancements can be attributed primarily to increased RNA levels. These results demonstrated the viability of using artificial upstream 5’ UTR sequences to modulate RNA stability in synthetic systems given appropriate design of hairpin structures and distances between the hairpin and RBS.
Identifying structural features of synthetic dtRNAs.
We then designed a library of synthetic dtRNAs with a range of structural features to systematically evaluate their influence on RNA stability. In silico analyses highlighted stem length, stem GC content, loop size, 5’ spacing sequence, and 3’ insulation as the primary candidate features to investigate (Fig. 2a and Supplementary note).
Fig. 2 |. Identifying functional structural features of synthetic dtRNAs.
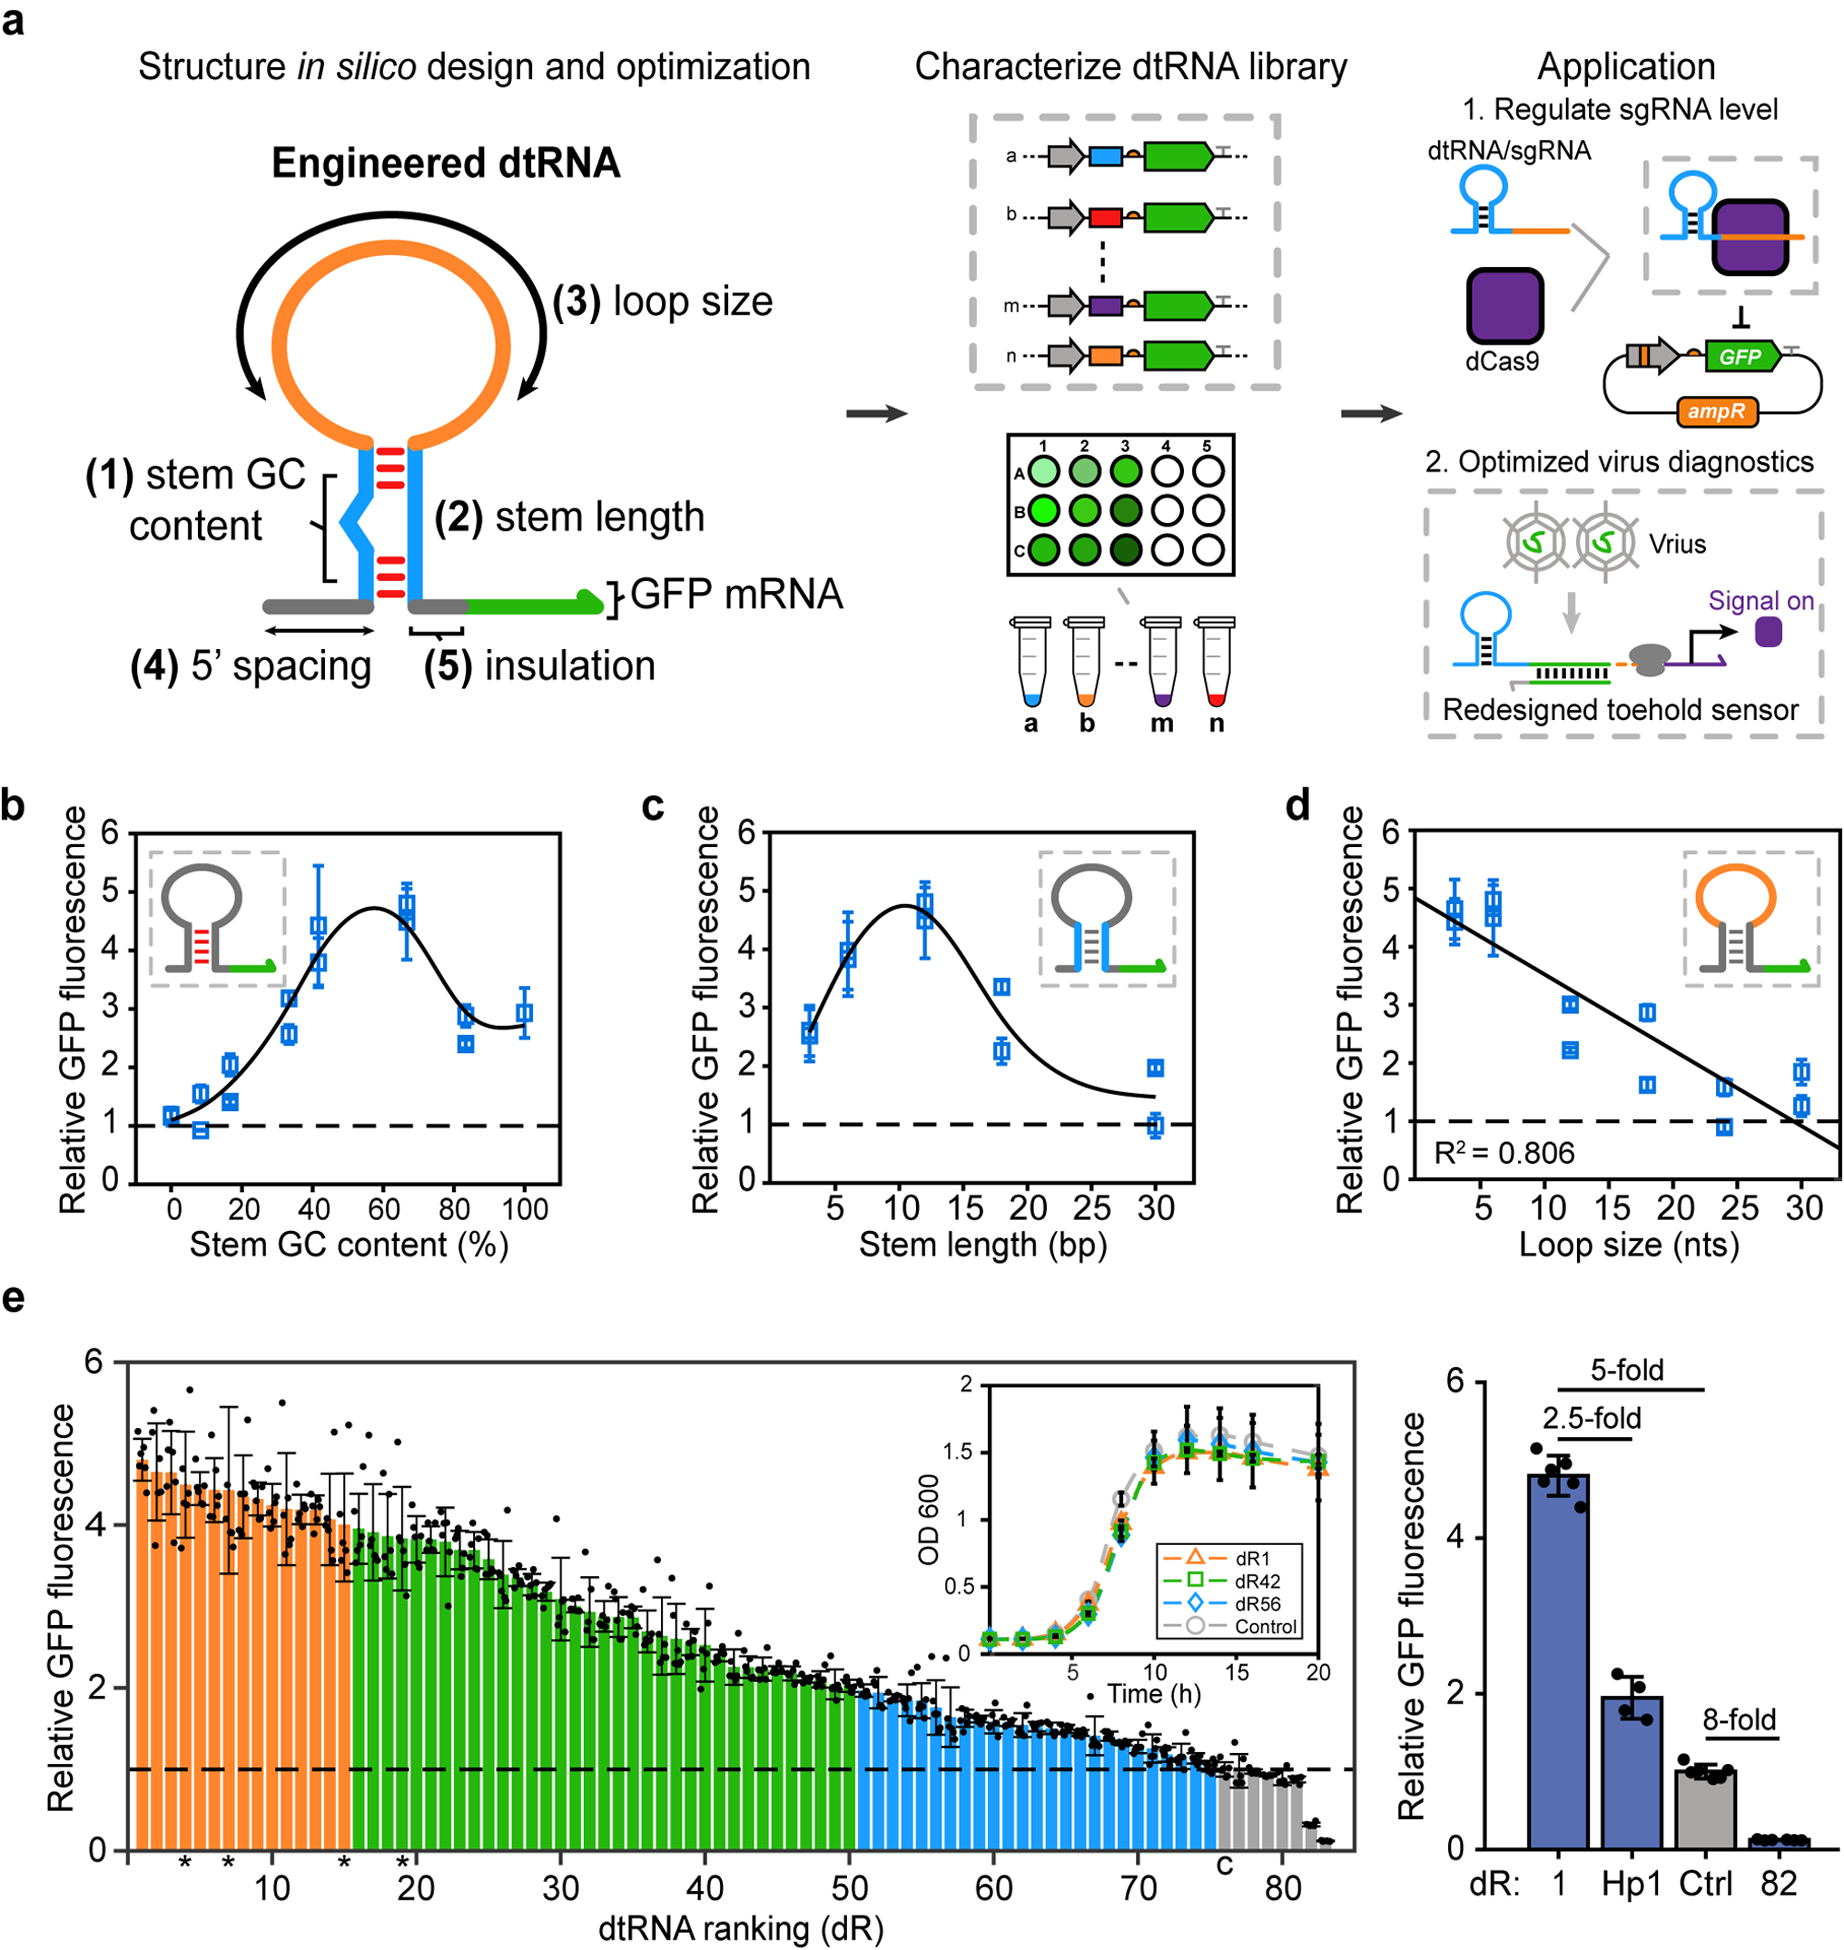
a, Schematic showing the workflow for the present study. b-d, Correlations between each structural feature and the relative GFP expression. b, Correlation between dtRNA stem GC content (0% to 100%) and the relative GFP fluorescence, and the result was fitted using smoothing spline (solid curve); c, Correlation between dtRNA stem length (3 bp to 30 bp) and the relative GFP fluorescence, and the result was fitted using smoothing spline (solid curve); d, Correlation between dtRNA loop size (3 nt to 30 nt) and the relative GFP fluorescence, this result was linear fitted (solid line, R2 = 0.806). The insets color-code the characterized structural features of dtRNA, and the green arrow represents GFP mRNA. All data from b-d represent the mean ± SD of six biological replicates. e, (Left) Relative GFP fluorescence of synthetic dtRNA library. Orange bars represent designs with over 4-fold fluorescence enhancement; green bars represent designs with 2 to 4-fold enhancement; blue bars represent designs with 1-fold to 2-fold enhancement; gray bars represent designs with fluorescence lower than the control (c). Data represent the mean ± SD of six biological replicates. Asterisks represent the dtRNAs used for in vitro measurement. Inset: Growth curve measurement results showing the OD 600 values for dR1, dR42, dR56 and control over 20 hours. Data represent the mean ± SD of three biological replicates. (Right) Summary of GFP fold difference across dtRNA structures with the least and the most stable sequences, engineered stabilizer variant Hp1 (Fig. 1b) and the control. Data represent the mean ± SD of at least four biological replicates.
Fig. 2b displays quantitative characterization of the impacts of stem GC content on RNA stability. Theoretically, stems with high GC content are more thermodynamically stable and could lead to stronger enhancements of RNA stability. Fifteen dtRNAs with the same secondary structure (6-nt loop and 12-bp stem) but varying stem GC content were designed and tested (Fig. 2b). Fluorescence measurements show that structures with low GC content nearly abolish the GFP expression enhancements, likely due to the unwinding of unstable AU rich hairpins. On the other hand, as the fraction of GC base pairs increases, GFP fluorescence increases concomitantly until it peaks at 66.7% GC content. With higher GC content, we observe diminished expression enhancements, presumably because RNA structures with GC-rich stem loops could act as transcriptional terminators, which stall RNA polymerases and cause the transcriptional complex to fall off and therefore lead to lower expression levels37,38. This result quantifies the non-monotonic relationship between GC content and resulting RNA stability and also identifies that medium level (41.6% -- 66.7%) GC content is ideal for dtRNA structures to enhance RNA stability.
To investigate the impact of stem length on RNA stability, another ten dtRNAs sharing the same loop sequence and optimal stem GC content but varying stem length were designed and tested (Fig. 2c). Fluorescence measurements show that structures with long stem lengths (30 bp) nearly eliminate RNA stability enhancement, possibly because even perfectly paired hairpins that are over 30 bp in length are likely to be targeted by RNase III to initiate the RNA degradation process27. GFP fluorescence reaches its highest value for stem lengths of 12 bp. Further reductions in stem length lead to decreased hairpin stability and increased susceptibility to RNases as the stem is decreased down to 3 bp. These effects thus result in the non-monotonic relationship between stem length and the resulting RNA stability, where hairpins with 12-bp stems show the maximum RNA stability enhancement.
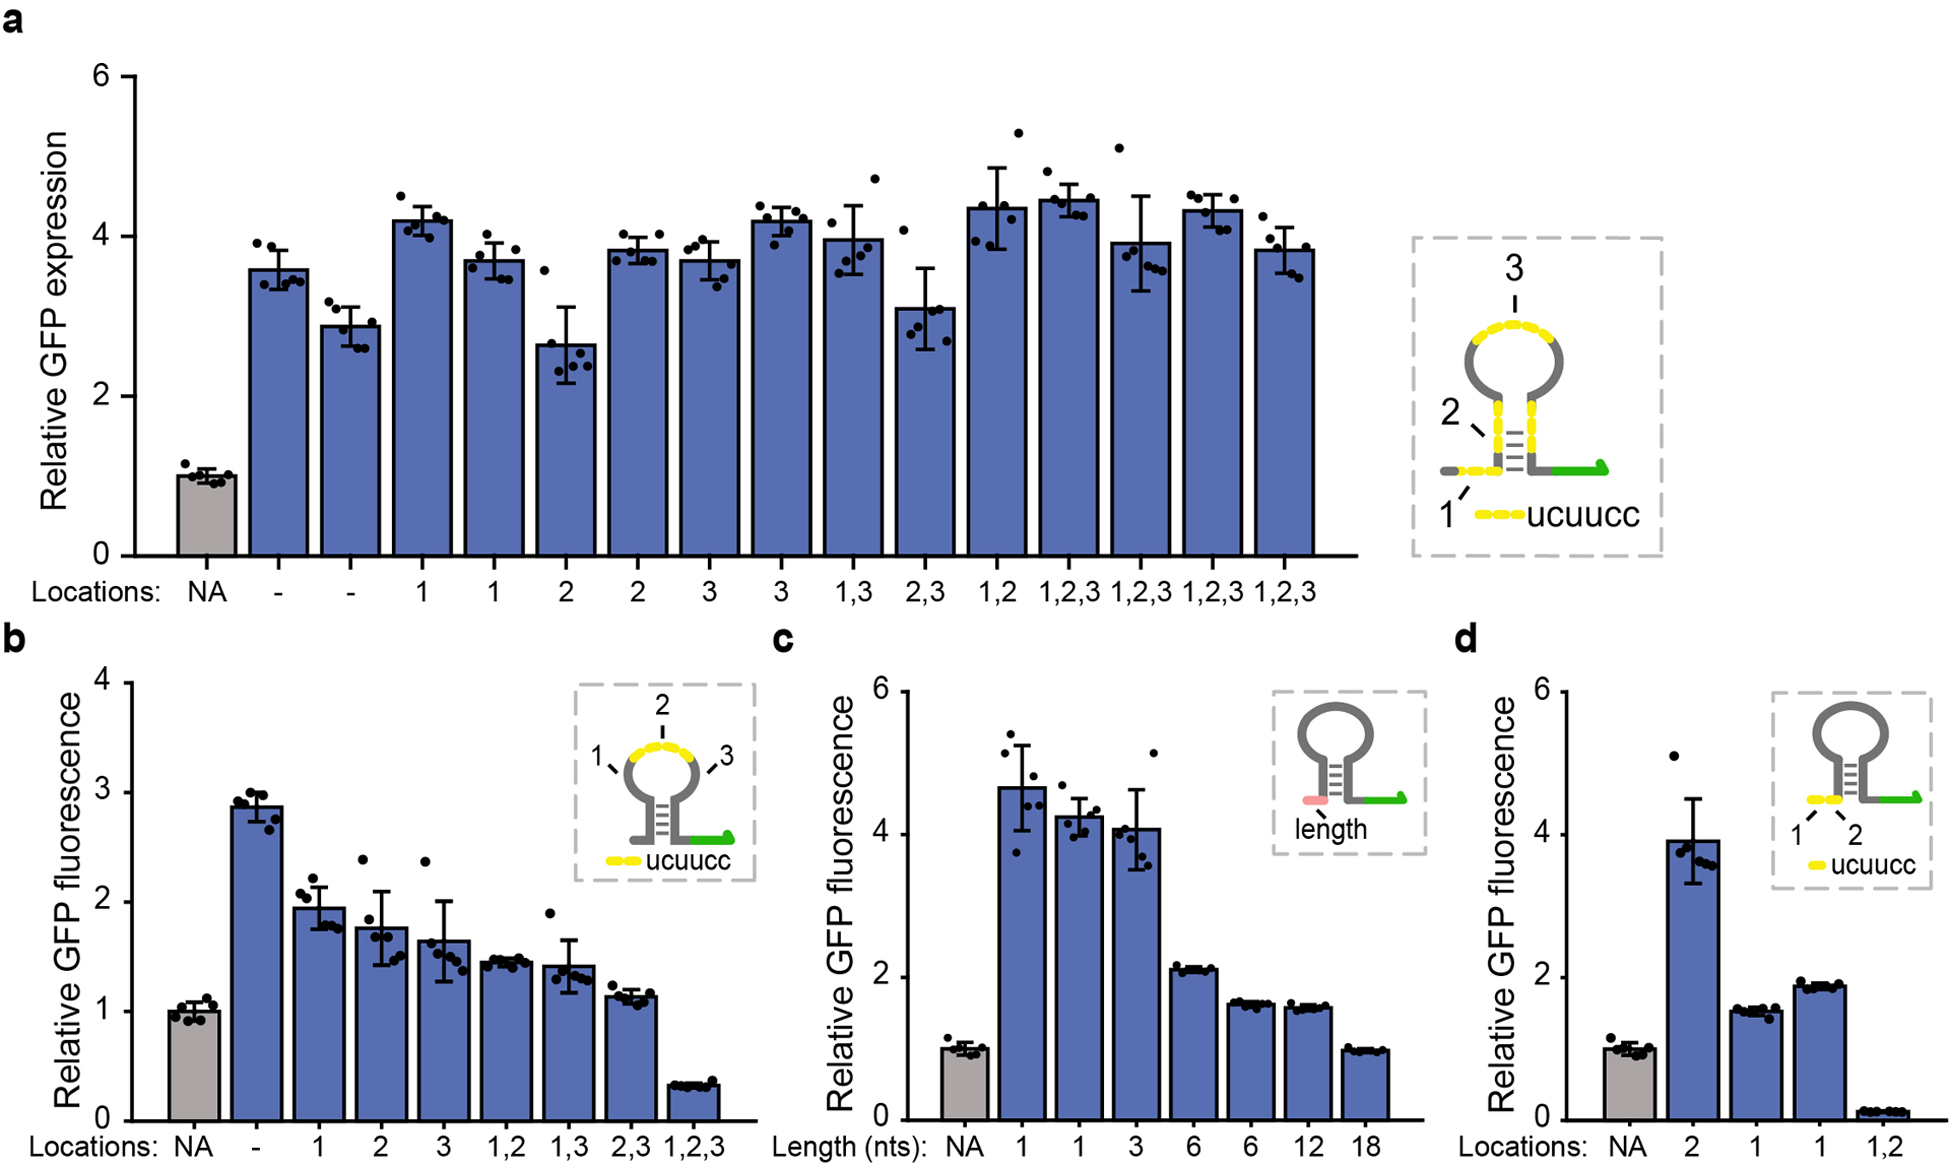
Finally, to identify the relationship between loop size and RNA stability, we tested another set of twelve dtRNA structures containing optimal stem features but varying loop sizes. In theory, tetraloops, which are hairpin loops of 4 nt, endow an RNA structure with strong thermal stability and make them highly nuclease resistant39. This effect is confirmed experimentally in Fig. 2d where structures with loop sizes of around 4 nt (3 nt and 6 nt in our set) display the highest RNA stability enhancement. GFP fluorescence levels decrease with increased loop size, likely because large loops increase the possibility for RNase targeting and thereby weaken RNA stability. These results demonstrate a monotonically decreasing relationship between loop size and RNA stability and establish that a loop size of around 4 nt (3 nt to 6 nt) is ideal for RNA stability enhancements.
Having designed structural features to enhance RNA stability, we next explored incorporating motifs to decrease RNA stability. RNase E cleavage site (UCUUCC, 6-nt) were inserted into stable dtRNA structures14,40 and no significant GFP fluorescence decrease was observed (Extended Data Fig. 2a). However, GFP fluorescence was significantly reduced when introducing three cleavage sites into relatively unstable large loop hairpin structures, demonstrating that stabilizers with relatively “open” structures are readily targeted by RNases (Extended Data Fig. 2b). We next interrogated the impact of a 5’ spacing sequence on RNA stability reduction. Unlike a previous report that found that as little as a 5-nt single-stranded region at the 5’ end of the RNA could completely abolish the stabilizer function30, we observed RNA stability enhancement with 12-nt single-stranded sequence. The stabilizing effect is completely abolished only when the 5’ single-stranded region reaches 18 nt in length (Extended Data Fig. 2c). We combined these two features by inserting RNase E cleavage site into the 5’ spacing sequence and show that GFP fluorescence decreased when the cleavage site is inserted 6 nt away from the hairpin structure, and the fluorescence level is even further downregulated by about 8-fold below the control when two RNase E cleavage sites are inserted (Extended Data Fig. 2d). Other features such as the presence of bulges within the stem and loop GC content are found to have insignificant effects on RNA stability (Extended Data Figs. 3a, b).
To investigate if dtRNAs can also be applied to genes with very different sequence composition, we selected dtRNAs with varying stabilizing capabilities to regulate mRFP expression. Sequence comparison analysis shows only 3% homology between GFP and mRFP genes. Following the same circuit construction scheme, we inserted each dtRNA upstream of mRFP to measure their effect on reporter expression. Fluorescence measurements show that dtRNAs with higher stability enhancements in the GFP library also displayed higher relative mRFP fluorescence (Extended Data Fig. 3c). We further compared the mRFP performance of the selected dtRNAs to their GFP performance. The results also exhibit high correlation (R2 = 0.8681), suggesting dtRNA performance is transferable to other genes with different sequence compositions (Extended Data Fig. 3d). To further verify that RNA stability enhancement is independent of genetic context, two dtRNA variants displaying high stability enhancements were measured with different promoters and RBSs (Extended Data Figs. 3e, f). Results also showed that dtRNAs retained their RNA stabilizing effect despite the change in genetic context.
To confirm that the observed gene expression tuning could be attributed to RNA levels, RT-qPCR experiments were performed for selected dtRNAs with a range of GFP fluorescence enhancement levels. The results show a strong correlation between relative RNA level and relative GFP fluorescence (R2 = 0.9406), indicating that GFP fluorescence variation is mainly due to the change in RNA levels (Extended Data Fig. 4a). To determine if dtRNA stabilizing capacity could be predicted, we designed additional dtRNAs with a range of structural features and calculated their predicted relative GFP levels based on the relationships between structure and stability shown in Fig. 2b–d (Supplementary Table 3). Fluorescence measurements show a strong correlation between the predicted and observed GFP levels (R2 = 0.5005, Extended Data Fig. 4b). It is also shown, as predicted, that a long 5’ single-stranded region (design f, Supplementary Table 3) nearly abolished the stabilizing effect (Extended Data Fig. 4c). These results demonstrate that dtRNA stability enhancement ability can be semi-quantitatively predicted based on a few design rules.
In all, we systematically designed and tested a library of 82 synthetic dtRNAs and identified the functional structural features affecting RNA stability. By tuning combinations of structural features, dtRNAs enable quantitative control over gene expression with a wide dynamic range of 40-fold from the least to the most stable sequences (Figs 2e, dtRNA stability ranked 1 through 82, denoted dR 1–82). We also note that no significant correlation between the dtRNA minimum free energy (MFE) and GFP fluorescence was detected (Extended Data Fig. 4d), indicating that a combination of RNA sequence and structural features, rather than RNA folding alone, define transcript stability.
Modulation of circuit dynamics and noncoding RNA levels.
As an initial test of the utility of dtRNAs, we selected two dtRNAs with the top GFP enhancement performance (dR1 and dR6) to incorporate into a LuxR/LuxI quorum sensing (QS) regulatory circuit and measure their impact on downstream GFP expression. Fig. 3a shows that synthetic dtRNAs are only inserted in the 5’ region upstream of the LuxR sequence to regulate LuxR expression (circuit C_dR1 and C_dR6) with GFP as the readout. It can be seen in Fig. 3b that, as 3OC6HSL concentration increases, GFP fluorescence increases for C_dR1 and C_dR6 become more pronounced when compared against the circuit without dtRNA regulation (C_Ctrl), suggesting synthetic dtRNAs are capable of stabilizing LuxR mRNA and thereby enhancing downstream GFP fluorescence in synthetic gene circuits. Such stability enhancement is amplified in high induction cases because of increased transcript abundances.
Fig. 3 |. Using dtRNAs to modulate gene circuit dynamics and noncoding RNA levels.
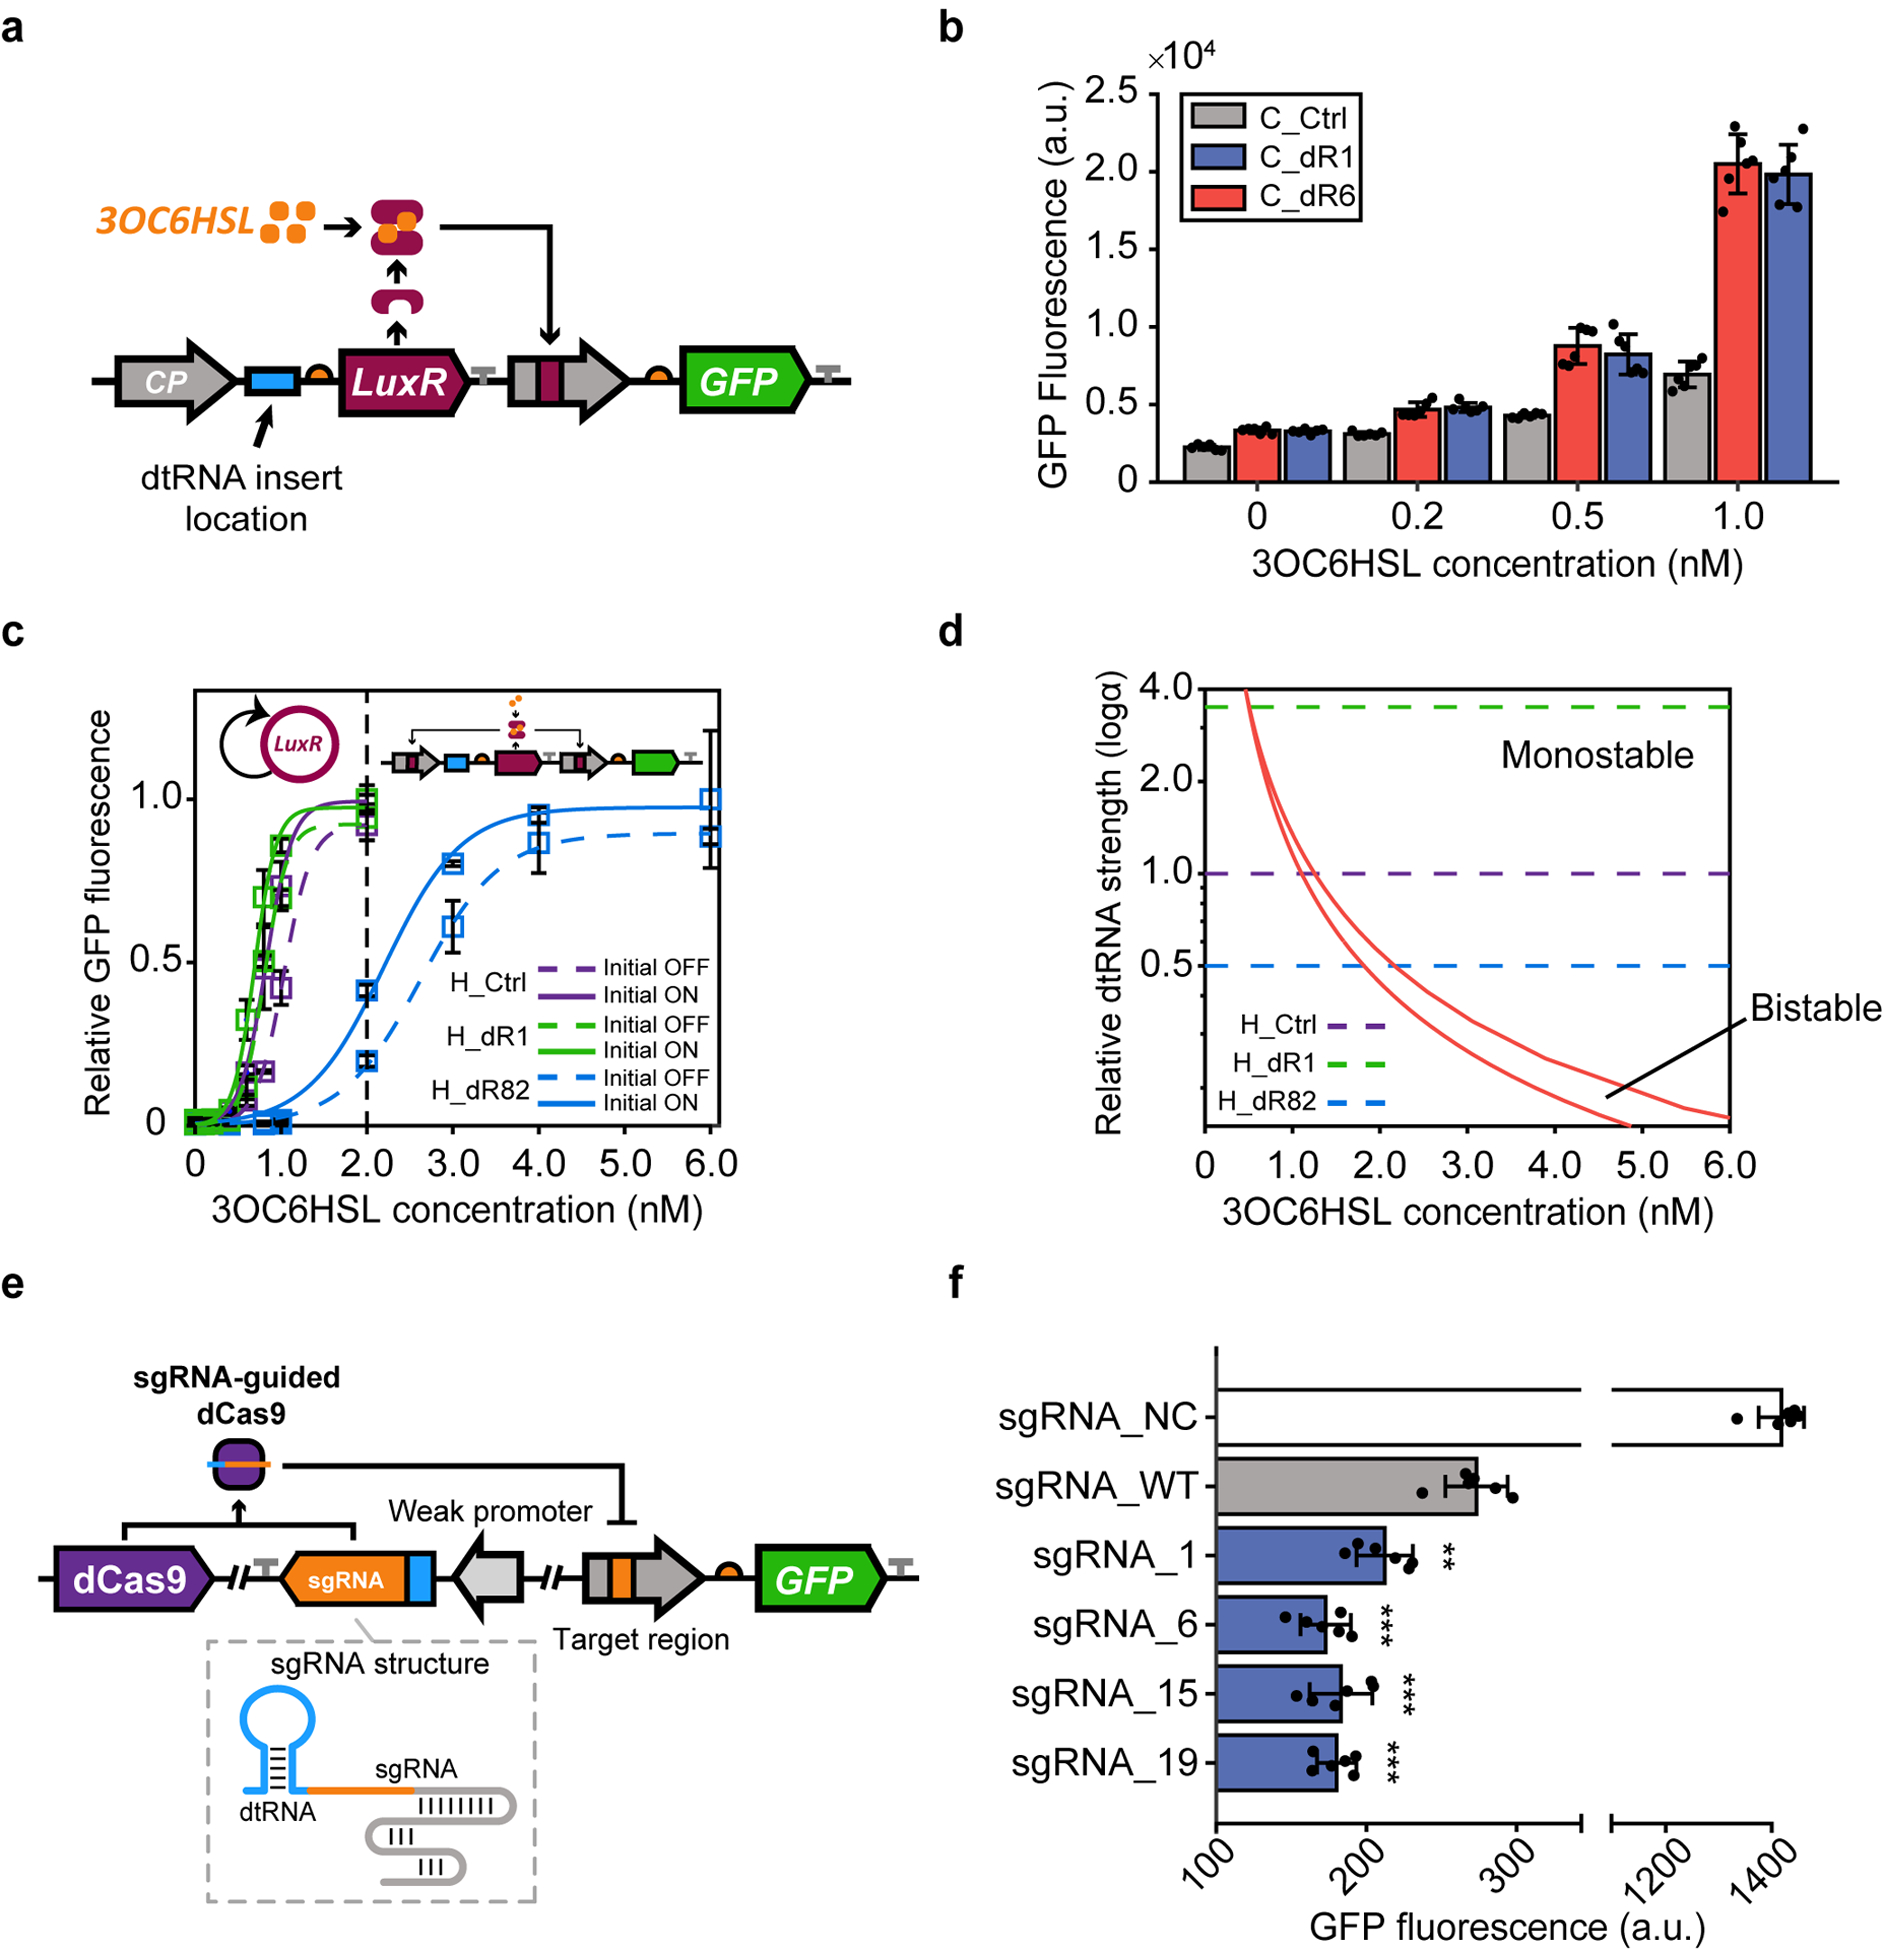
a, Schematic showing the construction of the LuxR/LuxI quorum sensing gene circuit where a constitutive promoter (gray arrow) triggers the expression of LuxR gene (purple rectangle). After being expressed, the LuxR protein dimerizes with 3OC6HSL (orange dots) and interacts with the pLux promoter to activate GFP gene expression (green rectangle). The blue rectangle represents the location of dtRNA insertion (dR1 and dR6). b, Dose-response measurement results induced by various 3OC6HSL concentrations. Data represent the mean ± SD of six biological replicates. c, Hysteresis experiment results for the synthetic positive feedback loop (Extended Data Fig. 5a). The zoomed in hysteresis result of 0 to 2 nM (dashed line) 3OC6HSL concentration can be found in Extended Data Fig. 5b. The data represents the mean ± SD of three biological replicates. d, Two-parameter bifurcation analysis result. The red lines mark the bifurcation between the monostability and bistability. e, Schematic showing CRISPRi regulation controlled by dtRNAs. Selected dtRNAs (dR1, dR6, dR15 and dR19) are integrated with sgRNA which can guide dCas9 to repress GFP expression. f, Steady state fluorescence measurement for each CRISPRi system. All redesigned sgRNAs exhibit even lower GFP level compared to the original sgRNA (sgRNA_WT). sgRNA_NC represents the negative control result. Data represents the mean ± SD of six biological replicates. P (sgRNA_1) = 0.00277, P (sgRNA_6) = 0.000217, P (sgRNA_15) = 0.000665, P (sgRNA_19) = 0.000027. ** P < 0.01, *** P < 0.001, P value is measured by two-tailed student’s t test.
To probe this impact on nonlinear gene circuit dynamics, synthetic dtRNAs were inserted into a LuxR/LuxI QS-based positive feedback loop to tune the bistability of each circuit41. The constitutive promoter in circuits C_dR1 and C_dR6 was replaced with a pLux promoter to form a positive feedback (circuit H_dR1 and H_dR6) (Extended Data Fig. 5a). Two weak dtRNAs (dR81 and dR82) were also inserted to tune the behavior of positive feedback circuit (H_dR81 and H_dR82). We measured the robustness of history-dependent response (hysteresis), the hallmark of positive feedback, to determine the dynamics of each circuit42. A small bistable region is first observed for circuit H_Ctrl without dtRNA regulation (Fig. 3c, purple lines). The bistable regions of circuit H_dR1 and H_dR6 regulated by dtRNA structures shifted to lower 3OC6HSL concentration because of increased LuxR transcript stability and in turn increased LuxR protein abundance, which make it easier for the system to switch to the ON state (Fig. 3c and Extended Data Figs. 5b, c, green lines). We also observed enlarged bistable regions for circuits regulated by weak dtRNAs at higher 3OC6HSL concentration (Fig. 3c and Extended Data 5c, blue lines). To better explain our experimental data, we constructed a mathematical model of a positive feedback circuit regulated by dtRNAs and performed two-parameter bifurcation analysis on the system. The result validates our data that dtRNAs with stronger stabilizing capability generate smaller bistable regions localized at low inducer concentrations, while weaker dtRNA regulation resulted in a larger bistable region shifted to high drug concentrations (Fig. 3d). Thus, this experiment illustrates the capacity of dtRNAs to fine tune gene circuit dynamics.
To explore the tunability dtRNAs offer for noncoding RNA levels, we built a CRISPR interference system to control small guide RNA (sgRNA) levels by redesigning the 5’ sequence of an sgRNA targeting a GFP promoter with dR1 and dR6, and two other top-performing dtRNAs (dR15 and dR19). When transcribed from a weak promoter, each redesigned sgRNA can guide dCas9 to bind with the cognate promoter region to inhibit downstream GFP expression (Fig. 3e). Stable sgRNAs are more likely to interact with dCas9 for stronger GFP inhibition. Indeed, we found that GFP fluorescence from cells expressing redesigned sgRNAs was significantly lower, yielding about 22% to 36% decrease compared to the original sgRNA lacking dtRNA stabilization (sgRNA_WT). These results demonstrate that noncoding RNA levels can also be tuned by synthetic dtRNAs (Fig. 3f).
In vitro regulation of gene and RNA aptamer production.
Cell-free expression systems have been widely used in synthetic biology, metabolic engineering and in vitro diagnostics4,43,44. To test whether synthetic dtRNAs enable regulation of gene expression in cell-free expression systems, we constructed two circuits with dtRNAs that showed good performance with sgRNAs (dR15 and dR19) along with two additional circuits with randomly selected top-performing dtRNAs (dR4 and dR7) to measure their impact on GFP expression in cell-free transcription-translation systems (Supplementary Fig. 1). Triple guanines (GGG) were inserted at the 5’ end of the dtRNAs to ensure efficient transcription via T7 RNA polymerase.
We first performed measurements without the addition of RNase inhibitor to each reaction (-RNase inhibitor). Fig. 4a (top) shows that GFP fluorescence of each circuit starts to increase shortly after the reaction begins, and it reaches a steady state after about an hour of reaction (Extended Data Fig. 6a). Steady-state GFP fluorescence is much stronger for the circuits regulated by synthetic dtRNAs, where the circuit regulated by dR7 displays about a 10-fold fluorescence enhancement. Enhancement effects can also be detected for each reaction with RNase inhibitor treatment (Fig. 4a, bottom and Extended Data Fig. 6b). In both cases, the dtRNAs significantly increased GFP fluorescence compared to the control.
Fig. 4 |. In vitro regulation of gene expression and RNA aptamer production via synthetic dtRNAs.
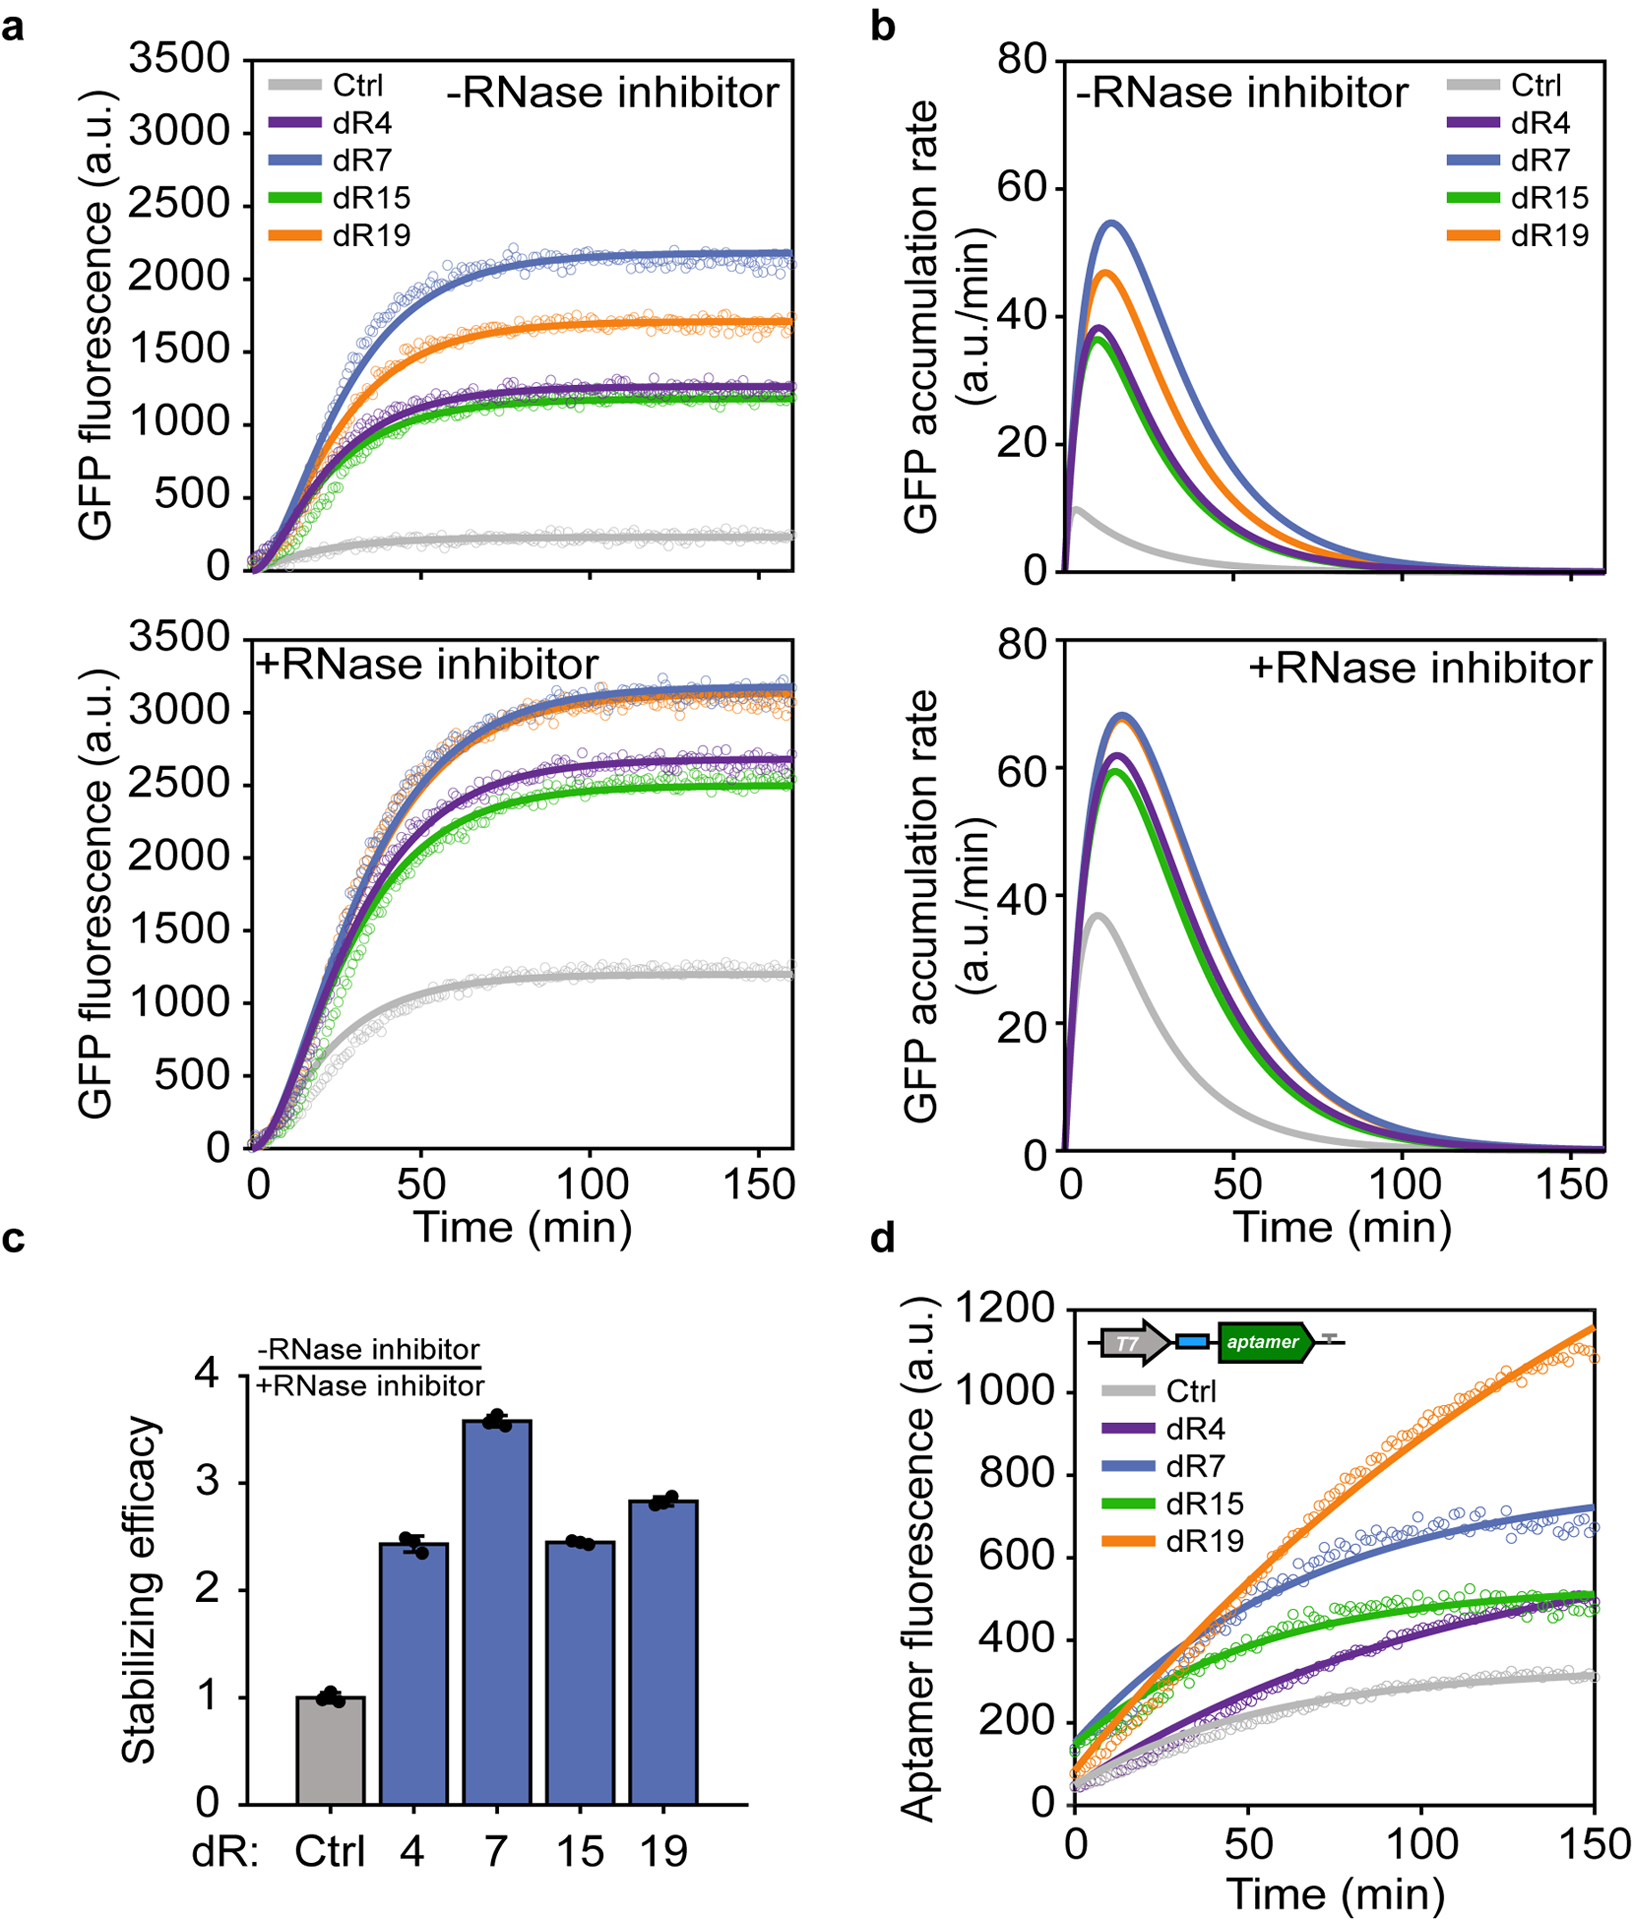
a, GFP expression measurement over time regulated by dtRNAs without (top)/with (bottom) RNase inhibitor treatment. Colored circles represent the observed mean GFP fluorescence of each design; solid lines represent model fitting results for each design. GFP fluorescence is measured every 50 seconds. b, Model simulation of GFP accumulation rate regulated by dtRNAs without (top)/with (bottom) RNase inhibitor treatment. c, Bar chart result shows the stabilizing efficacy of each dtRNA. Stabilizing efficacy is defined as the ratio between steady state GFP without RNase inhibitor and with RNase inhibitor treatment. The resultant values are further normalized against the control value. Data represent the mean ± SD of three biological replicates. d, RNA aptamer assay result showing Broccoli aptamer fluorescence regulated by dtRNAs (dR4, dR7, dR15 and dR19). Colored circles represent the observed aptamer fluorescence; solid lines represent model fitting results for each design. Aptamer fluorescence is measured every 90 seconds.
To better quantify gene expression enhancement due to increased RNA stability, we constructed a dynamic model to describe dtRNA-regulated GFP expression enhancement in both scenarios (Fig. 4a, solid lines). The simplified model includes only transcription and translation without nonlinear terms because the cell-free system provides abundant molecular resources. The analytically solved model is fitted against the experimental time course directly. Using model-fitted parameters, we calculate GFP accumulation rates over time in both scenarios, where circuits regulated by dtRNAs display much faster GFP accumulation rates compared to the control (Fig. 4b). Theoretical derivations reveal that the time required for the GFP accumulation rate to reach its maximum (peak of the curve) is only dependent on the mRNA and protein degradation rates. Given that protein degradation rates remain constant for all scenarios, the right-shifted peaks of dtRNAs mathematically support decreased mRNA degradation rates.
Stabilizing efficacy, defined as the ratio between the steady state GFP concentration without RNase inhibitor and with RNase inhibitor treatment, measures the robustness of dtRNAs in vitro against RNase activities (compare Fig. 4a top and bottom). Fig. 4c shows that all dtRNAs display over 2-fold stabilizing efficacy compared to the control. dR7 yields the strongest enhancement at 3.6-fold, illustrating the stability of dtRNAs even in the presence of RNase. The environmental dependence of the dtRNA’s stability enhancement potential is further quantified by comparing relative GFP intensities in live bacteria cells or in cell-free systems (Extended Data Fig. 7a). It can be seen that the dtRNA stabilization capacity is most pronounced in vitro without RNase inhibitor.
To further investigate the effect of dtRNA on RNA stability in vitro, we next coupled dtRNAs to the RNA aptamer Broccoli to test whether dtRNAs can influence RNA levels in cell-free expression systems. 65 dtRNAs spanning the dynamic range of the library were ligated to the 5’ end of the Broccoli aptamers, and their fluorescence was measured using a plate reader. It can be seen that most of the dtRNAs significantly enhanced the aptamer fluorescence (Extended Data Fig. 7b). However, we did not observe significant correlations between in vivo GFP enhancement and cell-free aptamer regulation, probably due to different mechanisms between GFP expression in E. coli and in vitro aptamer transcription in their respective expression systems (Extended Data Fig. 7c). One interesting finding is that dtRNAs of small size (3 bp or 6 bp stems) tend to strongly enhance aptamer fluorescence (Extended Data Fig. 7c, green circles). To further show that dtRNAs can be used to directly manipulate Broccoli aptamer levels, we compared four dtRNAs (dR4, dR7, dR15 and dR19) that were used to regulate in vitro GFP expression. We used a mathematical model to fit their experimental data (Supplementary Fig. 2). Interestingly, all four dtRNAs exhibited increased aptamer fluorescence in cell-free expression systems, out of which dR19 showed a nearly 4-fold enhancement compared to control (Fig. 4d). By fitting model parameters, we also calculated the half-life of each regulated aptamer (Supplementary Table 5). These results demonstrate that dtRNAs can be applied to directly regulate RNA aptamer production with a wide dynamic range in cell-free systems.
Improved viral diagnostics using hybrid sensors.
The toehold switch is a programable RNA device that can interact with a user-specified target RNA to activate translation of a protein of interest10 and has been widely applied in areas including in vitro viral diagnostics4,45, gene circuit engineering12,43 and education46. Toehold switches feature a long single-stranded region known as a toehold at their 5’ end that is designed to initiate binding with the target RNA. However, transcripts with excessive 5’ single-stranded regions can be readily targeted and digested by RNases (Extended Data Figs. 2c, d). This phenomenon was observed in our Broccoli aptamer assay where aptamers with a longer 5’ single-stranded region showed reduced fluorescence (Extended Data Fig. 7d). To address this limitation, we coupled toehold switches with dtRNAs to improve their performance in a diagnostic assay. These hybrid systems were constructed by inserting dtRNAs at the 5’ end of an existing toehold switch designed for detection of norovirus in paper-based cell-free reactions (Fig. 5a). Five hybrid systems were designed using the main structure of the dtRNA with the best performance in in vitro gene expression measurements and the aptamer assay (dR19, Figs. 4c and 4d). Hybrid systems were constructed with different combinations of 5’ spacing and insulator sequences (details in Supplementary Dataset 1): dR19_1 (2-nt 5’ spacing, 6-nt insulator), dR19_2 (2-nt 5’ spacing, 10-nt insulator), dR19_3 (2-nt 5’ spacing, 18-nt insulator), dR19_4 (6-nt 5’ spacing, 6-nt insulator) and dR19_5 (8-nt 5’ spacing, 6-nt insulator). The β-galactosidase (lacZ) α peptide (lacZα) was used as the reporter as previously described45.
Fig. 5 |. Redesigned dtRNA/toehold switch sensors improve the performance of paper-based viral diagnostics.
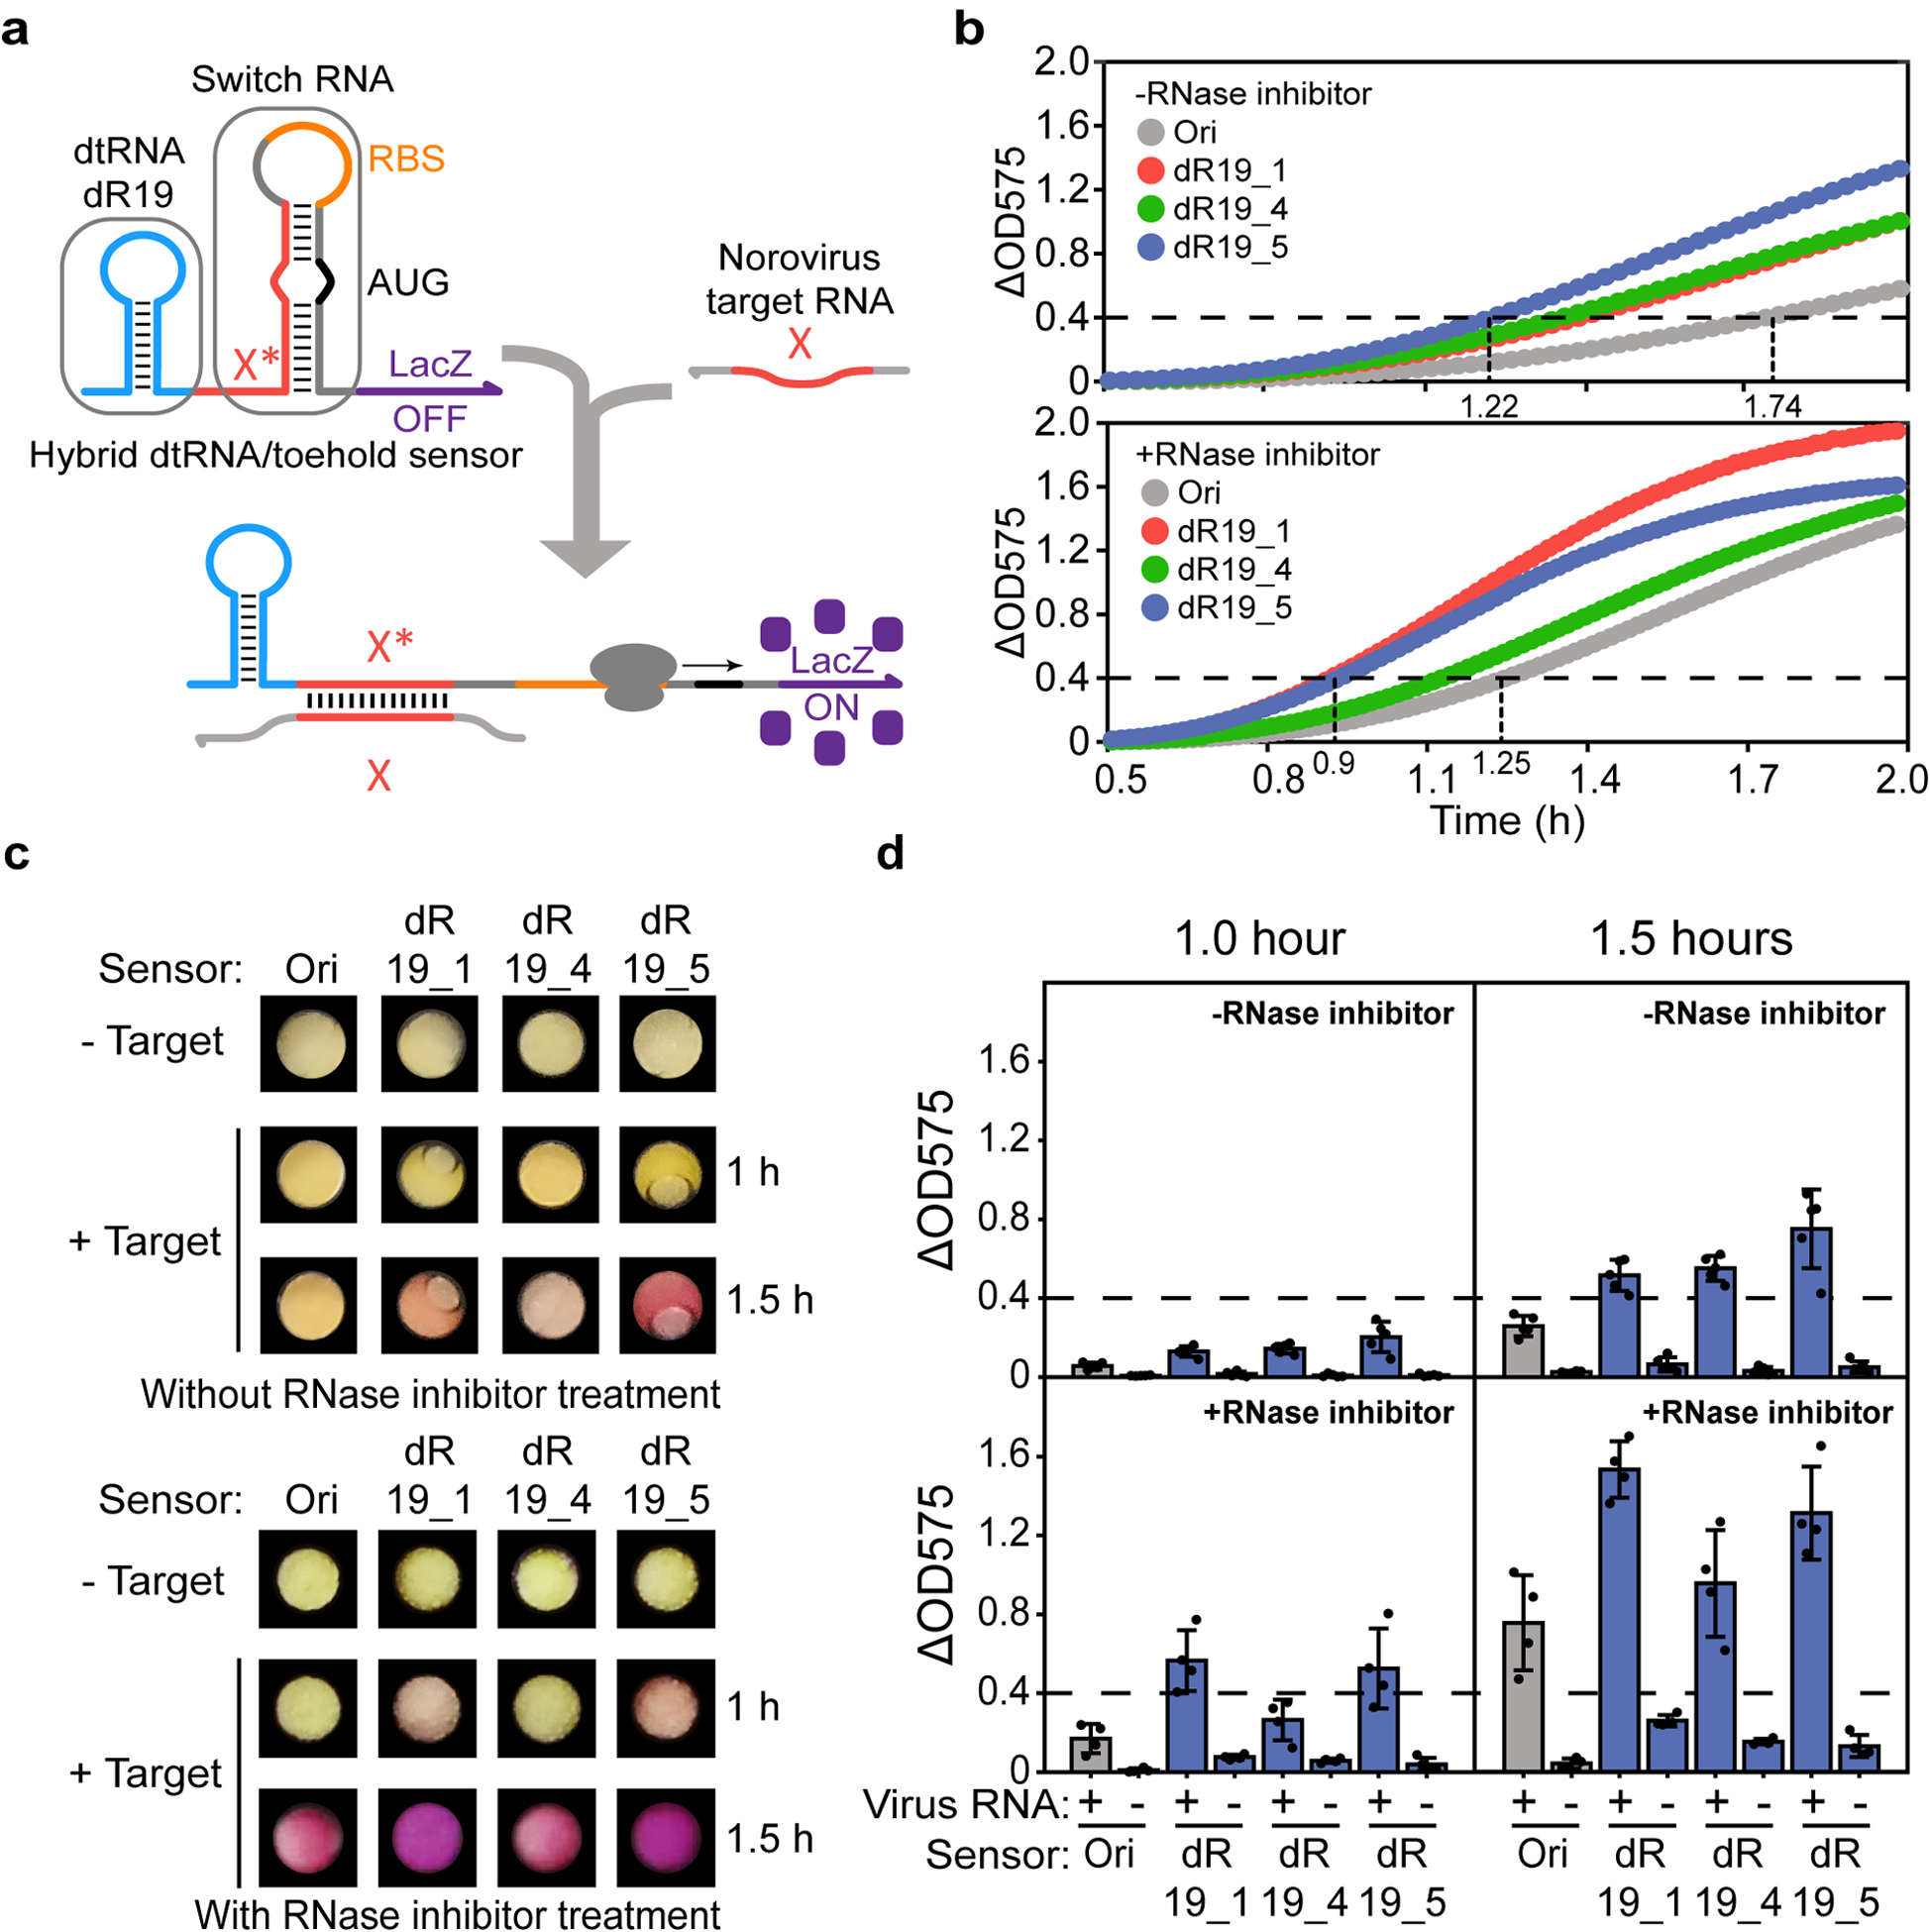
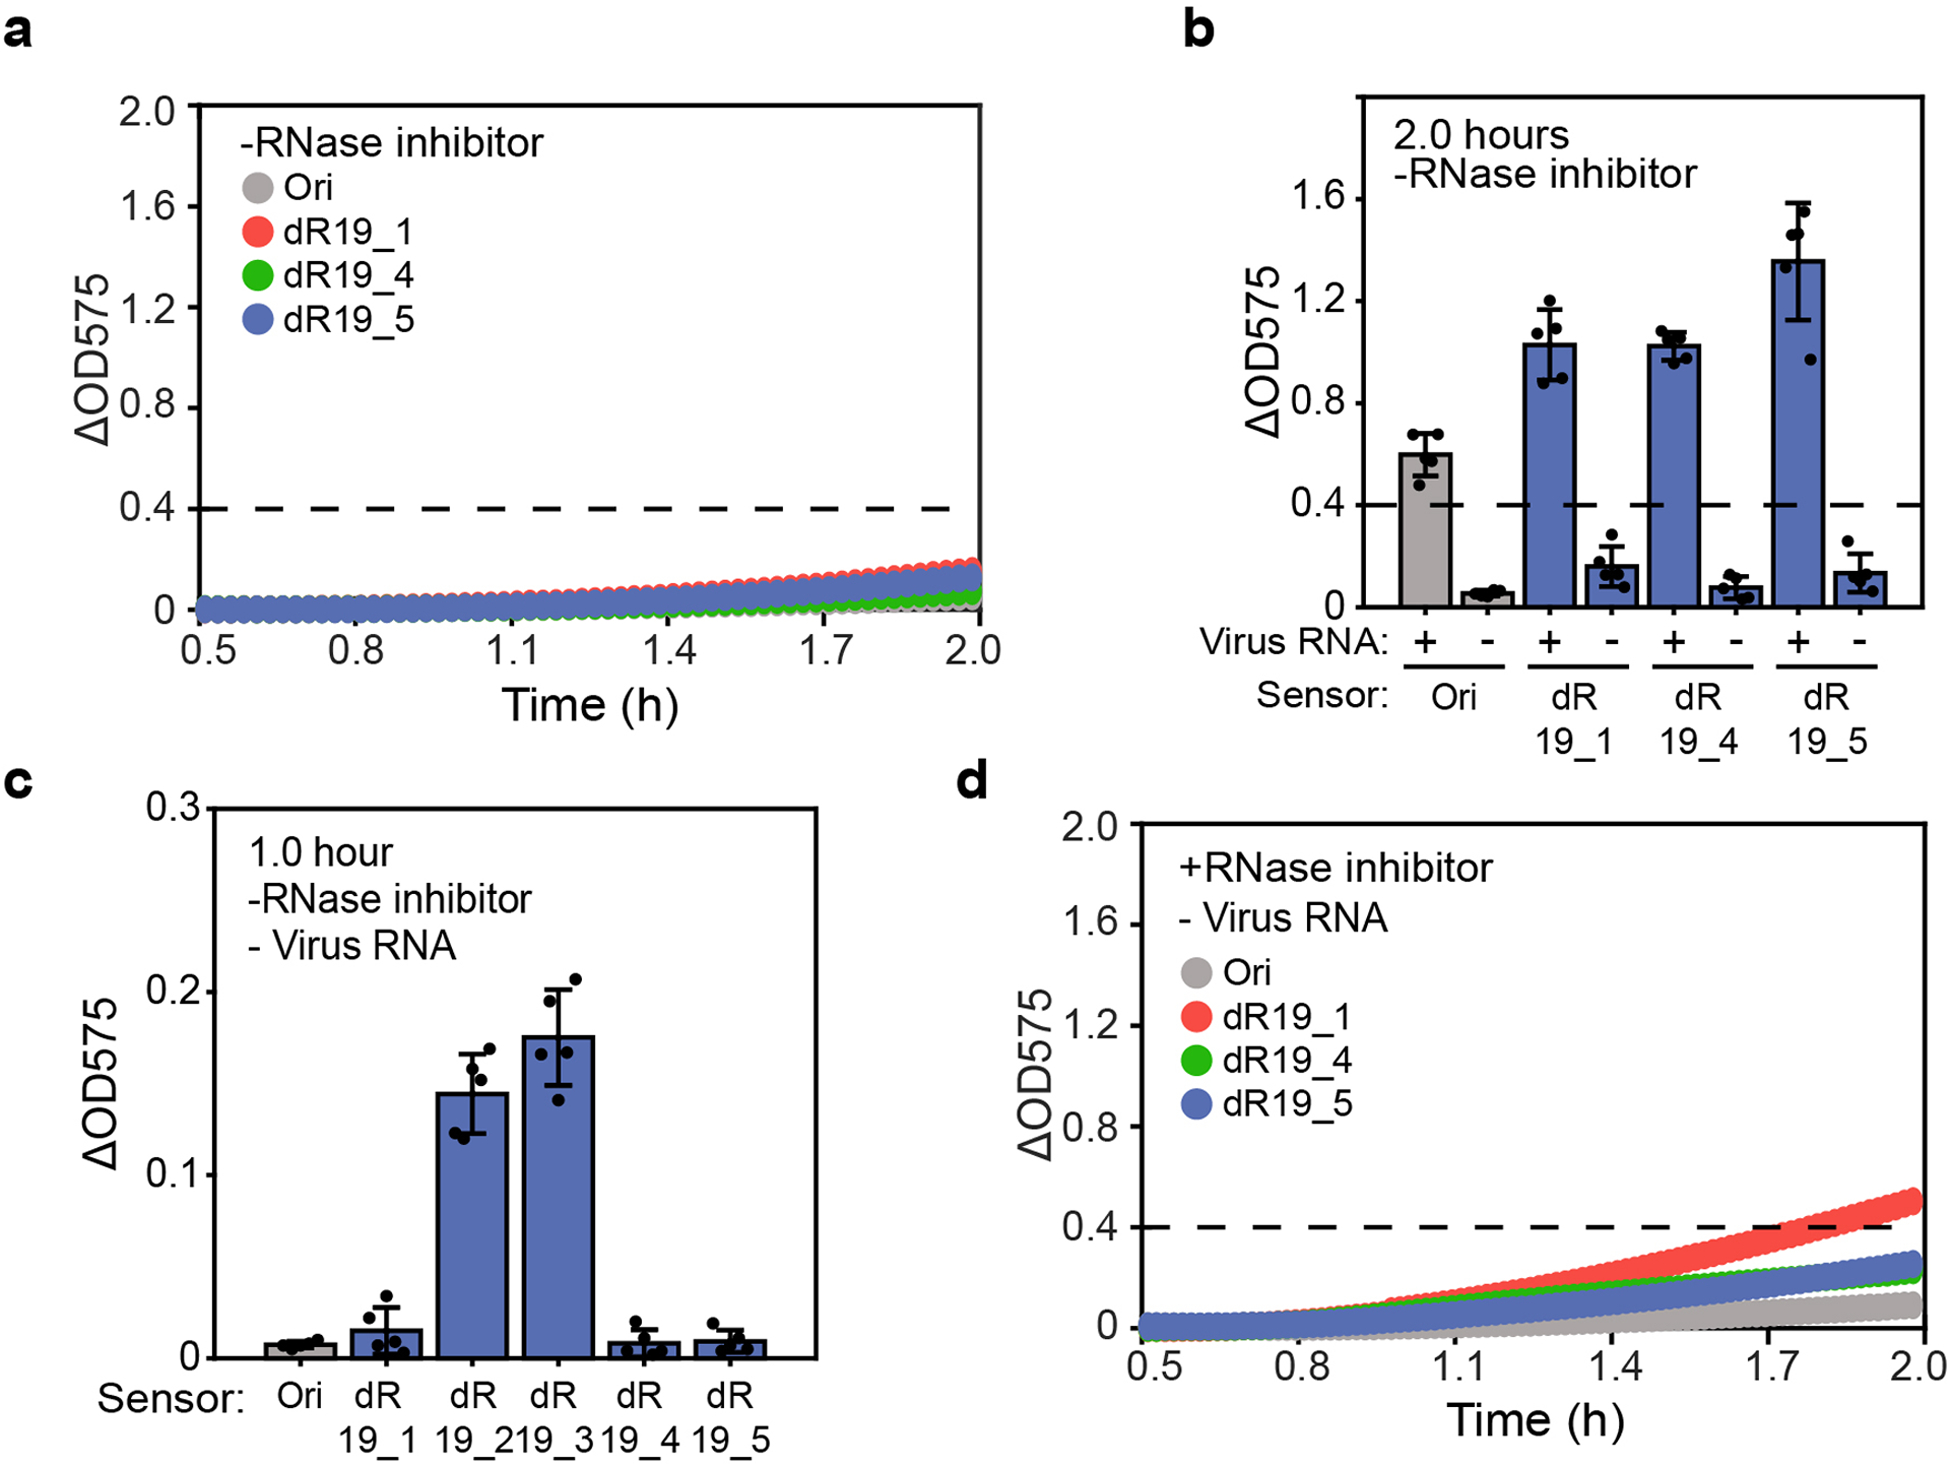
a, Schematic showing the structure of redesigned toehold switch sensors and their recognition of target RNAs. The dtRNA (dR19) is integrated upstream of the sensor for stabilization. During viral RNA recognition, the target RNA with a sequence X is recognized by the complementary X* region in the toehold switch. Binding through the single-stranded toehold region enables unwinding of the sensor hairpin to expose the RBS and start codon AUG for translation initiation. The synthetic dtRNA maintains its stable structure and protects the whole sensor transcript during the reaction. b, Norovirus diagnostics results without (top) and with (bottom) RNase inhibitor treatment. Each curve represents the average OD value of five reaction replicates. The details of each diagnostic result are shown in Supplementary Fig. 3. c-d, Photographs and their corresponding diagnostic results for each sensor after 1- or 1.5-hour reactions with/without RNase inhibitor treatment, respectively. + represents the addition of synthetic norovirus RNA to the sensor. - represents the negative control. The dashed line indicates the detection threshold for each device (ΔOD575 = 0.4). The data represents the mean ± SD of at least four biological replicates.
To test these hybrid sensors in paper-based diagnostic systems, synthetic norovirus RNA was introduced to paper-based devices containing cell-free reactions and DNA templates for transcription of the sensors without RNase inhibitor present. We observed that sensors with dtRNAs (dR19_1, dR19_4 and dR19_5) exhibited faster detection speed (1.22 hours, ΔOD575 = 0.4) without leaky expression, while the original sensor (Ori) without dtRNA only showed detectable signals after 1.74 hours of induction (Fig. 5b, top and Extended Data Figs. 8a, b). Sensor dR19_2 and dR19_3 exhibited leaky expression and thus were not subjected to further experiments (Extended Data Fig. 8c). To test if the detection speed could be further improved, we proceeded to treat the paper-based device with RNase inhibitor for the second-round diagnostics. Remarkably, we found that all devices showed even faster detection speed against the group not treated with inhibitor, where signals of sensor dR19_1 and dR19_5 can be discerned within an hour (0.9 hour), indicating that the 5’ dtRNA structure can significantly improve the speed for viral diagnostics with RNase inhibitor treatment (Fig. 5b, bottom). At the same time, however, higher expression leakage is also observed for each device, indicating the addition of RNase inhibitor, although accelerating reaction speed, can also increase the likelihood of false positive results (Extended Data Fig. 8d). Further analysis demonstrates that non-inhibitor-treated sensor dR19_5 displays low expression leakage but faster diagnostic speed than the original sensor (Ori) in the presence of RNase inhibitor. Thus, hybrid sensors enhanced with dtRNAs can exceed the performance of standard toehold switch assays without requiring the addition of RNase inhibitor. From photographs and their corresponding diagnostic results, we confirm the improvement of viral diagnostics by using the hybrid dtRNA/toehold switch devices (Figs. 5c, d). The details of each reaction can be found in Supplementary Fig. 3.
Discussion
Many methods have been developed to meet the increasing demand for precise and predictable control of gene expression. Naturally occurring RNA stabilizers or engineered 5’ stability hairpins that thwart RNase activity hold the potential to directly control RNA half-life and have been applied to regulate cellular RNA levels as well as heterologous protein yields30,31,34,35. In this study, we systematically identify RNA structural features that influence stability, design a library of synthetic dtRNAs, and use them to tune gene expression levels in vivo and in vitro. We find that application of structure-stability relationships discerned from the library enables semi-quantitative predictions of the performance of newly designed dtRNAs. Moreover, we demonstrate multiple applications of dtRNAs by using them to increase the strength of CRISPR interference, tune gene circuit behavior and aptamer stability, and to enhance the speed and stability of paper-based viral diagnostics.
Previous studies have investigated 5’ stabilizing elements with an interest in increasing mRNA stability and understanding RNase substrate specificity30,31,33, while others have designed 5’ UTRs to manipulate translation of mRNAs36. Specifically, portable mRNA-stabilizing 5’-UTR sequences have been demonstrated to increase GFP mRNA stability33. In this work, we engineered and tested a more comprehensive set of hairpins with systematically designed secondary structures that are able to not only tune RNA stability up, but also destabilize RNA molecules. Expanding earlier work of analyzing free energy (ΔG) of hairpin designs31, we systematically explored the structural feature space with the aim to elucidate dtRNA’s structure-stability relationships. Our results demonstrate that 5’ UTR RNA secondary structure can be engineered with varying features to achieve wide dynamic range over RNA stability regulation, in turn allowing precise control over gene expression and non-coding RNA activity. Moreover, compared to engineered synthetic promoter and RBS libraries, it is relatively easy to construct dtRNAs following our design rules in diverse engineering scenarios. Similar to previous studies, our work also confirms that gene expression regulation by dtRNA modules exert little effect on cell growth, indicating that compared to the other gene expression regulation methods, RNA manipulation renders less burden for cell economy (Fig. 2e, inset)33,47. Furthermore, our modest success in predicting dtRNA stabilizing capabilities suggests the possibility of fully designing dtRNAs in silico when enough nearby RNA secondary context is taken into consideration (Extended Data Fig. 4b). The utility of such dtRNA libraries combining high dynamic range with fine gradations in output is demonstrated in applications such as changing output behavior of synthetic circuits and viral diagnostics.
When assessing mRNA lifetime, it is important to note that degradation and translation are closely intertwined processes. In theory, a stable mRNA has a higher chance for ribosome binding and highly translated RNAs can also be shielded by active ribosomes that serve to protect against RNase activities. This positive side effect of enhanced RNA stability can be observed in our RT-qPCR results where RNA fold increase can account for over 94% but still not all GFP expression increases (Extended Data Fig. 4a).
We also applied our dtRNA modules to directly upregulate gene expression and tune RNA aptamer levels in cell-free expression systems with a 10-fold dynamic range. Interestingly, we did not observe significant correlations between GFP and aptamer fluorescent enhancement, suggesting a complex relationship between RNA abundances and translation in vitro that merits further study. An RNA-based device, the toehold switch sensor, is optimized with our dtRNAs for paper-based viral diagnostics. Higher detection sensitivity with low expression leakage is achieved using the redesigned sensors, making them more compatible for potential field-ready diagnostics. More importantly, dtRNA robustness against RNase activities suggests that they can also be used to enhance expression in crude-extract-based cell lysates, which are substantially cheaper to produce but have higher RNase levels48,49. Previous work has shown that native 5’ UTR structures can be used to enhance gene expression in such cell-free reactions50. Overall, our work provides a purely RNA-based method to regulate gene expression in vivo and in vitro that can be used for a variety of different biotechnological applications.
Online content
Methods
Strain, media and culture condition
All molecular cloning experiments were performed in Escherichia coli DH10B (Invitrogen). Synthetic circuits (Fig. 3) were tested in E. coli K-12 MG1655 with lacI-/−. Cells were grown at 37°C in liquid and solid Luria-Bertani (LB) broth medium with 100 μg/mL ampicillin or 50 μg/mL kanamycin, and were shaken in 5-mL or 15-mL tubes at 220 rotations per minute (rpm). The chemical 3OC6HSL was dissolved in ddH2O and were further diluted to various working concentrations for dose-response and hysteresis measurements.
Plasmid construction
Most genes were obtained from the iGEM Registry (http://parts.igem.org/Main_Page). Plasmids were constructed based on general molecular biology techniques and standardized Biobrick cloning methods as previously described51. For example, to assemble GFP gene (E0040) with a strong RBS (B0034), plasmids with GFP gene were digested with xbaI and PstI as the cloning insert while plasmids containing RBS were digested with SpeI and PstI as the cloning vector. Digested plasmids were then separated on 1% TAE Agarose gel by gel electrophoresis. Gel bands with correct insert or vector size were selected and purified using the PureLink gel extraction Kit (Invitrogen). Gel extraction products with insert and vector were ligated by T4 DNA ligase (New England Biolabs, NEB) and transformed into E. coli DH10B. Transformed cells were plated on LB agar plates with 100 μg/mL ampicillin, or 50 μg/mL kanamycin for screening. In the end, plasmids extracted by GenElute HP MiniPrep Kit (SIGMA-ALDRICH) were confirmed through gel electrophoresis (digested by EcoRI and PstI) and Sanger DNA Sequencing (Biodesign Sequencing Core, ASU). Similar Biobrick cloning steps were taken for the following genetic components until the entire circuit has been constructed. All names and Biobrick number of genetic components can be found in Supplementary Table 1.
For construction of the circuits with dtRNAs or sgRNAs, each structure was analyzed and designed by the NUPACK design package52 and their respective DNA oligos were synthesized by IDT. Biobrick XbaI and PstI cleavage sites were added at 5’ or 3’ end of the DNA oligos. DNA Oligos for the same dtRNA were diluted with ddH2O and hetero duplexed on a heat block and were further ligated into the plasmids with the promoter digested by XbaI and PstI. The guide sequence of sgRNA or redesigned sgRNAs were designed and then synthesized by IDT. The sequence 5’-GCTA-3’ and 5’-AAC-3’ were added on sgRNA forward and reverse primers, respectively. DNA oligos for the same sgRNA were diluted by ddH2O, hetero duplexed on a heat block and ligated to the vector digested by SapI as previously described53. The rest of the cloning steps remain the same as the general gene circuit construction. The details of all sequences can be found in the Supplementary Dataset 1.
Plate reader OD and fluorescence measurements.
All sequencing-confirmed gene circuits were transformed into E. coli DH10B. Single colonies were picked and cultured in 4 mL of LB medium with 100 μg/mL ampicillin. Cells were shaken until they were evenly distributed in the medium of which 300 μL were transferred into 96-well plate for OD and fluorescence measurements. Optical density (OD600) and fluorescence (excitation: 485 nm; emission: 530 nm) were measured every 15 minutes at 37°C under continuous plate shaking (Synergy H1 Hybrid Reader, BioTek) at 220 rpm over 21 hr. For all the experiments, at least three random colonies were picked as biological replicates. For stable protein expression, we chose the 16-hour data point for further analysis in the study unless specified. Data were collected using Gen5, version 2.00 and analyzed by MATLAB, R2018b (MathWorks) and Microsoft Excel (Microsoft 365).
Flow cytometry measurements
We used an Accuri C6 flow cytometer to perform the flow cytometry measurements (Becton Dickinson). Cultured samples were collected and run through the flow cytometer. For each sample, 20,000 individual cells were analyzed at the slow flow rate and the fluorescence intensity was not normalized with the cell density because it only measured single cell data. All the results were then collected in log mode using CFlow Plus software, version 1.0.264.15 and were further analyzed by MATLAB, R2018b (MathWorks) and Microsoft Excel (Microsoft 365).
RT-qPCR
For selected gene circuits, three biological replicates were used to quantify the mRNA levels. Total RNA was extracted from the 2 mL of cell culture using the Quick-RNA Fungal/Bacterial Miniprep Kit (Zymo Research). Purified RNA was treated in column with DNaseI (Zymo Research) to remove the extra DNA. Total RNA was eluted by nuclease-free water and the concentration quantified for the following experiments. cDNA was then synthesized from each RNA sample using iScript Reverse Transcription Supermix for RT-qPCR (Bio-Rad). For each 20-uL reaction, about 1 μg RNA was used for reverse transcription. qPCR was performed for each cDNA sample using iTaq Universal SYBR Green Supermix (Bio-Rad) and the experiment reaction was detected using the iQ5 Real-Time PCR detection system (Bio-Rad). Specifically, each cDNA sample contains an extra technical replicate, the total reaction volume for each sample is 10 μL and prokaryotic 16S rRNA was set as the endogenous control. We used previous reported primers (IDT) for both 16S rRNA and GFP amplification32. The sequence of primers for 16S rRNA are 5’-GAATGCCACGGTGAATACGTT-3’ (rrnB, forward, starting at the 1361st nucleotide), and 5’-CACAAAGTGGTAAGCGCCCT-3’ (rrnB, reverse, starting at the 1475th nucleotide) and the sequence of GFP primers are 5’-CAGTGGAGAGGGTGAAGGTGA-3’ (forward, starting at the 87th nucleotide); and 5’-CCTGTACATAACCTTCGGGCAT-3’ (reverse, starting at the 283th nucleotide). Bio-rad CFX Manager software version 3.1 was used to analyze the data. To investigate the fold change over mRNA levels, we averaged each Ct value of 16S rRNA and GFP with their biological replicates and calculated the delta Ct based on Cttarget – Ct16S. Fold change for each sample was further calculated according to the biological control (circuit without dtRNA regulation) by 2−(ΔΔCt). The minimum information for publication of quantitative real-time PCR (MIQE) is also provided in Supplementary Table 2.
Hysteresis experiments
We used our previously reported protocol to perform the hysteresis experiments20. In detail, gene circuits of the synthetic positive feedback loop were constructed in a low-copy plasmid and transformed into E. coli K-12 MG1655 strain with lacI-/−. Single colonies for three replicates were picked for each sample and cultured at 37°C, 220 rpm overnight in LB medium with 50 μg/mL kanamycin. For OFF-ON experiments, overnight cultured cells (initial OFF cells) were diluted into fresh LB medium at a 1:100 ratio and distributed into 5-mL polypropylene round-bottom tubes (Falcon) with various 3OC6HSL concentrations. Fluorescence of each sample was measured using an Accuri C6 flow cytometer (Becton Dickinson). In our experiments, GFP fluorescence became stable after ~12 hours of induction. For ON-OFF experiments, cells were first induced by 2 nM 3OC6HSL for 12 hours to ensure the fully induction as the initial ON state. These ON state cells were then collected through low speed centrifugation, washed once and further diluted to the fresh LB medium at 1:100 ratio. Various 3OC6HSL concentrations were then added to each sample for culture. Flow cytometry measurements were performed at 12 and 16 hours, respectively. We used 16-hour results as the ON-OFF dataset in Fig. 3 and Extended Data Fig. 5.
RNA aptamer assay
Sequences of dtRNA-regulated Broccoli aptamers were designed using NUPACK and were further synthesized from IDT. T7 promoter and terminator sequences were inserted to each redesigned aptamer through PCR. Amplified double-stranded DNA molecules were purified using MinElute PCR purification kit (QIAGEN) and measured their concentration via Nanodrop spectrophotometer. Purified DNA was then diluted and mixed with cell-free transcription-translation systems (PURExpress, NEB). Each sample with 4 uL reaction mix was loaded to the 384 well plate for a five-hour plate reader measurement, and the fluorescence of each sample reached the peak value after about two-hour incubation at 37°C. In this experiment, we used a 30-nM DNA concentration for each sample for the reactions and the fluorescence was measured every 90 seconds.
Hybrid dtRNA/toehold sensor plasmid construction
Synthetic DNAs encoding the redesigned norovirus-specific toehold sensors were synthesized by IDT. All cloning steps are following the general molecular biology technologies. Synthetic DNAs were amplified by PCR and inserted into the plasmid backbone using Gibson assembly54. Complete plasmids were further confirmed by Sanger sequencing (Biodesign Sequencing Core, ASU). Plasmids and primers were described previously45.
Paper-based cell-free systems preparation
The protocols used for the paper-based cell-free reactions have been described previously45. Briefly, cell-free transcription-translation systems (PURExpress, NEB) were used to prepare the freeze-dried samples. The volume for each component of the reaction sample is 40% of cell-free solution A, 30% of cell-free solution B, 2% RNase inhibitor (Roche, 03335402001, distributed by MilliporeSigma) if needed, 2.5% chlorophenol red-b-D-galactopyranoside (Roche, 10884308001, distributed by MilliporeSigma, 24 mg/mL) and the remaining volume for toehold sensor DNA, lacZω and nuclease-free water. The final concentration for the synthetic DNA plasmid of each paper device is 30 ng/μL. The paper for the assays was first cut to a 2-mm diameter using a biopsy punch and transferred into PCR tubes. The prepared cell-free reaction mix (1.8 μL for each device) was then added into the PCR tubes with the paper disks and flash frozen in liquid nitrogen. Frozen devices were transferred to a lyophilizer to freeze-dry overnight. Completely dry paper devices were ready for use as viral diagnostics and can be stored at room temperature as previously described43,45.
Mathematic modeling for positive feedback circuit analysis
We constructed a mathematical model to clarify the underlying mechanism of the dynamic changes of a positive feedback circuit regulated by dtRNAs. We used a 2D ordinary differential equation (ODE) describing the transcription and translation process:
| [Eq1] |
| [Eq2] |
where
| [Eq3] |
[Eq1] describes the luxR mRNA transcription and degradation process. is the abundance of luxR mRNA. stands for leakage transcription rate of lux promoter without binding of LuxR, while represents the transcription rate with [LuxR-3OC6HSL]2 complex bound to the lux promoter, given in Hill Equation form55. is the maximum transcription rate when all lux promoters are fully bound by [LuxR-3OC6HSL]2. stands for functional LuxR protein abundance that are activated through binding with 3OC6HSL. is the square of the dissociation constant of lux promoter and [LuxR-3OC6HSL]2 binding. The mRNA degradation process is given by a linear form is the degradation rate without dtRNA. The effect of dtRNA is measured by , the relative dtRNA strength. if there is no dtRNA regulation. if dtRNA stabilizes mRNA and thus increases protein expression, while if dtRNA facilitates mRNA degradation and thus decreases protein expression.
[Eq2] describes LuxR protein translation and degradation process. is total LuxR protein concentration in system, including free LuxR and LuxR bound with 3OC6HSL and/or lux promoter. The mRNA translation is given by a Michaelis-Menten kinetics form , where is the maximum translation rate and is the Michaelis-Menten constant, i.e. mRNA abundance when translation rate reaches half of maximum value . LuxR protein degradation takes simple linear form , where is the degradation rate of LuxR protein.
The relationship of total LuxR abundance and functional LuxR abundance is given by [Eq3] in Hill Equation form41. stands for concentration of 3OC6HSL. describes the cooperativity of 3OC6HSL-LuxR binding. is the dissociation constant of 3OC6HSL-LuxR binding.
Using these ODE equations, we analyzed the dynamics of the self-activation system with XPPAUT (XPPAUT 8.0 January 2016)56. Parameter values used during analysis are shown in Supplementary Table 4. A two-parameter bifurcation regarding and is performed (Fig. 3d). As we can see, the bistable region shifts to the low drug concentration as the increase of dtRNA strength ().
Mathematic modeling and data fitting for cell-free gene expression analysis
When analyzing in vitro experiments, we used a mathematical model to help interpret results. Modeling of transcription and translation steps can take different forms because of different levels of details considered. A simple model only considers them as linear production and degradation41,57. Some models use Michaelis-Menten or Hill-function-like terms to describe production or degradation processes, to account for nonlinear bottleneck or saturation effects due to the limitations of cellular machineries51,55,58. Since the cell free system provides abundant molecular machinery for transcription and translation, we chose to use a simplified model that includes only transcription and translation steps without nonlinear terms. There are only four parameters in our simplified model. Two production rates can be freely scaled to fit experimental results and the protein degradation rate is also fixed according to literature reported values. The parameter studied in detail is the RNA degradation rate, which is directly related to different versions of dtRNAs used in each experiment.
Translation and transcription in vitro can be described by a simple 2D ordinary differential equation (ODE):
where M stands for mRNA abundance and P stands for GFP abundance over time. α, β, γ, and δ are the mRNA production rate, mRNA degradation rate, GFP translation rate, and GFP degradation rate, respectively. This simple ODE can be solved analytically and give us the expression of GFP abundance over time:
Using this formula, we can fit time series data in Figure 4a. In this fitting, α and γ are fixed to represent scale of fluorescence measurement and will not affect temporal dynamics (derivation below). is fixed to be 0.05 min−1, consistent with reported in vitro half-life of GFP to be around 14 mintues59. β, the only parameter that is changing over different experiments due to dtRNA engineering, is fitted against the data using lsqcurvefit from Matlab. Without inhibitor, β is ~0.95 min−1 for control, and around ~0.15 min−1 for dtRNA. With inhibitor, β is ~0.18 min−1 for control, and around ~0.07 min−1 for dtRNAs. Even though these values are only rough estimates of these molecule’s chemical property in vitro. They still corroborate with experimental observations, showing decreased degradation rate for dtRNA and for cases with RNase inhibitor applied.
After fitting, the equation
is used to compute GFP accumulation rate over time (Figure. 4b) to show its dynamics. One easily recognizable feature of the GFP accumulation rate curve is its peak, which occurs when the curve’s derivative equals to zero. We know from the equation above that
So when , Rate’(t)=0 and Rate(t) reaches its maximal value. As we can see, the location of the peak only depends on degradation rates. When protein degradation remains constant, the only factor affecting the peak locations is mRNA degradation rate, which is being tuned by dtRNA. As the mRNA getting more stable, decreases and the curve peak shifts to the right.
Mathematic modeling and data fitting for cell-free RNA expression analysis
We used a simple mathematical model to calculate the RNA half-life and to interpret the results of in vitro RNA expression with data fitting. During the experiment, RNAs are generated through transcription and digested through degradation. We describe this RNA expression process with following ordinary differential equation:
| [Eq4] |
R stands for RNA concentration, which is indicated by the value of fluorescence measurements. v is the transcription rate which can vary in a relatively small range due to the variation of sequence. δ is the degradation rate, which is affected by dtRNAs. We then analytically solved this simple ODE and obtained the function of RNA concentration over time:
| [Eq5] |
where R0 is the initial RNA concentration. With this formula, we can fit RNA expression data of all 64 dtRNAs and control. In our fitting, we set a small boundary, 10±4 min−1, for v, since this transcription rate is affected by the variation of dtRNA sequence. δ is the main parameter changing over different dtRNA designs. Also, considering the error caused by the initial small value of experimental data, we used the mean value of first three data points as the initial RNA concentration R0. We fitted v and δ against experimental data using lsqcurvefit from Matlab. Then we calculated RNA concentration over time with Eq5 and RNA half-life with the formula:
| [Eq6] |
As shown in Supplementary Table 5, most of RNA with dtRNAs (45/64) has longer half-life than control.
Extended Data
Extended Data Figure 1. Structure of ompA stabilizer and GFP expression measurement driven by a strong promoter.

(a) Schematic showing the structure of naturally occurring ompA stabilizer. (b-c) GFP fluorescence measurement results for circuits driven a strong promoter. (b) Design WT, Hp1 and Hp2 exhibits comparable GFP fluorescence. (c) Each design with small structure formation nearby RBS region shows low GFP fluorescence levels. Data represent the mean ± SD of four biological replicates. P (WT_I) = 0.0083, P (Hp1_I) = 0.0084, and P (Hp2_I) = 0.0497. n.s. (not significant) P > 0.05, * P < 0.05, ** P < 0.01, P value is measured by two-tailed student t test.
Extended Data Figure 2. Fluorescence measurements on synthetic dtRNAs with inserted RNase E cleavage sites.
(a) Fifteen synthetic dtRNAs are designed without (-) or with single/multiple RNase E cleavage sites (UCUUCC) engineered into different structural regions of the stable dtRNA. The inserted regions are marked yellow (right). Fluorescence measurement result shows that insertion of cleavage sites have insignificant effects on RNA stability. (b) Fluorescence measurement for dtRNAs with multiple RNase E cleavage sites inserted into 18-nt loop region. (c) Characterize the effect of dtRNA 5’ spacing length on GFP expression. Seven dtRNAs with 5’ spacing lengths from 1-nt to 18-nt are designed to measurement their effect on GFP expression. (d) Fluorescence measurement of dtRNAs with RNase E cleavage sites engineered into 12-nt 5’ spacing region. All data represent the mean ± SD of six biological replicates.
Extended Data Figure 3. Factors insignificantly affect dtRNA function.
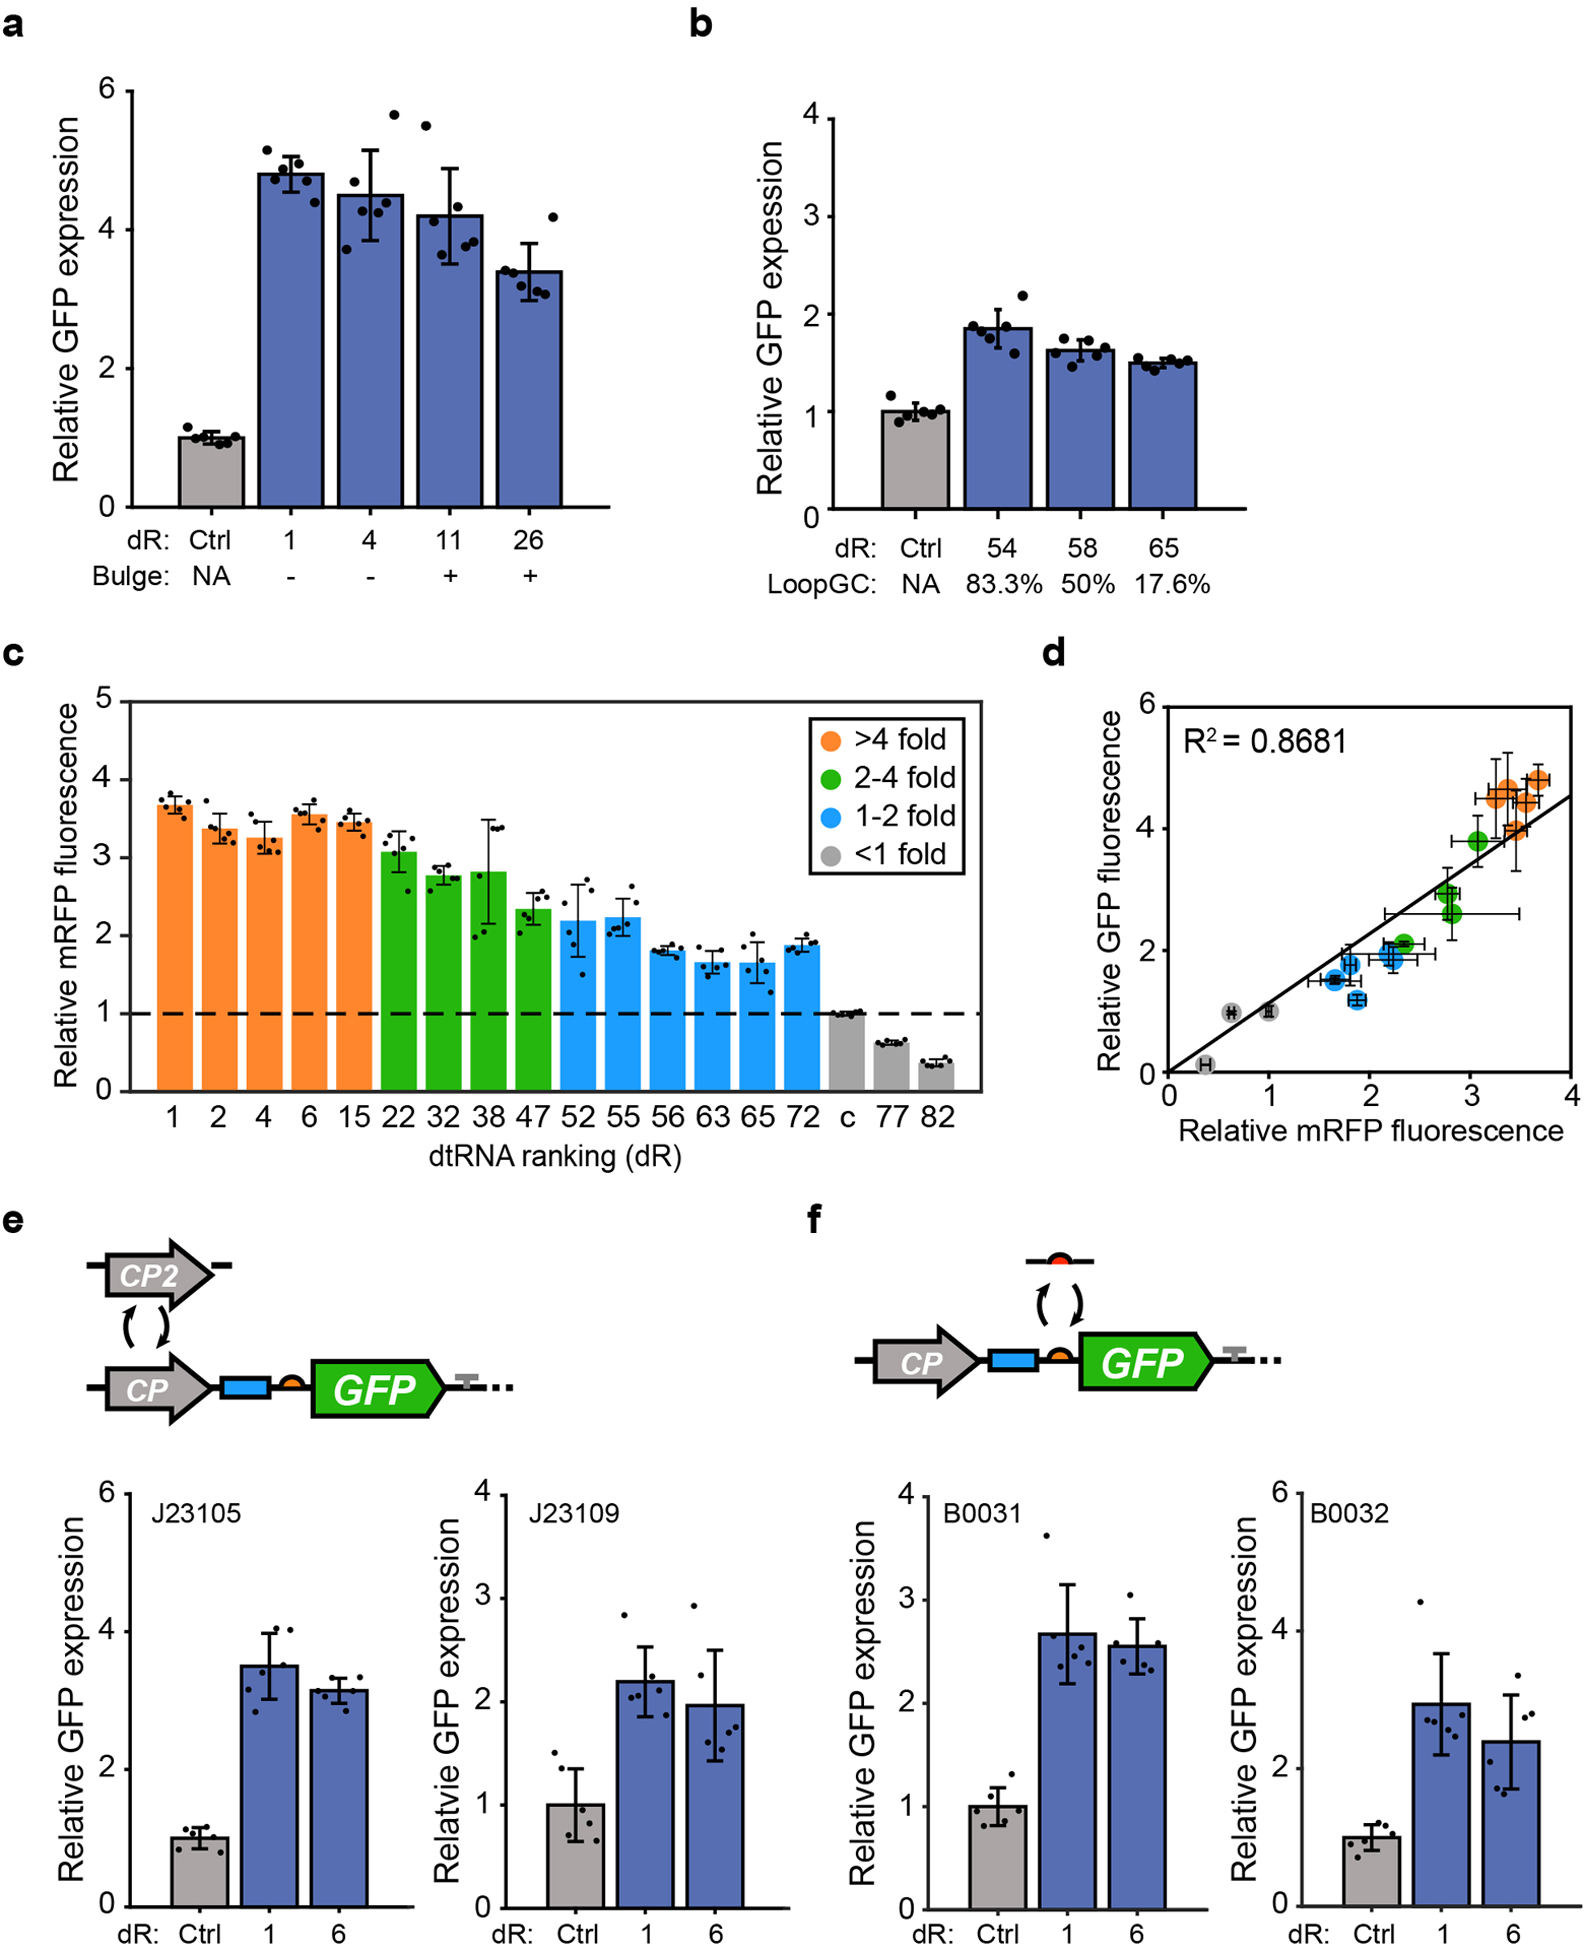
(a) Relative GFP expression of circuits regulated by dtRNAs with or without the three-nucleotide bulge introduced in stem region. (b) Fluorescence measurement result for designs with the same stem feature but varying loop GC content. (c) Relative mRFP fluorescence regulated by selected dtRNAs with varying stabilizing abilities. Colors of the bar represent the fold enhancement of each dtRNA on GFP reporter. (d) Comparison between relative mRFP fluorescence and relative GFP fluorescence regulated by selected dtRNAs. The result exhibits high correlation (R2 = 0.8681) between the report gene expression suggesting dtRNA performance is transferable to the other genes with different sequence composition. (e) Commonality test for circuits with different promoters. Two promoters are selected (Biobrick number: J23105 and J23109, Supplementary Table 1) and engineered into the circuit with identical constructions. (f) Commonality test for circuits with different RBSs. Two RBSs (Biobrick number: B0031 and B0032) are engineered into the circuit with identical constructions (Supplementary Table 1). All data represent the mean ± SD of six biological replicates.
Extended Data Figure 4. qPCR measurement and dtRNAs function prediction.

(a) RT-qPCR measurement of relative RNA levels for dtRNAs with diverse stabilizing efficiency. The result displays a strong correlation between relative RNA levels and relative GFP fluorescence (R2 = 0.9406). Data represent the mean ± SD of at least three biological replicates. (b) Relative fluorescence comparison between predicted relative GFP and observed relative GFP of circuits constructed followed by combined design rules (Supplementary Table 3). N is the total number for 54 single measurement regulated by additional designed dtRNAs (R2 = 0.5005). (c) Fluorescence measurement of dtRNA design f (Supplementary Table 3) without (left) or with (right) 18 nt 5’ spacing. Data represent the mean ± SD of six biological replicates. (d) Scatter plot reveals that structure MFE is not significantly correlated with GFP fluorescence enhancement regulated by synthetic dtRNA library (R2 = 0.000068). Data represent the mean ± SD of six biological replicates.
Extended Data Figure 5. Hysteresis measurement for dtRNA-regulated positive feedback loop.

(a) Schematic showing the construction of positive feedback loop, dtRNA is only inserted at 5’ upstream of the LuxR gene. All genetic components are sharing the same colors as showed in Fig. 3a. (b) The hysteresis result of Fig. 3c regulated by dR1 and dR82 induced by 0 to 2 nM 3OC6HSL concentration. This figure serves to zoom in on lower induction doses shown in Fig. 3c to better visualize low dosage dynamics. (c) Hysteresis results for synthetic positive feedback circuit regulated by dR6 and dR81. Various concentrations of 3OC6HSL are applied to induce the circuit. The top panel is the enlarged result induced by 0 to 2 nM 3OC6HSL concentration. All data in b-c represent the mean ± SD of three biological replicates.
Extended Data Figure 6. In vitro regulation of gene expression via synthetic dtRNAs.
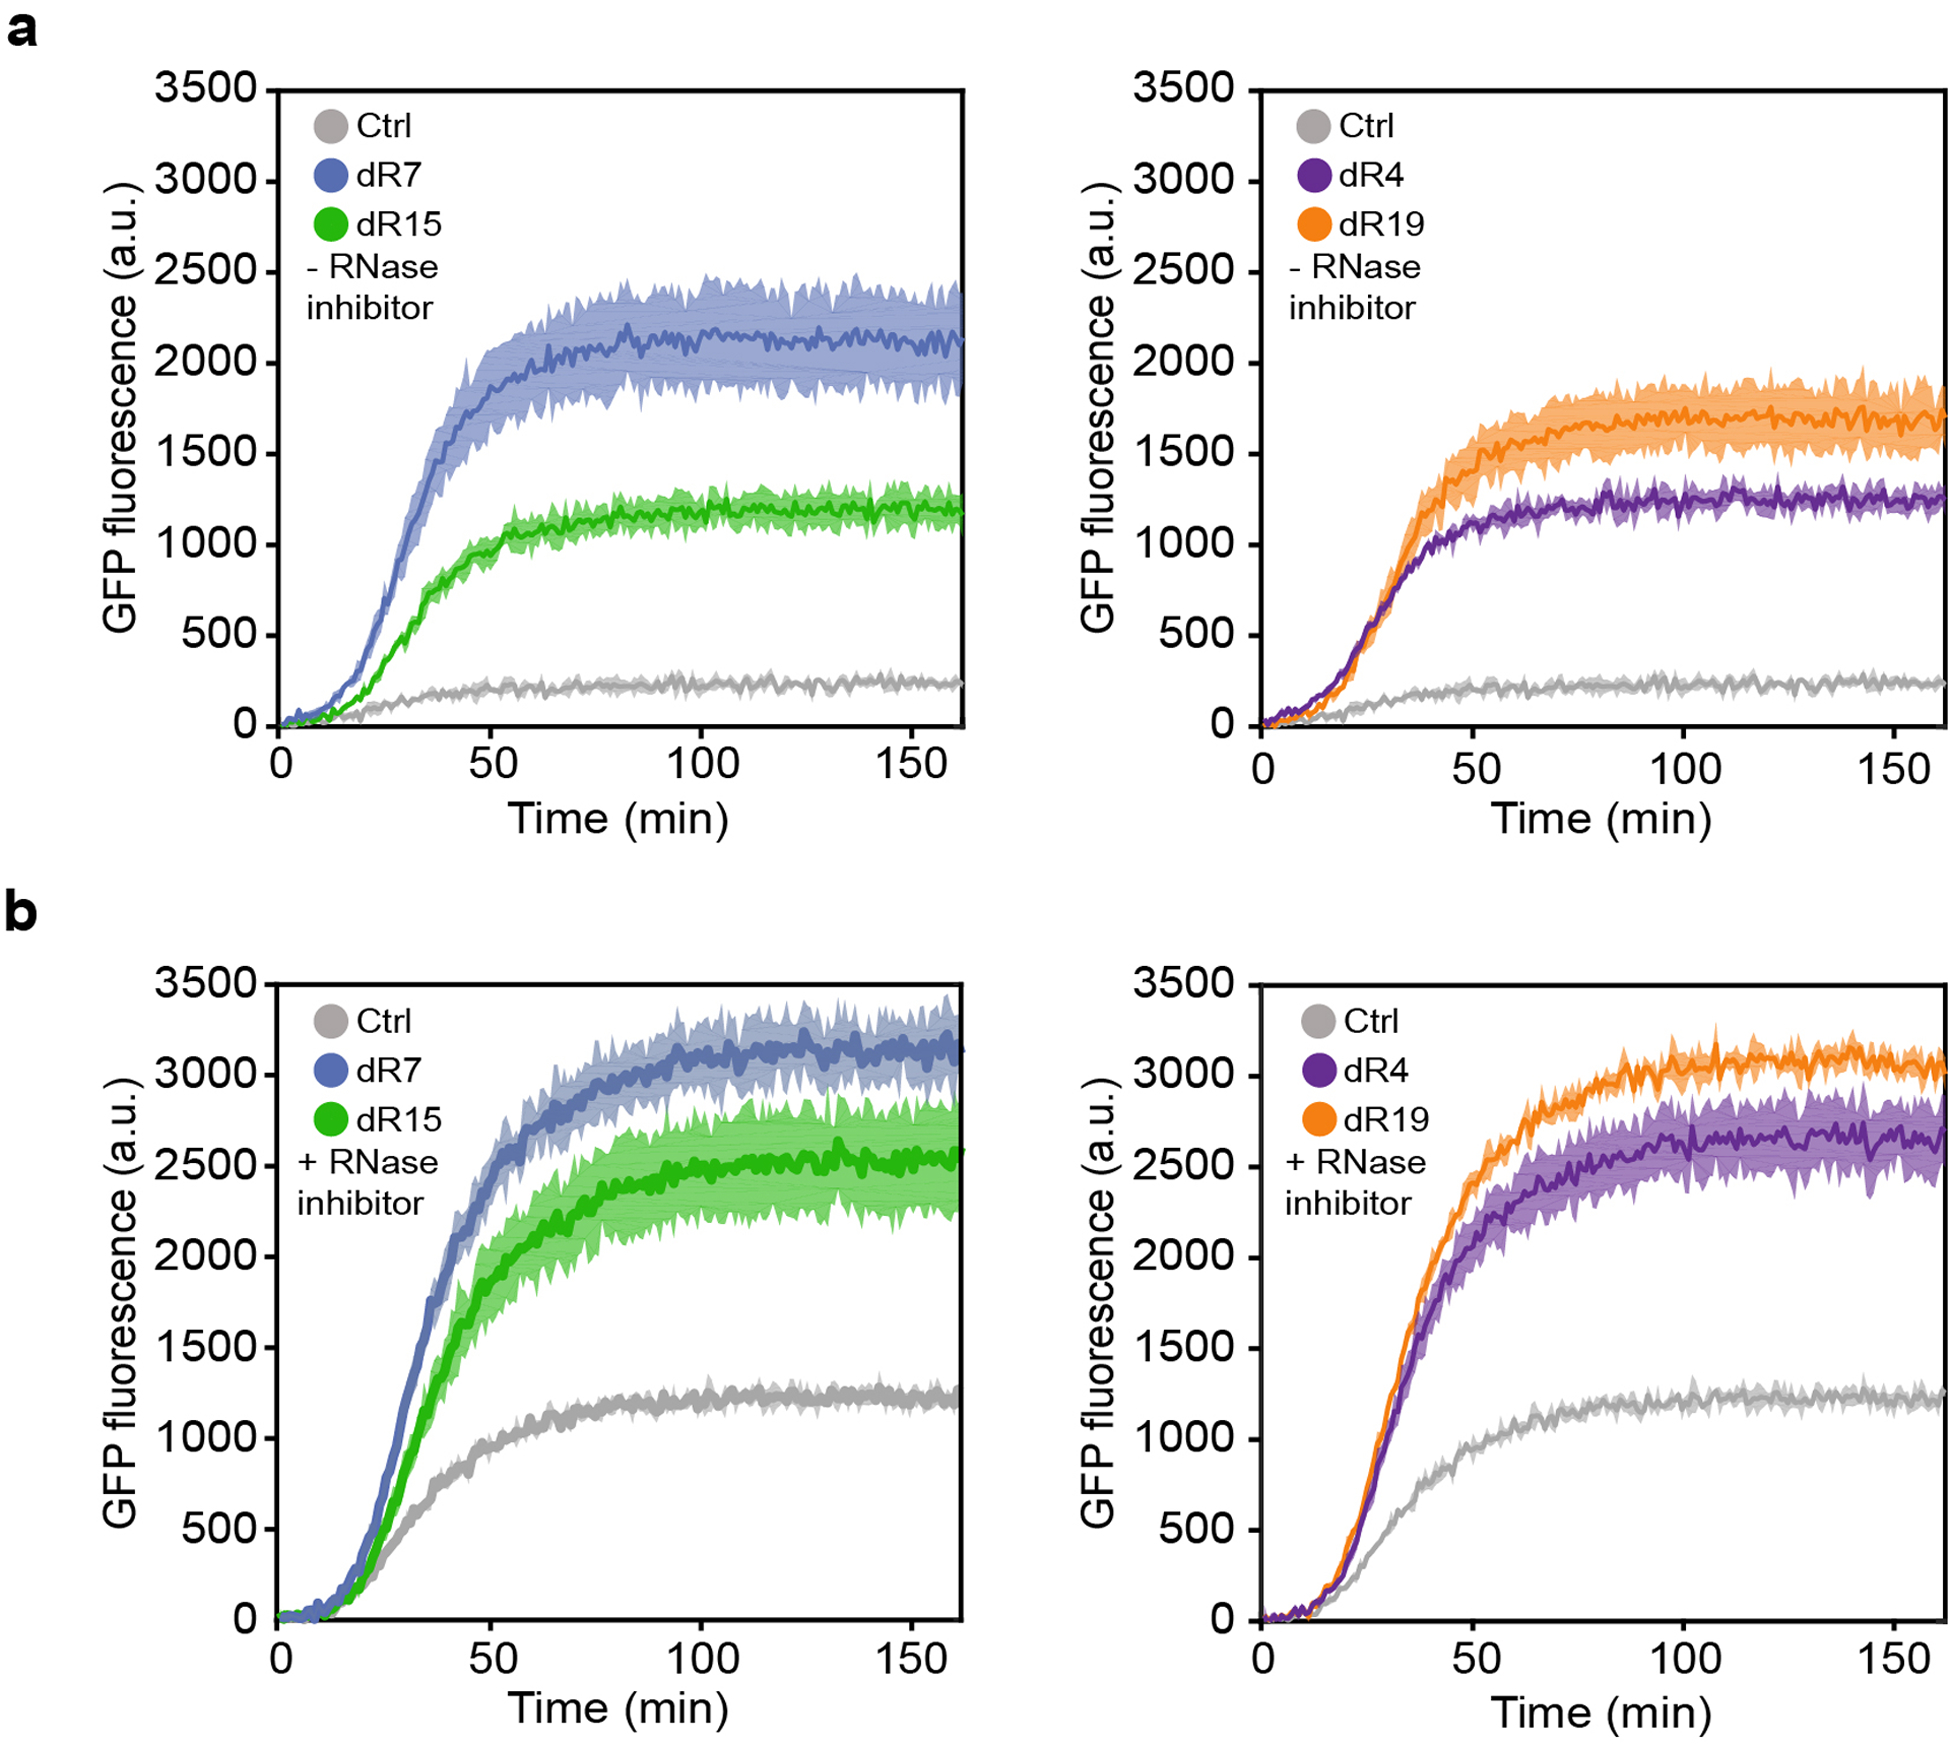
(a) GFP fluorescence measurement results of designs without RNase inhibitor treatment. (b) GFP fluorescence measurement results of designs with RNase inhibitor treatment. All data represent the mean ± SD of three biological replicates. GFP fluorescence is measured every 50 seconds.
Extended Data Figure 7. Relative GFP fluorescence comparison and in vitro dtRNA-regulated aptamer assay.

(a) Relative GFP fluorescence comparison among circuits regulated by the same dtRNAs in vitro and in vivo. Data represent the mean ± SD of at least three biological replicates. (b) Aptamer fluorescence measurement assay. (c) Comparison between in vivo relative GFP fluorescence and relative aptamer fluorescence in cell-free expression system. The result shows little correlation between relative GFP and aptamer fluorescence. Interestingly, dtRNAs with short stem-loop hairpins tend to exert stronger positive effect on aptamer fluorescence (green dots). (d) Aptamer fluorescence measurements with varying 5’ single-stranded length.
Extended Data Figure 8. Two-hour in vitro norovirus diagnostics and the toehold sensor expression leakage.
(a) Leaky expression of sensors Ori, dR19_1 dR19_4 and dR19_5 without RNase inhibitor treatment. Leaky expression indicates the false positive result that reporter expresses even without viral input. (b) Plate reader measurement shows two-hour viral diagnostics result without RNase inhibitor treatment. “+” represents groups induced by synthetic norovirus RNA and “–” represents the negative control; The dash line indicates the detection threshold (ΔOD575 = 0.4). Data represent the mean ± SD of five biological replicates. (c) Plate reader measurement shows device dR19_2 and dR19_3 exhibit high expression leakage. Data represents the mean ± SD of five biological replicates. (d) Expression leakage of sensors Ori, dR19_1 dR19_4 and dR19_5 with RNase inhibitor treatment.
Supplementary Material
Acknowledgements
We thank Zhaoqing Yan for assistance with RNA preparation and in vitro gene expression experiments; Josh Cutts and Nick Brookhouser for technical guidance for RT-qPCR experiments and data analysis. We also thank Xiaojun Tian, Rong Zhang and Zhilong Mi for Matlab assistance and useful discussions. This work was financially supported by a National Science Foundation grant (DMS-1100309) and NIH grant (GM106081, GM131405) to X.W.; an NIH Director’s New Innovator Award (1DP2GM126892), the Gates Foundation (OPP1160667), an Arizona Biomedical Research Commission New Investigator Award (ADHS16-162400), an Alfred P. Sloan Fellowship (FG-2017-9108), Gordon and Betty Moore Foundation funds (#6984), NIH funds (1R21AI136571), and Arizona State University funds to A.A.G. The views, opinions, and/or findings contained in this article are those of the authors and should not be interpreted as representing the official views or policies, either expressed or implied, of the NIH.
Footnotes
Competing interests
The authors declare the following competing financial interest(s): a patent application has been filed relating to this work.
Data availability
The data generated and/or analyzed during the current study are available from the corresponding authors on reasonable request. Source data are provided with this paper.
Code availability
The codes that supporting this study are available from the corresponding authors upon reasonable request.
References
- 1.Cambray G, Guimaraes JC & Arkin AP Evaluation of 244,000 synthetic sequences reveals design principles to optimize translation in Escherichia coli. Nat Biotechnol 36, 1005–1015 (2018). [DOI] [PubMed] [Google Scholar]
- 2.Delivering the promise of RNA therapeutics. Nat Med 25, 1321–1321 (2019). [DOI] [PubMed] [Google Scholar]
- 3.Kole R, Krainer AR & Altman S RNA therapeutics: beyond RNA interference and antisense oligonucleotides. Nat Rev Drug Discov 11, 125–140 (2012). [DOI] [PMC free article] [PubMed] [Google Scholar]
- 4.Pardee K et al. Rapid, Low-Cost Detection of Zika Virus Using Programmable Biomolecular Components. Cell 165, 1255–1266 (2016). [DOI] [PubMed] [Google Scholar]
- 5.Slomovic S, Pardee K & Collins JJ Synthetic biology devices for in vitro and in vivo diagnostics. Proc. Natl. Acad. Sci. U.S.A 112, 14429–14435 (2015). [DOI] [PMC free article] [PubMed] [Google Scholar]
- 6.Chen YY, Galloway KE & Smolke CD Synthetic biology: advancing biological frontiers by building synthetic systems. Genome Biol. 13, 240 (2012). [DOI] [PMC free article] [PubMed] [Google Scholar]
- 7.Khalil AS & Collins JJ Synthetic biology: applications come of age. Nat. Rev. Genet 11, 367–379 (2010). [DOI] [PMC free article] [PubMed] [Google Scholar]
- 8.Chen Y-J et al. Characterization of 582 natural and synthetic terminators and quantification of their design constraints. Nat. Methods 10, 659–664 (2013). [DOI] [PubMed] [Google Scholar]
- 9.Gardner PP, Barquist L, Bateman A, Nawrocki EP & Weinberg Z RNIE: genome-wide prediction of bacterial intrinsic terminators. Nucleic Acids Res. 39, 5845–5852 (2011). [DOI] [PMC free article] [PubMed] [Google Scholar]
- 10.Green AA, Silver PA, Collins JJ & Yin P Toehold Switches: De-Novo-Designed Regulators of Gene Expression. Cell 159, 925–939 (2014). [DOI] [PMC free article] [PubMed] [Google Scholar]
- 11.Chappell J, Takahashi MK & Lucks JB Creating small transcription activating RNAs. Nat. Chem. Biol 11, 214–220 (2015). [DOI] [PubMed] [Google Scholar]
- 12.Green AA et al. Complex cellular logic computation using ribocomputing devices. Nature 548, 117–121 (2017). [DOI] [PMC free article] [PubMed] [Google Scholar]
- 13.Kim J et al. De novo-designed translation-repressing riboregulators for multi-input cellular logic. Nat Chem Biol (2019) doi: 10.1038/s41589-019-0388-1. [DOI] [PMC free article] [PubMed] [Google Scholar]
- 14.Hoynes-O’Connor A, Hinman K, Kirchner L & Moon TS De novo design of heat-repressible RNA thermosensors in E. coli. Nucleic Acids Res. 43, 6166–6179 (2015). [DOI] [PMC free article] [PubMed] [Google Scholar]
- 15.Lou C, Stanton B, Chen Y-J, Munsky B & Voigt CA Ribozyme-based insulator parts buffer synthetic circuits from genetic context. Nat. Biotechnol 30, 1137–1142 (2012). [DOI] [PMC free article] [PubMed] [Google Scholar]
- 16.Qi LS et al. Repurposing CRISPR as an RNA-guided platform for sequence-specific control of gene expression. Cell 152, 1173–1183 (2013). [DOI] [PMC free article] [PubMed] [Google Scholar]
- 17.Matharu N et al. CRISPR-mediated activation of a promoter or enhancer rescues obesity caused by haploinsufficiency. Science 363, (2019). [DOI] [PMC free article] [PubMed] [Google Scholar]
- 18.Siu K-H & Chen W Riboregulated toehold-gated gRNA for programmable CRISPR–Cas9 function. Nat Chem Biol 15, 217–220 (2019). [DOI] [PubMed] [Google Scholar]
- 19.Hanewich-Hollatz MH, Chen Z, Hochrein LM, Huang J & Pierce NA Conditional Guide RNAs: Programmable Conditional Regulation of CRISPR/Cas Function in Bacterial and Mammalian Cells via Dynamic RNA Nanotechnology. ACS Cent. Sci 5, 1241–1249 (2019). [DOI] [PMC free article] [PubMed] [Google Scholar]
- 20.Wu F, Zhang Q & Wang X Design of Adjacent Transcriptional Regions to Tune Gene Expression and Facilitate Circuit Construction. Cell Syst 6, 206–215.e6 (2018). [DOI] [PMC free article] [PubMed] [Google Scholar]
- 21.Pfleger BF, Pitera DJ, Smolke CD & Keasling JD Combinatorial engineering of intergenic regions in operons tunes expression of multiple genes. Nat. Biotechnol 24, 1027–1032 (2006). [DOI] [PubMed] [Google Scholar]
- 22.Win MN & Smolke CD Higher-Order Cellular Information Processing with Synthetic RNA Devices. Science 322, 456–460 (2008). [DOI] [PMC free article] [PubMed] [Google Scholar]
- 23.Yang TT, Cheng L & Kain SR Optimized codon usage and chromophore mutations provide enhanced sensitivity with the green fluorescent protein. Nucleic Acids Res. 24, 4592–4593 (1996). [DOI] [PMC free article] [PubMed] [Google Scholar]
- 24.Hui MP, Foley PL & Belasco JG Messenger RNA degradation in bacterial cells. Annu. Rev. Genet 48, 537–559 (2014). [DOI] [PMC free article] [PubMed] [Google Scholar]
- 25.Mohanty BK & Kushner SR Enzymes Involved in Posttranscriptional RNA Metabolism in Gram-Negative Bacteria. Microbiol Spectr 6, (2018). [DOI] [PMC free article] [PubMed] [Google Scholar]
- 26.Mohanty BK & Kushner SR Regulation of mRNA Decay in Bacteria. Annu. Rev. Microbiol 70, 25–44 (2016). [DOI] [PubMed] [Google Scholar]
- 27.Case CC, Simons EL & Simons RW The IS10 transposase mRNA is destabilized during antisense RNA control. EMBO J. 9, 1259–1266 (1990). [DOI] [PMC free article] [PubMed] [Google Scholar]
- 28.Arraiano CM et al. The critical role of RNA processing and degradation in the control of gene expression. FEMS Microbiol Rev 34, 883–923 (2010). [DOI] [PubMed] [Google Scholar]
- 29.Arraiano CM, Mauxion F, Viegas SC, Matos RG & Séraphin B Intracellular ribonucleases involved in transcript processing and decay: Precision tools for RNA. Biochimica et Biophysica Acta (BBA) - Gene Regulatory Mechanisms 1829, 491–513 (2013). [DOI] [PubMed] [Google Scholar]
- 30.Bouvet P & Belasco JG Control of RNase E-mediated RNA degradation by 5’-terminal base pairing in E. coli. Nature 360, 488–491 (1992). [DOI] [PubMed] [Google Scholar]
- 31.Carrier TA & Keasling JD Library of synthetic 5’ secondary structures to manipulate mRNA stability in Escherichia coli. Biotechnol. Prog 15, 58–64 (1999). [DOI] [PubMed] [Google Scholar]
- 32.Cetnar DP & Salis HM Systematic Quantification of Sequence and Structural Determinants Controlling mRNA stability in Bacterial Operons. ACS Synth. Biol acssynbio.0c00471 (2021) doi: 10.1021/acssynbio.0c00471. [DOI] [PubMed] [Google Scholar]
- 33.Viegas SC, Apura P, Martínez-García E, de Lorenzo V & Arraiano CM Modulating Heterologous Gene Expression with Portable mRNA-Stabilizing 5’-UTR Sequences. ACS Synth Biol 7, 2177–2188 (2018). [DOI] [PubMed] [Google Scholar]
- 34.Arnold TE, Yu J & Belasco JG mRNA stabilization by the ompA 5’ untranslated region: two protective elements hinder distinct pathways for mRNA degradation. RNA 4, 319–330 (1998). [PMC free article] [PubMed] [Google Scholar]
- 35.Emory SA, Bouvet P & Belasco JGA 5’-terminal stem-loop structure can stabilize mRNA in Escherichia coli. Genes & Development 6, 135–148 (1992). [DOI] [PubMed] [Google Scholar]
- 36.Salis HM, Mirsky EA & Voigt CA Automated design of synthetic ribosome binding sites to control protein expression. Nat. Biotechnol 27, 946–950 (2009). [DOI] [PMC free article] [PubMed] [Google Scholar]
- 37.Gusarov I & Nudler E The mechanism of intrinsic transcription termination. Mol. Cell 3, 495–504 (1999). [DOI] [PubMed] [Google Scholar]
- 38.d’Aubenton Carafa Y, Brody E & Thermes C Prediction of rho-independent Escherichia coli transcription terminators. A statistical analysis of their RNA stem-loop structures. J. Mol. Biol 216, 835–858 (1990). [DOI] [PubMed] [Google Scholar]
- 39.Varani G Exceptionally stable nucleic acid hairpins. Annu Rev Biophys Biomol Struct 24, 379–404 (1995). [DOI] [PubMed] [Google Scholar]
- 40.Caron M-P et al. Dual-acting riboswitch control of translation initiation and mRNA decay. Proc. Natl. Acad. Sci. U.S.A 109, E3444–3453 (2012). [DOI] [PMC free article] [PubMed] [Google Scholar]
- 41.Wu F, Menn DJ & Wang X Quorum-sensing crosstalk-driven synthetic circuits: from unimodality to trimodality. Chem. Biol 21, 1629–1638 (2014). [DOI] [PMC free article] [PubMed] [Google Scholar]
- 42.Wu M et al. Engineering of regulated stochastic cell fate determination. Proc. Natl. Acad. Sci. U.S.A 110, 10610–10615 (2013). [DOI] [PMC free article] [PubMed] [Google Scholar]
- 43.Pardee K et al. Paper-based synthetic gene networks. Cell 159, 940–954 (2014). [DOI] [PMC free article] [PubMed] [Google Scholar]
- 44.Dudley QM, Karim AS & Jewett MC Cell-free metabolic engineering: biomanufacturing beyond the cell. Biotechnol J 10, 69–82 (2015). [DOI] [PMC free article] [PubMed] [Google Scholar]
- 45.Ma D, Shen L, Wu K, Diehnelt CW & Green AA Low-cost detection of norovirus using paper-based cell-free systems and synbody-based viral enrichment. Synth Biol (Oxf) 3, ysy018 (2018). [DOI] [PMC free article] [PubMed] [Google Scholar]
- 46.Huang A et al. BioBitsTM Explorer: A modular synthetic biology education kit. Sci Adv 4, eaat5105 (2018). [DOI] [PMC free article] [PubMed] [Google Scholar]
- 47.Ceroni F et al. Burden-driven feedback control of gene expression. Nat. Methods 15, 387–393 (2018). [DOI] [PubMed] [Google Scholar]
- 48.Kwon Y-C & Jewett MC High-throughput preparation methods of crude extract for robust cell-free protein synthesis. Sci Rep 5, 8663 (2015). [DOI] [PMC free article] [PubMed] [Google Scholar]
- 49.Lavickova B & Maerkl SJ A Simple, Robust, and Low-Cost Method To Produce the PURE Cell-Free System. ACS Synth. Biol 8, 455–462 (2019). [DOI] [PubMed] [Google Scholar]
- 50.Silverman AD, Kelley-Loughnane N, Lucks JB & Jewett MC Deconstructing Cell-Free Extract Preparation for in Vitro Activation of Transcriptional Genetic Circuitry. ACS Synth Biol 8, 403–414 (2019). [DOI] [PMC free article] [PubMed] [Google Scholar]
- 51.Wu F, Su R-Q, Lai Y-C & Wang X Engineering of a synthetic quadrastable gene network to approach Waddington landscape and cell fate determination. Elife 6, (2017). [DOI] [PMC free article] [PubMed] [Google Scholar]
- 52.Zadeh JN et al. NUPACK: Analysis and design of nucleic acid systems. J Comput Chem 32, 170–173 (2011). [DOI] [PubMed] [Google Scholar]
- 53.Standage-Beier K, Zhang Q & Wang X Targeted Large-Scale Deletion of Bacterial Genomes Using CRISPR-Nickases. ACS Synth Biol 4, 1217–1225 (2015). [DOI] [PMC free article] [PubMed] [Google Scholar]
- 54.Gibson DG et al. Enzymatic assembly of DNA molecules up to several hundred kilobases. Nat. Methods 6, 343–345 (2009). [DOI] [PubMed] [Google Scholar]
- 55.Basu S, Gerchman Y, Collins CH, Arnold FH & Weiss R A synthetic multicellular system for programmed pattern formation. Nature 434, 1130–1134 (2005). [DOI] [PubMed] [Google Scholar]
- 56.Ermentrout B Xppaut. In: Computational Systems Neurobiology, Springer Science+Business Media, Dordrecht, pp. 519–531 (2012). [Google Scholar]
- 57.Gardner TS, Cantor CR & Collins JJ Construction of a genetic toggle switch in Escherichia coli. Nature 403, 339–342 (2000). [DOI] [PubMed] [Google Scholar]
- 58.Zhang R et al. Topology-dependent interference of synthetic gene circuit function by growth feedback. Nat. Chem. Biol (2020) doi: 10.1038/s41589-020-0509-x. [DOI] [PMC free article] [PubMed] [Google Scholar]
- 59.Shin J & Noireaux V Study of messenger RNA inactivation and protein degradation in an Escherichia coli cell-free expression system. J Biol Eng 4, 9 (2010). [DOI] [PMC free article] [PubMed] [Google Scholar]
Associated Data
This section collects any data citations, data availability statements, or supplementary materials included in this article.