

Abstract
The neurodegenerative disease spinal muscular atrophy (SMA) is caused by deficiency in the survival motor neuron (SMN) protein. Currently approved SMA treatments aim to restore SMN, but the potential for SMN expression beyond physiological levels is a unique feature of AAV9-SMN gene therapy. Here, we show that long-term AAV9-mediated SMN overexpression in mouse models induces dose-dependent, late-onset motor dysfunction associated with loss of proprioceptive synapses and neurodegeneration. Mechanistically, aggregation of overexpressed SMN in the cytoplasm of motor circuit neurons sequesters components of small nuclear ribonucleoproteins, leading to splicing dysregulation and widespread transcriptome abnormalities with prominent signatures of neuroinflammation and innate immune response. Thus, long-term SMN overexpression interferes with RNA regulation and triggers SMA-like pathogenic events through toxic gain of function mechanisms. These unanticipated, SMN-dependent and neuron-specific liabilities warrant caution on the long-term safety of treating SMA patients with AAV9-SMN and the risks of uncontrolled protein expression by gene therapy.
Introduction
Spinal muscular atrophy (SMA) is an autosomal recessive neurodegenerative disorder characterized by motor neuron loss and skeletal muscle atrophy which represents the leading genetic cause of infant death1,2. SMA patients have homozygous deletions or mutations in the survival motor neuron 1 (SMN1) gene with retention of the hypomorphic SMN2 gene that produces low levels of SMN due to defective splicing of a critical exon3,4, the skipping of which leads to an unstable rapidly degraded form of the protein1,2. The disease is classified in four clinical groups (types 1, 2, 3, and 4) based on time of onset and severity that inversely correlate with SMN2 copy number and SMN protein levels1,2.
Therapeutic approaches for all SMA types have mainly focused on increasing SMN expression through antisense oligonucleotides (ASO)5,6 or small molecules7,8 that correct SMN2 splicing as well as SMN replacement by gene therapy with adeno-associated AAV9 viral vectors9–12, all of which have demonstrated efficacy in preclinical animal models and human clinical trials. Importantly, repeated intrathecal injections of an SMN2 splicing-modifying ASO (Nusinersen/Spinraza)13–15 and gene therapy via a single intravenous administration of AAV9-SMN (Onasemnogene abeparvovec/Zolgensma)16,17 are currently used for treatment of the disease. Recently, FDA has also approved the use of an orally bioavailable compound that promotes SMN2 splicing (Risdiplam/Evrysdi) for SMA therapy18. All three drugs have shown a favorable safety and efficacy profile, but in different populations of SMA patients19.
At a time when SMN-inducing therapies with different mechanisms of action are given to SMA patients, it is critical to compare and contrast their benefits and potential liabilities. Unlike approaches aimed at correcting splicing of endogenous SMN2 and therefore subject to an intrinsic limit of SMN induction, the potential for SMN expression beyond physiological levels is uniquely associated with AAV9-SMN gene therapy. Furthermore, the biology of SMN overexpression and the long-term safety profile of AAV9-SMN are largely unknown.
To date, FDA-approved gene therapy by intravenous administration of AAV9-SMN in patients under 2 years of age has shown significant early clinical benefit in SMA type 1 infants with the most severe form of the disease without major adverse events beyond an acute but transient elevation in liver transaminases that is controlled pharmacologically16. Although only a few years have passed since the first patients were treated, follow up studies up to two years from initial AAV9-SMN treatment did not show signs of decline in functional gain17. Nevertheless, evidence has been accumulating that AAV9-SMN can cause neuronal toxicity in animal models and its potential relevance to SMA patients is beginning to be recognized even if clinical manifestations may take many years. A recent study reported that systemic administration of an AAV9-like SMN vector induced toxicity in large animal models20, which included dorsal root ganglia (DRG) pathology and inflammation leading to severe ataxia in piglets but no overt motor deficits in non-human primates. Similar neuropathological findings in DRGs were independently reported following intrathecal delivery of the FDA-approved AAV9-SMN vector in non-human primates21,22. Since intrathecal injection of AAV9-SMN was being pursued in a clinical trial as a candidate therapeutic approach for treatment of milder SMA patients21, these indications raised sufficient safety concerns for the FDA to put the trial on partial clinical hold. Altogether, these findings prompted an urgent need to determine the full spectrum of potential toxicities of AAV9-SMN and their underlying mechanisms, which are currently unknown. Importantly, it has been proposed that toxicity may be driven by injection of high doses of the AAV vector itself through mechanisms unrelated to either the capsid type or the transgene20. In contrast, the possibility that overexpression of the therapeutic gene product (i.e. SMN) could be toxic to neurons in the long-term has never been considered. Here we sought to address these outstanding questions in mouse models.
Results
AAV9-mediated SMN overexpression induces sensory-motor deficits in mouse models
We found strong early phenotypic improvement of SMNΔ7 SMA mice following a one-time intracerebroventricular (ICV) delivery of a therapeutic dose of 5×10¹⁰vg/g of self-complementary AAV9-SMN at P0 (Fig. 1). AAV9-SMN treated SMA mice show enhanced motor function and increased weight gain and survival relative to AAV9-GFP treated SMA mice (Fig. 1a–c). These results are fully consistent with previous pre-clinical studies in this model that used the same vector in which SMN expression is driven by the ubiquitous beta-glucuronidase (GUSB) promoter10,23 as well as other promoters9,11,12. While different from the hybrid CMV enhancer/chicken β-actin (CBA) promoter present in the FDA-approved AAV9-SMN vector for SMA gene therapy9,16, we note that GUSB is a weaker promoter than CBA for AAV-mediated gene expression in vivo24. Surprisingly, we found that SMA mice treated with AAV9-SMN developed the neurological phenotype of hindlimb clasping, determined as retraction of the limbs to the torso and clenching of the digits25, around four months of age (Fig. 1d,e). To investigate this without confounding factors of the SMA phenotype, we analyzed WT mice that were untreated or injected with either AAV9-GFP or AAV9-SMN and found that AAV9-SMN specifically induced hindlimb clasping characterized by earlier onset with increasing dosage (Fig. 1f,g and Supplementary Video 1). At doses where hindlimb clasping occurred, the phenotype was fully penetrant in all treated animals and grew progressively more pronounced following initial onset. Moreover, the lowest dose of AAV9-SMN we tested did not induce hindlimb clasping, but was previously shown to be suboptimal for correction of the SMA phenotype23. Some premature deaths and reduced weight gain also occurred in WT mice treated with the highest dose of AAV9-SMN (Fig. 1h,i). Further behavioral analysis using rotarod and inverted grid assays showed dose-dependent, progressive impairment in motor performance of WT mice treated with AAV9-SMN relative to both uninjected and AAV9-GFP treated controls (Fig. 1j,k), which led to hindlimb paralysis in mice treated with the highest dose (Supplementary Video 2). These results demonstrate that long-term AAV9-mediated SMN overexpression induces dose-dependent, late-onset motor deficits in mouse models.
Fig. 1 /. Long-term AAV9-mediated SMN overexpression induces sensory-motor toxicity in WT and SMA mice.

a-c, Weight gain (a), righting time (b), and survival (c) of WT (SMNΔ7) mice (n=17) and SMA mice injected with 5×10¹⁰vg/g (5) of AAV9-GFP (n=16) or AAV9-SMN (n=21) at P0. Data represent mean and SEM. Weight gain: P<0.0001, F2, 712=718.3, two-way ANOVA. Righting time: P<0.0001, F2, 661=1242, two-way ANOVA. Survival: P<0.0001, df=2, χ2=54.58, two-tailed Mantel-Cox log-rank test. d, Time of onset of hindlimb clasping in AAV9-SMN (5) treated SMA mice (n=5). The box-and-whiskers graph shows the median, interquartile range, minimum and maximum. WT (SMNΔ7) mice (n=5) do not display hindlimb clasping. e, Hindlimb clasping phenotype observed in AAV9-SMN (5) treated SMA mice at P190. f, Hindlimb clasping phenotype in AAV9-SMN injected WT mice compared to uninjected and AAV9-GFP treated controls at P300. g, Time of onset of hindlimb clasping in WT mice injected with 2.5×10¹⁰vg/g (2.5) (n=7), 5×10¹⁰vg/g (5) (n=10), and 1×10¹¹vg/g (10) (n=10) of AAV-SMN. Uninjected WT mice (n=17) and WT mice treated with 5×10¹⁰vg/g (5) of AAV9-GFP (n=16) or 1.25×10¹⁰vg/g (1.25) of AAV-SMN (n=10) do not display hindlimb clasping. The box-and-whiskers graph shows the median, interquartile range, minimum and maximum. h, Weight gain of uninjected and AAV9-injected WT mice from the same groups as in (g). Data represent mean and SEM. Statistics were performed with two-way ANOVA (P<0.0001, F5, 609=26.28) and Tukey’s multiple comparisons test results between WT and WT+SMN(10): Week 4, P=0.0147; Week 5, P=0.0030; Week 6, P=0.0051; Week 7, P=0.0073; Week 8, P=0.0033; Week 9, P=0.0005; Week 10, P=0.0005) and shown as follows: (*) p<0.05; (**) p<0.01; (***) p<0.001. i, Survival of uninjected and AAV9-injected WT mice from the same groups as in (g). P=0.0179, df=5, χ2=13.66, two-tailed Mantel-Cox log-rank test. j, Latency to fall on the inverted grid test from the same groups as in (g). Data represent mean and SEM. Statistics were performed with two-way ANOVA (P<0.0001, F5, 609=105.9) and Tukey’s multiple comparisons test results between WT and WT+SMN(5): Week 7, P=0.0003; Week 8–10, P<0.0001 or WT and WT+SMN(10): Week 2, P=0.0062; Week 3–10, P<0.0001 and shown as follows: (**) p<0.01; (***) p<0.001; (****) p<0.0001. k, Performance of WT mice from the same groups as in (g) on the rotarod assay. Data represent mean and SEM. Statistics were performed with two-way ANOVA (P<0.0001, F5, 543=169.9) and Tukey’s multiple comparisons test results between WT and WT+SMN(5): Week 4, P=0.0443; Week 5, P=0.0035; Week 6, P=0.0002; Week 7, P=0.0034; Week 8–10, P<0.0001 or WT and WT+SMN(10): Week 3–10, P<0.0001 and shown as follows: (*) p<0.05; (**) p<0.01; (***) p<0.001; (****) p<0.0001.
AAV9-mediated SMN overexpression causes synaptic loss and neurodegeneration
The hindlimb clasping phenotype in mice is associated with compromised information about limb and joint position, altered reflexes, or the improper integration of sensory and motor information including dysfunction of proprioceptive neurons25. Therefore, we performed elecrophysiological studies to investigate the muscle (M) response and the H-reflex by recording EMG activity in vivo from the interosseous muscle of the hindpaw after sciatic nerve stimulation (Extended Data Fig. 1a–c). This analysis can reveal differences in proprioceptive synaptic function (H-reflex) and motor neuron function (M-response), with the H/M ratio determining whether either response is more affected. There were no alterations in the amplitude of the M-response even after repetitive nerve stimulation at high frequencies (Extended Data Fig. 1d,g), indicating normal synaptic transmission at the neuromuscular junction (NMJ). In contrast, the amplitude of the H-reflex and H/M ratio were reduced in AAV9-SMN treated mice relative to controls (Extended Data Fig. 1e,f), consistent with dysfunction of proprioceptive synapses.
To investigate the cellular basis of these SMN-dependent defects, we quantified the number of proprioceptive synapses on lumbar L5 motor neurons innervating muscles involved in the clasping phenotype. We found a strong, dose-dependent reduction of VGluT1+ synapses on both somata and proximal dendrites of motor neurons in AAV9-SMN injected WT mice at P150 that worsened with aging (Fig. 2a–c), while cholinergic C-boutons were unaffected (Extended Data Fig. 2d,e). We further analyzed effects of SMN overexpression on the survival of proprioceptive neurons from L5 DRGs and L5 lateral motor column (LMC) motor neurons in WT mice. We found that AAV9-SMN caused late-onset, dose-dependent loss of proprioceptive neurons (Fig. 3a,b) as well as shrinkage of soma size and reduced survival of motor neurons together with early signs of NMJ innervation deficits at P300 (Fig. 3c–e and Extended Data Fig. 2). Thus, AAV9-mediated SMN overexpression induces selective deafferentation of motor neurons and late-onset neurodegeneration in WT mice.
Fig. 2 /. AAV9-SMN induces late-onset deafferentation of motor neurons in WT and SMA mice.

a, Choline acetyltransferase (ChAT, blue) and vesicular glutamate transporter 1 (VGluT1, grey) immunostaining of L5 lateral motor column (LMC) motor neuron somata and dendrites from uninjected, AAV9-GFP (5) and AAV9-SMN (5 and 10) injected WT mice at P300. Scale bar=25μm. Dendrites Scale bar=10μm. b, Total number of VGluT1+ synapses on L5 LMC motor neuron somata at P150 and P300 from the same groups as in (a). The box-and-whiskers graph shows the median, interquartile range, minimum and maximum from the following number of neurons and animals per group at P150 (WT, n=39 neurons, n=3 animals; WT + GFP(5), n=36 neurons, n=3 animals; WT + SMN(5), n=57 neurons, n=3 animals) and P300 (WT, n=41 neurons, n=3 animals; WT + GFP(5), n=41 neurons, n=3 animals; WT + SMN(5), n=39 neurons, n=3 animals; WT + SMN(10), n=36 neurons, n=4 animals). Statistics were performed with one-way ANOVA with Tukey’s post hoc test. (****) P<0.0001; (***) P<0.001. WT P150 vs SMN(5) P150: P<0.0001, q=16.96, df=283; GFP(5) P150 vs SMN(5) P150: P<0.0001, q=13.81, df=283; WT P300 vs SMN(5) P300: P<0.0001, q=22.64, df=283; WT P300 vs SMN(10) P300: P<0.0001, q=25.65, df=283; GFP(5) P300 vs SMN(5) P300: P<0.0001, q=22.14, df=283; GFP(5) P300 vs SMN(10) P300: P<0.0001, q=25.16, df=283; SMN(5) P150 vs SMN(5) P300: P=0.001, q=6.581, df=283; SMN(5) P150 vs SMN(10) P300: P<0.0001, q=10.16, df=283. c, Density of VGluT1+ synapses on L5 LMC motor neuron proximal dendrites (number of synapses divided by the dendritic length up to 50μm from soma) at P150 and P300 from the same groups as in (a). The box-and-whiskers graph shows the median, interquartile range, minimum and maximum from the following number of dendrites and animals per group at P150 (WT, n=35 dendrites, n=3 animals; WT + GFP(5), n=26 dendrites, n=3 animals; WT + SMN(5), n=33 dendrites, n=3 animals) and P300 (WT, n=36 dendrites, n=3 animals; WT + GFP(5), n=31 dendrites, n=3 animals; WT + SMN(5), n=37 dendrites, n=3 animals; WT + SMN(10), n=35 dendrites, n=4 animals). Statistics were performed with one-way ANOVA with Tukey’s post hoc test. (****) P<0.0001; (***) P<0.001; (*) P<0.05. WT P150 vs SMN(5) P150: P<0.0001, q=12.90, df=226; GFP(5) P150 vs SMN(5) P150: P<0.0001, q=12.77, df=226; WT P300 vs SMN(5) P300: P<0.0001, q=16.95, df=226; WT P300 vs SMN(10) P300: P<0.0001, q=18.55, df=226; GFP(5) P300 vs SMN(5) P300: P<0.0001, q=16.74, df=226; GFP(5) P300 vs SMN(10) P300: P<0.0001, q=18.30, df=226; SMN(5) P150 vs SMN(5) P300: P=0.0261, q=4.523, df=226; SMN(5) P150 vs SMN(10) P300: P=0.0003, q=6.258, df=226. d, ChAT (blue) and VGluT1 (grey) immunostaining of L2 spinal segments from WT (SMNΔ7) mice and SMA mice treated with AAV9-GFP (5) or AAV9-SMN (5) at the indicated times. Scale bar=10μm. e, Total number of VGluT1+ synapses on L2 motor neuron somata from the same groups as in (d). The box-and-whiskers graph shows the median, interquartile range, minimum and maximum from the following number of neurons from n=3 animals per group at P11 (WT (SMNΔ7), n=31 neurons; SMA + GFP(5), n=38 neurons; SMA + SMN(5), n=34 neurons) and P190 (WT (SMNΔ7), n=27 neurons; SMA + SMN(5), n=30 neurons). Statistics were performed with one-way ANOVA with Tukey’s post hoc test. (****) P<0.0001. WT (SMNΔ7) P11 vs SMA+GFP(5) P11: P<0.0001, q=16.76, df=155; SMA+GFP(5) P11 vs SMA+SMN(5) P11: P<0.0001, q=15.09, df=155; WT (SMNΔ7) P190 vs SMA+SMN(5) P190: P<0.0001, q=10.34, df=155; SMA+SMN(5) P11 vs SMA+SMN(5) P190: P<0.0001, q=12.51, df=155.
Fig. 3 /. AAV9-SMN induces late-onset neurodegeneration in WT mice.

a, Parvalbumin (PV) immunostaining of L5 DRGs from uninjected, AAV9-GFP (5) and AAV9-SMN (5 and 10) injected WT mice at P300. Scale bar=250μm. b, Total number of proprioceptive neurons (PNs) in L5 DRGs from the same groups as in (a). Data represent mean and SEM (n=3 DRGs from n=3 animals). Statistics were performed with one-way ANOVA with Tukey’s post hoc test. (*) P<0.05; (**) P<0.01; (***) P<0.001. WT vs SMN(5): P=0.0463, q=4.606, df=8; WT vs SMN(10): P=0.0005, q=10.07, df=8; GFP vs SMN(5): P=0.0087, q=6.350, df=8; GFP vs SMN(10): P=0.0001, q=11.81, df=8. c, ChAT immunostaining of L5 spinal segments from uninjected, AAV9-GFP (5), AAV9-SMN (5 and 10) injected WT mice at P300. Scale bar=100μm. d, Soma size of motor neurons (MNs) from the same groups as in (c) at P300. The violin plot shows the median (solid line) and interquartile range (dotted lines) from the following number of motor neurons from 3 animals per group (WT, n=253 neurons; WT + GFP(5), n=271 neurons; WT + SMN(5), n=251 neurons; WT + SMN(10), n=258 neurons). Statistics were performed with one-way ANOVA with Tukey’s post hoc test. (*) P<0.05; (****) P<0.0001. WT vs SMN(5): P=0.0138, q=4.272, df=1026; WT vs SMN(10): P<0.0001, q=19.98, df=1026; GFP vs SMN(5): P=0.0248, q=3.995, df=1026; GFP vs SMN(10): P<0.0001, q=19.99, df=1026. e, Percentage of the number of L5 LMC motor neurons (MNs) per 75μm section relative to WT in the same groups as in (c) at P300. The box-and-whiskers graph shows the median, interquartile range, minimum and maximum from the following number of sections and animals per group (WT, n=48 sections, n=3 animals; WT + GFP(5), n=48 sections, n=3 animals; WT + SMN(5), n=46 sections, n=3 animals; WT + SMN(10), n=55 sections, n=4 animals). Statistics were performed with one-way ANOVA with Tukey’s post hoc test. (***) P<0.001; (****) P<0.0001. WT vs SMN(10): P=0.0001, q=6.218, df=193; GFP vs SMN(5): P=0.0005, q=5.680, df=193; GFP vs SMN(10): P<0.0001, q=9.531, df=193.
We then investigated whether AAV9-SMN had similar late-onset effects in the sensory-motor circuit of SMA mice, which display motor neuron death, NMJ denervation and loss of proprioceptive inputs as disease-specific deficits induced by SMN deficiency2. AAV9-SMN significantly improved all of these disease-related deficits when assessed at P11 relative to AAV9-GFP treated SMA mice (Fig. 2d,e and Extended Data Fig. 3a–e). Specifically, the number of VGluT1+ proprioceptive synapses onto motor neuron somata was decreased by 70% in SMA mice injected with AAV9-GFP relative to control SMNΔ7 WT mice and fully rescued by treatment with AAV9-SMN at P11 (Fig. 2d,e), consistent with early correction of sensory-motor circuit deficits26,27. Remarkably, however, the same proprioceptive synapses showed a dramatic reduction by P190 in AAV9-SMN treated SMA mice (Fig. 2d,e). These findings indicate that AAV9-SMN treatment in SMA mice promotes early rescue of the disease-linked loss of proprioceptive synapses onto SMA motor neurons27,28, but this correction is followed by a late-onset loss of the same synapses due to gain of toxic function of long-term SMN overexpression. Similarly, the soma size of motor neurons that is strongly reduced in GFP treated SMA mice was fully rescued by AAV9-SMN at P11, but an SMN-dependent reduction was again apparent at P190 (Extended Data Fig. 3c). In contrast, AAV9-SMN mediated correction of NMJ innervation and motor neuron survival that are severely affected in SMA mice at P11 did not change over time and no loss of proprioceptive neurons was observed at P190 (Extended Data Fig. 3d–f). Note that AAV9-GFP treated SMA mice do not survive past 14 days of age (Fig. 1c) and therefore could not be analyzed at P190, and later time points could also not be analyzed in SMA mice treated with AAV9-SMN due to their relatively limited survival extension (Fig. 1c). Collectively, these results reveal that selective deafferentation of motor neurons compounded by late-onset neurodegenerative processes are common features of sensory-motor toxicity induced by AAV9-SMN across mouse models.
AAV9-SMN drives overexpression and cytoplasmic aggregation of SMN in neurons
To gain insight into mechanisms of AAV9-SMN toxicity, we first assessed transgene expression over time. Immunohistochemistry showed high transduction and sustained GFP expression in motor neurons and proprioceptive neurons of WT mice at P11 and P300 (Fig. 4a). Further, the percent transduction of these neurons at P300 is comparable to levels we previously reported at P11 (Extended Data Fig. 4a,b)28,29. In contrast to neurons, GFP expression in the liver was high and widespread at P11, but nearly absent by P300 (Fig. 4a). These findings were confirmed by analysis of viral-mediated GFP and human SMN expression at the RNA and protein level in both WT and SMA mice (Fig. 4b–e and Extended Data Figs. 4 and 5). Western blot analysis of WT mice injected with AAV9-SMN demonstrated overexpression of SMN above endogenous levels found in spinal cord (~2-fold) and liver (~20-fold) from uninjected and AAV9-GFP injected controls at P11 (Fig. 4b–e), which is maintained in the spinal cord but lost in the liver at P300 (Fig. 4b–e). Overall similar results were found in SMA mice (Extended Data Fig. 5), although the levels of SMN overexpression appeared lower than in WT mice. This may reflect differences in genetic background (FVB versus C57BL6J) and/or phenotype (normal versus SMA) of the mouse models and also account for the delayed onset of the hindlimb clasping phenotype induced by AVV9-SMN in SMA versus WT mice (Fig. 1d,g).
Fig. 4 /. AAV9 drives long-term transgene overexpression in motor neurons and proprioceptive neurons but not the liver of WT mice.

a, DAPI (blue), GFP (green) and either ChAT (red, top panels) or PV (red, middle panels) immunostaining of L5 spinal cords from uninjected and AAV9-GFP (5) injected WT mice at P11 and P300. Scale bar=250μm. b, Western blot analysis of spinal cord from of uninjected and either AAV9-GFP (5) or AAV9-SMN (5) injected WT mice at P11 and P300. SMN expression was analyzed with antibodies that specifically detect only human SMN (hSMN) or both human and mouse SMN (pan-SMN). Cropped images are shown. c, Quantification of SMN protein levels from the Western blot analysis in (b). Data represent mean and SEM (n=3 animals) normalized to Gapdh and expressed relative to levels in WT mice at P11 set as 1. Statistics were performed with one-way ANOVA with Tukey’s post hoc test. (***) P<0.001; (ns) no significance. WT P11 vs SMN(5) P11: P=0.0008, q=8.378, df=12; WT P11 vs SMN(5) P300: P=0.0002, q=9.952, df=12; SMN(5) P11 vs SMN(5) P300: P=0.8671, q=1.574, df=12. d, Western blot analysis of liver from the same groups as in (b). SMN expression was analyzed with antibodies that specifically detect only human SMN (hSMN) or both human and mouse SMN (pan-SMN). Cropped images are shown. e, Quantification of SMN protein levels from the Western blot analysis in (d). Data represent mean and SEM (n=3 animals) normalized to Gapdh and expressed relative to levels in WT mice at P11 set as 1. Statistics were performed with one-way ANOVA with Tukey’s post hoc test. (****) P<0.0001. WT P11 vs SMN(5) P11: P<0.0001, q=11.93, df=12; SMN(5) P11 vs SMN(5) P300: P<0.0001, q=10.95, df=12.
Western blot data largely underestimate the actual degree of SMN overexpression specifically in transduced cells such as motor neurons due to differences of AAV9 tropism in distinct tissues. While AAV9-GFP shows most DRG neurons and liver cells are transduced (Fig. 4a), viral tropism in the spinal cord is much more selective, leading to efficient targeting and strong expression in ~70% of motor neurons but few other spinal cells (Fig. 4a and Extended Data Fig. 4a)28,29. The tissue-specific AAV9 transduction profile likely accounts for differences in the total levels of full-length human SMN mRNA measured by RT-qPCR in the spinal cord, liver and DRGs of AAV9-SMN treated SMA mice at P11 that are, respectively, ~40, ~700 and ~2,500 fold higher than in AAV9-GFP injected SMA mice and uninjected WT littermates in which full-length SMN is expressed from two copies of the SMN2 gene (Extended Data Fig. 5a–c). Even considering that SMN2 genes express only ~10% of full-length SMN mRNA relative to a normal SMN1 allele1,2, the data provide direct evidence for vast overexpression of SMN well beyond normal physiological levels in motor circuit neurons transduced by AAV9-SMN.
We next sought to analyze the subcellular distribution of SMN expressed by AAV9 over time. The expected localization of endogenous SMN throughout the cytoplasm and in nuclear bodies called Gems was observed in motor neurons and proprioceptive neurons from uninjected and AAV-GFP injected mice (Fig. 5a,b and Extended Data Fig. 6a,c). In stark contrast, motor neurons and proprioceptive neurons from WT and SMA mice injected with AAV9-SMN showed accumulation of SMN in cytoplasmic aggregates that grow larger over time (Fig. 5a,b and Extended Data Fig. 6a,c). SMN aggregates are widespread and present in over 85% of motor neurons and ~90% of proprioceptive neurons in AAV9-SMN treated WT mice at P300 (Extended Data Fig. 6b,d), consistent with the transduction efficiency of these neurons by AAV9 (Extended Data Fig. 4a,b). Large cytoplasmic aggregates of SMN are also present in ~70% of motor neurons and ~80% of proprioceptive neurons from SMA mice injected with AAV9-SMN at P190 (Extended Data Fig. 6e–h).
Fig. 5 /. AAV9-SMN induces cytoplasmic aggregation of SMN and SmB proteins.

a, ChAT (red) and SMN (green) immunostaining of L5 LMC motor neurons (MNs) from WT mice uninjected and injected with AAV9-GFP (5) or AAV9-SMN (5) at P300. Scale bar=10μm. Arrowheads point to nuclear Gems. b, PV (red) and SMN (green) immunostaining of L5 DRG proprioceptive neurons (PNs) from the same groups as in (a) at P300. Scale bar=10μm. Arrowheads point to nuclear Gems. c, ChAT (red) and SmB (green) immunostaining of L5 LMC motor neurons (MNs) from the same groups as in (a) at P300. Scale bar=10μm. d, PV (red) and SmB (green) immunostaining of L5 DRG proprioceptive neurons (PNs) from the same groups as in (a) at P300. Scale bar=10μm. e-f, ChAT (grey), SMN (green) and SmB (red) immunostaining of an L5 LMC motor neurons (e) and proprioceptive neurons (f) in WT mice injected with AAV9-SMN (5) at P300. Scale bar=5μm. g-h. Normalized nuclear SmB fluorescence intensity in L5 LMC motor neurons (g) and proprioceptive neurons (h) from the same groups as in (e) and (f) at P300. The violin plots show the median (solid line) and interquartile range (dotted lines) from the following number of motor neurons (WT, n=210 neurons; WT + GFP(5), n=266 neurons; WT + SMN(5), n=234 neurons) and proprioceptive neurons (WT, n=172 neurons; WT + GFP(5), n=186 neurons; WT + SMN(5), n=174 neurons) from 3 mice per group. Statistics were performed with one-way ANOVA with Tukey’s post-hoc test. (**) P<0.01; (****) P<0.0001. For motor neurons, WT vs SMN(5): P<0.0001, q=12.99, df=707; GFP(5) vs SMN(5): P<0.0001, q=15.37, df=707. For proprioceptive neurons, WT vs SMN(5): P=0.0036, q=4.589, df=529; GFP(5) vs SMN(5): P<0.0001, q=7.422, df=529.
Collectively, these experiments show that AAV9-mediated gene delivery leads to massive levels of prolonged transgene overexpression in neural tissue that instead decreases over time in regenerative tissue such as the liver. This reflects the high viral load, strong tropism of AAV9 for sensory-motor circuit neurons and their post-mitotic nature that prevents dilution of the episomally maintained AAV9-genome – collectively making these neurons at increased risk for toxicities associated with long-term SMN overexpression. Importantly, the accumulation into large cytoplasmic aggregates in highly transduced neurons of the sensory-motor circuit reveals an abnormal feature of AAV9-mediated SMN overexpression.
SMN overexpression impairs spliceosomal snRNP biogenesis
The SMN protein self-oligomerizes and associates with Gemin proteins in order to form the core SMN complex that functions in snRNP assembly30. In the absence of corresponding amounts of Gemins, it is conceivable that overexpressed SMN might engage its direct protein targets but yield non-functional complexes that remain stalled in the cytoplasm, thereby acting in a dominant negative manner. To determine whether SMN aggregates could indeed exert toxic effects by trapping physiological substrates, we monitored SmB — a member of the Sm-core that is assembled on snRNAs by SMN in the cytoplasm prior to their nuclear import as snRNPs30. While displaying the expected nuclear localization in neurons from control mice, SmB accumulated in cytoplasmic aggregates in motor neurons and proprioceptive neurons of AAV9-SMN injected WT and SMA mice that showed time-dependent increases in size similar to those of SMN (Fig. 5c,d and Extended Data Fig. 7). Moreover, double immunostaining of SMN and SmB in motor neurons and proprioceptive neurons of WT mice injected with AAV9-SMN demonstrated their colocalization in the same cytoplasmic aggregates (Fig. 5e,f). Importantly, nuclear snRNP levels measured by SmB fluorescence intensity were reduced in both neuronal types from AAV9-SMN injected WT mice relative to controls at P300 (Fig. 5g,h), an SMA-like feature consistent with impaired cytoplasmic assembly of Sm cores2,31,32.
To determine the selectivity of SmB sequestration, we analyzed several other RNA binding proteins but found no accumulation in SMN aggregates of motor neurons transduced by AAV9-SMN (Extended Data Fig. 8a–h). We also found that SMN aggregates are neither co-labeled by ubiquitin nor by the autophagy marker LC3B (Extended Data Fig. 8i,j), indicating they are not engaged with protein degradation machinery. Lastly, to rule out that cytoplasmic aggregation of SMN and sequestration of SmB protein is related to species-specific differences of expressing human SMN in the mouse background, we overexpressed either GFP or SMN in HeLa cells by lentiviral transduction. Akin to sensory-motor circuit neurons in vivo, overexpressed SMN but not GFP induced large aggregates that sequestered endogenous SmB in cultured human cells (Extended Data Fig. 9). Thus, additional modes of toxicity notwithstanding, long-term overexpression of SMN induces cytoplasmic aggregates that specifically sequester Sm proteins, leading to impairment of snRNP biogenesis and consequent reduction in the nuclear pool of snRNPs through toxic gain of function.
Long-term SMN overexpression induces widespread transcriptome abnormalities in DRGs
The global effects of AAV9-SMN on gene expression and pre-mRNA splicing have not been investigated before. To follow up on potential downstream events of dysregulated snRNP biogenesis, we performed RNA-Seq analysis of lumbar DRGs from WT mice at P300 that were untreated or injected with either AAV9-GFP or AAV9-SMN. We identified 405 high-confidence splicing changes specifically induced by AAV9-SMN relative to both AAV9-GFP injected and uninjected WT mice (Fig. 6a and Supplementary Table 1). Differentially spliced individual cassette exons (51%) and intron retention (18%) were the most common SMN-dependent changes (Fig. 6b). Moreover, decreased inclusion of alternatively spliced exons and increased retention of introns accounted for the vast majority of these changes (Fig. 6c and Supplementary Table 1), consistent with expected effects of reduced snRNP availability on splicing33.
Fig. 6 /. Long-term AAV9-mediated SMN overexpression induces widespread transcriptome alterations in DRGs.

a, Venn diagram of splicing changes in lumbar DRGs from uninjected and either AAV9-GFP (5) or AAV9-SMN (5) treated WT mice at P300 (|ΔPSI|≥0.1, and FDR≤0.05). b, Pie chart of the proportion of different types of splicing changes induced by AAV9-SMN in DRGs of WT mice. The splicing events include cassette exons (CAS), intron retention (IRET), alternative 3’ splice sites (ALT 3’), alternative 5’ splice sites (ALT 5’), tandem cassette exons (TACA), and mutually exclusive exons (MUTX). c, Bar graph of the number of skipped and included cassette exons as well as increased and decreased intron retention events induced by AAV9-SMN in DRGs of WT mice at P300. d-f, Volcano plot of the indicated two-way comparisons of transcript level changes in lumbar DRGs from uninjected and either AAV9-GFP (5) or AAV9-SMN (5) treated WT mice at P300. Significant changes with a multiple-test adjusted P value of <0.05 using edgeR are shown in red. g, Venn diagram of transcript level changes in lumbar DRGs from uninjected and either AAV9-GFP (5) or AAV9-SMN (5) treated WT mice at P300 (fold change>2; FDR<0.05). h, Gene ontology analysis of the most enriched biological pathways associated with AAV9-SMN dependent gene changes in lumbar DRGs. i-l, Representative RNA-seq tracks for C1qa (h), C1qb (i), C1qc (j) and Chodl (l) reads from lumbar DRGs of uninjected and either AAV9-GFP (5) or AAV9-SMN (5) treated WT mice at P300.
We also found widespread transcriptome alterations associated with AAV9-SMN gene delivery while AAV9-GFP had essentially no effects at the mRNA level (Fig. 6d–f). We identified 531 differentially expressed mRNAs in DRGs of AAV9-SMN injected mice relative to both AAV9-GFP injected and uninjected WT mice (Fig. 6g and Supplementary Table 2). Interestingly, gene ontology analysis identified strong induction of genes associated with neuroinflammation and the innate immune response (Fig. 6h). Collectively, these changes likely reflect system-level events downstream of SMN-dependent neuronal insults. Of note, these include upregulation of all three subunits of the C1q complex (Fig. 6i–k), which mediates diverse immune surveillance activities in development and disease of the CNS including synaptic pruning34 and has been directly implicated in the loss of proprioceptive synapses in mouse models of SMA35. It is also conceivable that alterations in the expression of cell surface and adhesion molecules that are of crucial importance for neuronal survival and function as well as regulation of immune responses contribute to the observed neurodegenerative processes induced by AAV9-SMN (Fig. 6h)36. One relevant example is the observed downregulation of Chondrolectin (Chodl) mRNA (Fig. 6l), the dysregulation of which has previously been implicated in SMA neuropathology37. Thus, while causality between specific gene changes identified above and neurotoxicity remains to be established, long-term AAV9-mediated SMN overexpression induces splicing dysregulation and widespread transcriptome alterations that can have pathogenic effects in neural tissue.
Discussion
Our study provides direct evidence of late-onset toxicity specifically induced by AAV9-mediated SMN overexpression in the sensory-motor circuit, adding a new aspect that needs careful consideration for the long-term safety of SMA gene therapy. Together with a previous study20 and recent safety findings that led to halting of intrathecal gene delivery in SMA patients21, features of sensory neurotoxicity of AAV9-SMN have emerged across different delivery modes (intravenous and intrathecal), genetic drivers (GUSB and CBA), and animal models (mice, piglets and non-human primates). Importantly, mechanisms of toxicity were unknown and never previously associated with SMN-intrinsic deleterious effects as it was widely assumed that excess SMN would not be harmful. However, the potential for gain of toxic function by overexpression of SMN has been overlooked. Accordingly, we reveal slow-progressing, neuron-specific toxicity elicited by high levels of SMN that accumulate in transduced, non-dividing neurons and sequester endogenous snRNP proteins — a scenario that bears analogies with neurodegenerative diseases driven by accumulation of RNA-protein aggregates38. The progressive erosion of snRNP biogenesis is a plausible mechanism by which SMN aggregates could contribute to RNA dysregulation and neuronal death and dysfunction in the long term (Extended Data Fig. 10). Thus, our findings in mouse models reveal that AAV9-SMN gene therapy can have opposing effects by inducing late-onset neurotoxicity in the same neurons in which it provides early functional correction of SMA deficits. They also highlight an unanticipated scenario where both a strong excess and deficiency in SMN have detrimental effects on sensory-motor circuitry.
We highlight dose-dependency in the time of onset and severity of behavioral deficits and neurodegenerative processes induced by AAV9-SMN in mouse models. Differences in levels of SMN overexpression likely account for the delayed onset and milder toxicity we observe in SMA mice compared to WT mice. Similarly, previous studies in mouse models harboring multiple copies of human SMN transgenes did not reveal overt sensory-motor deficits because the level of SMN overexpression specifically in motor circuit neurons was likely much lower than that achieved with AAV9-SMN when the wider expression profile of transgenes is weighed against the restricted tropism of AAV9 in spinal cord39,40. While largely underestimated by protein analysis of whole tissue lysates, the level of SMN overexpression brought about by AAV9-mediated gene delivery is massive in motor neurons and proprioceptive neurons of mouse models, and the cytoplasmic sequestration of Sm proteins occurs similarly across normal and disease genetic backgrounds. Together with the striking analogies in downstream phenotypic effects, the most conservative interpretation is that toxic mechanisms elicited by SMN overexpression in the sensory-motor circuit are shared in WT and SMA mice. Additionally, inclusion of WT mice in our study was critical to establish proof-of-concept for neuronal toxicity of overexpressed SMN in vivo and draw conclusions without the potentially confounding elements of SMA pathology that affect the same neurons of the spinal sensory-motor circuit and RNA pathways in mouse models of the disease.
Our findings reveal an unanticipated mechanism of toxicity specifically associated with long-term AAV9-mediated overexpression of SMN in the sensory-motor circuit and involves – but is not necessarily limited to – inhibition of SMN’s normal function in RNA regulation, which induces SMA-like functional abnormalities including loss of proprioceptive synapses and neurodegeneration. The initial trigger is accumulation of SMN in excess over endogenous levels of core subunits of the SMN complex that are required for its function in snRNP assembly30. Owing to the intrinsic properties of SMN to self-oligomerize and directly bind Sm proteins41–43, it is conceivable that SMN overload promotes formation of non-functional complexes that sequester Sm proteins in cytoplasmic aggregates with consequent progressive impairment of snRNP biogenesis and function. Accordingly, we show that AAV9-SMN leads to reduced snRNP levels in the nuclei of sensory-motor circuit neurons and splicing dysregulation consistent with defective snRNP abundance. Thus, our results mechanistically link overexpression of SMN to downstream functional perturbation of the splicing machinery. They are also the first to document widespread transcriptome changes induced by AAV9-SMN that highlight unintended, potentially damaging molecular signatures of this gene therapy in neural tissue.
Studies in animal models can reliably identify potentially relevant clinical liabilities of SMA gene therapy. Previous work in mice revealed dose-dependent cardiac and hepatic toxicities following intravenous administration of AAV9-SMN and target organ toxicity was associated with mortality at doses two-fold above the recommended clinical dose44. Acute liver toxicity was also found in non-human primates following intravenous administration of an AAV9-like SMN vector20. Although apparently not as life-threatening as in animal models, transient liver toxicity is observed in SMA patients treated by intravenous AAV9-SMN gene therapy16,17,22,44. However, unlike these early-onset adverse events likely associated with systemic exposure to high doses of AAV9 in peripheral organs16,20,45, the neurotoxic effects leading to late-onset synaptic loss and neuronal death as well as progressive sensory-motor dysfunction that we document here are specifically dependent on SMN overexpression. It is conceivable that the same mechanisms are responsible for DRG pathology induced by AAV9-SMN in piglets and non-human primates20,22, on the basis of which intrathecal delivery in SMA patients was recently put on clinical hold21. In consideration of the very young age, extreme clinical severity and relatively limited time since treatment16,17, it is plausible that SMA type 1 patients treated with AAV9-SMN do not yet present clinical signs of neurotoxicity or that they cannot be evaluated effectively for sensory deficits due to the coarse nature of functional tests for their age. Further, neurotoxicity might appear at a later time and be especially relevant in milder SMA patients with higher SMN2 copy number and less compromised motor function or those who will receive intrathecal administration of AAV9-SMN. Indeed, delivery mode may serve as a key modulator of toxicity as the degree of transduction of sensory neurons can differ following systemic or intrathecal administration of AAV946. Importantly, one of two SMA patients deceased to date who were treated systemically with Zolgensma showed DRG abnormalities which included ganglion cell loss and the presence of inflammatory cells22. This indicates that DRG neuropathology is not restricted to animal models and may extend to AAV9-SMN treated SMA patients. As post-mortem tissue becomes available in the future, it would be important to determine whether cytoplasmic aggregation of SMN and sequestration of Sm proteins occurs in DRG neurons and spinal motor neurons of Zolgensma-treated SMA patients. Moreover, monitoring changes in the amplitude of H-reflexes over time in a clinical setting could be helpful to identify any evidence of sensory neurotoxicity in patients treated by gene therapy.
The induction of inflammatory and immune responses in DRGs appears to be a conserved feature of AAV9-SMN treatment in animal models, the origins and consequences of which are incompletely understood. It has been proposed that systemic delivery of high doses of AAV drives DRG neuropathology in piglet and non-human primates injected with an AAV9-like SMN vector independent of an immune response against the capsid or the transgene20, but the study was not designed to directly distinguish between these possibilities. Our findings that sensory-motor circuit pathology is specifically associated with AAV9-SMN but not AAV9-GFP argue against a prominent contribution of immune responses directed against the AAV9 capsid as well as other transgene-independent mechanisms to neurotoxicity in vivo. Moreover, while human and mouse SMN proteins are 82% identical and an even higher identity (>90%) is shared between human and either porcine or non-human primate SMN47,48, an adaptive immune response to human SMN could be another contributing factor to the toxicity of AAV9-SMN in naïve animal models. However, although we have not tested this experimentally in mice, a significant T-cell response against overexpressed human SMN was not found in piglets and non-human primates20. Additionally, we show that AAV9-SMN is neurotoxic in SMNΔ7 SMA mice in which human SMN is not a foreign antigen. Therefore, we argue that the observed signatures of inflammation and immune response in DRGs are secondary events downstream of initial intrinsic insults triggered by overexpression of SMN in neurons. Moving forward, mechanistic studies are required to determine the precise nature of the inflammatory and immune responses as well as their potential contribution to neurotoxicity induced by AAV9-SMN.
In conclusion, the gain of toxic function of SMN overexpression is a newly identified aspect of SMN biology that has clinically relevant implications due to the current use of AAV9-SMN for treatment of SMA patients. It provides conceptual framework to explain the unanticipated adverse effects of AAV9-SMN in the sensory-motor circuit of animal models and provides a note of caution regarding the use of SMA gene therapy in humans. Together with the plausible irreversibility of sustained SMN overload in neurons driven by AAV9-SMN gene therapy, this knowledge will impact the cost-benefit evaluation of gene therapy relative to other available options and be helpful for guiding patients to make informed decisions about which SMA treatment to pursue. Our findings suggest that late-onset neurodegenerative pathology might follow early clinical benefits in patients treated with AAV9-SMN. They also provide a compelling case for potential risks associated with uncontrolled, long-lasting transgene expression especially in neurons. This has broader therapeutic implications beyond SMA and underscores the general importance of embedding tunable on/off switches in gene therapy vectors as de-risking strategies against unwanted protein toxicities.
Methods
AAV9 production.
Vectors containing the open reading frames of GFP and human SMN cloned downstream of the GUSB promoter of vectors harboring AAV2 ITRs were previously described10. DNA for production of AAV9 vectors was purified using endotoxin free Mega prep kit (Qiagen) according to the manufacturer’s instructions. The recombinant plasmids were each packaged into AAV serotype-9 capsid by triple-plasmid transfection of human HEK-293 cells, and virions were purified by CsCl gradient centrifugation as previously described23,32. The resulting vectors were concentrated using Amicon Ultracel centrifugal filter devices with a 30,000 nominal molecular weight limit (Millipore) and titered by qPCR. Three different vector preparations were used in this study.
Animal procedures.
All mouse work was performed in accordance with the National Institutes of Health Guidelines on the Care and Use of Animals, complied with all ethical regulations and was approved by the IACUC committee of Columbia University. Mice were housed in a humidity (40–60%) and temperature (~18–23°C) controlled animal facility with a 12 h/12 h light/dark cycle with free access to food and water. Equal proportions of mice of both sexes were used in all experiments and aggregated data are presented because gender-specific differences were not found. C57BL6J mice were obtained from the Jackson Laboratory (Jax stock #000664). The SMNΔ7 mouse line FVB.Cg-Grm7Tg(SMN2)89Ahmb Smn1tm1Msd Tg(SMN2*delta7)4299Ahmb/J on a pure FVB/N genetic background was obtained from the Jackson Laboratory (Jax stock #005025) and used to generate SMA mice (Smn−/−/SMN2+/+/SMNΔ7+/+). Genotyping of the Smn knockout allele was performed using tail DNA PCR and the primers listed in Supplementary Table 3 as previously described28. ICV injections were carried out at P0 in SMNΔ7 mice and P1 in C57Bl6J mice anesthetized by isoflurane inhalation by a single injection of 5μl in the right lateral ventricle of the brain. For AAV9 gene delivery, we delivered varying genome copies of the indicated AAV9 vectors as specified in phosphate buffered saline (PBS) containing 5% sorbitol, 0.001% Pluronic F-68 and a vital dye (Fast Green, Sigma). Mice were sacrificed and tissue collection was performed in a dissection chamber under continuous oxygenation (95%O2/5%CO2) in the presence of cold (~12°C) artificial cerebrospinal fluid (aCSF) containing 128.35mM NaCl, 4mM KCl, 0.58mM NaH2PO4, 21mM NaHCO3, 30mM D-Glucose, 1.5mM CaCl2, and 1mM MgSO4. Tissues were then post-fixed in 4% PFA for immunohistochemistry or flash frozen for RNA and protein analysis.
Mouse behavioral assays.
For the inverted grid assay, animals were placed on a grid with 1 cm by 1 cm dimensions and inverted over a 30 cm tall cylinder until falling. Three trials were performed for each animal with a cut-off time of 180 seconds and averaged for each data point. Animals were assayed on the inverted grid weekly, and performance over 4 weeks was averaged and reported in monthly time bins. For the rotarod assay, animals were first trained at a constant speed of 4 rpm for three trials until able to perform the test. For data collection animals were placed on the rotarod and the speed was accelerated from 4 rpm to 40 rpm over a period of 300 seconds. Three trials were performed for each animal and the times of fall were recorded and averaged for each data point. Animals were assayed on the rotarod weekly, and performance over 4 weeks was averaged and reported in monthly time bins.
Electrophysiology.
EMG recordings were performed under isoflurane anesthesia (2% vaporized in O2 at a 2 liters per minute flow rate). A pair of needle electrodes was inserted in the thigh for sciatic nerve stimulation and another pair of electrodes was inserted in the hind paw for interosseous muscles electromyogram recording. A constant current stimulator was used to deliver short pulses (0.2ms in duration) at different frequencies (0.1Hz to 50Hz). The stimulation intensity was ranged from sub-threshold levels for the induction of compound muscle action potentials to twice this intensity (sufficient to elicit maximal M-waves amplitude). The maximal amplitude reached throughout the stimulation intensity range for the H-reflex was acquired and stored for analysis. Body temperature was monitored and maintained at 38°C with a heating pad throughout the entire recording session and the mouse was euthanized immediately thereafter with an intraperitoneal injection of tribromoethanol (300 mg/kg) followed by cervical dislocation. Clampex (v10.2, Molecular Devices) software was used for data acquisition and Clampfit (v10.2, Molecular Devices) was used for data analysis.
RNA analysis.
Purification of total RNA from mouse spinal cords and liver was carried out using TRIzol reagent (Invitrogen) as per manufacturer’s instructions followed by treatment with RNAse-free DNaseI (Ambion). For RNA analysis from DRGs, total RNA was isolated using RNAqueous®-Micro Kit (Ambion) including DNaseI treatment. cDNA was generated using RevertAid RT Reverse Transcription Kit (ThermoFisher) with random hexamer and oligo dT primers. RT-qPCR analysis was done using SYBR Green (Applied Biosystems) in technical triplicates and normalized to endogenous Gapdh mRNA levels. The primers used for RT-qPCR experiments are listed in Supplementary Table 3.
Protein analysis.
Proteins from mouse spinal cord and liver tissue were homogenized in SDS PAGE sample buffer and quantified using RC DC™ protein assay (BioRad). Protein extracts were run on 12% polyacrylamide gel and transferred to nitrocellulose membranes as previously described31. Blocking was done in 5% milk in PBS/0.1% Tween and primary and secondary antibodies were diluted in PBS/0.1% Tween. Chemiluminescence was carried out using a SuperSignal West Pico chemiluminescent substrate (Thermo Scientific) according to the manufacturer’s instructions. Signal was detected by autoradiography using Full Speed Blue sensitive medical X-ray film (Ewen Parker X-Ray Corporation). SMN protein levels were quantified by densitometry analysis and normalized to the levels of endogenous Gapdh using Fiji (v1.0). The antibodies used for these experiments are listed in Supplementary Table 4.
RNA Sequencing and bioinformatics.
Total RNA was isolated from lumbar DRGs using RNAqueous®-Micro Kit (Ambion) followed by DNaseI treatment. RNA quality and quantity were assessed using the 2100 Bioanalyzer (Agilent). Total RNA from three independent replicates per experimental group were deep-sequenced with the Illumina NovaSeq 6000 platform, yielding about 80 million 2×100 paired-end reads per sample. RTA3 and bcl2fastq2 (v2.20) were used for base calling and conversion of sequencing data. All RNA-Seq data were mapped to the reference mouse genome (mm10) and a database of exon junctions using OLego (v1.1.5)49. As described previously50, the Quantas pipeline was used to perform differential splicing and gene expression analysis between WT, AAV-GFP, and AAV-SMN. Briefly, to identify exons with differential splicing in two compared conditions, a two-sided Fisher’s exact test with multiple testing correction using the Benjamini-Hochberg procedure51 to estimate false discovery rate (FDR) was employed to determine the statistical significance of splicing changes using both exonic and junction reads that support each of the two splice isoforms. All the biological replicates were combined for quantification. An event was determined to be differentially spliced if the event had sufficient read coverage (coverage≥20), change of percent spliced in |ΔPSI|≥0.1, and FDR≤0.05. The edgeR method included in the Quantas pipeline was used to perform differential expression analysis52. Statistical significance of differentially expressed genes within two compared conditions was called by requiring FDR<0.05 and fold change >2. Gene ontology (GO) analysis was performed using DAVID version 6.853.
Lentivirus transduction.
Lentiviral constructs expressing human SMN or GFP from the CMV promoter were generated by standard cloning techniques using the pRRLSIN.cPPT.PGK-GFP.WPRE vector (Addgene plasmid 12252) as initial backbone. Viral stocks pseudotyped with the vesicular stomatitis G protein (VSV-G) were prepared by transient co-transfection of HEK293T cells (Open Biosystems) using the ViraPower™ Lentiviral Packaging Mix (Invitrogen) following manufacturer’s instructions. Supernatant was collected 48 hours post transfection. Lentivirus was concentrated by ultracentrifugation at 19,500 rpm for 2.5 hours at 20°C, reconstituted in PBS, and stored in aliquots at −80°C. The viral titer was determined with the Lenti-XTM qRT-PCR Titration Kit (Clontech). A multiplicity of infection of 1:1 was used to transduce HeLa cells grown in DMEM with high glucose (Invitrogen) containing 10% of FBS (HyClone), 2 mM glutamine (Gibco), and 1% penicillin and streptmomycin (Gibco).
Immunofluorescence analysis.
HeLa cells were processed by immunofluorescence analysis five days post lentiviral transduction. Following a brief wash with PBS, cells were fixed with 4% paraformaldehyde (PFA) in PBS for 15 minutes at room temperature, and permeabilized with 0.5% Triton X-100–PBS for 10 minutes at room temperature. Blocking and incubation with both primary and secondary antibodies were performed at room temperature using 3% bovine serum albumin (BSA) in PBS for 2 hours and 1 hour, respectively. Images were collected with an SP5 Leica confocal microscope.
Immunohistochemistry analysis.
For spinal cord and DRG analysis, dissected tissue was fixed in 4% PFA for 24 hours, and then specific lumbar segments were identified by the ventral roots. Segments were embedded in agar and sectioned at 75μm with a VT1000 S vibratome (Leica). Sections were blocked in 10% donkey serum in 0.01M PBS/0.4% Triton-X for 1.5 hours. For DRG’s stained with mouse primary antibodies, an additional blocking step with 40μg/mL of anti-mouse IgG Fab Fragment (Jackson) for 2 hours in PBS was performed, then sections were incubated with primary antibodies overnight at room temperature. Six washing steps of 10 minutes each were done prior to incubation with secondary antibodies (Jackson) in PBS for 3 hours at room temperature. Another six washing steps were performed before sections were mounted in 30% glycerol/PBS. For NMJ analysis of skeletal muscle (QL and EDL), freshly dissected tissue was fixed in 4% PFA for 2 hours, then cryoprotected in 30% sucrose overnight, embedded in OCT, and frozen. 30μm cryosections were cut and then blocked with 5% donkey serum in TBS/0.2% Triton-X for 1 hour at room temperature prior to staining. Sections were incubated with primary antibodies in blocking buffer overnight at 4°C. Following incubation, sections were washed three times for 10 minutes in TBS/0.2% Triton-X, then incubated with secondary antibodies for 1 hour at room temperature, followed by 3 washing steps. Slides were mounted with Fluoromount-G® (SouthernBiotech). The antibodies used for these experiments are listed in Supplementary Table 4.
Confocal microscopy and quantification.
All images were acquired using a Leica SP5 confocal microscope running the LAS AF software (v2.5.2.6939) and analyzed off-line using the Leica LAS X software (v1.9.0.13747) from z-stack images as previously described27,28. Images for motor neuron number quantification were acquired using a 20X objective at 3μm steps in the z-axis. Images for ChAT+ C-boutons and VGluT1+ synapses were acquired using a 40X objective at 0.3μm steps in the z-axis. The total number of ChAT+ C-boutons and VGluT1+ synapses on soma was determined by counting all the corresponding inputs on the surface of each motor neuron cell body. The density of VGluT1+ synapses on proximal dendrites was determined by measuring the number of all VGluT1+ contacts on a dendritic segment up to a distance of 50 μm from the motor neuron cell body and dividing this number by the total linear length of the dendritic segment27. Synaptic coverage was determined by scoring a minimum of 8 motor neurons/dendrites per mouse and three or more mice for each treatment group and time point. One-way ANOVA analysis was performed to confirm that there was no statistically significant difference in the mean and variance of the number of synaptic inputs across individual mice within any treatment group. The number of synapses on soma and dendrites from all motor neurons within a group were then pooled and used for comparison with those from other treatment groups26–29,32. The statistical comparisons presented in this study are upheld when the mean of synaptic inputs is averaged per mouse (Supplementary Table 5). Images for NMJ innervation quantification were obtained using a 20X objective at 2μm steps in the z-axis. Images for SmB intensity analysis were acquired using a 40X objective at identical settings for WT and SMA samples at 3μm steps and analysis was performed using LASAX software by measuring the peak intensity per unit area of the nuclear region of motor neurons as previously described32. Motor neuron area was quantified as the maximum cross-sectional area of each neuron using Fiji (v1.0).
Statistics and Reproducibility.
Differences between two groups were analyzed by two-tailed unpaired Student’s t-test and differences among three or more groups were analyzed by one-way or two-way ANOVA followed by the Tukey’s post hoc tests for multiple comparisons as indicated. Comparison of survival curves was performed with the Mantel-Cox log-rank test. GraphPad Prism (v8.4.2) was used for all statistical analyses and P values are indicated as follows: * P < 0.05; ** P < 0.01; *** P < 0.001; **** P< 0.0001. All micrographs are representative images of at least three experiments performed with independent biological samples.
Reporting Summary.
No statistical methods were used to pre-determine sample sizes, but our sample sizes are similar to those reported in previous publications26–29,32. Data distribution was assumed to be normal, but this was not formally tested. Experimental animals were randomly assigned to treatment groups. Blinding to treatment conditions was utilized when running behavioral assays, sequencing experiments, and electrophysiological recordings. Further information on research design is available in the Life Sciences Reporting Summary linked to this article.
Data availability
The data supporting the findings of this study are available in this paper or the Supplementary Information. Sequencing data have been deposited in the GEO database under accession number GSE149391. Full uncropped blots are available as Source data. Any other raw data that support the findings of this study are available from the corresponding author upon reasonable request.
Code availability
This study did not generate any unique code.
Extended Data
Extended Data Fig. 1 /. Long-term AAV9-mediated SMN overexpression decreases sensory-motor synaptic transmission of proprioceptive neurons.

a-c, Representative EMG recordings from the footpad of uninjected (a) and either AAV9-GFP (5) (b) or AAV9-SMN (5) (c) treated WT mice at P300 using a stimulation frequency of 0.1Hz. This analysis captures both proprioceptive synaptic function (H-reflex) and motor neuron function (M-response), and the H/M ratio can determine a preferential deficit in either response. Arrows point to the stimulus artifact. d, Amplitude of the M-response from the same groups as shown in (a-c). The box-and-whiskers graph shows the median, interquartile range, minimum and maximum (n=8 animals). Statistics were performed with one-way ANOVA with Tukey’s post hoc test. (ns) no significance. P=0.9741, F2, 21=0.02629. e, Amplitude of H-reflex from the same groups as shown in (a-c). The box-and-whiskers graph shows the median, interquartile range, minimum and maximum (n=8 animals). Statistics were performed with one-way ANOVA with Tukey’s post-hoc test. (*) P<0.05. WT vs SMN(5): P=0.0420, q=3.684, df=21. f, Ratio of H-reflex and M-response from the same groups as shown in (a-c). The box-and-whiskers graph shows the median, interquartile range, minimum and maximum (n=8 animals). Statistics were performed with one-way ANOVA with Tukey’s post hoc test. (*) P<0.05. WT vs SMN(5): P=0.0103, q=4.592, df=21. g, Repetitive nerve stimulation at different frequencies from 0.1 to 50 Hz does not change the amplitude of the M-response recorded from the footpad of uninjected and either AAV9-GFP (5) or AAV9-SMN (5) treated WT mice at P300. The box-and-whiskers graph shows the median, interquartile range, minimum and maximum from the following number of animals: WT (0.1–10Hz n=8; 20–50Hz n=6); WT+AAV-GFP(5) (n=8); WT+AAV-SMN(5) (0.1–10Hz n=8; 20Hz n=7; 50Hz n=6). Statistics were performed with one-way ANOVA with Tukey’s post hoc test. (ns) no significance. WT: P=0.9938, F4, 31=0.05630; WT+AAV-GFP(5): P=0.6199, F4, 35=0.06660; WT+AAV-SMN(5): P=0.5344, F4, 32=0.07997;
Extended Data Fig. 2 /. Effects of AAV9-SMN on motor neuron survival, C-boutons and NMJ innervation in WT mice.

a, ChAT immunostaining of L5 spinal segments from uninjected, AAV9-GFP (5), AAV9-SMN (5) injected WT mice at P150. Scale bar=100μm. b, Soma size of motor neurons (MNs) from the same groups as in (a) at P150. The violin plot shows the median (solid line) and interquartile range (dotted lines) from the following number of motor neurons (WT, n=227 neurons; WT + GFP(5), n=234 neurons; WT + SMN(5), n=234 neurons) from 3 animals per group. Statistics were performed with one-way ANOVA with Tukey’s post hoc test. (ns) no significance. P=0.3083, F3, 449=1.180. c, Percentage of the number of L5 LMC motor neurons (MNs) per 75μm section relative to WT in the same groups as in (a) at P150. The box-and-whiskers graph shows the median, interquartile range, minimum and maximum from the following number of sections (WT, n=36 sections; WT + GFP(5), n=31 sections; WT + SMN(5), n=43 sections) from 3 animals per group. Statistics were performed with one-way ANOVA with Tukey’s post hoc test. (*) P<0.05; (**) P<0.01. WT vs SMN(5): P=0.0284, q=3.678, df=107; GFP(5) vs SMN(5): P=0.0064, q=4.420, df=107. d, ChAT immunostaining of L5 LMC motor neurons from uninjected, AAV9-GFP (5), AAV9-SMN (5 and 10) injected WT mice at P300. Scale bar=25μm. e, Total number of ChAT+ C-boutons on L5 LMC motor neurons (MNs) from the same groups as in (d) at P150 and P300. The box-and-whiskers graph shows the median, interquartile range, minimum and maximum from the following numbers of neurons and animals at P150 (WT, n=39 neurons, n=3 animals; WT + GFP(5), n=37 neurons, n=3 animals; WT + SMN(5), n=49 neurons, n=3 animals) and P300 (WT, n=28 neurons, n=3 animals; WT + GFP(5), n=31 neurons, n=3 animals; WT + SMN(5), n=36 neurons, n=3 animals; WT + SMN(10), n=14 neurons, n=4 animals). Statistics were performed with one-way ANOVA with Tukey’s post hoc test. (ns) no significance. For motor neurons at P150, P=0.9855, F2, 122=0.01456. For motor neurons at P300, P=0.0651, F3, 105=2.481. f, NMJ immunostaining of EDL muscles with Neurofilament-M (NF-M, blue), Synaptophysin (SYP, green) and bungarotoxin (BTX, red) from the same groups as in (a) at P300. Scale bar=25μm. g, Percentage of innervated, partially innervated and denervated NMJs in the EDL muscle from the same groups as in (a) at P150 and P300. Data represent mean and SEM (n=3 animals). Statistics were performed with two-way ANOVA with Tukey’s post hoc test. (*) P<0.05. For innervated NMJs: SMN(5) P150 vs SMN(5) P300: P=0.0346, q=4.588, df=42; SMN(5) P150 vs SMN(10) P300: P=0.0317, q=4.636, df=42.
Extended Data Fig. 3 /. Effects of AAV9-SMN on motor neuron survival, soma size and NMJ innervation in SMA mice.

a, ChAT (red) immunostaining of L2 motor neurons from untreated WT (SMNΔ7) mice and either AAV9-GFP (5) or AAV9-SMN (5) treated SMA mice at the indicated times. Scale bars=75μm (P11) and 100μm (P190). b, NMJ immunostaining with Neurofilament-M (NF-M, blue), Synaptophysin (SYP, green) and bungarotoxin (BTX, red) of QL muscles from the same groups as in (a). Scale bar=25μm (P11) and 50μm (P190). c, Soma size of motor neurons (MNs) from the same groups as in (a) at P11 and P190. The violin plot shows the median (solid line) and interquartile range (dotted lines) from the following number of motor neurons at P11 WT (SMNΔ7), n=230 neurons; SMA + GFP(5), n=185 neurons; SMA + SMN(5), n=175 neurons) and P190 (WT (SMNΔ7), n=231 neurons; SMA + SMN(5), n=164 neurons) from 3 animals per group. Statistics were performed with one-way ANOVA with Tukey’s post hoc test. (**) P<0.01; (****) P<0.0001. WT (SMNΔ7) P11 vs SMA+GFP(5) P11: P<0.0001, q=7.696, df=980; SMA+GFP(5) P11 vs SMA+SMN(5) P11: P=<0.0001, q=7.714, df=980; WT (SMNΔ7) P190 vs SMA+SMN(5) P190: P=0.0058, q=4.841, df=980. d, Percentage of the number of motor neurons (MNs) per 75μm section relative to WT (SMNΔ7) in the same groups as in (a) at P11 and P190. The box-and-whiskers graph shows the median, interquartile range, minimum and maximum from the following number of sections and animals at P11 WT (SMNΔ7), n=48 sections, n=3 animals; SMA + GFP(5), n=58 sections, n=6 animals; SMA + SMN(5), n=56 sections n=6 animals) and P190 (WT (SMNΔ7), n=42 sections, n=3 animals; SMA + SMN(5), n=41 sections, n=3 animals). Statistics were performed with one-way ANOVA with Tukey’s post hoc test. (**) P<0.01; (***) P<0.001; (ns) no significance. WT (SMNΔ7) P11 vs SMA+GFP(5) P11: P<0.0001, q=13.58, df=241; WT (SMNΔ7) P11 vs SMA+SMN(5) P11: P<0.0001, q=8.359, df=241; SMA+GFP(5) P11 vs SMA+SMN(5) P11: P=0.0018, q=5.364, df=241; WT (SMNΔ7) P190 vs SMA+SMN(5) P190: P<0.0001, q=8.108, df=241; SMA+SMN(5) P11 vs SMA+SMN(5) P190: P=0.9927, q=0.6110, df=241. e, Percentage of innervated, partially innervated and denervated NMJs relative to WT (SMNΔ7) in the QL muscle from the same groups as in (b) at P11 and P190. Data represent mean and SEM (n=3 animals). Statistics were performed with two-way ANOVA with Tukey’s post hoc test. (****) P<0.0001; (ns) no significance. For innervated NMJs: WT (SMNΔ7) P11 vs SMA+GFP(5) P11: P<0.0001, q=10.72, df=30; SMA+GFP(5) P11 vs SMA+SMN(5) P11: P<0.0001, q=7.789, df=30; SMA+SMN(5) P11 vs SMA+SMN(5) P190: P=0.9999, q=0.2233, df=30. f, Total number of PV+ proprioceptive neurons (PNs) in L2 DRGs from untreated WT (SMNΔ7) mice and AAV9-SMN (5) treated SMA mice at P190. Data represent mean and SEM (n=3 DRGs from n=3 animals). Statistics were performed with unpaired Student’s t-test. (ns) no significance. P=0.9106, t=0.1196, df=4
Extended Data Fig. 4 /. Efficiency of AAV9 transduction and long-term transgene expression in tissues of WT mice.
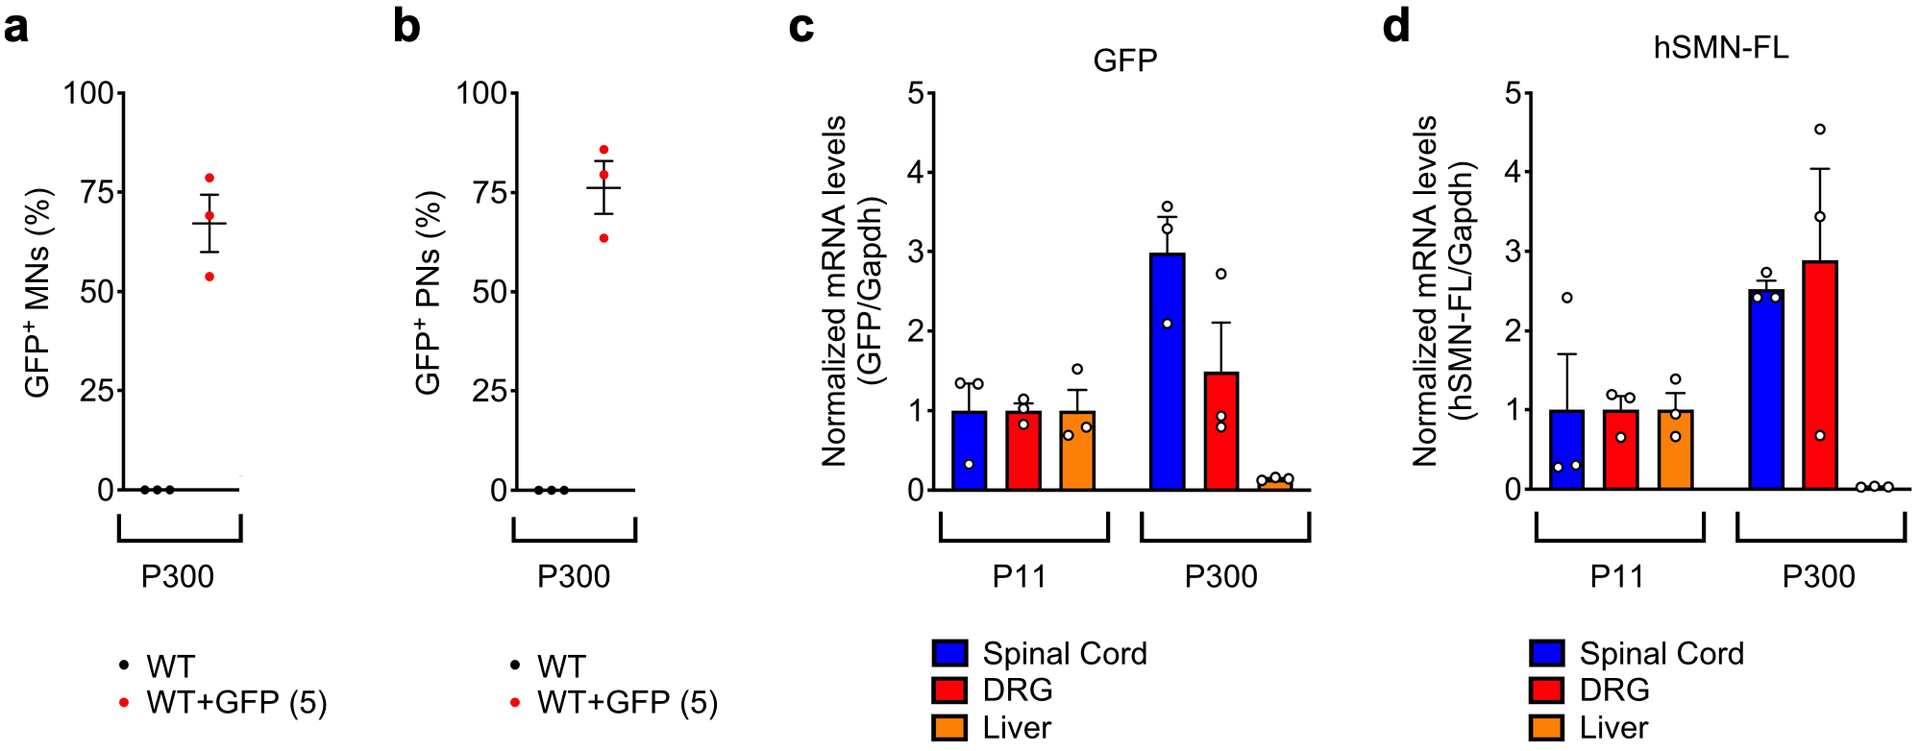
a, Percentage of GFP+ L5 LMC motor neurons from uninjected and AAV9-GFP (5) injected WT mice at P300. Data represent mean and SEM (n=3 animals). b, Percentage of GFP+ proprioceptive neurons in L5 DRGs from the same groups as in (a) at P300. Data represent mean and SEM (n=3 animals). c, RT-qPCR analysis of GFP mRNA in spinal cord, DRG and liver from WT mice injected with AAV9-GFP (5) at P11 and P300. Data represent mean and SEM (n=3 animals) normalized to Gapdh mRNA and expressed relative to levels at P11 set as 1. d, RT-qPCR analysis of full-length human SMN (hSMN-FL) mRNA in spinal cord, DRG and liver from WT mice injected with AAV9-SMN (5) at P11 and P300. Data represent mean and SEM (n=3 animals) normalized to Gapdh mRNA and expressed relative to levels at P11 set as 1.
Extended Data Fig. 5 /. AAV9-SMN leads to persistent SMN overexpression in the spinal cord and DRGs but not the liver of SMA mice.

a-c, RT-qPCR analysis of hSMN-FL mRNA levels in spinal cord (a), DRG (b) and liver (c) of uninjected WT (SMNΔ7) mice and SMA mice injected with either AAV9-GFP (5) or AAV9-SMN (5) at the indicated times. Data represent mean and SEM (n=3 animals) normalized to Gapdh mRNA and expressed relative to levels in WT (SMNΔ7) mice set as 1. Statistics were performed with one-way ANOVA with Tukey’s post hoc test. (*) P<0.05; (****) P<0.0001; (ns) no significance. For spinal cord: SMA+SMN(5) P11 vs SMA+SMN(5) P190: P=0.5887, q=2.111, df=10. For DRG: SMA+SMN(5) P11 vs SMA+SMN(5) P190: P=0.0396, q=4.866, df=10. For liver: SMA+SMN(5) P11 vs SMA+SMN(5) P190: P<0.0001, q=16.28, df=10. d-e, Western blot analysis of spinal cord (d) and liver (e) from the same groups as in (a). SMN expression was analyzed with antibodies that specifically detect only human SMN (hSMN) or both human and mouse SMN (pan-SMN). Cropped images are shown. f, Quantification of total SMN protein levels from the Western blot analysis in (d). Data represent mean and SEM (n=3 animals) normalized to Gapdh and expressed relative to levels in WT (SMNΔ7) mice set as 1. Statistics were performed with one-way ANOVA with Tukey’s post hoc test. (****) P<0.0001; (***) P<0.001. WT (SMNΔ7) P11 vs SMA+GFP(5) P11: P<0.0001, q=24.80, df=10; WT (SMNΔ7) P11 vs WT (SMNΔ7) P190: P=0.0001, q=11.12, df=10; WT (SMNΔ7) P11 vs SMA+SMN(5) P190: P=0.0003, q=9.975, df=10; SMA+SMN(5) P11 vs SMA+SMN(5) P190: P<0.0001, q=11.23, df=10. g, Quantification of human SMN protein levels from the Western blot analysis in (d). Data represent mean and SEM (n=3 animals) normalized to Gapdh and expressed relative to levels in WT (SMNΔ7) mice set as 1. Statistics were performed with one-way ANOVA with Tukey’s post hoc test. (****) P<0.0001; (***) P<0.001; (**) P<0.01; (*) P<0.05. WT (SMNΔ7) P11 vs SMA+GFP(5) P11: P=0.0165, q=5.671, df=10; WT (SMNΔ7) P11 vs SMN(5) P11: P<0.0001, q=25.08, df=10; WT (SMNΔ7) P11 vs SMA+SMN(5) P190: P=0.0009, q=8.513, df=10. SMA+SMN(5) P11 vs SMA+SMN(5) P190: P<0.0001, q=16.57, df=10. h, Quantification of total SMN protein levels from the Western blot analysis in (e). Data represent mean and SEM (n=3 animals) normalized to Gapdh and expressed relative to levels in WT (SMNΔ7) mice set as 1. Statistics were performed with one-way ANOVA with Tukey’s post hoc test. (****) P<0.0001. WT (SMNΔ7) P11 vs SMA+SMN(5) P11: P<0.0001, q=13.08, df=10; SMA+SMN(5) P11 vs SMA+SMN(5) P190: P<0.0001, q=15.56, df=10.
Extended Data Fig. 6 /. AAV9-SMN drives cytoplasmic aggregation of overexpressed SMN in motor circuit neurons of mouse models.

a, ChAT (red) and SMN (green) immunostaining of L5 LMC motor neurons (MNs) from uninjected and either AAV9-GFP (5) or AAV9-SMN (5) injected WT mice at P11 and P150. Scale bar=10μm. b, Percentage of L5 LMC motor neurons (MNs) with SMN aggregates in the same groups as in (a) at P300. Data represent mean and SEM (n=3 animals). c, PV (red) and SMN (green) immunostaining of L5 DRG proprioceptive neurons (PNs) from uninjected and either AAV9-GFP (5) or AAV9-SMN (5) injected WT mice at P11 and P150. Scale bar=10 μm. d, Percentage of L5 DRG proprioceptive neurons (PNs) with SMN aggregates in the same groups as in (c) at P300. Data represent mean and SEM (n=3 animals). e, ChAT (red) and SMN (green) immunostaining of L2 motor neurons (MNs) from WT (SMNΔ7) mice and either AAV9-GFP (5) or AAV9-SMN (5) injected SMA mice at the indicated time points. Scale bar=10μm. f, Percentage of L2 motor neurons (MNs) with SMN aggregates in the same groups as in (e) at P190. Data represent mean and SEM (n=3 animals). g, PV (red) and SMN (green) immunostaining of L2 DRG proprioceptive neurons (PNs) from the same groups as in (e). Scale bar=10μm. h, Percentage of L2 proprioceptive neurons (PNs) with SMN aggregates in the same groups as in (g) at P190. Data represent mean and SEM (n=3 animals).
Extended Data Fig. 7 /. AAV9-mediated SMN overexpression induces cytoplasmic aggregation of SmB in motor circuit neurons of mouse models.

a, ChAT (red) and SmB (green) immunostaining of L5 LMC motor neurons (MNs) from uninjected and either AAV9-GFP (5) or AAV9-SMN (5) injected WT mice at P11 and P150. Scale bar=10μm. b, PV (red) and SmB (green) immunostaining of L5 DRG proprioceptive neurons (PNs) from the same groups as in (a). Scale bar=10μm. c, ChAT (red) and SmB (green) immunostaining of L2 motor neurons (MNs) from WT (SMNΔ7) mice and either AAV9-GFP (5) or AAV9-SMN (5) injected SMA mice at the indicated time points. Scale bar=10μm. d, PV (red) and SmB (green) immunostaining of L2 proprioceptive neurons (PNs) from the same groups as in (c). Scale bar=10μm.
Extended Data Fig. 8 /. Immunohistochemical analysis of cytoplasmic SMN aggregates in motor neurons.

a-d, Immunostaining of L5 LMC motor neurons from WT mice injected with AAV9-SMN (5) at P300 with DAPI (blue), ChAT (grey), SMN (red) and RNA-binding proteins KSRP (a), FUS (b), hnRNPA1 (c) or HuR (d) as indicated. Scale bar=5μm. e-f, Immunostaining with DAPI (blue), ChAT (grey) and RNA transport factors Ran (e) and Crm1 (f) in the same motor neurons as in (a). Scale bar=5μm. g-h, Immunostaining with DAPI (blue), ChAT (grey), SMN (red) and either GW182 to label P-bodies (g) or TIA-1 to label stress granules (h) in the same motor neurons as in (a). Scale bar=5μm. i-j, Immunostaining with DAPI (blue), ChAT (grey), SMN (red) and either ubiquitin (i) or the autophagy marker LC3B (j) in the same motor neurons as in (a). Scale bar=5μm.
Extended Data Fig. 9 /. Viral-mediated overexpression of human SMN induces cytoplasmic aggregation and sequestration of SmB in human cells.

HeLa cells were untreated (mock) or transduced with lentivirus expressing either GFP (Lenti-GFP) or human SMN (Lenti-SMN). Immunostaining with DAPI (blue), GFP (grey), SMN (green) and SmB (red) was performed five days post transduction. Scale bar=10μm.
Extended Data Fig. 10 /. Model of the toxic effects of long-term AAV9-mediated SMN overexpression in neurons.

Schematic depicting the gain of toxic function mechanisms induced by long-term overexpression of SMN in the sensory-motor circuit of mouse models (see text for further details).
Supplementary Material
Acknowledgements
We are grateful to S. Jaffrey for comments and critical reading of the manuscript. This work was supported by NIH grants R01NS102451 (LP), R21NS099977 (LP), R01NS078375 (GZM) and R01AA027079 (GZM). High-performance computation was supported by NIH grants S10OD012351 and S10OD021764. This research was funded in part through the NIH/NCI Cancer Center Support Grant P30CA013696 and used the Genomics and High Throughput Screening Shared Resource.
Footnotes
Accession codes
Sequencing data have been deposited in the GEO database under accession number GSE149391.
Competing Interests
The authors declare no competing interests.
References
- 1.Burghes AHM & Beattie CE Spinal muscular atrophy: why do low levels of survival motor neuron protein make motor neurons sick? Nat. Rev. Neurosci 10, 597–609 (2009). [DOI] [PMC free article] [PubMed] [Google Scholar]
- 2.Tisdale S & Pellizzoni L Disease Mechanisms and Therapeutic Approaches in Spinal Muscular Atrophy. J. Neurosci 35, 8691–8700 (2015). [DOI] [PMC free article] [PubMed] [Google Scholar]
- 3.Lefebvre S et al. Identification and characterization of a spinal muscular atrophy-determining gene. Cell 80, 155–65 (1995). [DOI] [PubMed] [Google Scholar]
- 4.Lorson CL, Hahnen E, Androphy EJ & Wirth B A single nucleotide in the SMN gene regulates splicing and is responsible for spinal muscular atrophy. Proc. Natl. Acad. Sci. U. S. A 96, 6307–11 (1999). [DOI] [PMC free article] [PubMed] [Google Scholar]
- 5.Hua Y et al. Peripheral SMN restoration is essential for long-term rescue of a severe spinal muscular atrophy mouse model. Nature 478, 123–126 (2011). [DOI] [PMC free article] [PubMed] [Google Scholar]
- 6.Porensky PN et al. A single administration of morpholino antisense oligomer rescues spinal muscular atrophy in mouse. Hum. Mol. Genet 21, 1625–38 (2012). [DOI] [PMC free article] [PubMed] [Google Scholar]
- 7.Naryshkin NA et al. Motor neuron disease. SMN2 splicing modifiers improve motor function and longevity in mice with spinal muscular atrophy. Science 345, 688–93 (2014). [DOI] [PubMed] [Google Scholar]
- 8.Palacino J et al. SMN2 splice modulators enhance U1-pre-mRNA association and rescue SMA mice. Nat. Chem. Biol 11, 511–517 (2015). [DOI] [PubMed] [Google Scholar]
- 9.Foust KD et al. Rescue of the spinal muscular atrophy phenotype in a mouse model by early postnatal delivery of SMN. Nat. Biotechnol 28, 271–4 (2010). [DOI] [PMC free article] [PubMed] [Google Scholar] [Retracted]
- 10.Passini MA et al. CNS-targeted gene therapy improves survival and motor function in a mouse model of spinal muscular atrophy. J. Clin. Invest 120, 1253–64 (2010). [DOI] [PMC free article] [PubMed] [Google Scholar]
- 11.Dominguez E et al. Intravenous scAAV9 delivery of a codon-optimized SMN1 sequence rescues SMA mice. Hum. Mol. Genet 20, 681–93 (2011). [DOI] [PubMed] [Google Scholar]
- 12.Valori CF et al. Systemic delivery of scAAV9 expressing SMN prolongs survival in a model of spinal muscular atrophy. Sci. Transl. Med 2, 35ra42 (2010). [DOI] [PubMed] [Google Scholar]
- 13.Finkel RS et al. Nusinersen versus Sham Control in Infantile-Onset Spinal Muscular Atrophy. N. Engl. J. Med 377, 1723–1732 (2017). [DOI] [PubMed] [Google Scholar]
- 14.Finkel RS et al. Treatment of infantile-onset spinal muscular atrophy with nusinersen: a phase 2, open-label, dose-escalation study. Lancet 388, 3017–3026 (2016). [DOI] [PubMed] [Google Scholar]
- 15.Mercuri E et al. Nusinersen versus sham control in later-onset spinal muscular atrophy. N. Engl. J. Med 378, 625–635 (2018). [DOI] [PubMed] [Google Scholar]
- 16.Mendell JR et al. Single-Dose Gene-Replacement Therapy for Spinal Muscular Atrophy. N. Engl. J. Med 377, 1713–1722 (2017). [DOI] [PubMed] [Google Scholar]
- 17.Al-Zaidy S et al. Health outcomes in spinal muscular atrophy type 1 following AVXS-101 gene replacement therapy. Pediatr. Pulmonol 54, 179–185 (2019). [DOI] [PMC free article] [PubMed] [Google Scholar]
- 18.Dhillon S Risdiplam: First Approval. Drugs 80, (2020). [DOI] [PubMed] [Google Scholar]
- 19.Mercuri E, Pera MC, Scoto M, Finkel R & Muntoni F Spinal muscular atrophy — insights and challenges in the treatment era. Nature Reviews Neurology (2020). doi: 10.1038/s41582-020-00413-4 [DOI] [PubMed] [Google Scholar]
- 20.Hinderer C et al. Severe Toxicity in Nonhuman Primates and Piglets Following High-Dose Intravenous Administration of an Adeno-Associated Virus Vector Expressing Human SMN. Hum. Gene Ther 29, 285–298 (2018). [DOI] [PMC free article] [PubMed] [Google Scholar]
- 21.Study of Intrathecal Administration of Onasemnogene Abeparvovec-xioi for Spinal Muscular Atrophy (STRONG) - ClinicalTrials.gov. Available at: https://clinicaltrials.gov/ct2/show/NCT03381729.
- 22.European Medicines Agency. Zolgensma: EPAR - Public assessment report. (2020). Available at: https://www.ema.europa.eu/en/documents/assessment-report/zolgensma-epar-public-assessment-report_en.pdf.
- 23.Passini MA et al. Translational fidelity of intrathecal delivery of self-complementary AAV9-survival motor neuron 1 for spinal muscular atrophy. Hum. Gene Ther 25, 619–630 (2014). [DOI] [PubMed] [Google Scholar]
- 24.Gray SJ & Samulski R Vector design and considerations for CNS applications. in Gene Vector Design and Application to Treat Nervous System Disorders 1–9 (2011). [Google Scholar]
- 25.Taylor MD et al. Postnatal regulation of limb proprioception by muscle-derived neurotrophin-3. J. Comp. Neurol 432, 244–58 (2001). [DOI] [PubMed] [Google Scholar]
- 26.Simon CM et al. Stasimon Contributes to the Loss of Sensory Synapses and Motor Neuron Death in a Mouse Model of Spinal Muscular Atrophy. Cell Rep. 29, 3885–3901.e5 (2019). [DOI] [PMC free article] [PubMed] [Google Scholar]
- 27.Mentis GZ et al. Early Functional Impairment of Sensory-Motor Connectivity in a Mouse Model of Spinal Muscular Atrophy. Neuron 69, 453–467 (2011). [DOI] [PMC free article] [PubMed] [Google Scholar]
- 28.Fletcher EV et al. Reduced sensory synaptic excitation impairs motor neuron function via Kv2.1 in spinal muscular atrophy. Nat. Neurosci 20, 905–916 (2017). [DOI] [PMC free article] [PubMed] [Google Scholar]
- 29.Simon CM et al. Converging Mechanisms of p53 Activation Drive Motor Neuron Degeneration in Spinal Muscular Atrophy. Cell Rep. 21, 3767–3780 (2017). [DOI] [PMC free article] [PubMed] [Google Scholar]
- 30.Li DK, Tisdale S, Lotti F & Pellizzoni L SMN control of RNP assembly: from post-transcriptional gene regulation to motor neuron disease. Semin. Cell Dev. Biol 32, 22–9 (2014). [DOI] [PMC free article] [PubMed] [Google Scholar]
- 31.Ruggiu M et al. A role for SMN exon 7 splicing in the selective vulnerability of motor neurons in spinal muscular atrophy. Mol. Cell. Biol 32, 126–38 (2012). [DOI] [PMC free article] [PubMed] [Google Scholar]
- 32.Van Alstyne M et al. Dysregulation of Mdm2 and Mdm4 alternative splicing underlies motor neuron death in spinal muscular atrophy. Genes Dev 32, 1045–1059 (2018). [DOI] [PMC free article] [PubMed] [Google Scholar]
- 33.Saltzman AL, Pan Q & Blencowe BJ Regulation of alternative splicing by the core spliceosomal machinery. Genes Dev. 25, 373–384 (2011). [DOI] [PMC free article] [PubMed] [Google Scholar]
- 34.Tenner AJ, Stevens B & Woodruff TM New tricks for an ancient system: Physiological and pathological roles of complement in the CNS. Mol. Immunol 102, 3–13 (2018). [DOI] [PMC free article] [PubMed] [Google Scholar]
- 35.Vukojicic A et al. The Classical Complement Pathway Mediates Microglia-Dependent Remodeling of Spinal Motor Circuits during Development and in SMA. Cell Rep. 29, 3087–3100.e7 (2019). [DOI] [PMC free article] [PubMed] [Google Scholar]
- 36.Lucin KM & Wyss-Coray T Immune Activation in Brain Aging and Neurodegeneration: Too Much or Too Little? Neuron 64, 110–122 (2009). [DOI] [PMC free article] [PubMed] [Google Scholar]
- 37.Sleigh JN et al. Chondrolectin affects cell survival and neuronal outgrowth in in vitro and in vivo models of spinal muscular atrophy. Hum. Mol. Genet 23, 855–869 (2014). [DOI] [PubMed] [Google Scholar]
- 38.Nussbacher JK, Tabet R, Yeo GW & Lagier-Tourenne C Disruption of RNA Metabolism in Neurological Diseases and Emerging Therapeutic Interventions. Neuron 102, 294–320 (2019). [DOI] [PMC free article] [PubMed] [Google Scholar]
- 39.Monani UR The human centromeric survival motor neuron gene (SMN2) rescues embryonic lethality in Smn−/− mice and results in a mouse with spinal muscular atrophy. Hum. Mol. Genet 9, 333–339 (2000). [DOI] [PubMed] [Google Scholar]
- 40.Gavrilina TO et al. Neuronal SMN expression corrects spinal muscular atrophy in severe SMA mice while muscle-specific SMN expression has no phenotypic effect. Hum. Mol. Genet 17, 1063–75 (2008). [DOI] [PMC free article] [PubMed] [Google Scholar]
- 41.Lorson CL et al. SMN oligomerization defect correlates with spinal muscular atrophy severity. Nat. Genet 19, 63–66 (1998). [DOI] [PubMed] [Google Scholar]
- 42.Pellizzoni L, Charroux B & Dreyfuss G SMN mutants of spinal muscular atrophy patients are defective in binding to snRNP proteins. Proc. Natl. Acad. Sci. U. S. A 96, 11167–72 (1999). [DOI] [PMC free article] [PubMed] [Google Scholar]
- 43.Bühler D, Raker V, Lührmann R & Fischer U Essential role for the tudor domain of SMN in spliceosomal U snRNP assembly: Implications for spinal muscular atrophy. Hum. Mol. Genet 8, 2351–2357 (1999). [DOI] [PubMed] [Google Scholar]
- 44.AveXis. ZOLGENSMA (onasemnogene abeparvovec-xioi) [package insert]. U.S. Food and Drug Administration (2019). Available at: https://www.fda.gov/vaccines-blood-biologics/zolgensma. [Google Scholar]
- 45.Hordeaux J et al. The Neurotropic Properties of AAV-PHP.B Are Limited to C57BL/6J Mice. Molecular Therapy 26, 664–668 (2018). [DOI] [PMC free article] [PubMed] [Google Scholar]
- 46.Schuster DJ et al. Biodistribution of adeno-associated virus serotype 9 (AAV9) vector after intrathecal and intravenous delivery in mouse. Front. Neuroanat 8, 42 (2014). [DOI] [PMC free article] [PubMed] [Google Scholar]
- 47.DiDonato CJ et al. Cloning, characterization, and copy number of the murine survival motor neuron gene homolog of the spinal muscular atrophy-determining gene. Genome Res. 7, 339–352 (1997). [DOI] [PubMed] [Google Scholar]
- 48.Lorson MA, Spate LD, Prather RS & Lorson CL Identification and characterization of the porcine (Sus scrofa) survival motor neuron (SMN1) gene: An animal model for therapeutic studies. Dev. Dyn 237, 2268–2278 (2008). [DOI] [PMC free article] [PubMed] [Google Scholar]
- 49.Wu J, Anczuków O, Krainer AR, Zhang MQ & Zhang C OLego: fast and sensitive mapping of spliced mRNA-Seq reads using small seeds. Nucleic Acids Res. 41, 5149–63 (2013). [DOI] [PMC free article] [PubMed] [Google Scholar]
- 50.Yan Q et al. Systematic discovery of regulated and conserved alternative exons in the mammalian brain reveals NMD modulating chromatin regulators. Proc. Natl. Acad. Sci. U. S. A 112, 3445–3450 (2015). [DOI] [PMC free article] [PubMed] [Google Scholar]
- 51.Benjamini Yoav; Hochberg Y Controlling the False Discovery Rate - a Practical and Powerful Approach to Multiple Testing. Journal of the Royal Statistical Society Series B-Methodological 1995.pdf. J. R. Stat. Soc. Ser. B 57, 289–300 (1995). [Google Scholar]
- 52.Robinson MD, Mccarthy DJ & Smyth GK edgeR: a Bioconductor package for differential expression analysis of digital gene expression data. Bioinforma. Appl. NOTE 26, 139–140 (2010). [DOI] [PMC free article] [PubMed] [Google Scholar]
- 53.Huang DW, Sherman BT & Lempicki RA Systematic and integrative analysis of large gene lists using DAVID bioinformatics resources. Nat. Protoc 4, 44–57 (2009). [DOI] [PubMed] [Google Scholar]
Associated Data
This section collects any data citations, data availability statements, or supplementary materials included in this article.
Supplementary Materials
Data Availability Statement
The data supporting the findings of this study are available in this paper or the Supplementary Information. Sequencing data have been deposited in the GEO database under accession number GSE149391. Full uncropped blots are available as Source data. Any other raw data that support the findings of this study are available from the corresponding author upon reasonable request.