

SUMMARY
Stromal desmoplastic reaction in pancreatic ductal adenocarcinoma (PDAC) involves significant accumulation of type I collagen (Col1). However, the precise molecular and mechanistic contribution of Col1 in PDAC progression remains unknown. Activated pancreatic stellate cells (PSCs)/αSMA+ myofibroblasts are major contributors of Col1 in the PDAC stroma. We employ a dual-recombinase genetic mouse model of spontaneous PDAC to delete Col1 specifically in myofibroblasts. This results in significant reduction of total stromal Col1 content and accelerates the emergence of PanINs and PDAC, decreasing overall survival. Mechanistic studies suggest that Col1 deletion leads to Cxcl5 upregulation in cancer cells via SOX9. Increase in Cxcl5 is associated with recruitment of myeloid-derived suppressor cells (MDSCs), and suppression of CD8+ T cells, which can be attenuated by combined suppression of CXCR2 and CCR2 with restrained PDAC progression. Taken together, our results unravel the fundamental role of myofibroblast-derived Col1 in regulating tumor immunity and restraining PDAC progression.
Graphical Abstract

eTOC blurb
Chen et al. identify that the deletion of type I collagen (Col1) in αSMA+ myofibroblasts using dual-recombinase mouse models decreases stromal Col1 content and accelerates progression of pancreatic cancer. Col1 deletion promotes the recruitment of CD206+F4/80+ARG1+ myeloid-derived suppressor cells, which can be attenuated by combined inhibition of CXCR2 and CCR2.
INTRODUCTION
Type I collagen (Col1), a fibrillar collagen, is the most abundant protein in the human body and most abundantly present in bones, tendons and skin. The basic functional unit of Col1 is a heterotrimer consisting of two α1 chains and one α2 chain that come together to form a triple helical structure. Each α-chain polypeptide is synthesized in the cytosol and combines with two other α-chains to generate a triple-helical type I procollagen with N-terminal and C-terminal propeptides. Subsequently, the procollagen molecule is secreted into the extracellular space where the N-terminal and C-terminal propeptides are cleaved by propeptidases, generating the basic functional unit of Col1. The Col1 triple helical rod-like molecules interact with each other to form fibrils and undergo further crosslinking to form large bundles of fibers.
During embryogenesis, many organs express Col1 to likely facilitate cellular migration, differentiation and structural compartmentalization (Hay, 1981). Systemic deletion of Col1a1 gene (resulting in complete absence of type I collagen) leads to embryonic lethality (Lohler et al., 1984). In pathogenic conditions, such as organ fibrosis and cancer, Col1 accumulates robustly in the affected tissue. Col1 associated with tumor tissue is known to generate a biophysically ‘stiff’ microenvironment around the cancer cells facilitating cellular migration via conducive Col1 fiber ‘tracks’, and facilitate abnormal cellular interactions to induce proliferation and survival of cancer cells (Armstrong et al., 2004; Bachem et al., 2005; DuFort et al., 2016; Egeblad et al., 2010; Fujita et al., 2009; Haber et al., 1999; Hanahan and Weinberg, 2011; Levental et al., 2009).
In this regard, Col1 is a major component of the tumor stroma/microenvironment associated with pancreatic ductal adenocarcinoma (PDAC) (Mollenhauer et al., 1987; Tian et al., 2019). Alpha-smooth muscle actin (αSMA)+ myofibroblasts associated with PDAC are speculated to significantly contribute to the production of Col1 and proposed to impede drug delivery to cancer cells, and restrict T cell infiltration (Apte et al., 2012; Beatty et al., 2011; Ene-Obong et al., 2013; Provenzano et al., 2012; Whittle and Hingorani, 2019). Recent studies suggest that stromal fibroblasts in PDAC might exhibit context dependent functions, imparting tumor promoting and restraining influences (Biffi et al., 2019; Kalluri, 2016; Laklai et al., 2016; Lee et al., 2014; Mueller and Fusenig, 2004; Neesse et al., 2015; Ohlund et al., 2014; Ohlund et al., 2017; Olive et al., 2009; Ozdemir et al., 2014; Provenzano et al., 2012; Rhim et al., 2014; Sugimoto et al., 2006). Nevertheless, the precise function of type I collagen in the initiation and progression of PDAC remains unknown.
Current genetically engineered mouse models (GEMMs) of PDAC, such as the KPC mice (LSL-KrasG12D/+;Trp53R172H/+ or Trp53loxP/loxP;Pdx1-Cre) and the PKT mice (LSL-KrasG12D/+;Tgfbr2loxP/loxP;P48-Cre) have been valuable in elucidating the molecular and pathological mechanisms (Chytil et al., 2002; Hingorani et al., 2005). Nevertheless, an inability to genetically manipulate genes in stromal compartments remains a limitation of these genetic models. To overcome this issue, we employed mice with dual-recombinase system (DRS), integrating the capacity to manipulate genes using both the Cre-loxP and Flp-FRT (Schonhuber et al., 2014). The dual-recombinase system allows for functional deletion of genes of interest specifically in the stromal compartment. Here, we deleted Col1 produced by specific cell types in the background of oncogenic Kras-induced spontaneous PDAC to specifically address the function of type I collagen in disease initiation and progression.
RESULTS
Dual-recombinase system mouse models develop spontaneous pancreatic cancer with opportunity for stromal cell specific gene manipulations
A dual-recombinase system mouse model for pancreatic cancer utilizes the Flippase-FRT (Flp-FRT) system to induce oncogenic Kras expression and p53 loss in cells with Pdx1-lineage (FSF-KrasG12D/+;Trp53frt/frt;Pdx1-Flp) (Schonhuber et al., 2014). This Flp-FRT-based model (KPPF mice) develops pancreatic intraepithelial neoplasias (PanINs) and pancreatic ductal adenocarcinoma (PDAC) in an almost identical manner to the Cre-loxP-based LSL-KrasG12D/+;Trp53loxP/loxP;Pdx1-Cre model (KPPC) mice (Figures S1A and S1B) (Schonhuber et al., 2014).
The KPPF and KPPC mice similarly exhibit prominent deposition of type I collagen (Col1) associated with PanINs and PDAC (Figures S1A and S1B). Employing this mouse model harboring both Cre-loxP and Flp-FRT systems and a lineage-tracing Dual-reporter, Rosa26-CAG-loxP-frt-Stop-frt-FireflyLuc-EGFP-loxP-RenillaLuc-tdTomato (Chen et al., 2018) (hereafter referred to as R26Dual), we generated the KPPF;αSMA-Cre;R26Dual mice (Figure 1A). In the PDAC tissues of these mice, cancer cells with Pdx1-lineage are associated with EGFP expression, while αSMA+ myofibroblasts exhibit tdTomato expression (Figure 1A). This dual-recombinase lineage-tracing strategy confirms the genetic recombination events mediated by Pdx1-Flp and αSMA-Cre, respectively.
Figure 1. Single-cell RNA-sequencing (sc-RNA-seq) identifies fibroblasts as the predominant producers of type I collagen in KPPF mice with PDAC.
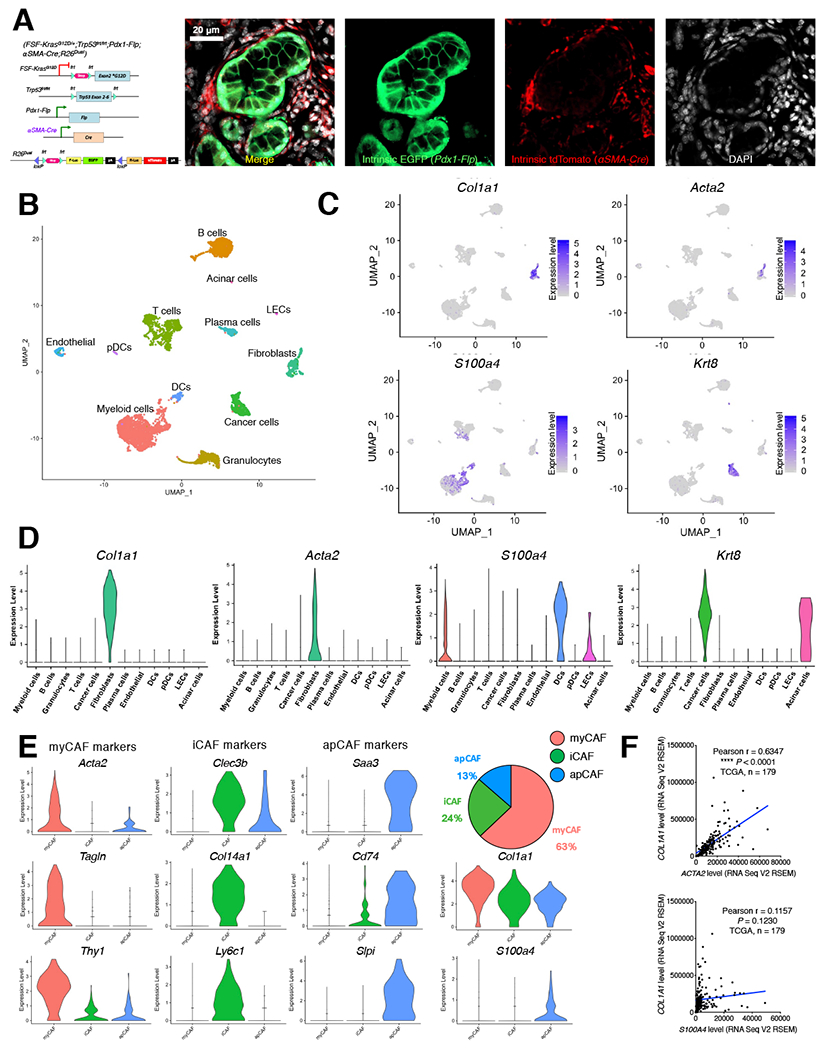
(A) Genetic strategy for KPPF;αSMA-Cre;R26Dual mice, with representative images of primary tumor cryosections shown for intrinsic EGFP (in cancer cells) and tdTomato (in αSMA-lineage myofibroblasts) signals due to R26Dual tracer. Scale bar: 20 αm.
(B-D) sc-RNA-seq analysis of unfractionated live cell mixture from pancreatic tumors of KPPF mice (B). Expression profile of Col1a1, Acta2, S100a4, and Krt8 was shown in UMAP plot (C) and violin plot (D) with normalized expression levels of indicated genes. DCs, dendritic cells; pDCs, plasmacytoid dendritic cells; LECs, lymphatic endothelial cells.
(E) The cancer-associated fibroblast (CAF) cluster was classified into indicated subpopulations: myofibroblast (myCAF), inflammatory fibroblast (iCAF), and antigen-presenting fibroblast (apCAF). Violin plots are shown with normalized expression levels of indicated genes.
(F) The correlation between the gene expression levels of COL1A1 and ACTA2 (or S100A4) in TCGA PDAC patients (n = 179). Pearson’s correlation test was used.
We examined the expression of Col1, cytokeratin (CK)-19, and αSMA during PanIN and PDAC stages (Figures S1C and S1D). Normal pancreatic tissue revealed minimal/negligible presence of CK19, αSMA, or Col1. Upon the emergence of acinar-to-ductal metaplasia (ADM) or early PanIN lesions, αSMA level significantly elevated associated with emergence of myofibroblasts and pancreatic epithelial abnormalities (Figure S1C). The myofibroblast accumulation was followed by a peak level of Col1 deposition at subsequent PanIN stages (Figure S1C). As disease progressed to PDAC in these mice, the total amount of Col1 deposition further increased (Figure S1D).
Single-cell RNA-sequencing identifies fibroblasts as the predominant producers of type I collagen in KPPF mice with PDAC
Recent studies used single-cell RNA-sequencing analysis (sc-RNA-seq) on mouse KPC tumors and human PDAC tumors to identify two major populations of cancer-associated fibroblasts (CAFs) (Biffi et al., 2019; Elyada et al., 2019). The ECM-producing CAFs were termed as myofibroblasts (myCAFs) and inflammatory associated CAFs as the iCAFs (along with a smaller subset of antigen-presenting CAFs as the apCAFs). Col1 production by activated PSCs/myofibroblasts was observed in both mouse and human tumors (Bernard et al., 2019; Biffi et al., 2019; Elyada et al., 2019; Hosein et al., 2019; Peng et al., 2019). Therefore, overwhelming evidence collected by many research groups shows that activated PSCs express αSMA and produce Col1 associated with PDAC (Biffi et al., 2019; Elyada et al., 2019; Feig et al., 2012; Korc, 2007; Mahadevan and Von Hoff, 2007; Ohlund et al., 2017; Whittle and Hingorani, 2019).
To further confirm fibroblasts as the major contributors of type I collagen in the KPPF (FSF-KrasG12D/+;Trp53frt/frt;Pdx1-Flp) mice, we performed similar sc-RNA-seq analysis of unfractionated live cell mixture from the pancreatic tumors of KPPF mice (Figures 1B–1D, S1E, and S1F). Representation of specific gene expression profiles in UMAP plots revealed that single cell isolation predominantly yielded immune cells (myeloid and lymphoid lineages), with smaller clusters (representations) of cancer cells, endothelial cells, and fibroblasts (Figures 1B and S1E; Table S1). The αSMA+ myofibroblasts were confirmed as dominant ECM-producing cells (Figures 1C, 1D, and S1F), as reported by several groups earlier (Apte et al., 1998; Apte et al., 1999; Elyada et al., 2019; Haber et al., 1999; Hosein et al., 2019; Mews et al., 2002). Another widely used marker for cancer-associated fibroblasts and other stromal cells, fibroblast specific protein 1 (S100a4, Fsp1), was expressed by only a subset of ECM-producing fibroblasts (Figure 1C) but also by many immune cell clusters. High transcriptional level of Col1a1 (as well as many other ECM genes) was observed in αSMA+ (‘myCAF’ cluster) myofibroblasts, and to a lesser extent in the cytokeratin-expressing cancer cells or Fsp1-expressing cells (Figures 1C–1E; Table S2). Consistent with recent studies, we can also sub-cluster CAFs into myofibroblasts (myCAFs), iCAFs, and apCAFs (Figure 1E; Table S3). We observed S100a4 (Fsp1) expression in apCAFs, in contrast to the Acta2 (αSMA), which was predominantly present in myCAFs (Figure 1E).
We further confirm that gene expression level of COL1A1 in TCGA human PDAC samples significantly correlates with ACTA2 (αSMA), but not S100A4 (Fsp1) (Figure 1F). These observations, along with published reports, suggest that myofibroblasts are major producers of Col1 in PDAC.
Specific deletion of Col1 in αSMA+ myofibroblasts accelerates PDAC with diminished overall survival
Guided by the sc-RNA-seq data and to test the function of myofibroblast-produced Col1 in pancreatic cancer, we next deleted Col1 in myofibroblasts employing the dual-recombinase FSF-KrasG12D/+;Trp53frt/frt;Pdx1-Flp;αSMA-Cre;Col1a1loxP/loxP (KPPF;Col1smaKO) mice (Figure 2A). Col1 deficiency was achieved by Col1a1 conditional deletion because Col1α1 is essential for Col1 triple helical trimer formation while Col1α2 alone cannot form Col1 trimers (Lees et al., 1997; Sharma et al., 20l7). Mice with Col1 deletion in αSMA+ myofibroblasts (αSMA-Cre;Col1a1loxP/loxP) exhibit normal tissue throughout the body and normal size litters and life span, without any overt phenotype. In the context of PDAC, Col1 deletion in αSMA+ myofibroblasts led to decreased overall levels of fibrillar Col1, desmoplasia associated markers, and biophysical stiffness of PDAC tissue, as examined using staining on serial tissue sections (Figure 2B), circularly polarized light microscopy (Figure 2C), and atomic force microscopy (Figure 2D). Specific Col1 deletion was confirmed in myofibroblasts sorted from tumors of KPPF;Col1smaKO mice (Figure 2E).
Figure 2. Specific deletion of Col1 in αSMA+ myofibroblasts decreases Col1 protein in autochthonous model of PDAC.
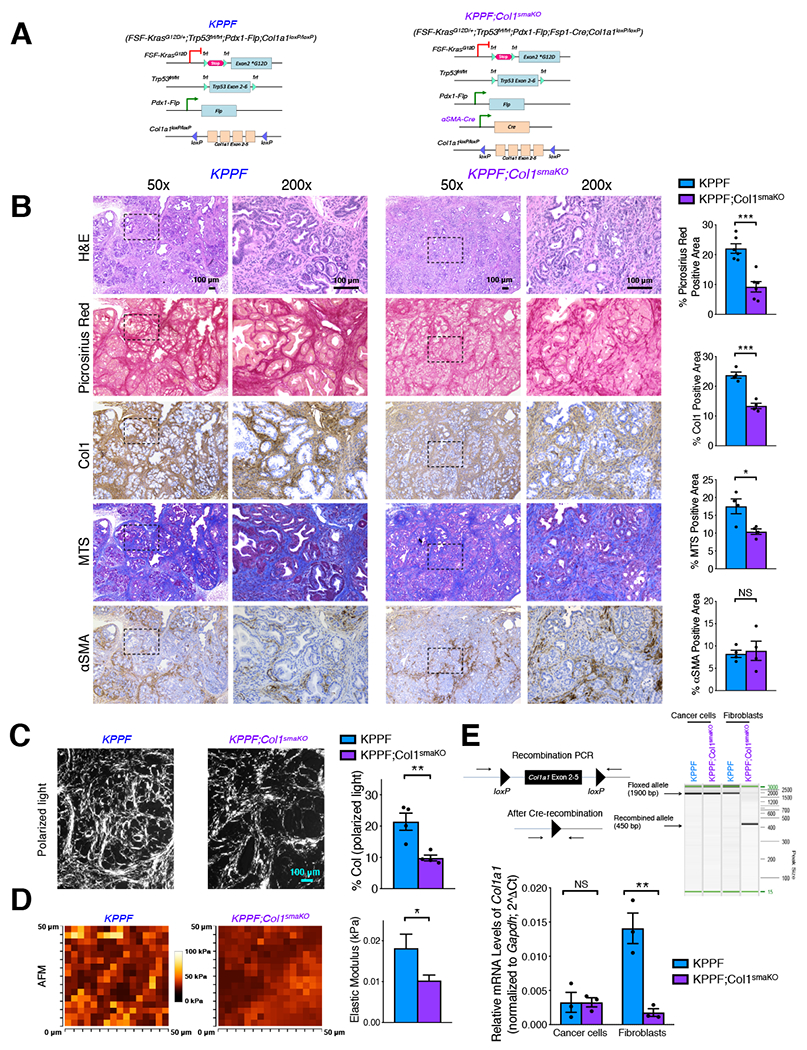
(A) Genetic strategy to delete type I collagen α1 chain (Col1a1) specifically in αSMA+ cell population in the context of pancreatic cancer using the KPPF;Col1smaKO mice. KPPF littermates served as control mice.
(B) Serial sections of pancreatic tumors from age-matching KPPF and KPPF;Col1smaKO mice, stained with H&E, Picrosirius Red, Col1, Masson’s trichrome stain (MTS), and αSMA. Quantification of % positive area was based on at least 4 mice/group. Scale bar: 100 μm.
(C) Representative circularly polarized light microscopy images of KPPF and KPPF;Col1smaKO tumor sections stained with Pircrosirius Red (n = 4/group). Scale bar: 100 μm.
(D) Representative atomic force microscopic (AFM) images of cryosections of KPPF and KPPF;Col1smaKO tumors (n = 3/group).
(E) Primary cancer cells and fibroblasts were sorted from KPPF or KPPF;Col1smaKO tumors. PCR product detection confirmed the specific deletion of Col1a1 in fibroblasts sorted from KPPF;Col1smaKO mice. The expression level of Col1a1 was examined by qRT-PCR.
Data are represented as mean ± SEM. * P < 0.05, *** P < 0.001, **** P < 0.0001, NS: not significant, Student’s t test was used. See also Figure S2.
Col1 deletion in αSMA+ myofibroblasts significantly decreased the overall survival of mice (Figure 3A) and accelerated PDAC progression (Figure 3B). At the endpoint, KPPF;Col1smaKO mice exhibited higher tumor weight but comparable body weight when compared to control KPPF mice (Figure 3C). Decreased Col1 level was also observed at the endpoint PDAC in the KPPF;Col1smaKO tumors compared to KPPF tumors, associated with more undifferentiated and invasive PDAC tissue phenotype (Figure S2A). These results are consistent with previous studies showing that lower stroma content (such as αSMA or collagen) may implicate a worse prognosis of human PDAC (Bever et al., 2015; Erkan et al., 2008; Moffitt et al., 2015; Ozdemir et al., 2014; Wang et al., 2013). Col1 deletion in myofibroblasts did not impact the blood vessel density, pericyte coverage, or vascular integrity (as determined by interstitial albumin accumulation) in the tumors of KPPF;Col1smaKO mice (Figures S2B and S2C). This seems reasonable as the vascular basement membranes associated with capillaries and blood vessels are predominantly composed of type IV collagen (Col4) but not Col1 (Figure S2D).
Figure 3. Genetic deletion of Col1 in αSMA+ myofibroblasts accelerates PDAC progression with decreased survival.
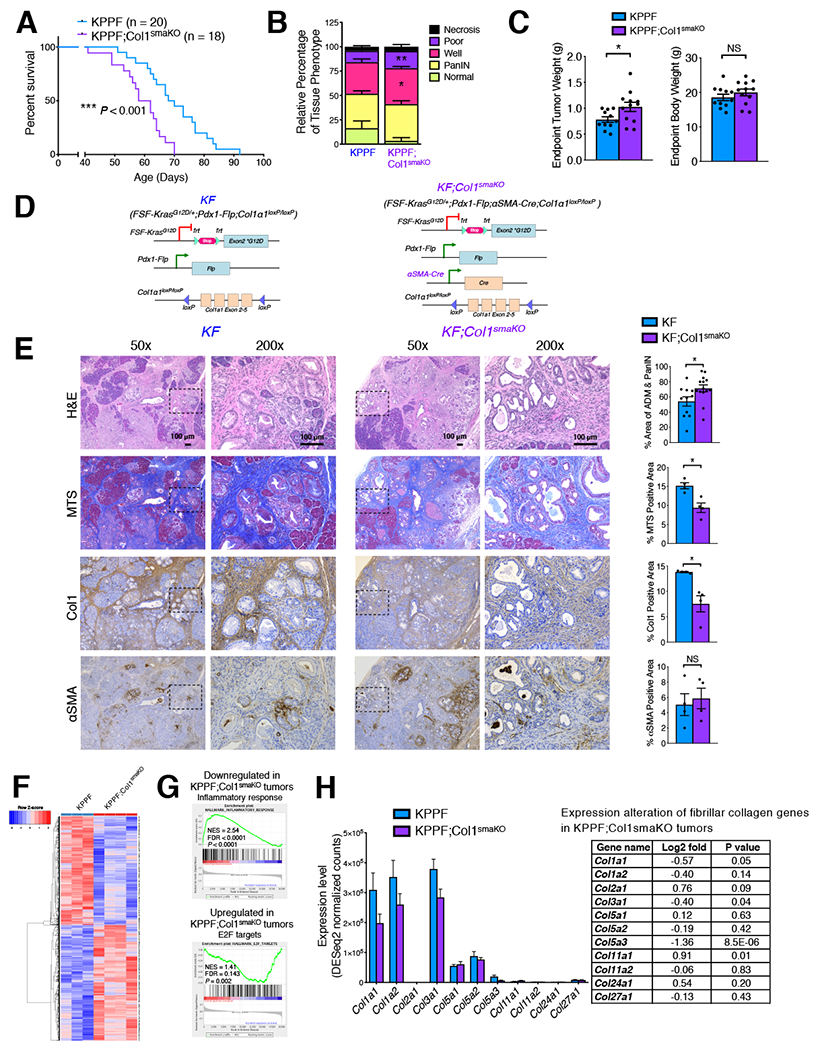
(A) Survival of KPPF (n = 20) and KPPF;Col1smaKO (n = 18) mice. Log-rank (Mantel-Cox) test was used.
(B) Histology evaluation of tumors from age-matching KPPF and KPPF;Col1smaKO mice (n = 5/group) by scoring H&E-stained tumors: normal (non-neoplastic), PanIN, well-differentiated PDAC (Well), poorly-differentiated PDAC (Poor), or necrosis.
(C) Endpoint tumor weight and body weight of KPPF mice and KPPF;Col1smaKO mice.
(D) Genetic strategy to delete Col1a1 specifically in αSMA-expressing cell population in the KF;Col1smaKO mice. KF littermates served as control mice.
(E) Serial sections of pancreas of KF or KF;Col1smaKO (age-matched 6-month-old) mice were stained. Percentage of ADM/PanIN lesion areas was based on H&E sections from 11 KF mice and 14 KF;Col1smaKO mice. Quantification of other staining was based on n = 4/group. Scale bar: 100 μm.
(F-H) Bulk RNA-seq analysis on KPPF tumors (n = 3) and KPPF;Col1smaKO tumors (n = 4). Heat map of differentially expressed genes between KPPF and KPPF;Col1smaKO tumors was shown in (F). Gene set enrichment analysis (GSEA) revealed significantly downregulated and upregulated pathways in KPPF;Col1smaKO tumors, as compared to KPPF tumors (G). NES, normalized enrichment score. FDR, false discovery rate (q value). Expression levels of genes encoding fibrillar collagens were shown in (H), with Log2-fold change and P values (Wald Test) listed.
Data are represented as mean ± SEM. * P < 0.05, ** P < 0.01, *** P < 0.001, NS: not significant. Student’s t test was used unless otherwise indicated. See also Figures S2 and S3; Table S4.
Next, we generated FSF-KrasG12D/+;Pdx1-Flp;αSMA-Cre;Col1a1loxP/loxP (KF;Col1smaKO) mice harboring only the oncogenic Kras mutation that progress to PDAC at a much slower rate to carefully evaluate the impact of the loss of myofibroblast-derived Col1 on the emergence of early stage ADM and PanINs (Figure 3D). Age matched (6-month-old) KF;Col1smaKO mice exhibited significantly more ADM and PanIN lesions when compared to FSF-KrasG12D/+;Pdx1-Flp (KF) littermate control (αSMA-Cre-negative) mice (Figure 3E). Taken together, these results further suggest a tumor-restraining function of myofibroblast-derived Col1 in PDAC microenvironment.
Bulk RNA sequencing (RNA-seq) analysis of KPPF;Col1smaKO tumors and KPPF tumors was examined by gene set enrichment analysis (GSEA), revealing upregulated proliferation-related E2F-target pathway and downregulated inflammation response pathway in KPPF;Col1smaKO tumors (Figures 3F, 3G, and S2E; Table S4). KPPF;Col1smaKO tumors revealed elevated cell proliferation when compared with KPPF tumors, as examined by Ki67 staining of cancer cells (Figure S2F). These results were consistent with the more advanced disease phenotype after Col1 deletion in myofibroblasts in these tumors. In addition, we also validated the decreased Col1a1 level by bulk RNA-seq from KPPF;Col1smaKO tumors, and Col1 deletion in myofibroblasts did not lead to compensatory upregulation of other fibrillar collagen genes (Figures 3H and S2G).
Specific deletion of Col1 in Fsp1+ stromal cells does not impact PDAC progression
Many studies have suggested that Fsp1+ cells in the stroma also represent cancer-associated fibroblasts and likely other stromal/immune cells (Strutz et al., 1995; von Ahrens et al., 2017). Our sc-RNA-seq analysis demonstrates that Fsp1+ subpopulation of fibroblasts (particularly apCAFs) is partially associated with production of Col1 transcript (Figure 1E), albeit many Fsp1+ cells are also part of immune cell clusters with minimal Col1 transcript. Nevertheless, we first generated KPPF;Fsp1-Cre;R26Dual mice harboring the Fsp1-Cre transgene, in which cancer cells with Pdx1-lineage express EGFP and cells with Fsp1-lineage express tdTomato (Figure S3A). Fsp1+ cells were present throughout the interstitium of PDAC stroma, in contrast to the localization of αSMA+ myofibroblasts (Figure S3B). The minimal co-localization between Fsp1+ cells and myofibroblasts was further confirmed by immunofluorescence staining using anti-αSMA antibody and anti-Fsp1 antibody (Figure S3C).
Next, we generated the FSF-KrasG12D/+;Trp53frt/frt;Pdx1-Flp;Fsp1-Cre;Col1a1loxP/loxP (KPPF;Col1fspKO) mice (Figure S3D). KPPF;Col1fspKO mice exhibited similar disease progression, Col1 deposition, and overall survival as compared with KPPF mice (Figures S3E and S3F). We also isolated primary Fsp1+ fibroblasts from KPPF;Col1fspKO mice and confirmed the loss of Col1a1 transcript (Figure S3G). These results suggest that while some Fsp1+ fibroblasts may produce Col1, their contribution to overall Col1 content in PDAC stroma is not rate limiting for PDAC progression and/or potentially compensated by other cells.
Col1 deletion in αSMA+ myofibroblasts impacts immune response
To examine whether Col1 deletion in myofibroblasts impacts composition of other tumor stromal cells, we further evaluated the sc-RNA-seq analysis of unfractionated live cell mixture from KPPF;Col1smaKO tumors in comparison with KPPF tumors (Figures 4A and 4B). When compared with KPPF tumors, KPPF;Col1smaKO tumors revealed largely unaltered cell number and cluster distribution of several cell populations, such as fibroblasts, endothelial cells, granulocytes, and cancer cells (Figures 4C, S4, and S5A). Col1 deletion in myofibroblasts did not significantly alter the composition or the gene expression profile of recently identified CAF subpopulations including myCAFs, iCAFs, and apCAFs (Figures S5B and S5C). Consistent results were also observed by 3D distribution plot of fibroblast clusters employing fibroblast marker gene sets (Figure S5D).
Figure 4. Col1 deletion in αSMA+ myofibroblasts impacts immune response in PDAC.
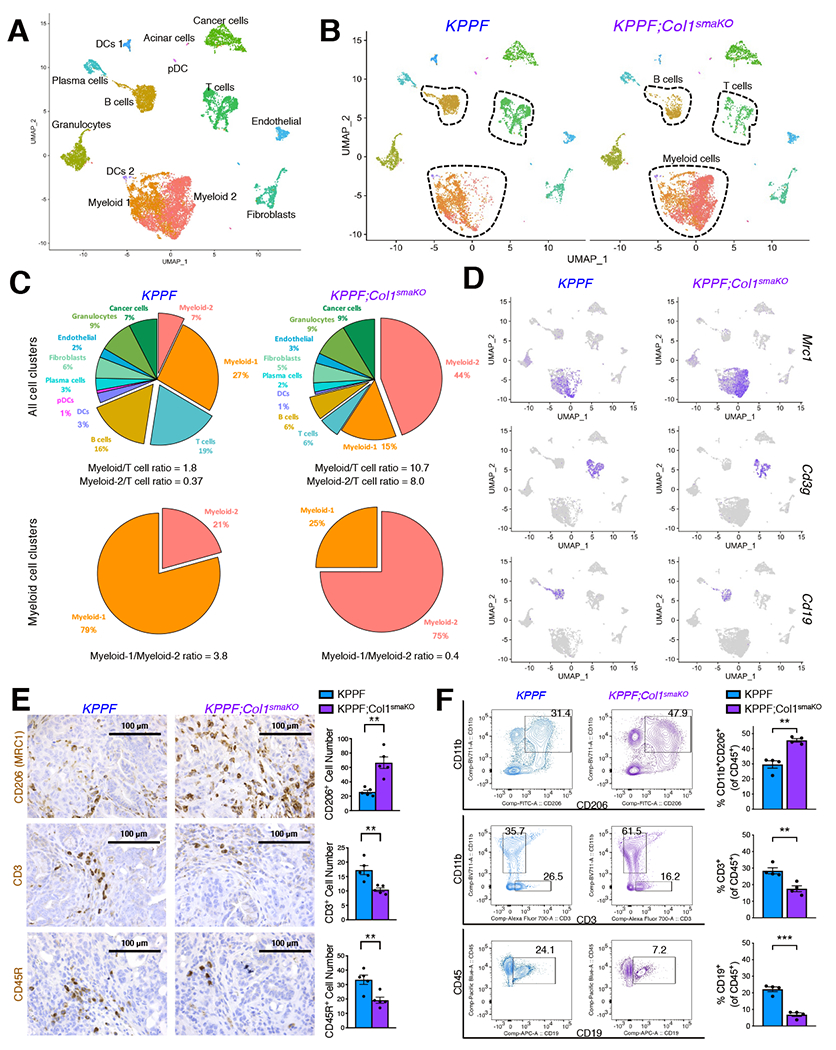
(A-D) sc-RNA-seq analysis of unfractionated live cell mixture from pancreatic tumors of KPPF and KPPF;Col1smaKO mice. Functional clusters of cells were shown in (A). The distribution of defined cell clusters comparing KPPF tumors and KPPF;Col1smaKO tumors was shown in UMAP plots (B) and pie chart plots (C). (D) Normalized expression levels of marker genes of Myeloid-2/MDSCs, T cells, and B cells within KPPF and KPPF;Col1smaKO tumors shown in UMAP plot.
(E) Representative immunohistochemistry staining images and quantification of CD206 (MRC1) for MDSCs, CD3 for T cells, and CD45R for B cells on KPPF and KPPF;Col1smaKO tumors (n = 5/group). Scale bar: 100 μm.
(F) The percentages of CD11b+CD206+ myeloid cells, CD3+ T cells, and CD19+ B cells among CD45+ immune cells in KPPF and KPPF;Col1smaKO tumors (n = 4/group), as examined by flow cytometry.
Data are represented as mean ± SEM. * P < 0.05, ** P < 0.01, *** P < 0.001, Student’s t test was used. See also Figures S4–S7; Tables S5 and S6.
We next examined whether Col1 deletion in myofibroblasts could alter the phenotype of cancer cells. Cancer cells were classified based on the genes related to the classical and basal-like subtypes (Hayashi et al., 2020; Moffitt et al., 2015) of PDAC (Figure S6A; Table S5). KPPF tumors and KPPF;Col1smaKO tumors revealed similar cancer cell clustering and gene expression profiles of classical and basal-like subtypes (Figures S6B and S6C). The bulk RNA-seq data of KPPF and KPPF;Col1smaKO tumors also did not reveal any obvious alteration of gene expression profiles related to the classical and basal-like subtypes (Figure S6D).
In addition, the TCGA PDAC cases were ranked according to high-to-low COL1A1 expression levels, and then plotted for the expression levels of signature genes related to basal-like or classical subtype (Figure S6E). No trend for cancer subtype alteration was observed between Col1-high and Col1-low patient groups. Taken together, we did not observe cancer subtype (classical and basal-like) alteration directly correlated with Col1 levels in mouse and human PDAC.
In contrast, KPPF;Col1smaKO tumors revealed significantly altered profile of myeloid cells, T cells, and B cells (Figures 4B, 4C, and S7A). Myeloid cells separated into two different clusters based on gene expression profiles, namely Myeloid-1 and Myeloid-2 (Figures 4B–D and S7B; Table S6). The Myeloid-2 cluster shares molecular features with tumor-associated macrophages and related myeloid-derived suppressor cells (MDSCs) (Biswas and Mantovani, 2010). KPPF;Col1smaKO tumors exhibited increased number of Myeloid-2 cells and decreased T/B lymphocytes (Figures 4B–4D), which correlated with the accelerated progression of KPPF;Col1smaKO tumors. Such alterations in myeloid cell and T/B cell content increased the myeloid/T cell ratio (especially the Myeloid-2/T cell ratio) in KPPF;Col1smaKO tumors (Figure 4C). Specifically, the increased Myeloid-2 cells in KPPF;Col1smaKO tumors were CD206(Mrc1)+ F4/80(Adgre1)+ Arginase-1(Arg1)+ MDSCs (Figures 4D, S7A, and S7B) (Cheng et al., 2020; Ma et al., 2011).
The increased MDSCs and decreased T/B lymphocytes by Col1 deletion were further confirmed by immunohistochemistry staining of CD206, CD3, and CD45R respectively, on both late-stage PDAC sections from KPPF;Col1smaKO mice (Figure 4E), and early-stage PanIN/PDAC sections from KF;Col1smaKO mice (Figure S7C). Consistent results were also observed in the flow cytometry analysis of immune cell composition (increased CD206+ myeloid cells and decreased T/B cells) in KPPF;Col1smaKO tumors when compared to KPPF tumors (Figure 4F).
Col1 deletion in αSMA+ myofibroblasts is associated with recruitment and polarization of CD206+F4/80+Arg1+ MDSCs
Our previous results demonstrated an increased number of CD206(Mrc1)+ F4/80(Adgre1)+ Arginase-1(Arg1)+ MDSCs (Myeloid-2 cluster) in KPPF;Col1smaKO tumors (Figures 4B–4F). The sc-RNA-seq data also revealed an enrichment of MDSCs in KPPF;Col1smaKO tumors associated with increased expression of Mrc1 (CD206/MRC1), Arg1 (argninase-1), Adgre1 (F4/80), Ms4a8a, and Chil3 (Figures 5A–5C and S7D). These MDSCs have been shown to suppress T and B lymphocyte function via arginase-1 (Biswas and Mantovani, 2010; Bronte et al., 2003; Bronte and Zanovello, 2005; Liu et al., 2003). Trem2, recently shown to be expressed in immunosuppressive myeloid cells (Katzenelenbogen et al., 2020; Molgora et al., 2020), was also enriched in Myeloid-2 cluster (Figures 5B, 5C, and S7B). CD206+F4/80+Arg1+ MDSCs specifically expressed high level of interleukin-18/IL-18 (encoded by Il18, Figures 5A–5C and S7B), a potent cytokine that contributes to an immunosuppressive tumor microenvironment by augmenting MDSC activity (Lim et al., 2014; Nakamura et al., 2018). Higher IL18 expression level also correlates with significantly poor overall survival of PDAC patients (Figure 5D). In addition, CD206+F4/80+Arg1+ MDSCs robustly express CCL2 (monocyte chemoattractant protein-1/MCP-1, encoded by Ccl2), a critical chemoattractant of MDSCs (Figures 5B and 5E). CCL2 released by Myeloid-2 (CD206+F4/80+Arg1+ MDSC) subpopulation could then act on the CCR2-expressing Myeloid-1 subpopulation (Figures 5B and 5E), potentially resulting in enhanced recruitment and polarization of Myeloid-2-MDSCs from Myeloid-1-MDSCs via a mechanism of positive feedback loop (Biswas and Mantovani, 2010; Roca et al., 2009).
Figure 5. Col1 deletion increases CD206+F4/80+Arg1+ MDSCs (Myeloid-2 cluster).
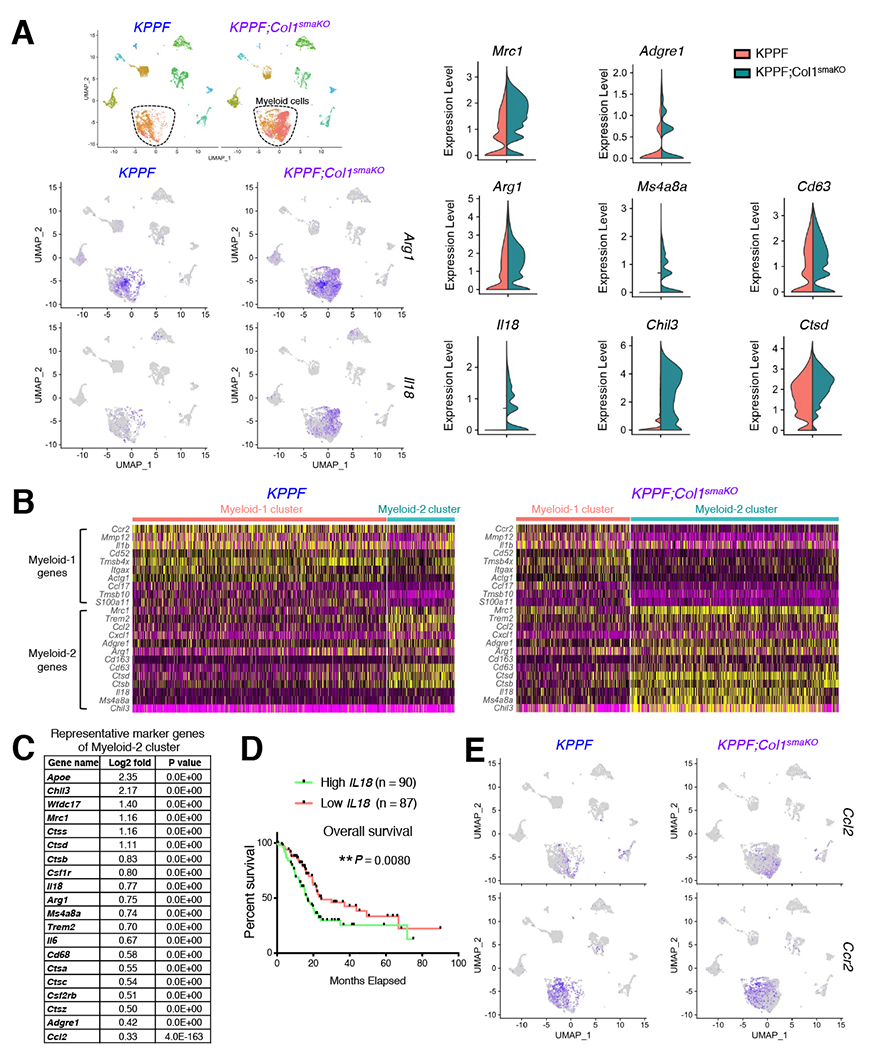
(A-C) Differentially expressed genes related to Myeloid-2/MDSC function between KPPF and KPPF;Col1smaKO tumors shown in UMAP plot and violin plot showing the normalized expression levels of indicated genes (A). Heat maps of signature genes of Myeloid-1 and Myeloid-2 clusters, comparing KPPF and KPPF;Col1smaKO tumors, were shown in (B). Representative upregulated genes in Myeloid-2 cluster were listed in (C).
(D) Overall survival of TCGA PDAC patients correlated with IL18 expression level. Log-rank (Mantel-Cox) test was used.
(E) Normalized expression levels of Ccl2 and Ccr2 genes in KPPF and KPPF;Col1smaKO tumors shown in UMAP plot.
Col1 deletion in αSMA+ myofibroblasts alters chemokine release by cancer cells and contributes to MDSC recruitment
Next, we examined myeloid cell recruiting cytokines/chemokines that might be responsible for the increased CD206+F4/80+Arg1+ MDSCs in KPPF;Col1smaKO tumors. RNA-seq data revealed significantly increased expression of Cxcl5 (encoding CXCL5) in KPPF;Col1smaKO tumors (Figure 6A). CXCL5 has been extensively studied as a potent MDSC chemoattractant (Cheng et al., 2020; Steele et al., 2016; Wang et al., 2016), and shown as transcriptionally regulated by SOX9 (Bezzi et al., 2018). sc-RNA-seq data revealed that cancer cells are the prevalent producers of CXCL5 in PDAC (Figure S7E). Higher expression level of human CXCL6 (the human homolog of mouse Cxcl5) correlates with poor overall survival of pancreatic adenocarcinoma patients (Figure 6B). RNA-seq data revealed an upregulation of Cxcl5 along with a number of other SOX9-targeted genes in KPPF;Col1smaKO tumors (Figure 6C). Increased percentage of SOX9+ cancer cells was confirmed by immunohistochemistry in both late-stage PDAC in KPPF;Col1smaKO mice and early-stage PanIN/PDAC in KF;Col1smaKO mice (Figure 6D). SOX9 expression reveals reverse correlation with COL1A1, based on the RNA-seq data from TCGA PDAC cohort (Figure 6E).
Figure 6. Col1 deletion alters chemokine release by cancer cells and promotes MDSC recruitment.
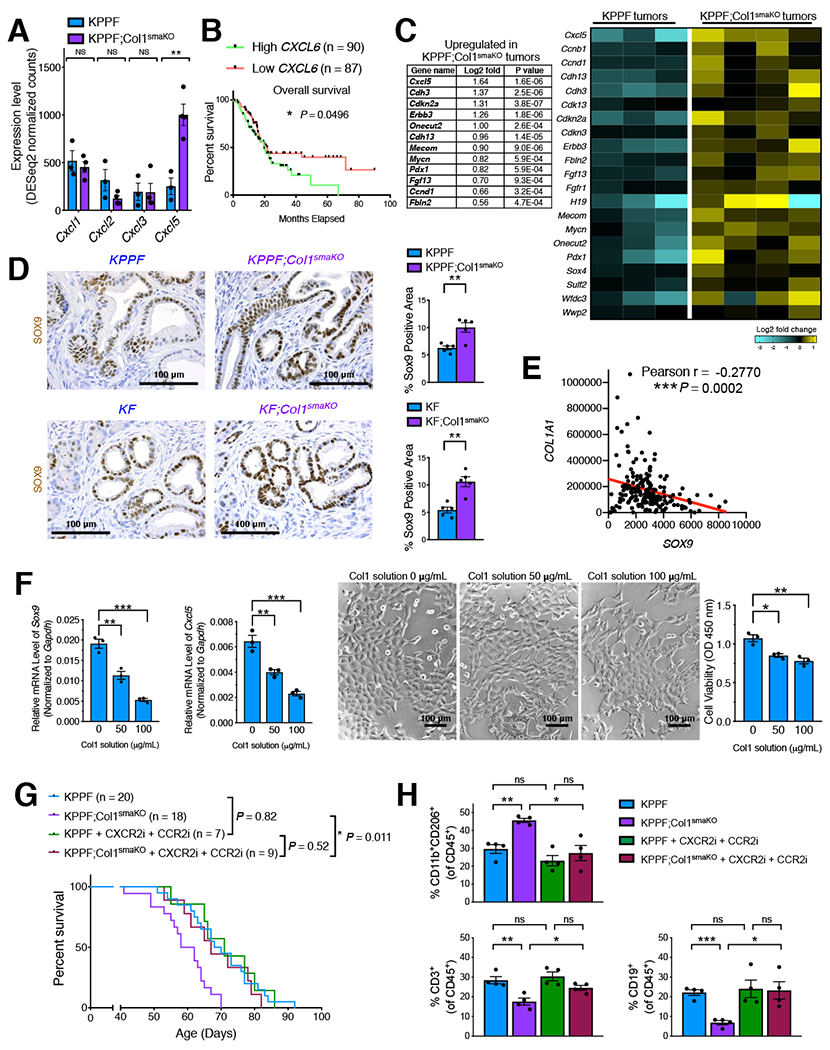
(A) Expression levels of genes encoding indicated chemokines related to myeloid cell recruitment, based on bulk RNA-seq data of KPPF and KPPF;Col1smaKO tumors.
(B) Overall survival of TCGA PDAC patients correlated with CXCL6 (the human homolog of mouse Cxcl5) expression level. Log-rank (Mantel-Cox) test was used.
(C) Heat map of SOX9-regulated genes, including Cxcl5, based on RNA-seq of KPPF and KPPF;Col1smaKO tumors. Expression alterations of these genes were also shown with Log2-fold change and P values (Wald Test).
(D) Representative images of SOX9 immunohistochemistry staining and positivity quantification in KPPF and KPPF;Col1smaKO tumors, or KF and KF;Col1smaKO tumors (n = 5/group). Scale bar: 100 μm.
(E) Correlation between the gene expression levels of COL1A1 and SOX9 in TCGA PDAC patients (n = 179). Pearson’s correlation test was used.
(F) The expression levels of Sox9 and Cxcl5 examined by qRT-PCR in primary KPPF;Col1smaKO cancer cells treated with purified Col1 (n = 3 biological replicates). Cancer cell morphology and proliferation were also shown.
(G) Survival of KPPF (n = 7) and KPPF;Col1smaKO (n = 9) mice treated with CXCR2 inhibitor SB-225002 and CCR2 inhibitor RS-504393, as compared to the survival of untreated KPPF (n = 20) and KPPF;Col1smaKO (n = 18) mice from Figure 3A. Log-rank (Mantel-Cox) test was used.
(H) The percentages of CD11b+CD206+ myeloid cells, CD3+ T cells, and CD19+ B cells among CD45+ immune cells in KPPF and KPPF;Col1smaKO tumors (n = 4/group) after CXCR2 inhibitor and CCR2 inhibitor treatment, as compared to untreated KPPF and KPPF;Col1smaKO tumors from Figure 4F.
Data are represented as mean ± SEM. * P < 0.05, ** P < 0.01, *** P < 0.001, Student’s t test was used unless otherwise indicated. See also Figure S7.
Given previous studies showing regulation of SOX9 activity by extracellular matrix content (Allen et al., 2012; Kim et al., 2015), we next investigated whether the increased SOX9 could be associated with the decreased stromal Col1 content in the KPPF;Col1smaKO tumors. Primary PDAC cells were established from KPPF;Col1smaKO tumors and treated with purified Col1 at different concentrations. Col1 treatment dose-dependently decreased the expression levels of Sox9 and Cxcl5, along with inhibition of the proliferation of PDAC cells, suggesting a direct impact of Col1 levels on Sox9 and Cxcl5 expression in cancer cells (Figure 6F). These results demonstrate that the decreased Col1 content in KPPF;Col1smaKO tumors could upregulate Sox9 and Cxcl5, potentially contributing to the recruitment of MDSCs.
To investigate the functional contribution of CCL2 (Figures 5B and 5E) and CXCL5 (Figures 6A–6C) to the recruitment of MDSC and acceleration of KPPF;Col1smaKO tumor progression, we treated KPPF and KPPF;Col1smaKO mice with inhibitors against CXCL5-CXCR2 axis (CXCR2 inhibitor, SB-225002) and CCL2-CCR2 axis (CCR2 inhibitor, RS-504393). The inhibitor combination of CXCL5-CXCR2 and CCL2-CCR2 axes significantly improved KPPF;Col1smaKO mouse survival, bringing it back to the similar levels observed in the control KPPF mice. This result underscores the essential role of enriched CD206+Arg1+CCL2+ tumor-promoting MDSCs in the accelerated tumor progression of KPPF;Col1smaKO mice (Figure 6G). The survival of KPPF mice was minimally improved by the treatment of inhibitors, in comparison with untreated KPPF mice (Figure 6G). In addition, the inhibitor combination treatment also largely reversed the Col1-deletion-induced immune profile alterations (including increased CD11b+CD206+ MDSCs, and decreased T/B cells) in KPPF;Col1smaKO tumors (Figure 6H).
Col1 deletion in αSMA+ myofibroblasts is associated with impaired recruitment and activation of T and B lymphocytes
Guided by our previous data showing decreased T/B lymphocytes in KPPF;Col1smaKO tumors (Figures 4B–4F), we further investigated the differentially expressed T/B lymphocyte-related genes between KPPF;Col1smaKO and KPPF tumors (Figures 7A, 7B, and S8A). T and B lymphocytes in KPPF;Col1smaKO tumors revealed not only decreased total cell numbers (Figure 4C), but also significantly suppressed expression of multiple key proteins associated with lymphocyte homing and activation (Figures 7A and 7B), such as L-selectin (CD62L, encoded by Sell) and CD69 (encoded by Cd69). T-cell-specific activation markers, Cd5 (Biancone et al., 1996) and B-cell-specific activation marker gene Pou2af1 (Gstaiger et al., 1995; Strubin et al., 1995) were also significantly downregulated in T cells and B cells, respectively (Figures 7A and 7B). In contrast, T and B cells in KPPF;Col1smaKO tumors revealed significantly increased expression of PIK3IP1 (encoded by Pik3ip1), an inhibitory marker of lymphocytes (Chen et al., 2019; Uche et al., 2018).
Figure 7. Col1 deletion inhibits T and B lymphocytes in PDAC.
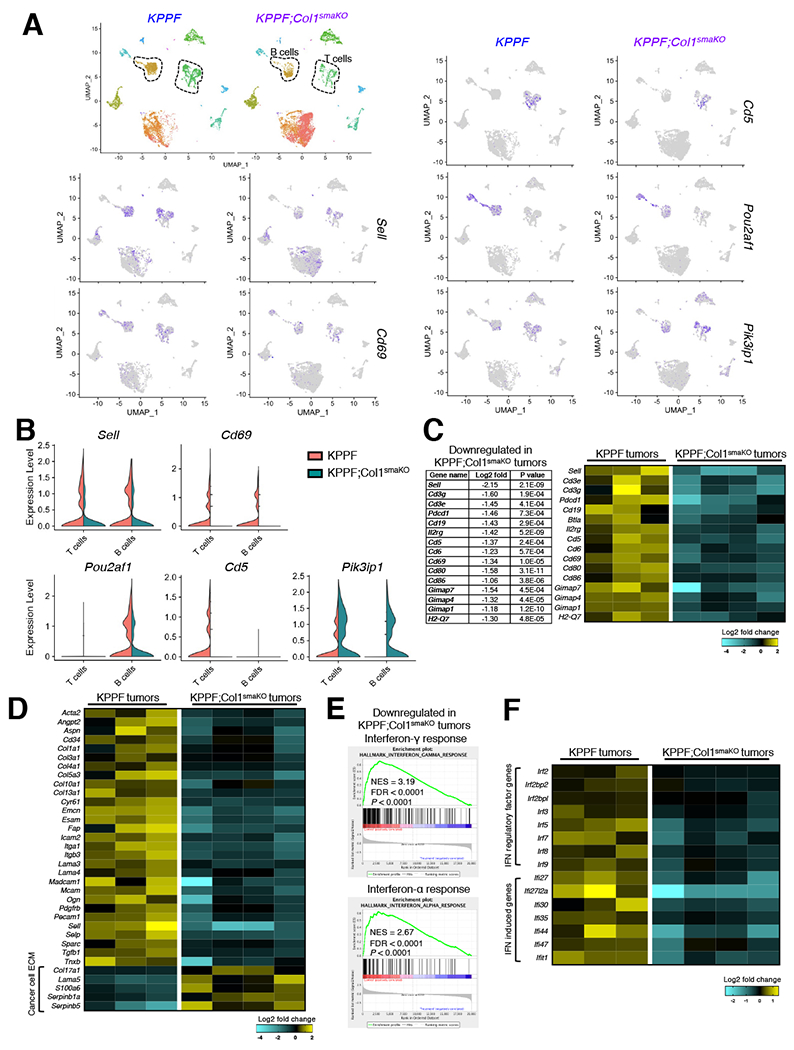
(A and B) Differentially expressed T/B lymphocyte related genes between KPPF and KPPF;Col1smaKO tumors shown in UMAP plot (A) and violin plot (B) showing the normalized expression levels of indicated genes.
(C) Significantly downregulated signature genes related to T cells and B cells in KPPF;Col1smaKO tumors, based on bulk RNA-seq data of KPPF and KPPF;Col1smaKO tumors, were shown in heat map or listed with Log2-fold change and P values (Wald Test).
(D) Heat map of genes encoding extracellular matrix (ECM) components based on RNA-seq of KPPF and KPPF;Col1smaKO tumors.
(E) GSEA revealing significantly downregulated interferon-γ/α response pathways in KPPF;Col1smaKO tumors compared to KPPF tumors. NES, normalized enrichment score. FDR, false discovery rate (q value).
(F) Heat map of interferon (IFN) regulatory factor genes and IFN-induced genes based on RNA-seq of KPPF and KPPF;Col1smaKO tumors.
See also Figure S8.
Additionally, bulk RNA-seq data confirmed significantly downregulated expression of T/B lymphocyte associated genes, such as Sell, Cd3g, Cd3e, Cd19, Il2rg, Cd5, and Cd69, in the KPPF;Col1smaKO tumors (Figure 7C). The RNA-seq data also revealed the downregulation of Cxcl16 (CXCL16, a T cell chemoattractant) (Matsumura et al., 2008; Slaney et al., 2014) in KPPF;Col1smaKO tumors (Figure S8B).
Next, we examined the genes related to lymphocyte recruitment in KPPF and KPPF;Col1smaKO tumors. Sell, Madcam1, and Cd34 (encoding L-selectin, MADCAM-1, and CD34) were downregulated in KPPF;Col1smaKO tumors (Figures 7D and S8C). In addition, the RNA-seq data demonstrated that type I interferon (IFN) pathway and IFN related genes were significantly suppressed in KPPF;Col1smaKO tumors (Figures 7E and 7F), which could also contribute to suppressed T/B lymphocyte response (Fuertes et al., 2011; Muthalagu et al., 2020). Taken together, our data suggest that the hampered recruitment and activation of T/B cells in KPPF;Col1smaKO tumors could be due to the suppression of key molecules (such as L-selectin, CD69, and CXCL16) and type I IFN pathway.
Lower Col1 level correlates with less T cells in mouse and human PDAC
Consistent with our previous results, the decreased T cells in KPPF;Col1smaKO tumors was also validated by TSA multispectral imaging (Figure 8A). Next we sought to investigate the correlation between stromal Col1 level and T cell recruitment in human PDAC samples (n = 108) by further analyzing TSA multispectral imaging quantitative results (Carstens et al., 2017). We observed a positive correlation between Col1 level with the several T cell subpopulations (Figure 8B), including CD8+ T cells, CD4+ T cells, and CD4+ FoxP3− T effector cells (Teffs), but not CD4+ FoxP3+ regulatory T cells (Tregs). Next, the patient cohort was stratified into Col1-high and Col1-low groups. The Col1-high group was significantly associated with more CD8+ T cells, CD4+ T cells, and CD4+ FoxP3− Teffs, but not CD4+ FoxP3+ regulatory Tregs, when compared to Col1-low group (Figures 8B and S8D; Table S7). In addition, Col1-high group also revealed a trend towards less lymph node metastases and better long-term survival (Figures 8C and 8D). Col1-high group and Col1-low group exhibited similar tumor stage distribution (as indicated by AJCC stage scores) and similar tumor differentiation status (Figure 8E). Also, the average Col1 area levels were similar among various groups classified by either disease stage or differentiation status (Figure 8E). Consistent results were observed in TCGA PDAC dataset, showing similar tumor stage distribution between the COL1A1-high and COL1A1-low groups, as well as similar COL1A1 expression levels in various disease stage groups (Figure 8F). These results suggest that the difference in Col1 level (or T cell presence) between Col1-high group and Col1-low group is not a reflection of potential difference in tumor stage or tumor differentiation status.
Figure 8. Lower Col1 level correlates with less T cells in mouse and human PDAC.
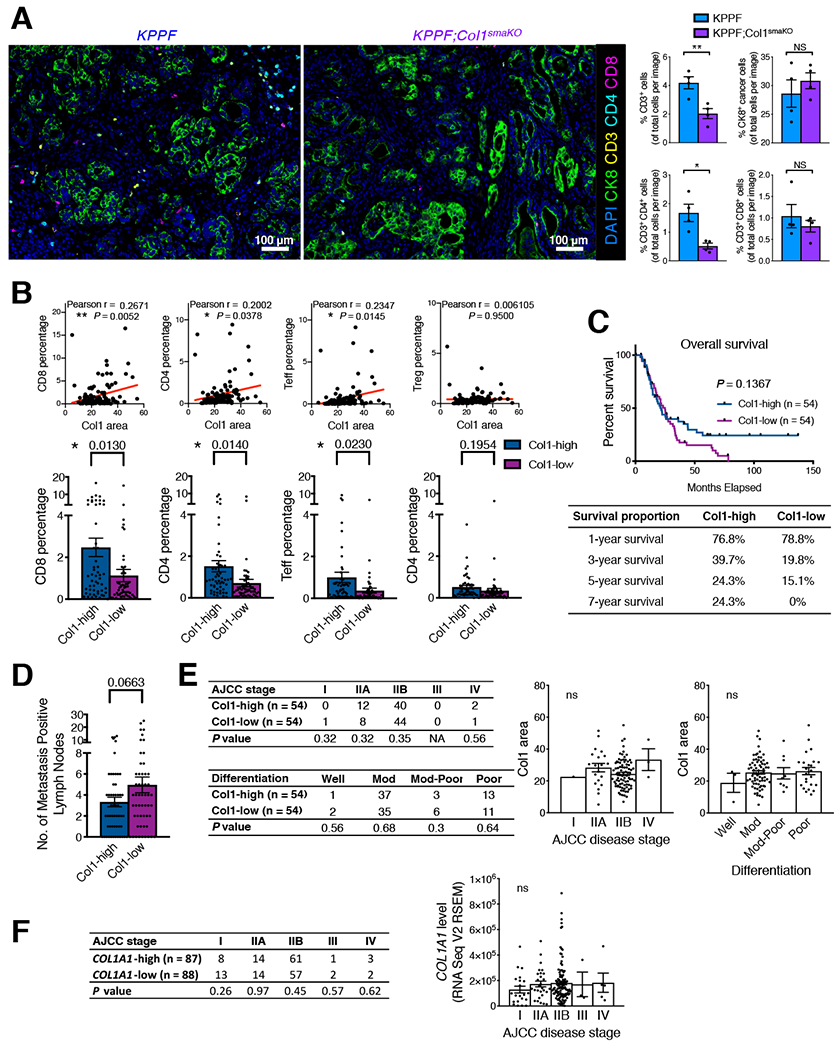
(A) CD3+, CD4+, and CD8+ T cell quantification from multispectral imaging of multiplex stained tumor sections of KPPF and KPPF;Col1smaKO mice (n = 4/group). Scale bar: 100 μm.
(B) The correlation between stromal Col1 level and T cell recruitment in human PDAC samples (n = 108) examined by TSA multispectral imaging. The correlation between Col1 level and the percentages of indicated T cell subpopulations was based on Pearson’s correlation test. The patient cohort was also stratified into Col1-high and Col1-low groups and compared for the presence of T cell subpopulations.
(C and D) The overall survival (C, with survival proportion compared at indicated time intervals, log-rank Mantel-Cox test) and the number of lymph nodes positive for metastases (D) were compared between Col1-high group and Col1-low patient group.
(E) The case distribution by AJCC tumor stage and tumor differentiation status among Col1-high and Col1-low patient groups. P values were using Chi-square test. The average Col1 area levels of various groups classified by either tumor stage or tumor differentiation status were also shown. Well: well differentiated. Mod: moderately differentiated. Mod-Poor: moderately-to-poorly differentiated. Poor: poorly differentiated.
(F) The case distribution by AJCC tumor stage among COL1A1-high and COL1A1-low groups of TCGA PDAC cohort. P values were calculated by Chi-square test. The average COL1A1 expression levels of various groups classified by tumor stage were also shown.
Data are represented as mean ± SEM. * P < 0.05, ** P < 0.01, NS: not significant, Student’s t test was used unless otherwise indicated. See also Figure S8; Table S7.
Taken together, these results demonstrate that Col1 deficiency in PDAC increases immunosuppressive CD206+ F4/80+ arginase-1+ MDSCs, associated with decreased T/B lymphocytes and accelerated tumor progression (Figure S8E).
DISCUSSION
For several decades, type I collagen (Col1) has been reported by many investigators as a significant component of the deposited extracellular matrix (ECM) in PDAC stroma (Imamura et al., 1995; Mollenhauer et al., 1987; Tian et al., 2019). Employing different concentrations of Col1 to embed cancer cells, it has been suggested that ECM rigidity/stiffness plays a role in accelerating cancer progression (Bonnans et al., 2014; Laklai et al., 2016; Miroshnikova et al., 2016; Mouw et al., 2014; Northcott et al., 2018; Paszek et al., 2005). Crosslinking capacity of Col1 has also been shown to play a role in accelerating cancer progression, and suppression of crosslinking enzymes such as Lysl oxidases inhibits this property of crosslinked Col1 (Levental et al., 2009; Pickup et al., 2013). Despite many such studies, direct assessment of the specific function of Col1 in PDAC remained undetermined.
This study employed complex mouse models to unravel the functional role of Col1 in the context of spontaneous PDAC. The study strategy exploited in vivo manipulation of Col1 to demonstrate that loss of Col1 in αSMA+ myofibroblasts leads to acceleration of PDAC, without compensatory increase in the production of other collagens in the tumor microenvironment. Our results further suggest a tumor-restraining function of myofibroblast-derived Col1 in PDAC microenvironment. Our results also validate previous findings that myofibroblasts can function to restrain PDAC progression (Bissell and Hines, 2011; Lee et al., 2014; Ozdemir et al., 2014; Rhim et al., 2014). The current study lends itself to an appreciation that Col1 produced by myofibroblasts contributes significantly to total Col1 content of PDAC, and its deletion leads to ~50% drop in PDAC stromal Col1 content. Moreover, such loss leads to acceleration of PDAC, in association with softer tumor tissue. Complete deletion of Col1 was not achieved in this mouse model and therefore it is possible that the complete deletion of Col1 might result in a different PDAC phenotype. In this regard, Hynes group recently showed that the total extracellular matrix content of tumors is a reflection of specific contributions by stromal fibroblasts and cancer cells (Tian et al., 2019; Tian et al., 2020). In this study, we show a global downregulation of genes encoding ECM proteins produced by fibroblasts in the KPPF;Col1smaKO tumors, with upregulation of genes encoding cancer cell-derived ECM proteins.
Col1 deletion in myofibroblasts is associated with increased number of MDSCs, which specifically express high levels of CD206, F4/80, argninase-1, CCL2, and interleukin-18, and likely contribute to the immunosuppressive microenvironment in PDAC. These MDSCs can further suppress T and B lymphocyte function via arginase-1 and CD206. Mechanistic studies indicate that the increased CD206+F4/80+Arg1+ MDSC recruitment could result from the decreased stromal Col1 content, which subsequently induces the SOX9-regulated expression of Cxcl5 in cancer cells. Our study clearly suggests that Col1 made by fibroblasts can functionally impact immune profile of PDAC and suppression of CD206+F4/80+Arg1+ MDSC recruitment can restrain PDAC progression.
In summary, our results unravel the fundamental role of myofibroblast-derived Co1l in regulating immune response and restraining PDAC progression. This study provides insights into the complex stromal biology of PDAC microenvironment and potential therapeutic interventions.
STAR METHODS
RESOURCE AVAILABILITY
Lead Contact
Further information and requests for resources, reagents and samples should be directed to and will be fulfilled by the Lead Contact, Raghu Kalluri (rkalluri@mdanderson.org).
Materials Availability
Materials and reagents used in this study are listed in the Key Resources Table. Reagents generated in our laboratory in this study or previous studies are available upon request.
KEY RESOURCES TABLE
| REAGENT or RESOURCE | SOURCE | IDENTIFIER |
|---|---|---|
| Antibodies | ||
| Goat Albumin | Bethyl | Cat# A90-134, RRID:AB_67120 |
| Mouse αSMA | DAKO | Cat# M0851, RRID:AB_2223500 |
| Rabbit CD206 (MRC1) | Abcam | Cat# ab64693, RRID:AB_1523910 |
| Rabbit CD45R | Abcam | Cat# ab64100, RRID:AB_1140036 |
| Rabbit CK19 | Abcam | Cat# ab52625, RRID:AB_2281020 |
| Goat Collagen I | SouthernBiotech | Cat# 1310-01, RRID:AB_2753206 |
| Rabbit Ki67 | Abcam | Cat# ab15580, RRID:AB_443209 |
| Rabbit SOX9 | Abcam | Cat# ab185966, RRID:AB_2728660 |
| Rabbit NG2 | Chemicon/Millipore | Cat# AB5320, RRID:AB_11213678 |
| Rat CD31 | Dianova | Cat# DIA-310, RRID:AB_2631039 |
| Goat Collagen IV | Abcam | Cat# ab6585, RRID:AB_305583 |
| Rabbit FSP1 | DAKO | Cat# A5114, RRID:AB_2335679 |
| Rabbit CD3 | Abcam | Cat# ab16669, RRID:AB_443425 |
| Rabbit CD4 | Cell Signaling | Cat# 25229, RRID:AB_2798898 |
| Rabbit CD8a | Cell Signaling | Cat# 98941, RRID:AB_2756376 |
| Rat Cytokeratin 8 | DSHB | Cat# TROMA-I, RRID:AB_531826 |
| Rat PDGFRα(CD140a)-PE | BioLegend | Cat# 135905, RRID:AB_1953268 |
| Rat EpCAM(CD326)-AF488 | BioLegend | Cat# 118210, RRID:AB_1134099 |
| Rat CD45-Pacific Blue | BioLegend | Cat# 103126, RRID:AB_493535 |
| Rat CD3-AF700 | eBioscience | Cat# 56-0032-82, RRID:AB_529507 |
| Rat CD11b-BV711 | BD | Cat# 563168, RRID:AB_2716860 |
| Rat CD206-FITC | BioLegend | Cat# 141703, RRID:AB_10900988 |
| Rat CD19-APC | eBioscience | Cat# 17-0193-82, RRID:AB_1659676 |
| Bacterial and Virus Strains | ||
| Biological Samples | ||
| Tissue microarray sections of human PDAC | MDACC | IRB LAB05-0854 |
| Chemicals, Peptides, and Recombinant Proteins | ||
| RS 504393 | Tocris | Cat# 2517/10 |
| SB 225002 | Tocris | Cat# 2725/10 |
| Collagenase IV | Gibco | Cat# 17104019 |
| Dispase II | Gibco | Cat# 17105041 |
| Liberase | Roche | Cat# 5401020001 |
| DNase I | Roche | Cat# 10104159001 |
| Type I collagen solution from rat tail | Sigma-Aldrich | Cat# C3867 |
| Critical Commercial Assays | ||
| Direct-zol RNA Kit | Zymo Research | Cat# R2050 |
| Reverse Transcription Kit | Applied Biosystems | Cat# 4368814 |
| SYBR Green Master Mix | Applied Biosystems | Cat# 4367659 |
| Cell Counting Kit-8 | Abcam | Cat# ab228554 |
| Live-Dead-eFluor780 | eBioscience | Cat# 65-0865-14 |
| Foxp3/Transcription Factor Staining Buffer Set | eBioscience | Cat# 00-5523-00 |
| Gomori’s Trichrome Stain Kit | Leica Biosystems | Cat# 38016SS2 |
| Chromium Single Cell 3’ Reagent Kits (v2) | 10x Genomics | Cat# PN-120237 |
| ABC-Kit | Vector | Cat# PK-6100 |
| Stable DAB | Invitrogen | Cat# 750118 |
| Direct Red 80 | Sigma-Aldrich | Cat# 365548 |
| TruSeq Stranded mRNA Sample Prep Kit | Illumina | Cat# 20020594 |
| Deposited Data | ||
| KPPF and KPPF;Col1smaKO tumor RNA-sequencing | This paper | GEO: GSE131500 |
| Single-cell RNA-sequencing | This paper | GEO: GSE166298 |
| TCGA pancreatic adenocarcinoma cohort survival and gene expression data (GDAC Firehose PAAD) | Broad Institute | http://gdac.broadinstitute.org/runs/stddata__2016_01_28/data/PAAD/20160128/ |
| Experimental Models: Cell Lines | ||
| Primary mouse KPPF;Col1smaKO cancer cells | This paper | N/A |
| Experimental Models: Organisms/Strains | ||
| Mouse: FSF-KrasG12D/+;Pdx1-Flp | Schonhuber et al., 2014 | N/A |
| Mouse: Trp53frt/+ | Lee et al., 2012 | N/A |
| Mouse: αSMA-Cre | LeBleu et al., 2013 | N/A |
| Mouse: Fsp1-Cre | Xue et al., 2003; Bhowmick et al., 2004 | N/A |
| Mouse: Rosa26-CAG-loxP-frt-Stop-frt-FireflyLuc-EGFP-loxP-RenillaLuc-tdTomato | Chen et al., 2018 | N/A |
| Mouse: Col1a1tm1a(EUCOMM)Wtsi | EuMMCR | https://www.mousephenotype.org/data/alleles/MGI:88467/tm1a(EUCOMM)Wtsi |
| Mouse: Col1a1loxP/loxP | This study | N/A |
| Oligonucleotides | ||
| Mouse Gapdh qRT-PCR F AGGTCGGTGTGAACGGATTTG | This paper | N/A |
| Mouse Gapdh qRT-PCR R TGTAGACCATGTAGTTGAGGTCA | This paper | N/A |
| Mouse Col1a1 qRT-PCR F GCTCCTCTTAGGGGCCACT | This paper | N/A |
| Mouse Col1a1 qRT-PCR R CCACGTCTCACCATTGGGG | This paper | N/A |
| Mouse Cxcl5 qRT-PCR F GTTCCATCTCGCCATTCATGC | This paper | N/A |
| Mouse Cxcl5 qRT-PCR R GCGGCTATGACTGAGGAAGG | This paper | N/A |
| Mouse Sox9 qRT-PCR F GAGCCGGATCTGAAGAGGGA | This paper | N/A |
| Mouse Sox9 qRT-PCR R GCTTGACGTGTGGCTTGTTC | This paper | N/A |
| Recombinant DNA | ||
| Software and Algorithms | ||
| Flowjo v10.7.1 | Flowjo, L.L.C. | RRID: SCR_008520 |
| Prism v8.0.0 | GraphPad Software Inc. | RRID: SCR_002798 |
| Fiji v2.0.0 | ImageJ | RRID: SCR_002285 |
| cBioportal v2.2.0 | MSK Center for Mol Onc | https://www.cbioportal.org/ |
| Seurat R package (3.5.3) | Satija et al., 2015 | https://satijalab.org/seurat/ |
| DESeq2 | Anders and Huber, 2010 | https://bioconductor.org/packages/release/bioc/html/DESeq2.html |
| STAR aligner | Dobin et al., 2013 | https://github.com/alexdobin/STAR |
| Gene Set Enrichment Analysis (GSEA) | Broad Institute | http://software.broadinstitute.org/gsea/index.jsp |
| Other | ||
Data and Code Availability
The accession numbers for the data reported in this paper are GEO: GSE131500 and GSE166298. The survival and gene expression data of TCGA pancreatic adenocarcinoma cohort were based on the GDAC Firehose PAAD dataset (previously known as the TCGA Provisional dataset).
EXPERIMENTAL MODEL AND SUBJECT DETAILS
Mice
FSF-KrasG12D/+ (Schonhuber et al., 2014), Pdx1-Flp (Schonhuber et al., 2014), Trp53frt/+ (Lee et al., 2012), αSMA-Cre (LeBleu et al., 2013), and Fsp1-Cre (Bhowmick et al., 2004; Xue et al., 2003) mouse strains were previously documented. Col1a1loxP/loxP mouse strain (with loxP-flanked exons 2-5) was established in the Genetically Engineered Mouse Facility at MD Anderson Cancer Center (MDACC) using the Col1a1tm1a(EUCOMM)Wtsi embryonic stem cells that were obtained from the European Mouse Mutant Cell Repository (EuMMCR). Rosa26-CAG-loxP-frt-Stop-frt-FireflyLuc-EGFP-loxP-RenillaLuc-tdTomato (referred to as R26Dual) mouse strain contains the R26Dual dual-fluorescence reporter allele, which allows the EGFP expression under the control of Pdx1-Flp transgene, or the tdTomato expression under the control of αSMA-Cre and Fsp1-Cre transgenes (Chen et al., 2018). Characterization of genotyping and disease phenotypes for the FSF-KrasG12D/+;Pdx1-Flp (referred to as KF) or FSF-KrasG12D/+;Trp53frt/frt;Pdx1-Flp (referred to as KPPF) mice was performed as previously described by Saur and colleagues (Schonhuber et al., 2014). We crossed the KF and KPPF mice with the αSMA-Cre, Fsp1-Cre, Col1a1loxP/loxP, or R26Dual mouse strains, resulting in the generation of the KF;αSMA-Cre;Col1a1loxP/loxP (referred to as KF;Col1smaKO), KPPF;αSMA-Cre;Col1a1loxP/loxP (referred to as KPPF;Col1smaKO), KPPF;Fsp1-Cre;Col1a1loxP/loxP (referred to as KPPF;Col1fspKO) mice. These mice allow the Col1a1 deletion in either αSMA+ myofibroblasts or Fsp1+ cell population in the context of spontaneous PDAC. The aforementioned experimental mice with desired genotypes were monitored and analyzed with no randomization or blinding. Both female and male mice with desired genotype(s) for PDAC were used for experimental mice. CXCR2 inhibitor and CCR2 inhibitor were used for the treatment of KPPF and KPPF;Col1smaKO mice. CXCR2 inhibitor SB-225002 (Tocris) was intraperitoneally administered at 10 mg/kg daily. CCR2 inhibitor RS-504393 (Tocris) was subcutaneously administered at 5 mg/kg twice daily. All mice were housed under standard housing conditions at MDACC animal facilities, and all animal procedures were reviewed and approved by the MDACC Institutional Animal Care and Use Committee.
Cell culture
Isolation of primary PDAC cells from mouse pancreatic tumors was performed as previously described with minor modifications (Chen et al., 2018; Zheng et al., 2015). Fresh tumor tissues were minced with sterilized lancets, digested with collagenase IV (17104019, Gibco, 4 mg/mL)/dispase II (17105041, Gibco, 4 mg/mL)/RPMI at 37 °C for 0.5 hour, filtered by 70 μm cell strainers to generate single cell suspension and resuspended in RPMI/20%FBS. Cells were cultured in RPMI medium containing 20% FBS and 1% penicillin-streptomycin-amphotericin B (PSA) antibiotic mixture. Primary KPPF;Col1smaKO cancer cells established from KPPF;Col1smaKO tumors were treated with purified Col1 (Sigma-Aldrich C3867) at indicated concentrations for 48 hours (n = 3 biological replicates). The morphology and proliferation of cancer cells under Col1 treatment were examined by phase-contrast microscopy and CCK-8 cell viability assay, respectively.
Patient cohort for PDAC tissue microarray
All human PDAC sections were fixed on tissue microarray slides, which contain three representative 1 mm cores from each patient (two representative cores of tumor and one core of matched benign pancreatic tissue). The tissue microarrays were constructed from FFPE blocks of archived PDAC specimens using a previously described methodology (Wang et al., 2002). This study was approved by the Institutional Review Board of MDACC (IRB LAB05-0854). Informed consent was obtained from all patients. Those patients received no neoadjuvant therapy. Cases and clinical information were retrieved from the surgical pathology files of the Department of Pathology, MDACC (Table S7).
METHOD DETAILS
Histology and immunohistochemistry
For paraffin-fixed samples, mouse tissues were fixed in 10% neutral buffered formalin, embedded in paraffin, and sectioned at 5 μm thickness. Sections were processed for hematoxylin and eosin (H&E) staining. Masson’s trichrome stain (MTS) was conducted using Gomori’s Trichrome Stain Kit (38016SS2, Leica Biosystems). Picrosirius red staining for collagen was conducted using 0.1% Picrosirius Red (Direct Red80; Sigma-Aldrich) and counterstained with Weigert’s haematoxylin. Images were captured with a Leica DM 1000 LED microscope and an MC120 HD Microscope Camera with LAS V4.4 Software (Leica). To quantify Masson’s Trichrome staining, the hue value for strong positive blue pixel (collagen) was set as 0.6 with a hue width of 0.1. To quantify Picrosirius Red staining, the hue value for strong positive red pixel (collagen) was set at 0.95 with a hue width of 0.1. To quantify immunohistochemical staining, the strong positive brown pixels were quantified using hue value of 0.1 and hue width of 0.4. Circularly polarized light microscopy of tissue sections stained with Picrosirius red was conducted according to previous studies (Levental et al., 2009; Ozdemir et al., 2014), using an Axio Observer.Z1 Fluorescence Microscope equipped with Rotatable Polarizer D and Analyzer Slider D/A Rot 360 (Zeiss). Formalin-fixed, paraffin-embedded sections were processed for immunohistochemical staining as previously documented (Chen et al., 2018; Zheng et al., 2015). Sections were incubated with primary antibodies: albumin (A90-134A-8, Bethyl, 1:200), αSMA (M0851, Dako, 1:100), CD3 (ab16669, Abcam, 1:200), CD206 (ab64693, Abcam, 1:200), CD45R (ab64100, Abcam, 1:200), CK19 (ab52625, Abcam, 1:200), type I collagen (Col1; ab34710, Abcam, 1:200), Ki67 (ab15580, Abcam, 1:200), SOX9 (ab185966, Abcam, 1:200), followed by biotinylated secondary antibodies, and streptavidin HRP (Biocare Medical). For all immunolabeling experiments, sections were developed by DAB and counterstained with hematoxylin. All the aforementioned procedures for staining, imaging, and quantification were performed blinded to the sample identity and phenotype.
Immunofluorescence
Tumor tissues from the mice with R26Dual lineage tracing were fixed in 4% paraformaldehyde overnight at 4 °C and equilibrated in 30% sucrose overnight at 4 °C. Tissues were then embedded in O.C.T. compound (TissueTek) and processed for 5-μm-thick cryosections. Sections were blocked for 1 h with 4% cold water fish gelatin (Aurion) and immunostained overnight at 4 °C with αSMA antibody (M0851, Dako, 1:100) or Fsp1 antibody (A5114, Dako, 1:100), followed by AlexaFluor647 secondary antibodies (Invitrogen). Staining for αSMA was performed with Mouse-on-Mouse (M.O.M.) kit (Vector Laboratories) following the manufacturer’s instructions. Slides were then mounted with DAPI-containing Vectashield Mounting Medium (Vector Laboratories), visualized under the LSM800 confocal laser scanning microscope, and analyzed with ZEN software (Zeiss). Immunohistochemical staining of formalin-fixed, paraffin-embedded sections were conducted using the following primary antibodies: CD31 (DIA310, Dianova, 1:100), Collagen IV (AB6586, Abcam, 1:100), and NG2 (AB5320, Chemicon/Millipore, 1:150), followed by fluorescence-labeled secondary antibodies (Jackson ImmunoResearch).
Atomic force microscopy (AFM)
Fresh tissues were embedded and frozen in O.C.T. compound (TissueTek) Cryosections were obtained at a thickness of 50 μm and attached to poly-L-lysine-coated glass microscope slides (Sigma-Aldrich). Cryosections were rinsed carefully with water to remove the O.C.T. compound and air-dried prior to imaging. Images were obtained at the AFM core facility of UT Health Science Center, using a BioScope II atomic force microscope (Bruker Corporation) integrated with a TE2000 inverted optical microscope (Nikon). Quantification of the average Young’s Elastic Modulus (MPa) value was based on 3 mice for each group. Each mouse was examined for 5 to 8 randomly selected tumor areas across the tissue section, while each area was probed for at least 3 randomly selected points.
qRT-PCR
Total RNA was extracted from cells using Direct-zol RNA Kit (Zymo Research), processed for cDNA synthesis using the Reverse Transcription Kit (Applied Biosystems), and subjected to the qRT-PCR using SYBR Green Master Mix (Applied Biosystems). The expression level of indicated genes was normalized to the expression of Gapdh as housekeeping gene. The qRT-PCR primers are listed in Key Resources Table.
Total mRNA sequencing
For mRNA sequencing (RNA-seq) analysis of tumor tissues, freshly dissected tumor samples were frozen in RNase-free tubes with liquid nitrogen and preserved at −80°C. Samples were homogenized using bead tubes with ceramic beads on Fisherbrand Bead Mill 24 homogenizer (Fisher Scientific). Total RNA was extracted using Direct-zol RNA Kit (Zymo Research). Quality control analysis was conducted using RNA 6000 Nano Kit on Bioanalyzer 2100 (Agilent). Total mRNA sequencing was performed using Illumina TruSeq stranded mRNAseq Library and High-Output sequencing PE 75x75 nt on NextSeq 500 (Illumina) by MDACC Sequencing and ncRNA Program core facility. Raw sequencing data from the Illumina platform were converted into Fastq files and aligned to the reference genome mm10 using the Spliced Transcripts Alignment to a Reference (STAR) algorithm (Dobin et al., 2013). HTSeq-count was then utilized to generate the raw counts for each gene. Raw counts were then analyzed by DESeq2 (Anders and Huber, 2010) for data processing, normalization, and differential expression analysis according to standard procedures. Unsupervised hierarchical clustering heat map was based on the differentially expressed genes (defined by DESeq2 P-value < 0.05 and fold change > 1.5) between KPPF and KPPF;Col1smaKO tumors. Color scheme of the heat map represents row Z-score distribution. Heat maps of differentially expressed genes were plotted with log2-fold change of indicated genes. Functional categorization and pathway reconstitution from the RNA-seq data were conducted using gene set enrichment analysis (GSEA; Broad Institute). NOM. p. val refers to nominal P value. NES refers to normalized enrichment score. FDR refers to false discovery rate (q value). All analyses were implemented in R.
Single-cell RNA-sequencing (sc-RNA-seq)
Fresh tumor tissue was minced with sterilized lancets, digested with collagenase IV (17104019, Gibco, 4 mg/mL)/dispase II (17105041, Gibco, 4 mg/mL)/RPMI at 37 °C for 0.5 hour, filtered by 70 μm cell strainers, and resuspended in PBS/2%FBS as single cell suspension. The single cell suspension was stained with Live/Dead viability dye eFluor 780 (65-0865-14, eBioscience), filtered through a 40 μm mesh, and then sorted for live cells with Aria II sorter (BD Biosciences) at the South Campus Flow Cytometry Core Laboratory of MDACC. The median gene reads per cell were around 2300. The percentage of total mapped sequence reads with the QC30 threshold in RNA read scores were above 70%. The Fraction Reads in Cells scores were around 80 %. sc-RNA-seq on these samples was conducted at the Sequencing and Microarray Facility of MDACC. Single cell Gel Bead-In-Emulsions (GEMs) generation and barcoding, post GEM-RT cleanup and cDNA amplification, library construction and Illumina-ready sequencing library generation were prepared by following the manufacturer’s guidelines. High Sensitivity dsDNA Qubit kit was used to estimate the cDNA and Library concentration. HS DNA Bioanalyzer was used for the quantification of cDNA. DNA 1000 Bioanalyzer was used for the quantification of libraries. The “c-loupe” files were generated by using Cell Ranger software pipelines following manufacturer’s guidelines. Cells from unfractionated KPPF tumors (n = 3) or KPPF;Col1smaKO tumors (n = 2) were encapsulated using 10X Genomics’ Chromium controller and Single Cell 3’ Reagent Kits v2. Following capture and lysis, cDNA was synthesized and amplified to construct Illumina sequencing libraries. The libraries from about 1,000 cells per sample were sequenced with Illumina Nextseq 500. The run format was 26 cycles for read 1, 8 cycles index 1, and 124 cycles for read 2. sc-RNA-seq data were processed by the Sequencing and Microarray Facility in MD Anderson Cancer Center. Library Seurat version 3.5.3 (Satija et al., 2015), dplyr and cowplot were loaded into R to explore QC metrics, filter cells, normalize data, cluster cells, and identify cluster biomarkers. To filter out low-quality cells, a threshold with a minimum of 200 and a maximum of 7000 genes per cell was used. Cells with more than 10% of the mitochondrial genome were also removed for further analysis. “RunUMAP” function was used for clustering the cells. Based on the “JackStrawPlot” and “ElbowPlot” functions, the first 27 principal components were used for UMAP projection and clustering analysis. “FindAllMarkers” function was used to identify the specific markers for each cell cluster. “DoHeatmap” function was used to show the top 10 genes in each cluster. “VlnPlot” function was used to show expression probability distributions across cell clusters of the genes we selected to assign the cell type identity, and the genes that we were interested in. The signature gene expression lists for all major cell clusters and their subpopulations were provided in the spreadsheet files as Tables S1, S3, S5, and S6.
Flow cytometry for cell sorting
Fresh tumor tissue was minced with sterilized lancets, digested with collagenase IV (17104019, Gibco, 4 mg/mL)/dispase II (17105041, Gibco, 4 mg/mL)/RPMI at 37 °C for 0.5 hour, filtered by 70 μm cell strainers, and resuspended in PBS/2%FBS as single cell suspension. The subsequent single-cells suspension was stained with CD140a(PDGFRα)-PE(135905; BioLegend) for fibroblast sorting, and CD326(EpCAM)-AlexaFluor 488 (118210; BioLegend) for cancer cell sorting. Samples were filtered through a 40 μm mesh and then sorted with Aria II sorter (BD Biosciences) at the South Campus Flow Cytometry Core Laboratory of MDACC.
Immune cell population analysis by flow cytometry
Fresh tumor tissue was digested with 0.1 mg/mL Liberase TL (Roche, 05401020001) and 0.2 mg/mL DNase-I (Roche, 10104159001) in RPMI for 30 min at 37 °C for 0.5 hour with gentle mixing, followed by further dissociation using gentleMACS C-tubes on the gentleMACS Dissociator (Miltenyi Biotec). The digestion was stopped with RPMI with 10% FBS and 10 mM EDTA. Cells were filtered by 70 μm cell strainers, washed, resuspended, and subjected to a gradient centrifugation using Histopaque-1119 (Sigma-Aldrich, 11191). Cells were stained in the dark on ice for 30 min with 100 μL antibody cocktail for membrane markers (Key Resources Table), diluted in FACS buffer containing 20% Brilliant Stain Buffer (BD Bioscience, 566349) and 50 μg/mL anti-mouse CD16/CD32 (2.4G2) FC block (BD Biosciences, 553142). Cells were washed twice with PBS/2%FBS, fixed-permeabilized with Foxp3/Transcription Factor Staining Buffer Set (eBioscience, 00-5523-00), washed twice with 1x Permeabilization buffer, and stained in the dark on ice for 30 min with antibody cocktail (for intracellular markers) diluted in 1x Permeabilization buffer. Cells were washed twice with 1x Permeabilization buffer and washed with PBS/2%FBS. Data were acquired using the Fortessa-X20 (BD Bioscience) and analyzed using FlowJo Ver 10. Immune populations were gated on single live CD45+ cells.
Multispectral imaging of multiplex stained tissue microarray sections
Human PDAC tissue microarray sections were stained by multi-plex staining and multispectral imaging. The multiplex staining procedures, spectral unmixing and cell segmentation using the Nuance and inForm imaging softwares were described previously (Carstens et al., 2017). Antibody concentrations used for the multiplex staining (of Col1, cytokeratin-8, CD3, CD4, CD8, FoxP3) can be found in Key Resources Table. Multiplex stained slides were imaged with the Vectra Multispectral Imaging System version 2, with Vectra software version 3.0.3 (Perkin Elmer). Each tissue section was scanned in its entirety using a 4x objective. Up to 80 regions (at 20x) per section were selected for multispectral imaging using the Phenochart software (Perkin Elmer). Each multiplex field was scanned every 10 nm of the emission light spectrum across the range of each emission filter cube. Filter cubes used for multispectral imaging were DAPI (440-600 nm), FITC (520 nm-680 nm), Cy3 (570-690 nm), Texas Red (580-700 nm) and Cy5 (680-720 nm). Multispectral images from single marker stained slides with the corresponding fluorophores were used to generate a spectral library using the Nuance Image Analysis software (Perkin Elmer). The library contained the emitting spectral peaks of all fluorophores and was used to unmix each multispectral image (spectral unmixing) to its individual 6 components by using the inForm 2.2 image analysis software. Thresholds of detection for the different markers were adjusted across different cohorts in order to ensure consistent capture of positive signal across all controls. All images in each cohort were processed using the same thresholds of staining positivity. After spectral unmixing and cell segmentation, the images were then subjected to a proprietary inForm active learning phenotyping algorithm. This algorithm enables the individual identification of each DAPI-stained cell based on the pattern of fluorescence staining signal and nuclear/cell morphological features. Cells were classified into the following classes according to our markers of interest: cytokeratin-8+ (CK8+) cancer cells, total T cells (CD3+), CD8+ T cells (CD3+CD8+), CD4+ Teff cells (CD3+CD4+Foxp3−), CD4+ Treg cells (CD3+CD4+FoxP3+), and other (CK8−CD3−). All the aforementioned procedures for staining, imaging, image processing, and quantifications were performed blinded to the sample identity and clinical outcomes.
Cell viability assay
Cancer cells (3 × 10³ cells per well in 100 μL RPMI with 1% FBS) were seeded in to 96-well plates and then treated with indicated conditions for 48 h. Cell viability/number in each well of 96-well plates was determined using the Cell Counting Kit-8 (CCK8; Abcam ab228554), examined at OD 450 nm on a microplate reader following the manufacturer’s instructions.
QUANTIFICATION AND STATISTICAL ANALYSIS
Statistical analyses of flow cytometry and immunostaining quantifications were performed with unpaired, two-tailed t test, one-way ANOVA with Tukey’s multiple comparison test, or Fisher’s exact test using GraphPad Prism (GraphPad Software, San Diego, CA, USA). Chi-square χ2 analyses were performed comparing the case distribution of AJCC tumor stages and tumor differentiation status among TCGA PDAC cohort and/or MDACC PDAC cohort. The expression levels of indicated genes among TCGA PDAC cohort samples were based on the RNA Seq V2 RSEM data. TCGA data were downloaded from cBioPortal (Cerami et al., 2012; Gao et al., 2013). For the survival analysis based on IL18 expression, patients with available OS data and RNA-seq data (n = 177) were stratified into IL18-high (n = 90) and IL18-low (n = 87) groups based on the median IL18 expression level. Similarly, for the survival analysis based on CXCL6 (the human homolog of mouse Cxcl5) expression, patients (n = 177) were stratified into CXCL6-high (n = 90) and CXCL6-low (n = 87) groups based on the median CXCL6 expression level. Kaplan-Meier plots were drawn for survival analysis and the log rank Mantel-Cox test was used to evaluate statistical differences. Data met the assumptions of each statistical test, where variance was not equal (determined by an F-test) Welch’s correction for unequal variances was applied. A P value < 0.05 was considered statistically significant. Error bars represented standard error of the mean (S.E.M.) when multiple visual fields were averaged to produce a single value for each animal, which was then averaged again to represent the mean bar for the group in each graph.
Supplementary Material
Table S1
List of the signature genes of indicated functional cell clusters from the single-cell RNA-sequencing analysis data. Related to Figure 1.
Table S3
List of the signature genes of indicated cancer-associated fibroblast (CAF) subpopulations from the single-cell RNA-sequencing analysis data. Related to Figure 1.
Table S5
List of the signature genes of indicated cancer cell subpopulations from the single-cell RNA-sequencing analysis data. Related to Figure 4.
Table S6
List of the signature genes of indicated myeloid cell subpopulations from the single-cell RNA-sequencing analysis data. Related to Figures 4 and 5.
Table S7
Clinical information of the patient cohort for PDAC tissue microarray. Related to Figure 8.
Highlights.
Col1 deletion in myofibroblasts decreases stromal Col1 content in pancreatic tumors
Col1 deletion aggravates pancreatic tumor progression and immunosuppression
Col1 deletion promotes recruitment of CD206+ARG1+myeloid-derived suppressor cells
CXCR2 and CCR2 inhibition reverses tumor progression promoted by Col1 deletion
ACKNOWLEDGEMENTS
We thank D. Saur for providing the KPPF and R26Dual mouse strain, C.G. Liu at the MDACC Sequencing and ncRNA Program for RNA-seq analysis, K.M. Ramirez and R. Jewell at the Advanced Cytometry & Sorting Facility at South Campus of MDACC for flow cytometry (in part supported by NCI P30CA16672), E.J. Thompson, D.P. Pollock and Y. Chen at the Advanced Technology Genomics Core for their assistance for the single-cell RNA-sequencing analysis in part supported by NCI CA016672 (ATGC), the Genetically Engineered Mouse Facility team of MDACC for the generation of Col1a1loxP/loxP mouse strain. We would like to thank Y. Fan and P.E. Phillips for their technical help with flow cytometry and immunohistochemistry/multispectral imaging, K.M. McAndrews for flow cytometry data analysis, J. Zhang, X. Song, and X. Mao for RNA-seq data processing, J.L. Carstens for TSA multispectral imaging, A.M. Zaske at the AFM core facility of UT Health Science Center for atomic force microscopy. This work was primarily supported by the Cancer Prevention and Research Institute of Texas (CPRIT). Pancreatic cancer research work in the Kalluri laboratory is also supported by NCI PO1CA95616, and was supported by CPRIT Award RP150231. The current address of Jiha Kim is Department of Biological Sciences, North Dakota State University, Fargo, ND, 58102, USA.
Footnotes
Publisher's Disclaimer: This is a PDF file of an unedited manuscript that has been accepted for publication. As a service to our customers we are providing this early version of the manuscript. The manuscript will undergo copyediting, typesetting, and review of the resulting proof before it is published in its final form. Please note that during the production process errors may be discovered which could affect the content, and all legal disclaimers that apply to the journal pertain.
DECLARATOIN OF INTERESTS
The authors declare no competing interests.
REFERENCES
- Allen JL, Cooke ME, and Alliston T (2012). ECM stiffness primes the TGFbeta pathway to promote chondrocyte differentiation. Mol Biol Cell 23, 3731–3742 [DOI] [PMC free article] [PubMed] [Google Scholar]
- Anders S, and Huber W (2010). Differential expression analysis for sequence count data. Genome Biol 11, R106. [DOI] [PMC free article] [PubMed] [Google Scholar]
- Apte MV, Haber PS, Applegate TL, Norton ID, McCaughan GW, Korsten MA, Pirola RC, and Wilson JS (1998). Periacinar stellate shaped cells in rat pancreas: identification, isolation, and culture. Gut 43, 128–133. [DOI] [PMC free article] [PubMed] [Google Scholar]
- Apte MV, Haber PS, Darby SJ, Rodgers SC, McCaughan GW, Korsten MA, Pirola RC, and Wilson JS (1999). Pancreatic stellate cells are activated by proinflammatory cytokines: implications for pancreatic fibrogenesis. Gut 44, 534–541. [DOI] [PMC free article] [PubMed] [Google Scholar]
- Apte MV, Pirola RC, and Wilson JS (2012). Pancreatic stellate cells: a starring role in normal and diseased pancreas. Front Physiol 3, 344. [DOI] [PMC free article] [PubMed] [Google Scholar]
- Armstrong T, Packham G, Murphy LB, Bateman AC, Conti JA, Fine DR, Johnson CD, Benyon RC, and Iredale JP (2004). Type I collagen promotes the malignant phenotype of pancreatic ductal adenocarcinoma. Clinical cancer research : an official journal of the American Association for Cancer Research 10, 7427–7437. [DOI] [PubMed] [Google Scholar]
- Bachem MG, Schunemann M, Ramadani M, Siech M, Beger H, Buck A, Zhou S, Schmid-Kotsas A, and Adler G (2005). Pancreatic carcinoma cells induce fibrosis by stimulating proliferation and matrix synthesis of stellate cells. Gastroenterology 128, 907–921. [DOI] [PubMed] [Google Scholar]
- Beatty GL, Chiorean EG, Fishman MP, Saboury B, Teitelbaum UR, Sun W, Huhn RD, Song W, Li D, Sharp L Lv et al. (2011). CD40 agonists alter tumor stroma and show efficacy against pancreatic carcinoma in mice and humans. Science 331, 1612–1616. [DOI] [PMC free article] [PubMed] [Google Scholar]
- Bernard V, Semaan A, Huang J, San Lucas FA, Mulu FC, Stephens BM, Guerrero PA, Huang Y, Zhao J, Kamyabi N, et al. (2019). Single-Cell Transcriptomics of Pancreatic Cancer Precursors Demonstrates Epithelial and Microenvironmental Heterogeneity as an Early Event in Neoplastic Progression. Clinical cancer research : an official journal of the American Association for Cancer Research 25, 2194–2205. [DOI] [PMC free article] [PubMed] [Google Scholar]
- Bever KM, Sugar EA, Bigelow E, Sharma R, Laheru D, Wolfgang CL, Jaffee EM, Anders RA, De Jesus-Acosta A, and Zheng L (2015). The prognostic value of stroma in pancreatic cancer in patients receiving adjuvant therapy. HPB (Oxford) 17, 292–298. [DOI] [PMC free article] [PubMed] [Google Scholar]
- Bezzi M, Seitzer N, Ishikawa T, Reschke M, Chen M, Wang G, Mitchell C, Ng C, Katon J, Lunardi A, et al. (2018). Diverse genetic-driven immune landscapes dictate tumor progression through distinct mechanisms. Nature medicine 24, 165–175. [DOI] [PubMed] [Google Scholar]
- Bhowmick NA, Chytil A, Plieth D, Gorska AE, Dumont N, Shappell S, Washington MK, Neilson EG, and Moses HL (2004). TGF-beta signaling in fibroblasts modulates the oncogenic potential of adjacent epithelia. Science 303, 848–851. [DOI] [PubMed] [Google Scholar]
- Biancone L, Bowen MA, Lim A, Aruffo A, Andres G, and Stamenkovic I (1996). Identification of a novel inducible cell-surface ligand of CD5 on activated lymphocytes. The Journal of experimental medicine 184, 811–819. [DOI] [PMC free article] [PubMed] [Google Scholar]
- Biffi G, Oni TE, Spielman B, Hao Y, Elyada E, Park Y, Preall J, and Tuveson DA (2019). IL1-Induced JAK/STAT Signaling Is Antagonized by TGFbeta to Shape CAF Heterogeneity in Pancreatic Ductal Adenocarcinoma. Cancer Discov 9, 282–301. [DOI] [PMC free article] [PubMed] [Google Scholar]
- Bissell MJ, and Hines WC (2011). Why don’t we get more cancer? A proposed role of the microenvironment in restraining cancer progression. Nature medicine 17, 320–329. [DOI] [PMC free article] [PubMed] [Google Scholar]
- Biswas SK, and Mantovani A (2010). Macrophage plasticity and interaction with lymphocyte subsets: cancer as a paradigm. Nat Immunol 11, 889–896. [DOI] [PubMed] [Google Scholar]
- Bonnans C, Chou J, and Werb Z (2014). Remodelling the extracellular matrix in development and disease. Nature reviews Molecular cell biology 15, 786–801. [DOI] [PMC free article] [PubMed] [Google Scholar]
- Bronte V, Serafini P, De Santo C, Marigo I, Tosello V, Mazzoni A, Segal DM, Staib C, Lowel M, Sutter G, et al. (2003). IL-4-induced arginase 1 suppresses alloreactive T cells in tumor-bearing mice. Journal of immunology 170, 270–278. [DOI] [PubMed] [Google Scholar]
- Bronte V, and Zanovello P (2005). Regulation of immune responses by L-arginine metabolism. Nature reviews Immunology 5, 641–654. [DOI] [PubMed] [Google Scholar]
- Carstens JL, Correa de Sampaio P, Yang D, Barua S, Wang H, Rao A, Allison JP, LeBleu VS, and Kalluri R (2017). Spatial computation of intratumoral T cells correlates with survival of patients with pancreatic cancer. Nature communications 8, 15095. [DOI] [PMC free article] [PubMed] [Google Scholar]
- Cerami E, Gao J, Dogrusoz U, Gross BE, Sumer SO, Aksoy BA, Jacobsen A, Byrne CJ, Heuer ML, Larsson E, et al. (2012). The cBio cancer genomics portal: an open platform for exploring multidimensional cancer genomics data. Cancer Discov 2, 401–404. [DOI] [PMC free article] [PubMed] [Google Scholar]
- Chen Y, LeBleu VS, Carstens JL, Sugimoto H, Zheng X, Malasi S, Saur D, and Kalluri R (2018). Dual reporter genetic mouse models of pancreatic cancer identify an epithelial-to-mesenchymal transition-independent metastasis program. EMBO molecular medicine 10. [DOI] [PMC free article] [PubMed] [Google Scholar]
- Chen Y, Wang J, Wang X, Li X, Song J, Fang J, Liu X, Liu T, Wang D, Li Q, et al. (2019). Pik3ip1 Is a Negative Immune Regulator that Inhibits Antitumor T-Cell Immunity. Clinical cancer research : an official journal of the American Association for Cancer Research 25, 6180–6194. [DOI] [PubMed] [Google Scholar]
- Cheng R, Billet S, Liu C, Haldar S, Choudhury D, Tripathi M, Hav M, Merchant A, Hu T, Huang H, et al. (2020). Periodontal inflammation recruits distant metastatic breast cancer cells by increasing myeloid-derived suppressor cells. Oncogene 39, 1543–1556. [DOI] [PMC free article] [PubMed] [Google Scholar]
- Chytil A, Magnuson MA, Wright CV, and Moses HL (2002). Conditional inactivation of the TGF-beta type II receptor using Cre:Lox. Genesis 32, 73–75. [DOI] [PubMed] [Google Scholar]
- Dobin A, Davis CA, Schlesinger F, Drenkow J, Zaleski C, Jha S, Batut P, Chaisson M, and Gingeras TR (2013). STAR: ultrafast universal RNA-seq aligner. Bioinformatics 29, 15–21. [DOI] [PMC free article] [PubMed] [Google Scholar]
- DuFort CC, DelGiorno KE, Carlson MA, Osgood RJ, Zhao C, Huang Z, Thompson CB, Connor RJ, Thanos CD, Scott Brockenbrough J, et al. (2016). Interstitial Pressure in Pancreatic Ductal Adenocarcinoma Is Dominated by a Gel-Fluid Phase. Biophys J 110, 2106–2119. [DOI] [PMC free article] [PubMed] [Google Scholar]
- Egeblad M, Rasch MG, and Weaver VM (2010). Dynamic interplay between the collagen scaffold and tumor evolution. Curr Opin Cell Biol 22, 697–706. [DOI] [PMC free article] [PubMed] [Google Scholar]
- Elyada E, Bolisetty M, Laise P, Flynn WF, Courtois ET, Burkhart RA, Teinor JA, Belleau P, Biffi G, Lucito M Sv et al. (2019). Cross-Species Single-Cell Analysis of Pancreatic Ductal Adenocarcinoma Reveals Antigen-Presenting Cancer-Associated Fibroblasts. Cancer Discov 9, 1102–1123. [DOI] [PMC free article] [PubMed] [Google Scholar]
- Ene-Obong A, Clear AJ, Watt J, Wang J, Fatah R, Riches JC, Marshall JF, Chin-Aleong J, Chelala C, Gribben J Gv et al. (2013). Activated pancreatic stellate cells sequester CD8+ T cells to reduce their infiltration of the juxtatumoral compartment of pancreatic ductal adenocarcinoma. Gastroenterology 145, 1121–1132. [DOI] [PMC free article] [PubMed] [Google Scholar]
- Erkan M, Michalski CW, Rieder S, Reiser-Erkan C, Abiatari I, Kolb A, Giese NA, Esposito I, Friess H, and Kleeff J (2008). The activated stroma index is a novel and independent prognostic marker in pancreatic ductal adenocarcinoma. Clin Gastroenterol Hepatol 6, 1155–1161. [DOI] [PubMed] [Google Scholar]
- Feig C, Gopinathan A, Neesse A, Chan DS, Cook N, and Tuveson DA (2012). The pancreas cancer microenvironment. Clinical cancer research : an official journal of the American Association for Cancer Research 18, 4266–4276. [DOI] [PMC free article] [PubMed] [Google Scholar]
- Fuertes MB, Kacha AK, Kline J, Woo SR, Kranz DM, Murphy KM, and Gajewski TF (2011). Host type I IFN signals are required for antitumor CD8+ T cell responses through CD8{alpha}+ dendritic cells. The Journal of experimental medicine 208, 2005–2016. [DOI] [PMC free article] [PubMed] [Google Scholar]
- Fujita H, Ohuchida K, Mizumoto K, Egami T, Miyoshi K, Moriyama T, Cui L, Yu J, Zhao M, Manabe T, and Tanaka M (2009). Tumor-stromal interactions with direct cell contacts enhance proliferation of human pancreatic carcinoma cells. Cancer science 100, 2309–2317. [DOI] [PMC free article] [PubMed] [Google Scholar]
- Gao J, Aksoy BA, Dogrusoz U, Dresdner G, Gross B, Sumer SO, Sun Y, Jacobsen A, Sinha R, Larsson E, et al. (2013). Integrative analysis of complex cancer genomics and clinical profiles using the cBioPortal. Sci Signal 6, pl1. [DOI] [PMC free article] [PubMed] [Google Scholar]
- Gstaiger M, Knoepfel L, Georgiev O, Schaffner W, and Hovens CM (1995). A B-cell coactivator of octamer-binding transcription factors. Nature 373, 360–362. [DOI] [PubMed] [Google Scholar]
- Haber PS, Keogh GW, Apte MV, Moran CS, Stewart NL, Crawford DH, Pirola RC, McCaughan GW, Ramm GA, and Wilson JS (1999). Activation of pancreatic stellate cells in human and experimental pancreatic fibrosis. The American journal of pathology 155, 1087–1095. [DOI] [PMC free article] [PubMed] [Google Scholar]
- Hanahan D, and Weinberg RA (2011). Hallmarks of cancer: the next generation. Cell 144, 646–674. [DOI] [PubMed] [Google Scholar]
- Hay ED (1981). Extracellular matrix. The Journal of cell biology 91, 205s–223s. [DOI] [PMC free article] [PubMed] [Google Scholar]
- Hayashi A, Fan J, Chen R, Ho Y.-j., Makohon-Moore AP, Lecomte N, Zhong Y, Hong J, Huang J, Sakamoto H et al. (2020). A unifying paradigm for transcriptional heterogeneity and squamous features in pancreatic ductal adenocarcinoma. Nature Cancer 1, 59–74. [DOI] [PMC free article] [PubMed] [Google Scholar]
- Hingorani SR, Wang L, Multani AS, Combs C, Deramaudt TB, Hruban RH, Rustgi AK, Chang S, and Tuveson DA (2005). Trp53R172H and KrasG12D cooperate to promote chromosomal instability and widely metastatic pancreatic ductal adenocarcinoma in mice. Cancer cell 7, 469–483. [DOI] [PubMed] [Google Scholar]
- Hosein AN, Huang H, Wang Z, Parmar K, Du W, Huang J, Maitra A, Olson E, Verma U, and Brekken RA (2019). Cellular heterogeneity during mouse pancreatic ductal adenocarcinoma progression at single-cell resolution. JCI insight 5. [DOI] [PMC free article] [PubMed] [Google Scholar]
- Imamura T, Iguchi H, Manabe T, Ohshio G, Yoshimura T, Wang ZH, Suwa H, Ishigami S, and Imamura M (1995). Quantitative analysis of collagen and collagen subtypes I, III, and V in human pancreatic cancer, tumor-associated chronic pancreatitis, and alcoholic chronic pancreatitis. Pancreas 11, 357–364. [DOI] [PubMed] [Google Scholar]
- Kalluri R (2016). The biology and function of fibroblasts in cancer. Nature reviews Cancer 16, 582–598. [DOI] [PubMed] [Google Scholar]
- Katzenelenbogen Y, Sheban F, Yalin A, Yofe I, Svetlichnyy D, Jaitin DA, Bornstein C, Moshe A, Keren-Shaul H, Cohen M, et al. (2020). Coupled scRNA-Seq and Intracellular Protein Activity Reveal an Immunosuppressive Role of TREM2 in Cancer. Cell 182, 872–885 e819. [DOI] [PubMed] [Google Scholar]
- Kim JH, Lee G, Won Y, Lee M, Kwak JS, Chun CH, and Chun JS (2015). Matrix cross-linking-mediated mechanotransduction promotes posttraumatic osteoarthritis. Proceedings of the National Academy of Sciences of the United States of America 112, 9424–9429. [DOI] [PMC free article] [PubMed] [Google Scholar]
- Korc M (2007). Pancreatic cancer-associated stroma production. American journal of surgery 194, S84–86. [DOI] [PMC free article] [PubMed] [Google Scholar]
- Laklai H, Miroshnikova YA, Pickup MW, Collisson EA, Kim GE, Barrett AS, Hill RC, Lakins JN, Schlaepfer DD, Mouw JK, et al. (2016). Genotype tunes pancreatic ductal adenocarcinoma tissue tension to induce matricellular fibrosis and tumor progression. Nature medicine 22, 497–505. [DOI] [PMC free article] [PubMed] [Google Scholar]
- LeBleu VS, Taduri G, O’Connell J, Teng Y, Cooke VG, Woda C, Sugimoto H, and Kalluri R (2013). Origin and function of myofibroblasts in kidney fibrosis. Nature medicine 19, 1047–1053. [DOI] [PMC free article] [PubMed] [Google Scholar]
- Lee CL, Moding EJ, Huang X, Li Y, Woodlief LZ, Rodrigues RC, Ma Y, and Kirsch DG (2012). Generation of primary tumors with Flp recombinase in FRT-flanked p53 mice. Disease models & mechanisms 5, 397–402. [DOI] [PMC free article] [PubMed] [Google Scholar]
- Lee JJ, Perera RM, Wang H, Wu DC, Liu XS, Han S, Fitamant J, Jones PD, Ghanta KS, Kawano S, et al. (2014). Stromal response to Hedgehog signaling restrains pancreatic cancer progression. Proceedings of the National Academy of Sciences of the United States of America 111, E3091–3100. [DOI] [PMC free article] [PubMed] [Google Scholar]
- Lees JF, Tasab M, and Bulleid NJ (1997). Identification of the molecular recognition sequence which determines the type-specific assembly of procollagen. The EMBO journal 16, 908–916. [DOI] [PMC free article] [PubMed] [Google Scholar]
- Levental KR, Yu H, Kass L, Lakins JN, Egeblad M, Erler JT, Fong SF, Csiszar K, Giaccia A, Weninger W, et al. (2009). Matrix crosslinking forces tumor progression by enhancing integrin signaling. Cell 139, 891–906. [DOI] [PMC free article] [PubMed] [Google Scholar]
- Lim HX, Hong HJ, Cho D, and Kim TS (2014). IL-18 enhances immunosuppressive responses by promoting differentiation into monocytic myeloid-derived suppressor cells. Journal of immunology 193, 5453–5460. [DOI] [PubMed] [Google Scholar]
- Liu Y, Van Ginderachter JA, Brys L, De Baetselier P, Raes G, and Geldhof AB (2003). Nitric oxide-independent CTL suppression during tumor progression: association with arginase-producing (M2) myeloid cells. Journal of immunology 170, 5064–5074. [DOI] [PubMed] [Google Scholar]
- Lohler J, Timpl R, and Jaenisch R (1984). Embryonic lethal mutation in mouse collagen I gene causes rupture of blood vessels and is associated with erythropoietic and mesenchymal cell death. Cell 38, 597–607. [DOI] [PubMed] [Google Scholar]
- Ma G, Pan PY, Eisenstein S, Divino CM, Lowell CA, Takai T, and Chen SH (2011). Paired immunoglobin-like receptor-B regulates the suppressive function and fate of myeloid-derived suppressor cells. Immunity 34, 385–395. [DOI] [PMC free article] [PubMed] [Google Scholar]
- Mahadevan D, and Von Hoff DD (2007). Tumor-stroma interactions in pancreatic ductal adenocarcinoma. Molecular cancer therapeutics 6, 1186–1197. [DOI] [PubMed] [Google Scholar]
- Matsumura S, Wang B, Kawashima N, Braunstein S, Badura M, Cameron TO, Babb JS, Schneider RJ, Formenti SC, Dustin ML, and Demaria S (2008). Radiation-induced CXCL16 release by breast cancer cells attracts effector T cells. Journal of immunology 181, 3099–3107. [DOI] [PMC free article] [PubMed] [Google Scholar]
- Mews P, Phillips P, Fahmy R, Korsten M, Pirola R, Wilson J, and Apte M (2002). Pancreatic stellate cells respond to inflammatory cytokines: potential role in chronic pancreatitis. Gut 50, 535–541. [DOI] [PMC free article] [PubMed] [Google Scholar]
- Miroshnikova YA, Mouw JK, Barnes JM, Pickup MW, Lakins JN, Kim Y, Lobo K, Persson AI, Reis GF, McKnight TR, et al. (2016). Tissue mechanics promote IDH1-dependent HIF1alpha-tenascin C feedback to regulate glioblastoma aggression. Nature cell biology 18, 1336–1345. [DOI] [PMC free article] [PubMed] [Google Scholar]
- Moffitt RA, Marayati R, Flate EL, Volmar KE, Loeza SG, Hoadley KA, Rashid NU, Williams LA, Eaton SC, Chung AH, et al. (2015). Virtual microdissection identifies distinct tumor- and stroma-specific subtypes of pancreatic ductal adenocarcinoma. Nature genetics 47, 1168–1178. [DOI] [PMC free article] [PubMed] [Google Scholar]
- Molgora M, Esaulova E, Vermi W, Hou J, Chen Y, Luo J, Brioschi S, Bugatti M, Omodei AS, Ricci B, et al. (2020). TREM2 Modulation Remodels the Tumor Myeloid Landscape Enhancing Anti-PD-1 Immunotherapy. Cell 182, 886–900 e817. [DOI] [PMC free article] [PubMed] [Google Scholar]
- Mollenhauer J, Roether I, and Kern HF (1987). Distribution of extracellular matrix proteins in pancreatic ductal adenocarcinoma and its influence on tumor cell proliferation in vitro. Pancreas 2, 14–24. [DOI] [PubMed] [Google Scholar]
- Mouw JK, Yui Y, Damiano L, Bainer RO, Lakins JN, Acerbi I, Ou G, Wijekoon AC, Levental KR, Gilbert PM, et al. (2014). Tissue mechanics modulate microRNA-dependent PTEN expression to regulate malignant progression. Nature medicine 20, 360–367. [DOI] [PMC free article] [PubMed] [Google Scholar]
- Mueller MM, and Fusenig NE (2004). Friends or foes - bipolar effects of the tumour stroma in cancer. Nature reviews Cancer 4, 839–849. [DOI] [PubMed] [Google Scholar]
- Muthalagu N, Monteverde T, Raffo-Iraolagoitia X, Wiesheu R, Whyte D, Hedley A, Laing S, Kruspig B, Upstill-Goddard R, Shaw R, et al. (2020). Repression of the Type I Interferon Pathway Underlies MYC- and KRAS-Dependent Evasion of NK and B Cells in Pancreatic Ductal Adenocarcinoma. Cancer Discov 10, 872–887. [DOI] [PMC free article] [PubMed] [Google Scholar]
- Nakamura K, Kassem S, Cleynen A, Chretien ML, Guillerey C, Putz EM, Bald T, Forster I, Vuckovic S, Hill GR, et al. (2018). Dysregulated IL-18 Is a Key Driver of Immunosuppression and a Possible Therapeutic Target in the Multiple Myeloma Microenvironment. Cancer cell 33, 634–648 e635. [DOI] [PubMed] [Google Scholar]
- Neesse A, Algul H, Tuveson DA, and Gress TM (2015). Stromal biology and therapy in pancreatic cancer: a changing paradigm. Gut 64, 1476–1484. [DOI] [PubMed] [Google Scholar]
- Northcott JM, Dean IS, Mouw JK, and Weaver VM (2018). Feeling Stress: The Mechanics of Cancer Progression and Aggression. Front Cell Dev Biol 6, 17. [DOI] [PMC free article] [PubMed] [Google Scholar]
- Ohlund D, Elyada E, and Tuveson D (2014). Fibroblast heterogeneity in the cancer wound. The Journal of experimental medicine 211, 1503–1523. [DOI] [PMC free article] [PubMed] [Google Scholar]
- Ohlund D, Handly-Santana A, Biffi G, Elyada E, Almeida AS, Ponz-Sarvise M, Corbo V, Oni TE, Hearn SA, Lee EJ, et al. (2017). Distinct populations of inflammatory fibroblasts and myofibroblasts in pancreatic cancer. The Journal of experimental medicine 214, 579–596. [DOI] [PMC free article] [PubMed] [Google Scholar]
- Olive KP, Jacobetz MA, Davidson CJ, Gopinathan A, McIntyre D, Honess D, Madhu B, Goldgraben MA, Caldwell ME, Allard D, et al. (2009). Inhibition of Hedgehog signaling enhances delivery of chemotherapy in a mouse model of pancreatic cancer. Science 324, 1457–1461. [DOI] [PMC free article] [PubMed] [Google Scholar]
- Ozdemir BC, Pentcheva-Hoang T, Carstens JL, Zheng X, Wu CC, Simpson TR , Laklai H, Sugimoto H, Kahlert C, Novitskiy SV, et al. (2014). Depletion of carcinoma-associated fibroblasts and fibrosis induces immunosuppression and accelerates pancreas cancer with reduced survival. Cancer cell 25, 719–734. [DOI] [PMC free article] [PubMed] [Google Scholar]
- Paszek MJ, Zahir N, Johnson KR, Lakins JN, Rozenberg GI, Gefen A, Reinhart-King CA, Margulies SS, Dembo M, Boettiger D, et al. (2005). Tensional homeostasis and the malignant phenotype. Cancer cell 8, 241–254. [DOI] [PubMed] [Google Scholar]
- Peng J, Sun BF, Chen CY, Zhou JY, Chen YS, Chen H, Liu L, Huang D, Jiang J, Cui GS, et al. (2019). Single-cell RNA-seq highlights intra-tumoral heterogeneity and malignant progression in pancreatic ductal adenocarcinoma. Cell Res 29, 725–738. [DOI] [PMC free article] [PubMed] [Google Scholar]
- Pickup MW, Laklai H, Acerbi I, Owens P, Gorska AE, Chytil A, Aakre M, Weaver VM, and Moses HL (2013). Stromally derived lysyl oxidase promotes metastasis of transforming growth factor-beta-deficient mouse mammary carcinomas. Cancer research 73, 5336–5346. [DOI] [PMC free article] [PubMed] [Google Scholar]
- Provenzano PP, Cuevas C, Chang AE, Goel VK, Von Hoff DD, and Hingorani SR (2012). Enzymatic targeting of the stroma ablates physical barriers to treatment of pancreatic ductal adenocarcinoma. Cancer cell 21, 418–429. [DOI] [PMC free article] [PubMed] [Google Scholar]
- Rhim AD, Oberstein PE, Thomas DH, Mirek ET, Palermo CF, Sastra SA, Dekleva EN, Saunders T, Becerra CP, Tattersall IW, et al. (2014). Stromal elements act to restrain, rather than support, pancreatic ductal adenocarcinoma. Cancer cell 25, 735–747. [DOI] [PMC free article] [PubMed] [Google Scholar]
- Roca H, Varsos ZS, Sud S, Craig MJ, Ying C, and Pienta KJ (2009). CCL2 and interleukin-6 promote survival of human CD11b+ peripheral blood mononuclear cells and induce M2-type macrophage polarization. The Journal of biological chemistry 284, 34342–34354. [DOI] [PMC free article] [PubMed] [Google Scholar]
- Satija R, Farrell JA, Gennert D, Schier AF, and Regev A (2015). Spatial reconstruction of single-cell gene expression data. Nat Biotechnol 33, 495–502. [DOI] [PMC free article] [PubMed] [Google Scholar]
- Schonhuber N, Seidler B, Schuck K, Veltkamp C, Schachtler C, Zukowska M, Eser S, Feyerabend TB, Paul MC, Eser P, et al. (2014). A next-generation dual-recombinase system for time- and host-specific targeting of pancreatic cancer. Nature medicine 20, 1340–1347. [DOI] [PMC free article] [PubMed] [Google Scholar]
- Sharma U, Carrique L, Vadon-Le Goff S, Mariano N, Georges RN, Delolme F, Koivunen P, Myllyharju J, Moali C, Aghajari N, and Hulmes DJ (2017). Structural basis of homo- and heterotrimerization of collagen I. Nature communications 8, 14671. [DOI] [PMC free article] [PubMed] [Google Scholar]
- Slaney CY, Kershaw MH, and Darcy PK (2014). Trafficking of T cells into tumors. Cancer research 74, 7168–7174. [DOI] [PubMed] [Google Scholar]
- Steele CW, Karim SA, Leach JDG, Bailey P, Upstill-Goddard R, Rishi L, Foth M, Bryson S, McDaid K, Wilson Z, et al. (2016). CXCR2 Inhibition Profoundly Suppresses Metastases and Augments Immunotherapy in Pancreatic Ductal Adenocarcinoma. Cancer cell 29, 832–845. [DOI] [PMC free article] [PubMed] [Google Scholar]
- Strubin M, Newell JW, and Matthias P (1995). OBF-1, a novel B cell-specific coactivator that stimulates immunoglobulin promoter activity through association with octamer-binding proteins. Cell 80, 497–506. [DOI] [PubMed] [Google Scholar]
- Strutz F, Okada H, Lo CW, Danoff T, Carone RL, Tomaszewski JE, and Neilson EG (1995). Identification and characterization of a fibroblast marker: FSP1. The Journal of cell biology 130, 393–405. [DOI] [PMC free article] [PubMed] [Google Scholar]
- Sugimoto H, Mundel TM, Kieran MW, and Kalluri R (2006). Identification of fibroblast heterogeneity in the tumor microenvironment. Cancer biology & therapy 5, 1640–1646. [DOI] [PubMed] [Google Scholar]
- Tian C, Clauser KR, Ohlund D, Rickelt S, Huang Y, Gupta M, Mani DR, Carr SA, Tuveson DA, and Hynes RO (2019). Proteomic analyses of ECM during pancreatic ductal adenocarcinoma progression reveal different contributions by tumor and stromal cells. Proceedings of the National Academy of Sciences of the United States of America. [DOI] [PMC free article] [PubMed] [Google Scholar]
- Tian C, Ohlund D, Rickelt S, Lidstrom T, Huang Y, Hao L, Zhao RT, Franklin O, Bhatia SN, Tuveson DA, and Hynes RO (2020). Cancer Cell-Derived Matrisome Proteins Promote Metastasis in Pancreatic Ductal Adenocarcinoma. Cancer research 80, 1461–1474. [DOI] [PMC free article] [PubMed] [Google Scholar]
- Uche UU, Piccirillo AR, Kataoka S, Grebinoski SJ, D’Cruz LM, and Kane LP (2018). PIK3IP1/TrIP restricts activation of T cells through inhibition of PI3K/Akt. The Journal of experimental medicine 215, 3165–3179. [DOI] [PMC free article] [PubMed] [Google Scholar]
- von Ahrens D, Bhagat TD, Nagrath D, Maitra A, and Verma A (2017). The role of stromal cancer-associated fibroblasts in pancreatic cancer. Journal of hematology & oncology 10, 76. [DOI] [PMC free article] [PubMed] [Google Scholar]
- Wang G, Lu X, Dey P, Deng P, Wu CC, Jiang S, Fang Z, Zhao K, Konaparthi R, Hua S, et al. (2016). Targeting YAP-Dependent MDSC Infiltration Impairs Tumor Progression. Cancer Discov 6, 80–95. [DOI] [PMC free article] [PubMed] [Google Scholar]
- Wang H, Wang H, Zhang W, and Fuller GN (2002). Tissue microarrays: applications in neuropathology research, diagnosis, and education. Brain Pathol 12, 95–107. [DOI] [PMC free article] [PubMed] [Google Scholar]
- Wang WQ, Liu L, Xu HX, Luo GP, Chen T, Wu CT, Xu YF, Xu J, Liu C, Zhang B, et al. (2013). Intratumoral alpha-SMA enhances the prognostic potency of CD34 associated with maintenance of microvessel integrity in hepatocellular carcinoma and pancreatic cancer. PloS one 8, e71189. [DOI] [PMC free article] [PubMed] [Google Scholar]
- Whittle MC, and Hingorani SR (2019). Fibroblasts in Pancreatic Ductal Adenocarcinoma: Biological Mechanisms and Therapeutic Targets. Gastroenterology 156, 2085–2096. [DOI] [PMC free article] [PubMed] [Google Scholar]
- Xue C, Plieth D, Venkov C, Xu C, and Neilson EG (2003). The gatekeeper effect of epithelial-mesenchymal transition regulates the frequency of breast cancer metastasis. Cancer research 63, 3386–3394. [PubMed] [Google Scholar]
- Zheng X, Carstens JL, Kim J, Scheible M, Kaye J, Sugimoto H, Wu CC, LeBleu VS, and Kalluri R (2015). Epithelial-to-mesenchymal transition is dispensable for metastasis but induces chemoresistance in pancreatic cancer. Nature 527, 525–530. [DOI] [PMC free article] [PubMed] [Google Scholar]
Associated Data
This section collects any data citations, data availability statements, or supplementary materials included in this article.
Supplementary Materials
Table S1
List of the signature genes of indicated functional cell clusters from the single-cell RNA-sequencing analysis data. Related to Figure 1.
Table S3
List of the signature genes of indicated cancer-associated fibroblast (CAF) subpopulations from the single-cell RNA-sequencing analysis data. Related to Figure 1.
Table S5
List of the signature genes of indicated cancer cell subpopulations from the single-cell RNA-sequencing analysis data. Related to Figure 4.
Table S6
List of the signature genes of indicated myeloid cell subpopulations from the single-cell RNA-sequencing analysis data. Related to Figures 4 and 5.
Table S7
Clinical information of the patient cohort for PDAC tissue microarray. Related to Figure 8.
Data Availability Statement
The accession numbers for the data reported in this paper are GEO: GSE131500 and GSE166298. The survival and gene expression data of TCGA pancreatic adenocarcinoma cohort were based on the GDAC Firehose PAAD dataset (previously known as the TCGA Provisional dataset).