

Abstract
The effects of social media advertisements together with local awareness in controlling COVID-19 are explored in the present investigation by means of a mathematical model. The expression for the basic reproduction number is derived. Sufficient conditions for the global stability of endemic equilibrium are obtained. We perform sensitivity analysis to identify the key parameters of the model having great impacts on the prevalence and control of COVID-19. We calibrate the proposed model to fit the data set of COVID-19 cases for India. Our simulation results show that dissemination rate of awareness among susceptible individuals at community level and individual level plays pivotal role in curtailing the COVID-19 disease. Moreover, we observe that the global information distributing from social media and local awareness coming from mouth-to-mouth communication between unaware susceptible and aware people, together with hospitalization of symptomatic individuals and quarantine of asymptomatic individuals, are much beneficial in reducing COVID-19 cases in India. Our study suggests that both global and local awareness must be implemented effectively to manage the burden of COVID-19 pandemic.
Introduction
Global information campaigns through social media and other awareness programs conducted by media and health authorities reveal public health issues and encourage people to adopt non-pharmaceutical interventions as effective preventive measures. Media can be identified as no cost partial treatment at the early stage of epidemic outbreaks when medical healthcare facilities and biomedical interventions (vaccination) are not sufficient to curtail the burden of disease. Media plays the role of prime source of information having noticeable impact on the governmental healthcare involvement to bring the epidemic outbreak under control, as it affects individuals’ behavior toward the disease outbreak. Through media, people are getting aware and education about diseases to prevent its spread by taking precautions such as social distancing, wearing protective masks, quarantine, and vaccination, to lessen their chance of being infected [1–5].
In the last few decades, different kinds of mathematical models have been considered to scrutinize the media’s impact on preventing the infectious disease outbreak [6–10]. Most of these studies assume that media is capable to reduce the disease transmission. In particular, Liu and Cui [11] have proposed a model where they have taken the contact rate as a decreasing function of infective individuals. Kiss et al. [12] formulated a model by assuming all the aware individuals are divided into responsive and non-responsive toward media campaigning. They showed that distribution of the awareness information has a huge effect on preventing infection. Funk et al. [9] proposed an SIRS model for the rollout of awareness for an epidemic outbreak and found that awareness programs can impede the disease spread. Misra et al. [10] have studied awareness programs’ impact on emerging diseases by introducing an isolated aware class protected from the infection, which is formed by media campaigns. By their traced results, they have interpreted that the disease can be regulated but cannot be eradicated from the population. Further, Misra et al. [13] have considered a model where susceptible individuals become aware by Holling type-II functional response. The system shows periodic solutions through Hopf bifurcation, as a result of delay in the execution of awareness programs. Samanta et al. [14] have discussed a model in which the aware class can catch the infection at a lower rate than the unaware class. They observed that an increased growth rate of media campaign results in decreased infection, but, up to a threshold mark. Moreover, the immigration rate has a primarily key role in regulating the system dynamics.
The COVID-19 pandemic causes huge number of life loss and severe disruptions of economies, livelihoods, educations, health facilities and social activities throughout the world. This outbreak has been emerged through the spread of SARS-CoV-2 virus that can be suppressed by non-pharmaceutical interventions (NPIs), rapid vaccination and effective lockdown measures. But, lockdown restrictions cannot last indefinitely as it leads to the disruptive socioeconomic consequences. The ongoing outbreak of COVID-19, highly contagious, has become a massive threat for government of many countries by affecting almost every aspect of human life. COVID-19 is causing obstacles for public health organizations. The outbreak was declared as a pandemic of international concern by WHO on March 11, 2020 [15]. The virus can cause a range of symptoms including dry cough, fever, fatigue, breathing difficulty, and bilateral lung infiltration in severe cases, similar to those caused by SARS-CoV and MERS-CoV infections [16, 17]. In some cases, non-breathing symptoms including nausea, vomiting and diarrhea have been faced by infected people [18]. Chan et al. [19] confirmed that the virus spreads through the close contact of humans. The authors demonstrated in [20] that India has less mortality rate of COVID-19 as its total infected population is concern. India is in the process of increasing public health and social measures based on local epidemiology and on local risk assessments, such as lockdown, restricted movement, and educational institutes are implementing the distance-learning and businesses to teleworking, and regulated international and national travel measures. Across the world, countries have executed various measures to control COVID-19, with the aim of slowing down transmission and dropping mortality. A lot of models have been proposed and analyzed mathematically in order to explore the spread and control of COVID-19 [21–27].
Olaniyi et al. [28] formulated an epidemic model by considering the transmission routes from symptomatic, asymptomatic and hospitalized individuals. The optimal preventive measure was suggested to be better than management control in reducing the burden of the disease, but the combined control has great effect in reducing the number of infectious individuals in the population, that is the most cost-effective when compared with the single implementation of each control measure. Authors assessed the impact of lockdown during the COVID-19 outbreak in [29]. They suggested that effective lockdown is very necessary to reduce the burden of disease. Srivastav et al. [30] have studied the dynamics of COVID-19 pandemic in India to assess the impacts of face mask, hospitalization of symptomatic individuals and quarantine of asymptomatic individuals. Their findings suggest that the frequent use of face mask while in public places together with hospitalization of symptomatic individuals and quarantine of asymptomatic individuals is effective measures to reduce the burden of COVID-19 in India. Ghosh et al. [31] showed that their proposed scheme is able to predict the trend of COVID-19 for up to three weeks for some targeted locations. Impact of intervention on disease spread is studied in [32]. It suggests that higher intervention effort is needed to control COVID-19 outbreak within a shorter period of time in India, and the strength of the intervention should be increased over the time to eradicate the disease effectively. Nadim et al. [33] proposed and analyzed an epidemic model of COVID-19 to predict and control the outbreak. Short-term predictions show that the decreasing trend of new COVID-19 cases is well captured by the model. Their findings conclude that if limited resources are available, then investing on the quarantined individuals will be more impactful in reducing infection.
Rai et al. [34] examined the social media advertisements’ impact on the transmission dynamics of COVID-19 pandemic in India. They have assumed modified public attitude toward this infectious disease due to awareness dissemination among susceptible individuals which decreases the disease transmission by reducing the possibility of contact with the coronavirus. Moreover, the rate of hospitalization of symptomatic individuals has been increased by behavioral response and also asymptomatic individuals are encouraged for conducting health protocols, such as self-isolation, social distancing, etc., in the presence of global information campaigns. It can be concluded by their findings that non-pharmaceutical interventions strategies should be implemented effectively to reduce disease burden in India, by decreasing basic reproduction number below unity. Awareness through the internet and social media platforms should be propagated continuously by the health authorities/government officials for hospitalization of symptomatic individuals and quarantine of asymptomatic individuals to control the prevalence of disease in India.
The main target of social media advertisements is to minimize the disease prevalence by disseminating accurate and reliable information about the disease to create awareness about its transmission and prevention, clear all misconceptions, and induce behavioral changes at the individual level. However, word-of-mouth communication (local awareness) is the best way of disseminating information and imparting knowledge to the fraction of population who depend on neighbors or community members rather than social media and internet. Aware people make others aware through communication, besides protecting themselves from the disease. Agaba et al. [35] investigated an SIRS model for infectious diseases which considers behavioral changes through the distribution of awareness in the population in two ways: private awareness associated with direct contacts between unaware and aware populations, and public information campaign. Recently, Tiwari et al. [36] formulated a model representing the interplay between dissemination of awareness at local and global levels, and prevalence of disease. A comparison between the effects of local and global awareness suggests more effectiveness of the latter one in controlling the disease.
Motivated by the works of [30, 35, 36], in this paper, we study the control of COVID-19 pandemic by creating awareness among populations at local and global levels by extending the work of Rai et al. [34] and Srivastav et al. [30]. Our model is different from models considered in [30, 34], in the following sense.
Srivastav et al. [30] have investigated the impacts of frequent use of face mask on the prevalence of coronavirus pandemic in India, and Rai et al. [34] proposed a mathematical model to assess the impact of social media advertisements on the transmission dynamics of COVID-19 pandemic in India, whereas in the present paper, we investigate to what extent the global information campaigns stemming from social media together with local awareness arising from interaction between unaware susceptible and aware people affect the dynamics of COVID-19 pandemic in India.
In Srivastav et al. [30], it is assumed that the continuous and correct use of face mask reduces the disease transmission and in Rai et al. [34], it is assumed that the broadcasting through social media advertisements changes the public perception and behavior toward the disease and they avoid their contacts with symptomatic/asymptomatic individuals by forming a separate aware class, which is fully protected from COVID-19. On the other hand, in the present study, we consider two different aware classes, viz. highly active aware individuals such as healthcare workers, educated people, and less active aware individuals such as uneducated people, careless people; both can join exposed class as they are also vulnerable to asymptomatic infection but lower than the unaware susceptible individuals.
In Srivastav et al. [30], it is assumed that the recovered individuals do not acquire infection again, while medical reports suggest that the recovered individuals may also get infection via losing their immunity as time flows and become susceptible for the disease [34, 44].
In the present study, the broadcasted global information (through social media, internet) is assumed to have limited impact on asymptomatic individuals for conducting health protocols, such as self-isolation and social distancing, whereas in [34], it is assumed to follow bilinear interaction.
The rest of the paper is organized in the following way. In the next section, we propose our model for the impacts of local and global awareness on the transmission dynamics of COVID-19 pandemic in India. In the following section, we analyze the model. We discuss positivity and boundedness of model solutions and obtain system’s equilibria and study their stability property. Expression for the basic reproduction number is derived by using the approach of next generation matrix. In Sect. 4, we simulate our model. We estimate some epidemiologically important parameters by using the least square method. Sensitivity analysis explores the importance of model parameters in controlling the spread of COVID-19. Finally, in Sect. 5, we mention main findings of the paper.
The mathematical model
In a region under consideration, let N be the total number of human population at any instant of time . We divide the total human population into nine disjoint classes: the susceptible individuals S, the exposed individuals E, the symptomatic individuals , the asymptomatic individuals , the quarantined asymptomatic individuals Q, the highly active aware individuals , the less active aware individuals , the hospitalized individuals H and the recovered individuals R. Further, let M be the cumulative number of social media advertisements which include internet information as well as TV, radio and print media. All dynamic variables are described in Table 1.
Table 1.
Descriptions of variables used in the model system (1)
| Variables | Descriptions | Units |
|---|---|---|
| S(t) | Number of susceptible individuals | Persons |
| E(t) | Number of exposed individuals | Persons |
| Number of symptomatic individuals | Persons | |
| Number of asymptomatic individuals | Persons | |
| Q(t) | Number of home quarantined asymptomatic individuals | Persons |
| Number of highly active aware individuals such as | Persons | |
| healthcare workers, educated people | ||
| Number of less active aware individuals such as | Persons | |
| uneducated people, careless people | ||
| H(t) | Number of hospitalized individuals | Persons |
| R(t) | Number of recovered individuals | persons |
| M(t) | Cumulative number of social media advertisements | ads. |
For developing the mathematical model, we make the following assumptions:
The susceptible class has a constant recruitment rate , and all the recruited individuals are susceptible and unaware of the disease.
The population is homogeneously mixed, and the disease spreads through the direct contact of unaware susceptibles with symptomatic and asymptomatic infected individuals and added to exposed class following the law of mass action.
A fraction of exposed individuals shows clinical symptoms and joins the symptomatic class, while the remaining join the asymptomatic class. As time flows, some of the asymptomatic individuals join the symptomatic class by developing clinical symptoms of COVID-19.
- During a disease outbreak, information propagated in public regarding preventive measures is at the following two different levels:
- Global information campaigns through social media, TV, radio (cost-effective and responsive medium in remote areas), internet and other awareness programs conducted by media and health authorities.
- Local awareness through word-of-mouth, i.e., interpersonal and mobile phone communications among acquaintances and in the local community.
The broadcasting of global information is proportional to symptomatic infection. Following [37], we assume that the growth rate of advertisements is a decreasing function of aware population in the region. The reason behind such consideration is the involvement of cost in broadcasting the information.
Depletion in the cumulative number of advertisements is also incorporated in the model as information broadcasted in public loses their effect with time. Moreover, a baseline number of social media advertisements is always maintained in the region.
Information changes the public attitudes and behavior toward the disease. They respond to it and adopt non-pharmaceutical interventions that are requisite for disease prevention such as wearing a face mask, having social distancing, proper sanitation, frequent hand washing to weaken their susceptibility.
The unaware susceptible individuals join the highly active and less active aware classes by becoming aware through local awareness or global awareness or both. The individuals in highly active aware class possess the knowledge of avoiding disease transmission and further implementing the prevention mechanisms. The information broadcasted through social media, TV, and internet has limited impact to modify the behaviors of unaware susceptible individuals [37].
The individuals in highly and less active aware classes may lose awareness with the passage of time and become susceptible again at constant rates and , respectively.
The asymptomatic infected compartment also contains individuals showing mild symptoms of the disease but are not recognized as COVID-19 infected. Therefore, highly active and less active aware individuals are also vulnerable to asymptomatic infection but at lower rates than the unaware susceptible individuals and join the exposed class. The rate of disease transmission is higher for less active aware individuals than that of highly active aware individuals.
The infected individuals with symptoms are admitted to hospitals, at a rate , while in the presence of global information campaigns, the individuals in the asymptomatic class move to the quarantined compartment at the rate . The global information is broadcasted through social media, TV, and internet, having a limited impact to encourage the asymptomatic individuals for conducting health protocols, such as self-isolation and social distancing. The hospitalized compartment also includes symptomatic individuals who are self-isolated at home under medical observation.
The hospitalized and quarantine individuals recovered from COVID-19 through proper treatment or naturally by their bodily immune power at a rate and , respectively, and join the recovered class. The individuals in recovered class become unaware susceptible again at a rate by losing their immunity with time. There is natural mortality in each class, whereas the symptomatic and hospitalized individuals can proceed to severe complications of COVID-19 and experience COVID-19 induced mortality at a rate and , respectively.
Based on these assumptions, we present a schematic diagram as depicted in Fig. 1, and the resulting model equations are obtained as follows:
| 1 |
Initial conditions for analyzing system (1) are taken to be positive values. In particular, the broadcasting of information through the platforms of social media starts at the level . All the parameters utilized in system (1) are assumed to be constants and have positive values. The epidemiological meanings of the parameters involved in system (1) are given in Tables 2 and 3.
Fig. 1.

Schematic diagram of the system (1). Here, the mathematical terms in red color represent the impact of social media advertisements in modifying human behavior; the outward arrows indicate the death of individuals in different classes of human population that includes natural death of human population and their COVID-19-induced death
Table 2.
Descriptions of parameters involved in the system (1)
| Parameters | Descriptions | Units |
|---|---|---|
| Immigration into the class of susceptible population | person day | |
| Contact rate of susceptible with symptomatic individuals | person day | |
| Contact rate of susceptible with asymptomatic individuals | person day | |
| Rate of incubation | day | |
| Fraction of exposed individuals showing clinical symptoms | – | |
| Rate of transfer of asymptomatic individuals to symptomatic class | day | |
| Fraction which represents efficacy of information campaigns to reduce transmission rate among highly active aware and asymptomatic individuals | – | |
| Fraction which represents efficacy of information campaigns to reduce transmission rate among less active aware people and asymptomatic individuals | – | |
| Contact rate of less active aware people with asymptomatic individuals | person day | |
| Rate of hospitalization of symptomatic individuals | day | |
| Quarantine rate of asymptomatic individuals in the presence of global information campaigns | day | |
| q | Half saturation constant | Ads. |
| Recovery rate of quarantine individuals | day | |
| Dissemination rate of awareness among susceptible individuals at community level in presence of global information campaigns | day | |
| p | Half saturation constant | Ads. |
| Fraction of susceptible individuals which are highly aware in the presence of global information campaigns | – | |
| Rate of dissemination of awareness at individual level due to word-of-mouth communication | person day |
Table 3.
Descriptions of parameters involved in the system (1)
| Parameters | Descriptions | Units |
|---|---|---|
| Fraction of susceptible individuals which are highly aware due to word-of-mouth communication | – | |
| Rate of transfer of highly active aware individuals to susceptible class | day | |
| Rate of transfer of less active aware individuals to susceptible class | day | |
| Recovery rate of hospitalized individuals | day | |
| COVID-19 induced death rate of symptomatic individuals | day | |
| COVID-19 induced death rate of hospitalized individuals | ||
| Rate of transfer of recovered individuals to susceptible class due to immunity loss | day | |
| d | Natural death rate of human population | day |
| r | Growth rate of broadcasting of information | ads. person day |
| Decay in advertisements due to increase in number of aware individuals | – | |
| w | Half saturation constant | persons |
| Diminution rate of advertisements due to inefficacy and psychological barriers | day | |
| Baseline number of social media advertisements | ads. |
Using the fact that , system (1) reduces to the following equivalent system:
| 2 |
Since system (2) is equivalent to system (1), therefore we study the dynamics of system (2) in detail.
Mathematical analysis of system (2)
In population dynamics, boundedness of solutions of a system implies that the system is well behaved. Boundedness of the solutions means that the interacting populations cannot grow exponentially or abruptly for a long-time interval due to limited resources.
Positivity and boundedness of solutions
Following [34, 39], we have the following theorem regarding positivity and boundedness of solutions of the system (2).
Theorem 1
The region of attraction for all solutions of system (2) initiating in the positive quadrant is given by the set:
which is compact and invariant with respect to system (2). The region is closed and bounded in positive cone of ten-dimensional space.
Disease-free equilibrium
For the model system (2), the disease-free equilibrium is
where and are defined below.
In the absence of COVID-19, the fifth and sixth equilibrium equations of the system (2) yield
| 3 |
| 4 |
Solving Eqs. (3) and (4), we can get the positive values of and as and , respectively.
Basic reproduction number
The basic reproduction number () is an index commonly used worldwide by health officials as a key estimator of the severity of a given epidemic. In order to obtain the basic reproduction number () of system (2), we use the next-generation matrix approach [40]. The basic reproduction number is given by , where F and V represent the matrices corresponding to the new infection terms and transition terms of system (2), respectively, and is the spectral radius of the next-generation matrix . From the model system (2), we get the expression for the basic reproduction number as:
| 5 |
The quantity is known as the basic reproduction number, the expected number of secondary cases produced in a completely susceptible population, by a typical infective individual for the system (2).
Remark 1
From the expression of basic reproduction number (), it is evident that the contacts of susceptibles with symptomatic/asymptomatic infected individuals have major roles in boosting the value of . The distributions of awareness among susceptible individuals at the community level in the presence of global information campaigns and also at the individual level due to word-of-mouth communication can have significant impacts on lowering the epidemic threshold. Moreover, the basic reproduction number is inversely proportional to the rate of hospitalization of symptomatic individuals, showing the importance of health facilities in controlling the spread of COVID-19.
The following local stability result of the disease-free equilibrium follows from [40].
Theorem 2
For model system (2), the disease-free equilibrium is locally asymptotically stable if and unstable if .
Endemic equilibrium and its stability
For system (2), an endemic equilibrium is , whose components are positive solutions of the equilibrium equations of system (2).
From the third equilibrium equation of system (2), we have
| 6 |
Using equation (6) in the second equilibrium equation of system (2), we have
| 7 |
where
From the fourth equilibrium equation of system (2), we get
| 8 |
Further, from the eighth equilibrium equation of system (2), and using Eq. (7), we have
| 9 |
Now, from the seventh equilibrium equation of system (2), and using Eqs. (7) and (9), we get
| 10 |
Using Eqs. (8) and (9) in the ninth equilibrium equation of system (2), we have
| 11 |
From the first equilibrium equation of system (2) and using Eqs. (6)–(11), we have
| 12 |
where
Using Eqs. (6)–(12) in the fifth, sixth and seventh equilibrium equations of system (2), we get the following three equations in the model variables , and M:
| 13 |
| 14 |
| 15 |
Solving Eqs. (13)–(15), we can get the positive values of , and M as , and , respectively.
Regarding global stability of the endemic equilibrium , we have the following theorem [45].
Theorem 3
The endemic equilibrium , if feasible, is globally asymptotically stable inside the region of attraction if the following inequalities are satisfied:
| 16 |
| 17 |
| 18 |
| 19 |
| 20 |
| 21 |
| 22 |
| 23 |
| 24 |
| 25 |
| 26 |
| 27 |
| 28 |
| 29 |
| 30 |
| 31 |
| 32 |
| 33 |
where , and are defined in the proof.
Proof
It can be easily proved by considering the following Lyapunov function:
| 34 |
where ’s () are positive constants to be chosen appropriately.
Numerical simulations
We calibrate our model (1) by using cumulative confirmed COVID-19 cases for India. We have taken data for COVID-19 cases from World Health Organization (WHO) situation report for the time period February 01, 2021, to May 22, 2021 [41], as our model assumptions are related to the condition of COVID-19 outbreak in India at that time. During the said period, the infection rate was started to increase rapidly and vaccination was not much available in the country. So, we have considered the impact of global and local awareness in controlling COVID-19 outbreak. We have formulated our model considering the situation when increasing number of COVID-19-infected individuals indicates lack of treatment, unavailability of vaccination, failure of preventive measures (i.e., lockdown measures, unwearing of face masks in a proper way, etc.). That is why, we calibrate the proposed model to fit the data up to May 2021 of COVID-19 cases for India to examine the importance of global information campaigns and local awareness through word-of-mouth communication in controlling the disease outbreak in the absence of proper vaccination. Our system of ten ordinary differential equations has thirty parameters, among them nine key parameters have been estimated by using semi-relative sensitivity analysis [42, 43], namely , , , d, , , a, and r for the COVID-19 model (1) by using the least square method. These nine parameter values and the initial population size play a crucial role in model simulation.
Sensitivity analysis portrays the importance of parameter changes in model output. Following [42], we plot the sensitivity graph by using the code myAD (see Fig. 2). It is noted from Fig. 2 that different parameters impact the symptomatic individuals differently. According to the effect of a parameter, the number of symptomatic individuals increases/decreases. The increment/decrement in symptomatic population depends on the sensitivity of each parameter. Changes in different parameters induce different number of symptomatic individuals. For instance, the number of symptomatic individuals associated with (dissemination rate of awareness among susceptible individuals at community level in the presence of global information campaigns) is unlike the number associated with (rate of dissemination of awareness at individual level due to word-of-mouth communication). To measure the sensitivities from the figures, we compute the sensitivity coefficient by calculating -norm, which is given by
We pick out the nine most effective parameters , , , d, , , a, and r (in descending order) to the least ones (see Fig. 3) by comparing and ranking the sensitivity function, which indicates that rest of the model parameters are not much sensitive with respect to the symptomatic infected population; thus, they will not affect the dynamics of our COVID-19 model.
Fig. 2.

Semi-relative sensitivities of the symptomatic infected population with respect to model parameters using automatic differentiation. The observation window is [0, 400], and the sensitivity of a parameter is identified by the maximum deviation of the state variable (along y-axis), and it also identifies the time intervals when the system is most sensitive to such changes. Parameters are at the same values as in Table 4
Fig. 3.
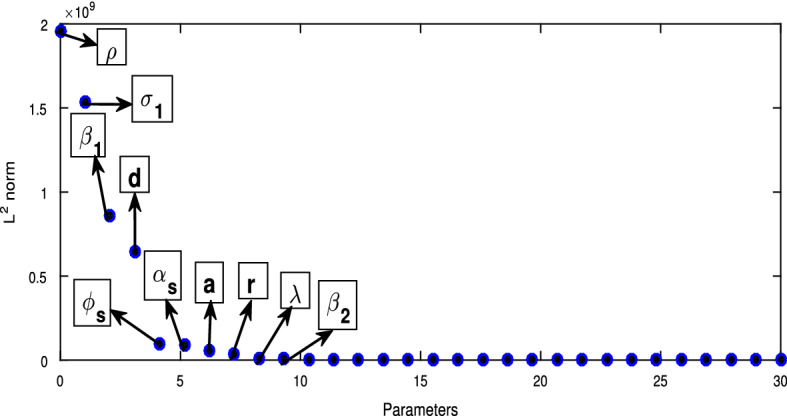
Sensitivity quantification by calculating sensitivity coefficient through norm
A parameter is known as practically identifiable if an individual estimate can be determined from various initial conditions utilizing the available data. We define Fisher’s information matrix , where S is the normalized sensitivity function matrix calculated by automatic differentiation [42]. It can be noticed that the m parameters are said to be locally identifiable if and only if the column rank of the matrix S is equal to m, or equivalently . After that, we execute the QR factorization method with the column pivoting in the MATLAB routine qr, . This method find out matrix P such that (QR is the factorization of FP). The indices in the first k columns of P identify the most estimable k parameters. In our study, , , , d, , , a, and r are the model parameters that are most estimable from the real COVID-19 data. We have estimated the most sensitive parameters by using the least square method, after identifying them. The values of these parameters are provided in Table 4. We have estimated the data for 111 days (from February 01, 2021, to May 22, 2021). The model fitting is shown in Fig. 4. From the figure, we see that the active COVID-19 cases are increasing in the said period. The increasing number of COVID-19-infected individuals indicates lack of medical facilities, failure of lockdown measures, unwearing of face masks in a proper way, etc. This calls for urgent need of vaccines, proper maintenance of lockdowns, sufficient health facilities, etc. In such a difficult situation, global and local awareness can help to control the increasing infection by making people aware of taking all the preventive measures including vaccination, and by encouraging them to maintain all the health protocols of COVID-19 outbreak.
Table 4.
Values of the parameters in system (1) used for numerical simulation
| Parameters | Values | Sources | Parameters | Values | Sources |
|---|---|---|---|---|---|
| 25,000 | Assumed | b | 0.02 | Assumed | |
| 0.0001 | Estimated | 0.00000085 | Estimated | ||
| 0.0015 | Estimated | c | 0.003 | Assumed | |
| 0.000086 | Estimated | 0.04 | Assumed | ||
| a | 0.001 | Estimated | 0.008 | [37] | |
| 0.01 | [34] | 1/14 | [38] | ||
| 0.01 | Assumed | 0.005 | Estimated | ||
| 0.008 | Assumed | 0.00145 | [34] | ||
| 0.001 | Assumed | 0.05 | [34] | ||
| 0.025 | Estimated | d | 0.3518 10 | Estimated | |
| 0.2 | [34] | r | 0.006 | Estimated | |
| q | 400 | Assumed | 0.0005 | [37] | |
| 0.002 | [34] | w | 60 | [37] | |
| 0.012 | [37] | 0.005 | [37] | ||
| p | 12,000 | Assumed | 500 | [37] |
Fig. 4.
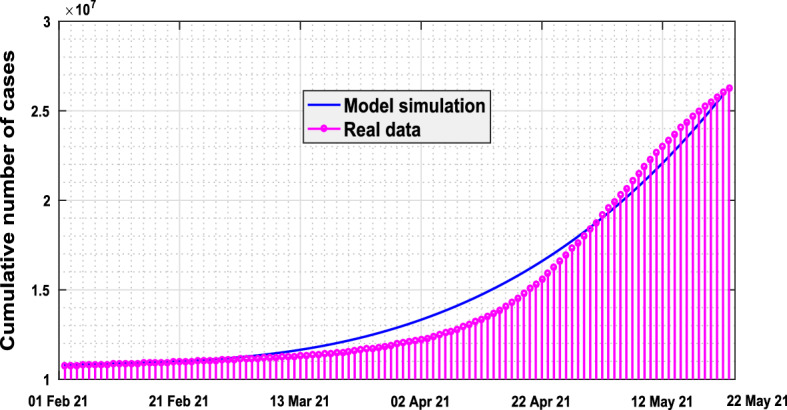
Plots of the output of the fitted model (1) and the observed active coronavirus cases for India during period February 01, 2021, to May 22, 2021. Here, the magenta dotted line shows real data points, and the blue line stands for solution of model (1). The figure shows that the cumulative number of active COVID-19 cases increases exponentially as time progresses
In Fig. 5, the symptomatic individuals have been plotted for different values of three important parameters: , and . We plot the symptomatic individuals by varying quarantine rate of asymptomatic individuals in the presence of global information campaigns (i.e., ) in Fig. 5a. We observe that the number of symptomatic individuals reduces with the increased value of . Thus, it is evident that quarantine of asymptomatic individuals, following health protocols (self-isolation, social distancing, etc.) in the presence of global information campaigning, is very useful in controlling the COVID-19 outbreak. Moreover, in Fig. 5b, we see huge effect of hospitalization rate of symptomatic individuals on the symptomatic population, where symptomatic population reduces with the increase of hospitalization rate . The symptomatic infected population is at higher equilibrium level when the rate of hospitalization is low. Figure 5c indicates that raising awareness about COVID-19 at individual level in the presence of word-of-mouth communication greatly reduces the symptomatic infections in India. In the absence of local awareness, the symptomatic infected population is at higher equilibrium level. We observe that high rate of quarantine of asymptomatic individuals and hospitalization of symptomatic individuals together with continuous propagation of local and global awareness among susceptible population have potential to suppress the burden of COVID-19 in India.
Fig. 5.

Variation of symptomatic individuals () with respect to time for different values of a , b and (c) . Rest of the parameters are at the same values as in Table 4 except in a , , , b, c ,
We also plot the equilibrium values of symptomatic individuals by varying two parameters at a time, viz. , , , , , , , and , in Fig. 6 to be more clear about the impacts of these model parameters. In these contour plots, the contour lines represent the equilibrium values of symptomatic individuals. It is clear that contact rate of susceptible with asymptomatic individuals (), rate of transfer of highly active aware individuals to susceptible class , rate of transfer of less active aware individuals to susceptible class , diminution rate of advertisements due to inefficacy (), immigration in class of susceptible population , contact rate of susceptible with symptomatic individuals (), rate of incubation and rate of transfer of asymptomatic individuals to symptomatic class have positive impacts on symptomatic population as increases with increments in these parameters. On the other hand, symptomatic infection can be controlled by increasing quarantine rate of asymptomatic individuals in the presence of global information campaigns , rate of dissemination of awareness at individual level in the presence of word-of-mouth communication , baseline number of social media advertisements (), growth rate of broadcasting the information (r), dissemination rate of awareness among susceptible individuals at community level in the presence of global information campaigns , rate of hospitalization of symptomatic individuals , recovery rate of quarantine individuals , fraction representing efficacy of information campaigns to reduce transmission rate among highly active aware and asymptomatic individuals and fraction representing efficacy of information campaigns to reduce transmission rate among less active aware and asymptomatic individuals .
Fig. 6.

Contour lines representing the equilibrium values of symptomatic individuals () as functions of a and , b and , c and , d r and , e and p, f and , g and , h and , and i and . Rest of the parameters are at the same values as in Table 4 except in a, c, e , , , , (b) , , d, f, g, h, i , ,
The statement of Theorem 3 is numerically illustrated in Fig. 7 by showing the global stability of the endemic equilibrium inside the region of attraction in ––M and S–Q–H spaces. Figure 7a represents that all the solution trajectories that originate inside the region of attraction approach the point . Also, it is observed from Fig. 7b that all the solution trajectories originating inside the region of attraction converge to the point . The global asymptotic stability of the endemic equilibrium in other spaces can also be shown by applying this approach.
Fig. 7.

Global stability of the endemic equilibrium of system (2) in a ––M and b S–Q–H spaces. Parameters are at the same values as in Table 4 except in a , , , , and b , ,
Conclusion
In this study, we have proposed a mathematical model to understand the transmission dynamics of COVID-19 in India. Our goal was to see the impacts of the global information distributing from social media together with local awareness coming from mouth-to-mouth communication between unaware susceptible and aware people on the control of COVID-19. Global and local awareness make people aware of the proper use of face masks, proper sanitation, frequent hand washing to weaken their susceptibility, social distancing, hospitalization of symptomatic individuals, quarantine of asymptomatic individuals and maintaining other health protocols. Information changes the public attitudes and behavior toward the disease. However, word-of-mouth communication (local awareness) is the best way of distributing information to the people who depend on neighbors or community members rather than social media and internet. Aware people make others aware through communication, besides protecting themselves from the disease. Sophisticated techniques of sensitivity analysis are employed to determine the impacts of model parameters on transmission dynamics and symptomatic infected individuals. Numerical simulation shows importance of awareness-related parameters to curtail the burden of COVID-19. Our study focuses on the outbreak of COVID-19 in India, and hence, we have used the data set of the high incidences of COVID-19 in India. The data set is for the cumulative active cases of the disease. Our proposed model is then fitted to the data set. Our findings suggest that quarantine of asymptomatic individuals, following health protocols (self-isolation, social distancing, etc.) in the presence of global information campaigning, is very useful in reducing the number of symptomatic individuals and burden of COVID-19. Moreover, we see great impact of hospitalization of symptomatic individuals on the symptomatic population, and symptomatic population decreases when the rate of dissemination of awareness increases. Therefore, the global awareness together with local awareness has a great impact to control the disease outbreak in India.
Until the medical health care facilities and biomedical interventions (vaccination) are not available at the proportionate level to curtail the burden of COVID-19, media can play a vital role at the initial stage of epidemic outbreaks, whereas during adverse time when infective cases were increasing rapidly, medical healthcare facilities were not able to manage the burden of COVID-19. In that context, public attitude and behaviors to adopt non-pharmaceutical interventions such as wearing face mask, having social distancing, proper sanitation, frequent hand washing, strict lockdown measures in hotspots, educational institutions arranged online classes, etc., played significant role in managing the burden of COVID-19 pandemic to some extent. In order to manage the future course of pandemic, media plays a very crucial role to disseminate accurate and reliable information to public regarding benefits of early vaccination, clear all existing myths, misconceptions, and induce behavioral changes at the individual level. Furthermore, healthcare workers/educated people can encourage the uneducated/careless people (who depend on neighbors or community members rather than social media and internet) through word-of-mouth communication to adopt non-pharmaceutical interventions and go for early vaccination to hinder rapid spread of infection in future course of coronavirus pandemic in India. Our study suggests that the government officials/policy makers must focus on rapid vaccination and sufficient availability of medical oxygen (essential medicine in treatment of COVID-19). Furthermore, vaccination campaigns should be implemented not only in urban medical hospitals but also easily accessible with the help of medical healthcare workers to rural areas so that rapid spread of COVID-19 cases can be managed in future course of pandemic in India.
To further extrapolate the results of this study, further extension of our model system might be worth investigating. We can extend the current model by incorporating vaccination together with awareness of COVID-19. Awareness plays an important role in encouraging individuals to get vaccinated. Thus, it would be interesting to examine the impacts of awareness and vaccination in controlling COVID-19 outbreak.
Acknowledgements
The authors express their gratitude to the reviewer whose comments and suggestions have helped the improvements of this paper.
Funding
Rabindra Kumar Gupta is thankful to UGC Nepal for partial financial support in the form of “PhD Fellowship and Research Support” (No. PhD/76-77 S&T-17).
Data availability
All data generated or analyzed during this study are included in this article.
Declarations
Conflict of interest
The authors declare that there is no conflict of interests regarding the publication of this article.
Ethical approval
The authors state that this research complies with ethical standards.
Human or animals rights
This research does not involve either human participants or animals.
Contributor Information
Pankaj Kumar Tiwari, Email: pktiwari.math@iiitbh.ac.in.
Rajanish Kumar Rai, Email: rajanishrai94@gmail.com.
Subhas Khajanchi, Email: subhaskhajanchi@gmail.com.
Rabindra Kumar Gupta, Email: gupta.rabindra04@gmail.com.
Arvind Kumar Misra, Email: akmisra@bhu.ac.in.
References
- 1.WHO, World Health Organization, coronavirus disease (COVID-19) pandemic. https://www.who.int/emergencies/diseases/novel-coronavirus-2019 (2020)
- 2.K. Harris, Tracking the global impact of the coronavirus outbreak, Bain Macro Trends group analysis. https://www.bain.com/insights/tracking-the-global-impact-of-the-coronavirus-outbreak-snap-chart/ (2020)
- 3.Chang X, Liu M, Jin Z, Wang J. Studying on the impact of media coverage on the spread of COVID-19 in Hubei Province. China. Math. Biosci. Eng. 2020;17(4):3147–3159. doi: 10.3934/mbe.2020178. [DOI] [PubMed] [Google Scholar]
- 4.Misra AK, Rai RK. A mathematical model for the control of infectious diseases: effects of TV and radio advertisements. Int. J. Bifurc. Chaos. 2018;28(03):1850037. doi: 10.1142/S0218127418500372. [DOI] [Google Scholar]
- 5.Misra AK, Rai RK. Impacts of TV and radio advertisements on the dynamics of an infectious disease: a modeling study. Math. Meth. Appl. Sci. 2019;42(4):1262–1282. doi: 10.1002/mma.5438. [DOI] [Google Scholar]
- 6.Joshi H, Lenhart S, Albright K, Gipson K. Modeling the effect of information campaigns on the HIV epidemic in Uganda. Math. Biosci. Eng. 2008;5(4):557–570. doi: 10.3934/mbe.2008.5.757. [DOI] [PubMed] [Google Scholar]
- 7.Liu R, Wu J, Zhu H. Media/psychological impact on multiple outbreaks of emerging infectious diseases. Comput. Math. Methods Med. 2007;8(3):153–164. doi: 10.1080/17486700701425870. [DOI] [Google Scholar]
- 8.Nyabadza F, Chiyaka C, Mukandavire Z, Hove-Musekwa SD. Analysis of an HIV/AIDS model with public-health information campaigns and individual withdrawal. J. Biol. Syst. 2010;18(20):357–375. doi: 10.1142/S0218339010003329. [DOI] [Google Scholar]
- 9.Funk S, Gilad E, Watkins C, Jansen VAA. The spread of awareness and its impact on epidemic outbreaks. Proc. Natl. Acad. Sci. USA. 2009;106(16):6872–6877. doi: 10.1073/pnas.0810762106. [DOI] [PMC free article] [PubMed] [Google Scholar]
- 10.Misra AK, Sharma A, Shukla JB. Modeling and analysis of effects of awareness programs by media on the spread of infectious diseases. Math. Comput. Model. 2011;53:1221–1228. doi: 10.1016/j.mcm.2010.12.005. [DOI] [Google Scholar]
- 11.Liu Y, Cui J. The impact of media coverage on the dynamics of infectious diseases. Int. J. Biomath. 2008;01(01):65–74. doi: 10.1142/S1793524508000023. [DOI] [Google Scholar]
- 12.Kiss IZ, Cassell J, Recker M, Simon PL. The impact of information transmission on epidemic outbreaks. Math. Biosci. 2010;255:1–10. doi: 10.1016/j.mbs.2009.11.009. [DOI] [PubMed] [Google Scholar]
- 13.Misra AK, Sharma A, Singh V. Effect of awareness programs in controlling the prevalence of an epidemic with time delay. J. Biol. Syst. 2011;19(02):389–402. doi: 10.1142/S0218339011004020. [DOI] [Google Scholar]
- 14.Samanta S, Rana S, Sharma A, Misra AK, Chattopadhyay J. Effect of awareness programs by media on the epidemic outbreaks: a mathematical model. Appl. Math. Comput. 2013;219(12):6965–6977. [Google Scholar]
- 15.WHO. Coronavirus disease (covid-19) outbreak. https://www.who.int/emergencies/diseases/novel-coronavirus-2019 (2020)
- 16.Huang C, Wang Y, Li X, et al. Clinical features of patients infected with 2019 novel coronavirus in Wuhan, China. Lancet. 2020;395(10223):497–506. doi: 10.1016/S0140-6736(20)30183-5. [DOI] [PMC free article] [PubMed] [Google Scholar]
- 17.Gralinski LE, Menachery VD. Return of the coronavirus: 2019-nCoV. Viruses. 2020;12(2):135. doi: 10.3390/v12020135. [DOI] [PMC free article] [PubMed] [Google Scholar]
- 18.Centers for disease control and prevention: 2019 novel coronavirus. https://www.cdc.gov/coronavirus/2019-ncov (2020)
- 19.J.F.-W. Chan, S. Yuan, K.-H. Kok et al., A familial cluster of pneumonia associated with the 2019 novel coronavirus indicating person-to-person transmission: a study of a family cluster. Lancet 395(10223), 514–523 (2020) [DOI] [PMC free article] [PubMed]
- 20.Gowrisankar A, Rondoni L, Banerjee S. Can India develop herd immunity against COVID-19? Eur. Phys. J. Plus. 2020;135:526. doi: 10.1140/epjp/s13360-020-00531-4. [DOI] [PMC free article] [PubMed] [Google Scholar]
- 21.S. Khajanchi, K. Sarkar, J. Mondal, Dynamics of the COVID-19 pandemic in India. arXiv preprint arXiv:2005.06286 (2020)
- 22.Khajanchi S, Sarkar K. Forecasting the daily and cumulative number of cases for the COVID-19 pandemic in India. Chaos. 2020;30:071101. doi: 10.1063/5.0016240. [DOI] [PMC free article] [PubMed] [Google Scholar]
- 23.Sarkar K, Khajanchi S, Nieto JJ. Modeling and forecasting of the COVID-19 pandemic in India. Chaos Solit. Fract. 2020;139:110049. doi: 10.1016/j.chaos.2020.110049. [DOI] [PMC free article] [PubMed] [Google Scholar]
- 24.Khajanchi S, Sarkar K, Mondal J, Nisar KS, Abdelwahab SF. Mathematical modeling of the COVID-19 outbreak with intervention strategies. Results Phys. 2021;25:104285. doi: 10.1016/j.rinp.2021.104285. [DOI] [PMC free article] [PubMed] [Google Scholar]
- 25.Sardar T, Nadim SS, Rana S, Chattopadhyay J. Assesment of lockdown effect in some states and overall India: a predictive mathematical study on COVID-19 outbreak. Chaos Solit. Fract. 2020;139:110078. doi: 10.1016/j.chaos.2020.110078. [DOI] [PMC free article] [PubMed] [Google Scholar]
- 26.Srivastav AK, Ghosh M, Bandekar SR. Modeling of COVID-19 with limited public health resources: a comparative study of three most affected countries. Eur. Phys. J. Plus. 2021;136:359. doi: 10.1140/epjp/s13360-021-01333-y. [DOI] [PMC free article] [PubMed] [Google Scholar]
- 27.Kavitha C, Gowrisankar A, Banerjee S. The second and third waves in India: when will the pandemic be culminated? Eur. Phys. J. Plus. 2021;136:596. doi: 10.1140/epjp/s13360-021-01586-7. [DOI] [PMC free article] [PubMed] [Google Scholar]
- 28.Olaniyi S, Obabiyi OS, Okosun KO, Oladipo AT, Adewale SO. Mathematical modelling and optimal cost-effective control of COVID-19 transmission dynamics. Eur. Phys. J. Plus. 2020;135:938. doi: 10.1140/epjp/s13360-020-00954-z. [DOI] [PMC free article] [PubMed] [Google Scholar]
- 29.Nadim SS, Chattopadyay J. Occurrence of backward bifurcation and prediction of disease transmission with imperfect lockdown: a case study on COVID-19. Chaos Solit. Fract. 2020;140:110163. doi: 10.1016/j.chaos.2020.110163. [DOI] [PMC free article] [PubMed] [Google Scholar]
- 30.Srivastav AK, Tiwari PK, Srivastava PK, Ghosh M, Kang Y. A mathematical model for the impacts of face mask, hospitalization and quarantine on the dynamics of COVID-19 in India: deterministic vs stochastic. Math. Biosci. Eng. 2021;18(1):182–213. doi: 10.3934/mbe.2021010. [DOI] [PubMed] [Google Scholar]
- 31.S. Ghosh, A. Senapati, J. Chattopadyay, S.K. Dana, C. Hens, D. Ghosh, Reservoir computing on epidemic spreading: a case study on COVID-19 cases. Phys. Rev. E 104, 014308 (2021) [DOI] [PubMed]
- 32.Senapati A, Rana S, Das T, Chattopadyay J. Impact of intervention on the spread of COVID-19 in India: a model based study. J. Theor. Biol. 2021;523:110711. doi: 10.1016/j.jtbi.2021.110711. [DOI] [PMC free article] [PubMed] [Google Scholar]
- 33.Nadim SS, Ghosh I, Chattopadyay J. Short-term predictions and prevention strategies for COVID-19: a model-based study. Appl. Math. Comput. 2021;404:126251. doi: 10.1016/j.amc.2021.126251. [DOI] [PMC free article] [PubMed] [Google Scholar]
- 34.Rai RK, Khajanchi S, Tiwari PK, Venturino E, Misra AK. Impact of social media advertisements on the transmission dynamics of COVID-19 pandemic in India. J. Appl. Math. Comput. 2021 doi: 10.1007/s12190-021-01507-y. [DOI] [PMC free article] [PubMed] [Google Scholar]
- 35.Agaba GO, Kyrychko YN, Blyuss KB. Mathematical model for the impact of awareness on the dynamics of infectious diseases. Math. Biosci. 2017;286:22–30. doi: 10.1016/j.mbs.2017.01.009. [DOI] [PubMed] [Google Scholar]
- 36.Tiwari PK, Rai RK, Misra AK, Chattopadhyay J. Dynamics of infectious diseases: local versus global awareness. Int. J. Bifurc. Chaos. 2021;31(7):2150102. doi: 10.1142/S0218127421501029. [DOI] [Google Scholar]
- 37.Misra AK, Rai RK, Takeuchi Y. Modeling the control of infectious diseases: effects of TV and social media advertisements. Math. Biosci. Eng. 2018;15(6):1315–1343. doi: 10.3934/mbe.2018061. [DOI] [PubMed] [Google Scholar]
- 38.Tang B, Wang X, Li Q, et al. Estimation of the transmission risk of the 2019-nCoV and its implication for public health interventions. J. Clin. Med. 2020;9(2):462. doi: 10.3390/jcm9020462. [DOI] [PMC free article] [PubMed] [Google Scholar]
- 39.H.I. Freedman, J.W.-H. So, Global stability and persistence of simple food chains. Math. Biosci. 76, 69–86 (1985)
- 40.van den Driessche P, Watmough J. Reproduction numbers and sub-threshold endemic equilibria for compartmental models of disease transmission. Math. Biosci. 2002;180:29–48. doi: 10.1016/S0025-5564(02)00108-6. [DOI] [PubMed] [Google Scholar]
- 41.World Health Organization, Situation report. https://www.who.int/emergencies/diseases/novelcoronavirus-2019/situation-reports (2021)
- 42.M. Fink, myAD: fast automatic differentiation code in Matlab. https://se.mathworks.com/ matlabcentral/fileexchange/15235-automatic-differentiation-for-matlab (2006)
- 43.Banerjee S, Khajanchi S, Chaudhuri S. A mathematical model to elucidate brain tumor abrogation by immunotherapy with T11 target structure. PLoS ONE. 2015;10(5):0123611. doi: 10.1371/journal.pone.0123611. [DOI] [PMC free article] [PubMed] [Google Scholar]
- 44.Covid positive again over a month after recovery–Delhi cop’s case leaves experts puzzled. https://theprint.in/health/covid-positive-again-over-a-month-after-recovery-delhi-cops-case-leaves experts-puzzled/468485/ (2020)
- 45.J. LaSalle, The Stability of Dynamical Systems, in Regional Conference Series in Applied Mathematics. SIAM, Philadelphia (1976)
Associated Data
This section collects any data citations, data availability statements, or supplementary materials included in this article.
Data Availability Statement
All data generated or analyzed during this study are included in this article.