

Abstract
Background:
Electronic health record (EHR) data is commonly used for secondary purposes such as research and clinical decision support. However, reuse of EHR data presents several challenges including but not limited to identifying all diagnoses associated with a patient’s clinical encounter. The purpose of this study was to assess the feasibility of developing a schema to identify and subclassify all structured diagnosis codes for a patient encounter.
Methods:
To develop a subclassification schema we used EHR data from an interhospital transport data repository that contained complete hospital encounter level data. Eight discrete data sources containing structured diagnosis codes were identified. Diagnosis codes were normalized using the Unified Medical Language System and additional EHR data were combined with standardized terminologies to create and validate the subcategories. We then employed random forest to assess the usefulness of the new subcategorized diagnoses to predict post-interhospital transfer mortality by building 2 models, one using standard diagnosis codes, and one using the new subcategorized diagnosis codes.
Results:
Six subcategories of diagnoses were identified and validated. The subcategories included: primary or admitting diagnoses (10%), past medical, surgical or social history (9%), problem list (20%), comorbidity (24%), discharge diagnoses (6%), and unmapped diagnoses (31%). The subcategorized model outperformed the standard model, achieving a training AUROC of 0.97 versus 0.95 and testing model AUROC of 0.81 versus 0.46.
Discussion:
Our work demonstrates that merging structured diagnosis codes with additional EHR data and secondary data sources provides additional information to understand the role of diagnosis throughout a clinical encounter and improves predictive model performance. Further work is necessary to assess if subcategorizing produces benefits in interpreting the results of prognostic models and/or operationalizing the results in clinical decision support applications.
Keywords: electronic health records, data management, electronic data processing, machine learning
1. Introduction
Electronic health records (EHR) are widely available to support both clinical activities and secondary research efforts. Of particular interest is the ability to easily access and reuse EHR data to support clinical practice.1 Current efforts include developing near real-time decision support systems or tracking performance metrics,2,3 and more broadly working towards the goal of achieving a fully functioning learning health system that uses clinically generated data to inform practice and improve outcomes.4,5 However, the reuse of EHR data for secondary purposes is slow due to the considerable amount of time and resources required to analyze, validate and repurpose the data for its intended use.6
There are multiple challenges to developing clinical decision support7 and reusing EHR data for secondary purposes have been widely documented,8,9 with particular attention on the preprocessing of the data to make it usable.10,11 An example is the challenge of identifying and using diagnosis codes to identify patients and their associated problems that either lead to the particular encounter of interest and/or problems that may have occurred during the encounter. The potential for inaccurate diagnosis codes has been documented in administrative data sources generally,12 and within EHRs specifically.8,13 Prior work has also identified disparate levels of completeness and accuracy of problem lists, comprised of individual diagnosis codes, with varying levels of completeness depending on the clinical setting (e.g., inpatient or outpatient).14–16
While most work has focused on identifying and validating diagnosis codes that are present in the EHR for a given patient and associated encounter, less attention is given to accurately classifying diagnosis codes to add additional information beyond mere presence. For example, there are significant clinical differences between admitting diagnoses, problems that arise during the encounter and final discharge diagnoses. Studies that combined diagnoses from multiple locations within the EHR (e.g., encounter/billing, problem lists, medical and or surgical history) reported the highest levels of completeness, even outperforming the gold standard of manual record review.17,18
The goal of this work is to develop a clinical decision support system to identify if a patient should be moved, and by which mode of transport based on clinical data and post-transfer outcomes. For example, identifying patients that benefit from rapid transfer by helicopter, and conversely, those that can be transferred via less expensive ambulance transfer, will provide new information not currently available to guide clinical decisions. Therefore, to support initial development of a data driven interhospital transfer prediction model and improve the identification and usability of diagnosis codes beyond mere presence in a patient encounter, we sought to subclassify all structured diagnosis codes associated with a patient’s hospital encounter. We then assessed the utility of this new subclassification method by comparing prognostic models, one with subcategorized diagnoses and one without, to identify the most significant variables that contribute to patient mortality post-interhospital transfer.
2. Methods
2.1. Study design
This was a retrospective study that leveraged data from an existing data repository containing records from one large academic health system in the United States. The study was approved by the participating institutions IRBs (#14–1556 and #20180346). The data repository contains the EHR records originating from all potential sources (e.g., inpatient, outpatient, and lab), and for all patients within the health system that underwent interhospital transfer from one health system hospital to another. Therefore, the target population for this study were patients that underwent interhospital transfer, using data from the pre-transfer hospital encounter. All patients with a pre-transfer health system encounter between 2010–2017 were included.
2.2. Data sources
To gain a complete accounting of the patient and associated diagnosis codes for the hospital encounter, we identified every EHR source that contained structured diagnosis codes. The structured data sources consisted of tables that contained the patient ID, encounter ID, date of diagnosis, the diagnosis code (e.g., ICD9, ICD10, CPT), if the diagnosis was indicated as a primary diagnosis, the entry order of the diagnosis in the EHR list, and whether the diagnosis was present on admission, from the following EHR sources: encounter, hospital admission, problem list, transaction, billing, account receivable, surgical history, and social history. The diagnosis codes were mapped to the Unified Medical Language System (UMLS) unique concept identifier and associated concept description. A fuller description of the data extraction and normalization process using UMLS can be found here.19
2.3. Data preprocessing
The first step consisted of mapping each data source to (UMLS)20 identifiers to aid in data standardization and processing between other terminologies.21 We included all sources of structured diagnoses, including clinical and administrative sources, to identify all available codes for a patient encounter. Due to the potential for duplicate diagnosis codes between clinical and administrative sources, we separated the data into clinical sources: encounter, final diagnosis, hospital admission, problem list, social history and surgical history, and administrative sources: accounts receivable, billing, and transactions. In cases where a diagnosis code appeared in both sources, only the clinically assigned diagnosis was maintained. The final diagnosis codes were then classified into distinct subcategories based on linking the diagnosis with additional variables that were present in the clinical data sources. The diagnosis subcategories and associated data sources and rules used to generate each diagnosis subcategory are presented in Figure 1. For example, as indicated in the rules box in Figure 1, to identify comorbidities we identified diagnoses not indicated as a primary diagnosis and used the approach developed by Epstein and Dexter22 that matches the ICD9/10 diagnosis codes to the Elixhauser comorbidity index23 to identify all comorbidities. We identified additional problem lists codes for codes that did not originate from the problem list data source by mapping the SNOMED CT Core Problem List subset (version: January 2019).24 Lastly, all diagnoses from the surgical and social history data sources were validated according to the rules in Figure 1 and assigned to the general category: history.
Figure 1.
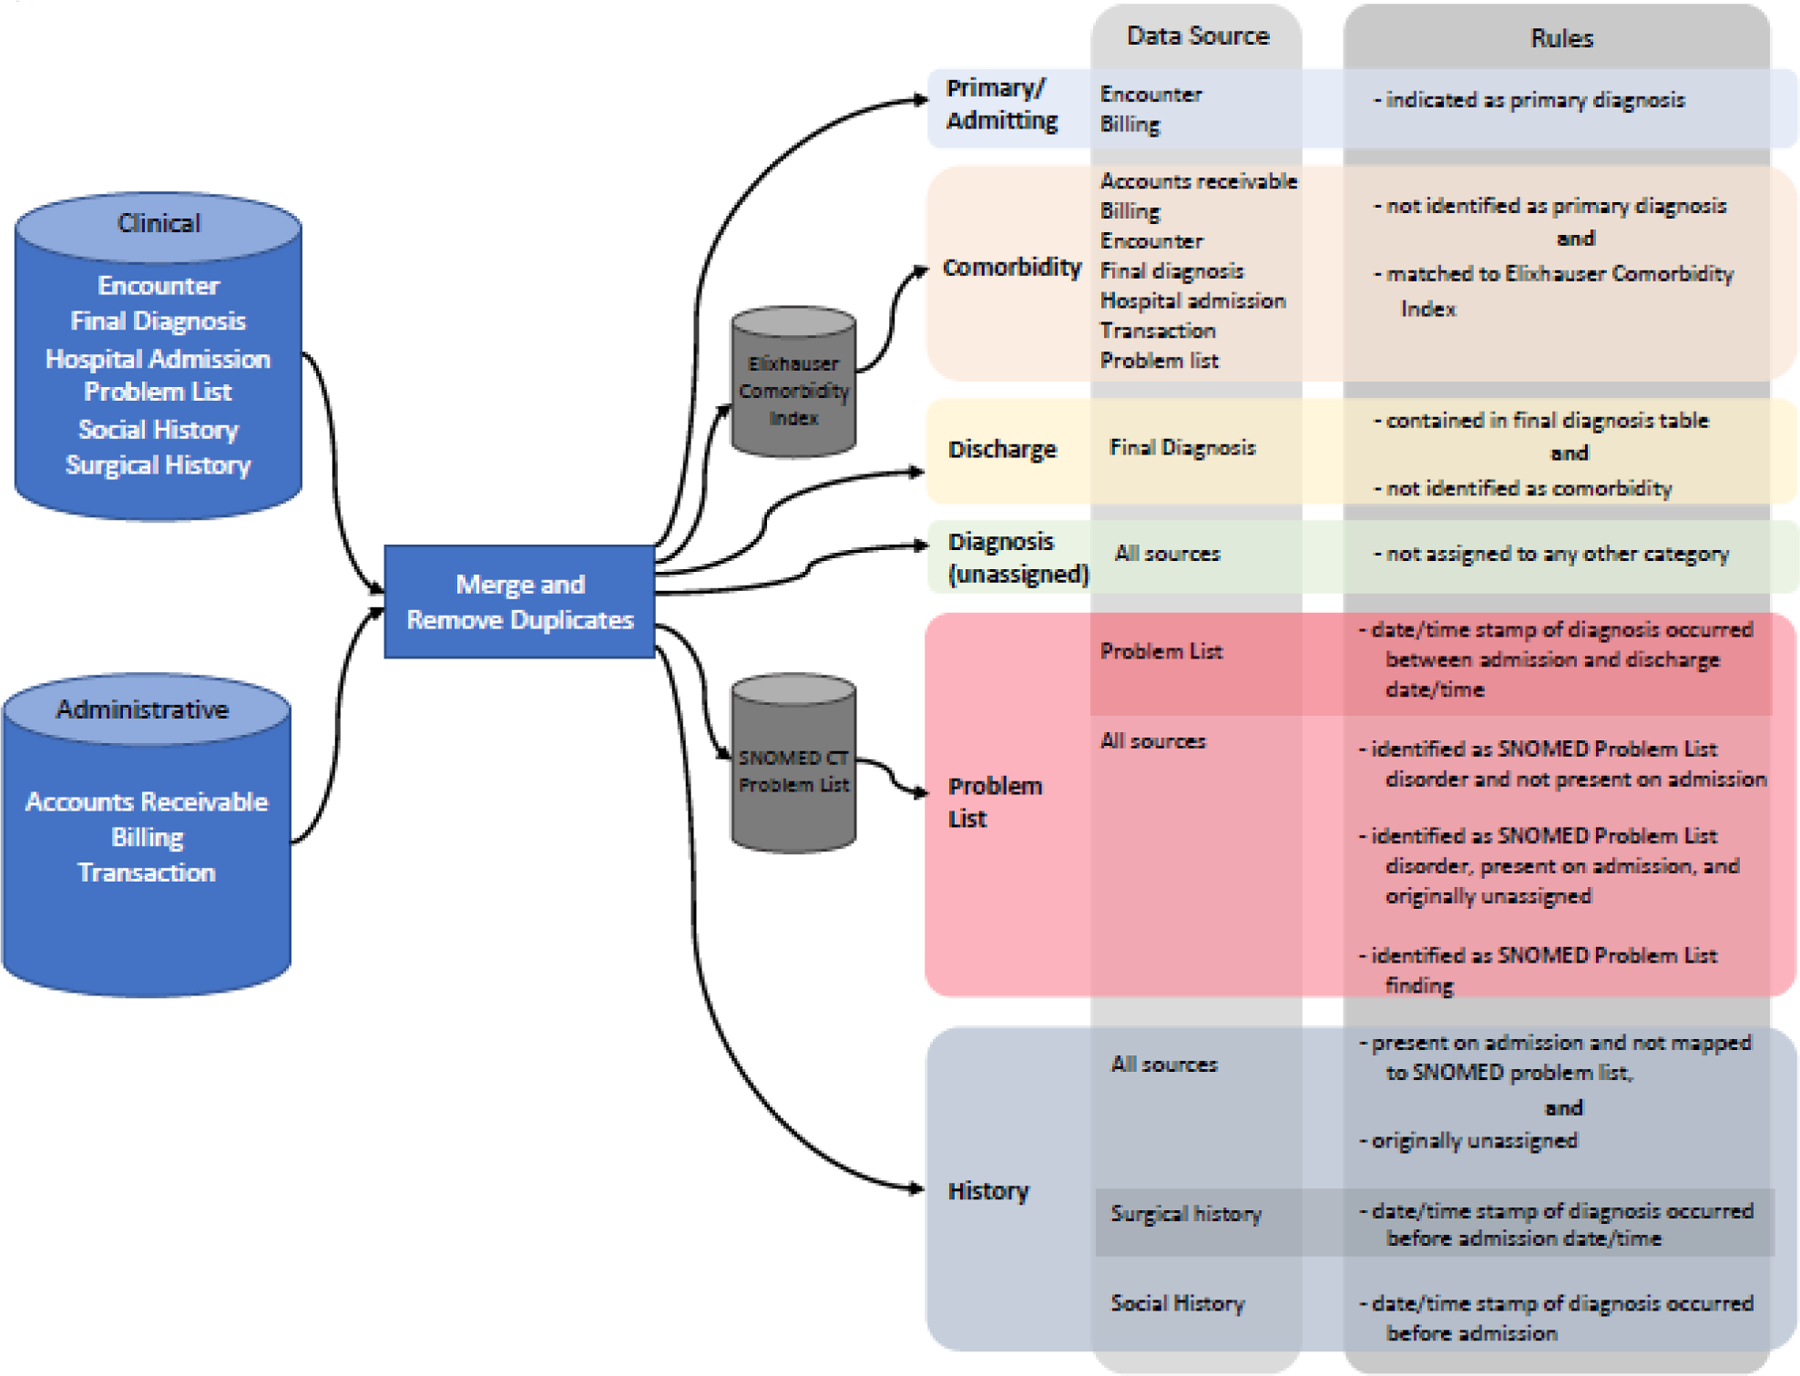
Diagnosis subcategories, data sources and rules
2.4. Statistical Analysis
We approached the statistical analysis from a data discovery perspective and included all EHR data available for analysis. Due to the high dimensional data and large number of diagnosis codes in a patient encounter, we employed random forest (RF) to aid in variable reduction and selection by assessing the variable importance of predicting death versus hospital discharge. We independently assessed each diagnostic subcategory via RF. We visually examined the variable importance Scree plot for each subcategory to identify an elbow point where the variable importance levels off indicating minimal variable importance contribution. Using the elbow point of a Scree plot as a cut point is a common practice in variable selection that has been shown to lead to consistent variable selections,25,26 thus enabling us to balance the total number of predictors with additional reduction in out-of-bag error.27 For the subcategorized diagnosis model, the tradeoff between continued variable inclusion and reducing model error resulted in including the following number of variables by importance: 25 primary diagnoses, 80 discharge diagnoses, 30 unclassified diagnoses, 20 comorbidities, 20 history diagnoses, and 20 problem lists diagnoses. Additionally, the first 30 most important medications were included. Demographic variables included: age (continuous), gender, ethnicity, race, marital status, insurance type, receiving unit post transfer, and mode of transport. To compare to the subcategorized model, we created a standard model that contains diagnoses that were not subcategorized. We completed the same variable reduction process resulting in including the same demographics, medications, laboratory results and 15 diagnosis codes. The random forest model parameters used the Gini impurity criterion with bootstrapping and the out-of-bag score for 200–1,000 iterations and 5-fold cross validation. Due the overall sample being unbalanced because of a low post-transfer mortality rate, we employed an equal probability weighting approach and set the class weight to 1:1 to better balance the sample. Preprocessing of data was completed using R version 3.6.3 and modelling was completed using Python version 3.6.6 and packages NumPY version 1.14.5, Pandas version 0.23.4 and scikit-learn version 0.23.1 were used to conduct all statistical analyses.
3. Results
3.1. Diagnosis subcategories
There was a total of 253,121 diagnosis codes for 10,569 patients across 11,413 encounters. In the subcategorized model, 6 subcategories of diagnoses were identified and validated by including additional data to validate the assigned subcategory. The validated subcategories included: primary or admitting diagnoses (26,491; 10%), past medical, surgical or social history (22,117; 9%), current problem list (50,735; 20%), comorbidity (60,875; 24%), and discharge diagnoses (13,976; 6%). A majority of the unmapped diagnosis codes originated from the billing data source (78,927; 31%).
To test if subcategorizing diagnosis codes yielded differences in variable selection or model performance, we ran independent RF analyses, the first with uncategorized diagnosis variables (standard model), the second with subcategorized variables. Model performance statistics are presented in Table 1, indicating that the subcategorized diagnosis codes improve predictive model performance when compared to the standard model.
Table 1.
Model Performance Statistics
| Standard (uncategorized) | Training | 0.95 | 0.74 | 0.95 | 0.98 |
| Testing | 0.46 | 0.06 | 0.93 | 0.91 | |
| Subcategorized | Training | 0.97 | 0.85 | 0.95 | 0.98 |
| Testing | 0.81 | 0.45 | 0.91 | 0.94 |
AUROC = area under the receiver operator curve
3.2. Subcategorized model
The subcategorized model contained 290 variables, results by variable category type are presented in Figure 2A. Assessing the top 100 variables by importance, laboratory results were a majority at 28, followed by demographics at 19, 11 general diagnoses in the unassigned category, 10 comorbid conditions, 9 problem lists diagnoses, 6 primary or admitting diagnoses, 4 history diagnoses, and 3 discharge diagnoses. Laboratory values dominated the first 32 variables with the exception of age as the 5th most important, a primary diagnosis of cardiac arrest in the 8th position, and respiratory failure noted on the problem list in 30th position. Table 2 lists the diagnoses in order of importance in predicting death within each subcategory.
Figure 2A.
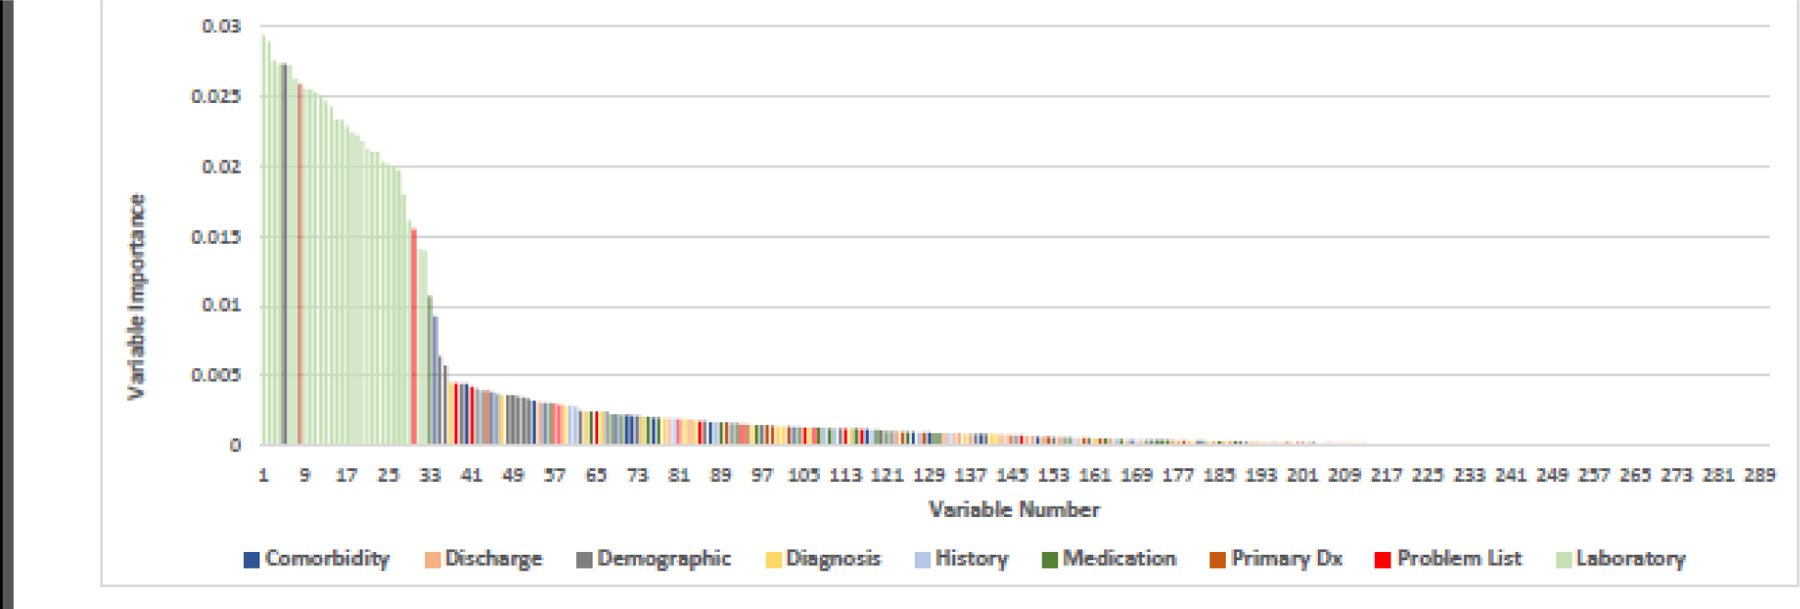
Random Forest variable importance plot by diagnosis subcategory: all variables
Table 2.
Diagnosis by subcategory in descending order of variable importance predicting death via random forest
| Age | Cardiac Arrest | Acidosis | Abnormal coagulation profile | Other alteration of consciousness | Acute respiratory failure | Platelets | Vasopressin | Cardiac arrest, cause unspecified |
| Helicopter transport | Cerebral Hemorrhage | Congestive heart failure | Coronary atherosclerosis of native coronary artery | Long-term (current) use of other medications | Hypotension | Erythrocyte distribution width | Gentian Violet | DNR - Do not resuscitate |
| Ground transport | Subarachnoid hemorrhage | Essential Hypertension | Atherosclerotic heart disease of native coronary artery without angina pectoris | Encounter due to tobacco use | Atrial Fibrillation | Neutrophils/100 leukocytes:Number Fraction | Ipratropium Bromide | Acute respiratory failure |
| Insurance: unspecified | Acute myocardial infarction | Altered mental status, unspecified | Acute kidney failure with lesion of tubular necrosis | Kidney Failure, Acute | Kidney Failure, Acute | Leukocytes:Number Concentration | Methylprednisolone | |
| Race: Black African American | Pneumonia | Anemia | Abnormal electrocardiogram | Dyspnea | Albumin | Intravenous | ||
| Race: Caucasian | Chronic airway obstruction | Chronic kidney disease, stage 3 (moderate) | Other abnormal blood chemistry | Hypokalemia | Hemoglobin | Levetiracetam | ||
| Marital Status: Widow | Chronic Kidney Diseases | Encounter due to postsurgical aortocoronary bypass | Chest Pain | Erythrocyte mean corpuscular volume | Lactulose | |||
| Insurance: Medicare | Coagulation defects, other and unspecified | Other malaise and fatigue | Cerebral infarction | Alkaline phosphatase | Dextromethorphan / Guaifenesin | |||
| Marital Status: Unmarried | Paroxysmal ventricular tachycardia | Encounter for other specified counseling | Feces contents abnormal | Creatinine | Lisinopril | |||
| Sex: Female | Rheumatoid Arthritis | Other abnormal glucose | Glucose: serum | cefepime | ||||
| Marital status: Married | Erythrocyte (MCHC) | |||||||
| Sex: Male | Monocytes/100 leukocytes | |||||||
| Marital Status: Divorced | Neutrophils | |||||||
| Insurance: Private | Alanine aminotransferase | |||||||
| Insurance: Medicaid | Protein | |||||||
| Transport: not specified | Bilirubin | |||||||
| Ethnicity: Unknown | Anion gap | |||||||
| Ethnicity: Not Hispanic or Latino | Urea nitrogen | |||||||
| International normalized ratio | ||||||||
| Carbon dioxide | ||||||||
| Calcium | ||||||||
| Potassium | ||||||||
| Glucose: test stripe | ||||||||
| Chloride | ||||||||
| Sodium | ||||||||
| Eosinophils | ||||||||
| Troponin T.cardiac | ||||||||
| Basophils/100 leukocytes | ||||||||
| Basophils:Number Concentration |
3.3. Standard model
The standard model without subcategorized diagnoses contained 112 variables, results are presented in Figure 2B. Laboratory results remained in the top 33 variables with the addition of cardiac arrest as the first variable, age 4th, acute respiratory failure 17th, and the medication vasopressin 31st. The majority of the diagnoses were represented between 34–58th positions, with the remaining variables were distributed between demographics and medications. Only six variables were included in the standard model that were not included in the subcategorized model, 5 diagnoses and 1 demographic. In order of importance, the diagnoses were: 1) septicemia, 2) thrombocytopenia, 3) hypoxemia, 4) severe sepsis, and 5) acute respiratory failure with hypoxemia; and the demographic variable: transport method – unknown. Figures 3A and 3B present the top 50 variables of the subcategorized model and the standard model respectively.
Figure 2B.
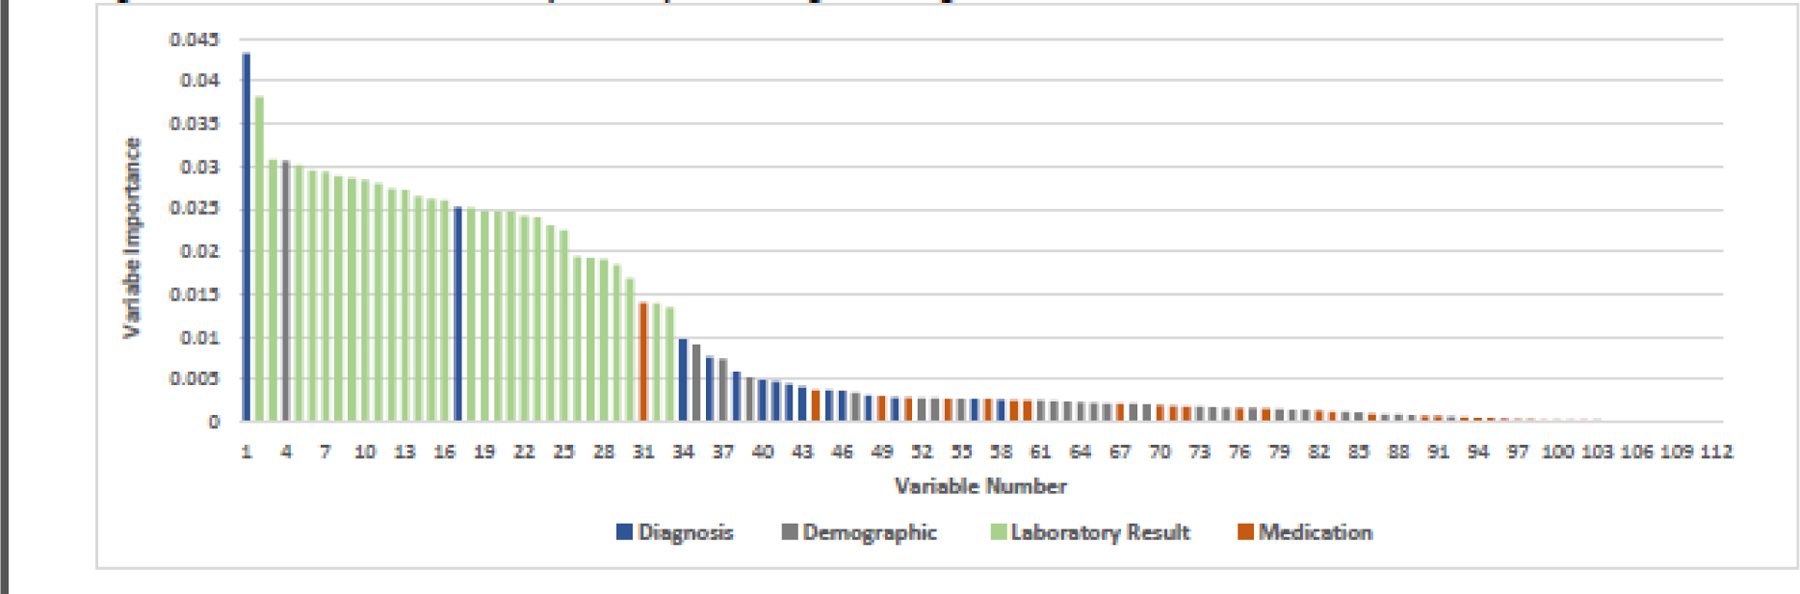
Random Forest variable importance plot: uncategorized diagnosis data
Figure 3A.
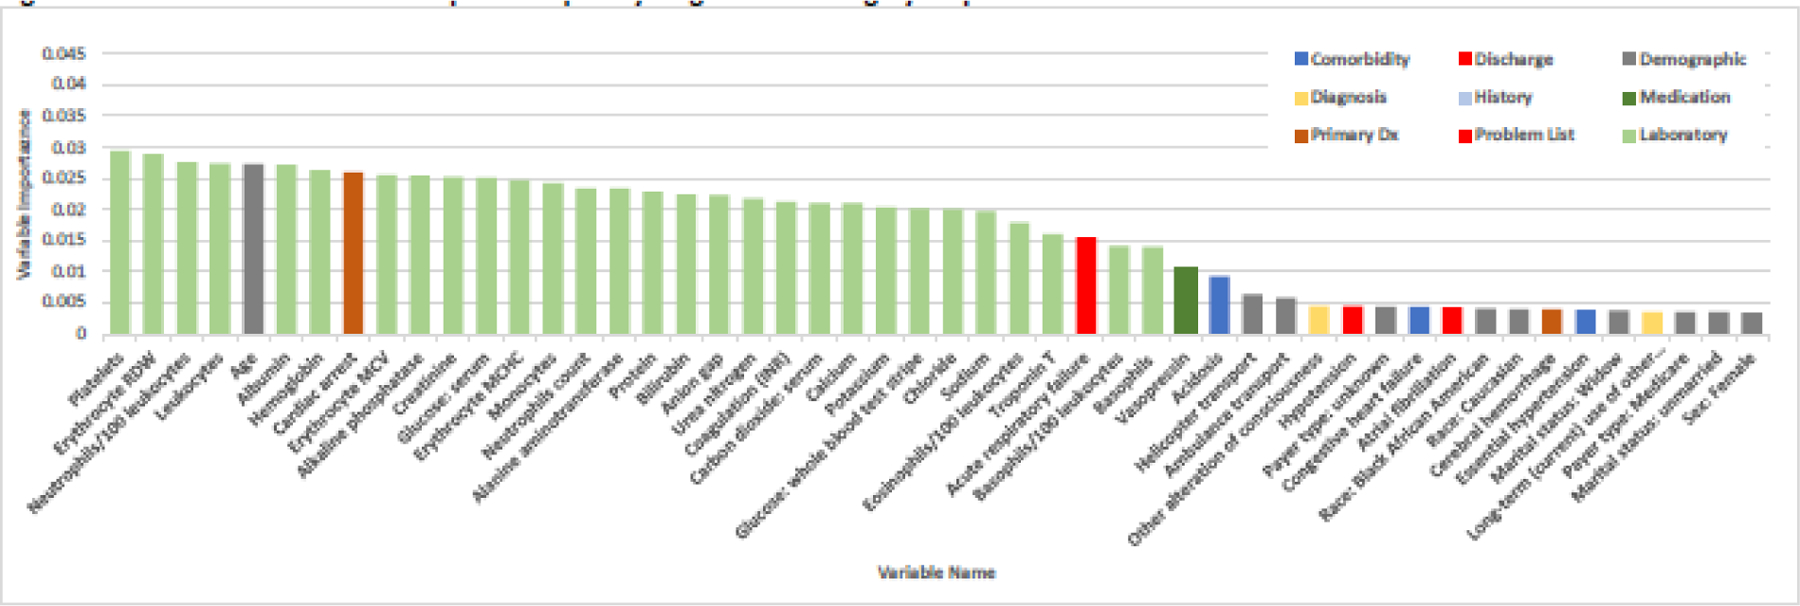
Random Forest variable importance plot by diagnosis subcategory: top 50 variables
Figure 3B.
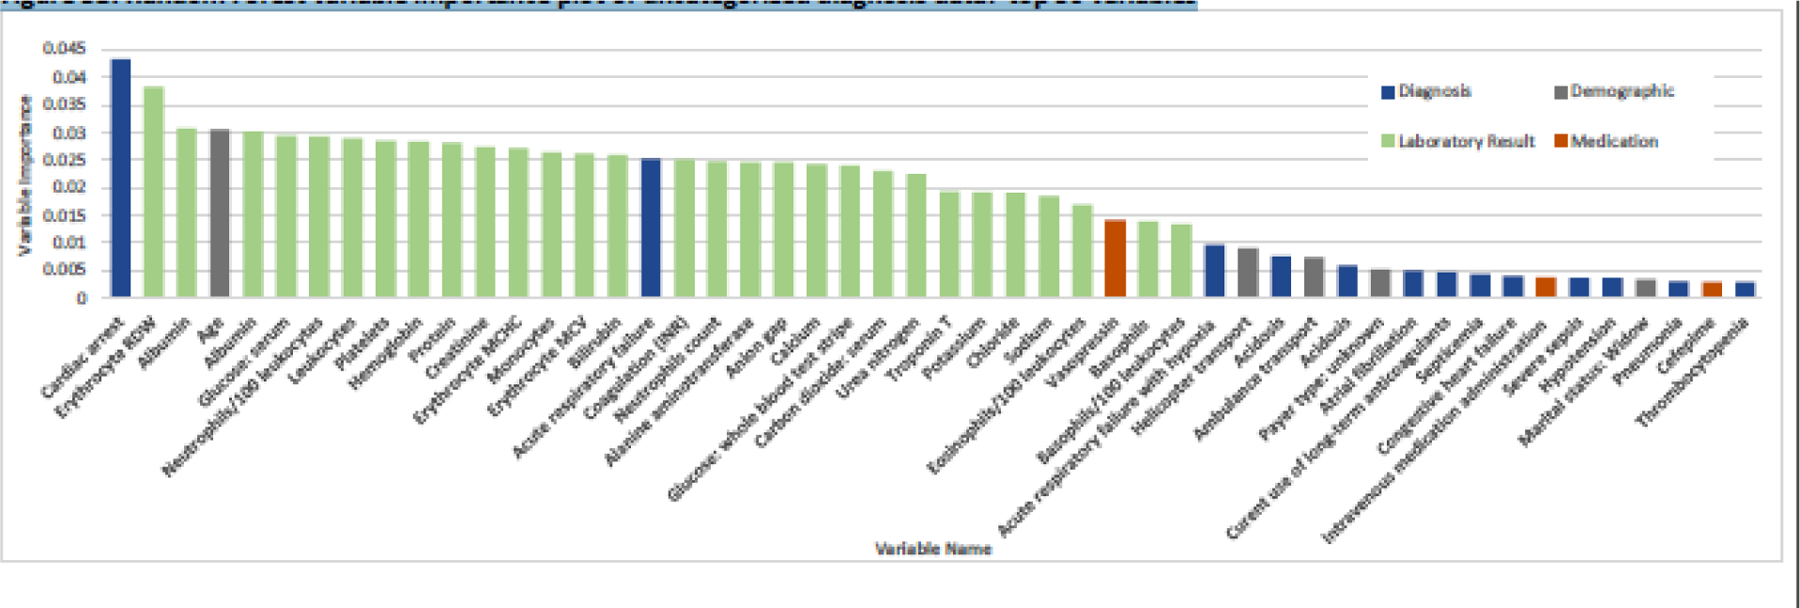
Random Forest variable importance plot of uncategorized diagnosis data: top 50 variables
4. Discussion
Our study examined the potential usefulness of subcategorizing diagnosis codes within the context of prognostic model building using structured EHR data. Our results indicated that identifying and subcategorizing diagnosis codes is possible using currently available data standards and terminologies. Further, we achieved subcategorizing the diagnosis codes by using existing data sources that included the SNOMED CT Core Problem List and Elixhauser Comorbidity Index. Compared to other, more developmentally intensive approaches that rely on developing complex custom ontologies,28,29 our approach employs a simple relational database design that can be applied in any setting or application.
Machine learning approaches are now frequently employed to develop prognostic models using EHR data. The primary goal of this study was to assess the usefulness of subcategorizing structured diagnosis codes in building a predictive model. Based on our model performance statistics, subcategorized diagnosis codes outperformed discrete diagnosis codes. While our model used EHR data from the sending hospital encounter, similar efforts from Heincelman et al.32 and Dunn et al.33 used the earliest data available upon admission at the receiving hospital after interhospital transfer to predict mortality that included demographics, diagnoses, lab values and vital signs, achieving AUROCs of 0.88 and 0.84 respectively. Further, Dunn et al. reported sensitivity and specificity of 0.56 and 0.93 and an accuracy of 0.89. With the exception of sensitivity in the training data model, our model performance is similar. Lastly, Hond et al.34 developed a model to predict need for hospital admission for emergency patients and employed random forest, achieving an AUROC of 0.86.
We applied the same model building procedure to each model using RF to reduce the number of total variables in each category, leading to a difference in the variables included in each final model. While the training model AUROC was similar for both models, a primary difference in variable selection was the inclusion of the same diagnosis code more than one time in the subcategorized model (e.g., respiratory failure can be included both on the problem list and as a discharge diagnosis). While subcategorized diagnoses do provide a more granular level of detail, it does decrease the overall breadth of variables included. Therefore, depending on the intended application of the model, the tradeoff between using more specific subcategorized clinical variables versus using general diagnosis codes within an informative presence30 paradigm, should be considered.
The additional information provided by subcategorizing the diagnosis codes provides several implications for future informatics work. First, the added context of temporality added by the subcategorization is demonstrated by several examples. The assignment of primary diagnosis identifies the reason for admission. It also enabled differentiating diagnoses contained in the problem list as a new clinical problem specific to the current encounter, versus an already existing and continuing clinical problem (i.e., comorbidity). Adding temporality of diagnosis codes within a specific clinical encounter provides additional information that can be used in developing clinical phenotypes or individual predictors in prognostic model development.
The second contribution of subcategorized diagnoses is highlighted by the same diagnosis code being present in multiple subcategories. For example, several diagnoses were replicated across diagnosis subcategories. Acute respiratory failure is represented in both the problem list and discharge diagnosis. Clinically, there is a significant difference between patients with persistent respiratory failure and are discharged to a short or long-term care facility, versus those that experience respiratory failure that is subsequently corrected via intervention such as short-term mechanical ventilation and are discharged home without the discharge diagnosis of respiratory failure or need for supportive therapy. The subcategorized diagnoses maintain clinical context and enable assessing clinical progression beyond mere discharge disposition.
A third contribution is exemplified in patients that present with acute respiratory distress, but after initial treatment improve and are no longer experiencing acute distress or progress to respiratory failure. Patients that respond to therapy typically experience different clinical trajectories, often being discharged from the hospital or requiring less intensive therapy or escalation to a higher level of care. Alternatively, the differentiation between those that present with distress and are discharged in failure can represent patients that require a higher level of care such as intensive care unit admission, and pending on their current location, require interhospital medical transfer. Akin to the concept of informative presence,30 patients that are discharged from the sending facility with respiratory failure, likely represent a patient that did not respond to therapy. While not a data element that is commonly recorded in the EHR, unless explicitly stated in unstructured text and thus more difficult to abstract, this clinical progression can be identified and additional data element “failure to respond to therapy,” can be developed. This type of clinical progression can similarly be assessed, and validated, by an increasing frequency of vital sign entries that has been shown to predict clinical deterioration or arrest.31
Previous work has identified best practices for facilitating high levels of completeness in problem lists, with one of those being back propagation of billing diagnoses into the problem lists, while other work has questioned the validity of using problem lists to identify comorbidities to assess total comorbid burden in particular.14,18 We identified all sources of data that include clinical and administrative (i.e., billing) sources and reconciled the two main sources to remove duplicates. While many of the codes present in the administrative data sources were duplicates already contained in the clinical data sources, 31% of the diagnose codes that remained unmapped originated from administrative sources, potentially providing a more complete accounting of the clinical encounter not captured in routine clinical documentation. However, close scrutiny must be given to administratively assigned diagnosis codes and attempts to validate the appropriateness of the administrative diagnosis to account for known potential biases such as upcoding.35
There were several limitations to this work. First, the data used were from only one health system and thus may yield a selection bias for patients that did or did not undergo interhospital transfer. Second, we only employed random forest to demonstrate potential differences in prognostic modeling of a clinical encounter. While building a comprehensive prognostic model was not the goal of this work, testing other approaches such as regression, support vector machines, or neural network analysis are necessary to identify the best modelling approach and may provide additional insights. Lastly, subcategorizing individual diagnosis codes enables the same code to be represented more than once in the model which we addressed by adjusting the correlation threshold to eliminate colinear variables during model building, thus the selection of the same diagnosis subcategorized differently in the final model indicates that additional discrimination is achieved.
Our work demonstrates that merging structured diagnosis codes with additional EHR data and secondary data sources provides useful information to understand the role of diagnosis throughout a clinical encounter and improves predictive model performance as compared to using uncategorized diagnoses. Further work is necessary to assess whether the increased work of subcategorizing diagnoses and the associated additional contextual information that is provided produces benefits in interpreting the results of the prognostic model and/or operationalizing the results in clinical decision support applications.
Summary Points.
Electronic health record data is frequently used for secondary purposes that include developing clinical decision support applications that employ prognostic modeling.
We developed a schema that combined structured diagnosis codes with additional data sources (i.e., SNOMED CT, Elixhauser Comorbidity Index) to create 6 diagnosis subcategories for use in prognostic model development.
Subcategorized diagnosis codes provide additional clinical information that can be used to interpret machine learning model outputs and improves predictive model performance, providing opportunity for further informatics research.
FUNDING
This research was supported by the National Institute of Nursing Research, National Institutes of Health, through Grant R15NR017792. The content is solely the responsibility of the authors and does not necessarily represent the official views of the NIH.
Footnotes
Publisher's Disclaimer: This is a PDF file of an unedited manuscript that has been accepted for publication. As a service to our customers we are providing this early version of the manuscript. The manuscript will undergo copyediting, typesetting, and review of the resulting proof before it is published in its final form. Please note that during the production process errors may be discovered which could affect the content, and all legal disclaimers that apply to the journal pertain.
Competing Interests Statement
The authors have no competing interests to declare.
Data Availability
The data underlying this article can be shared on reasonable request and approvals to the corresponding author.
References
- 1.Schulte F As Coronavirus Strikes, Crucial Data In Electronic Health Records Hard To Harvest. Kaiser Health News; 2020. [Google Scholar]
- 2.Chau A, Ehrenfeld JM. Using real-time clinical decision support to improve performance on perioperative quality and process measures. Anesthesiol Clin. 2011;29(1):57–69. [DOI] [PMC free article] [PubMed] [Google Scholar]
- 3.Zafar HM, Ip IK, Mills AM, Raja AS, Langlotz CP, Khorasani R. Effect of Clinical Decision Support-Generated Report Cards Versus Real-Time Alerts on Primary Care Provider Guideline Adherence for Low Back Pain Outpatient Lumbar Spine MRI Orders. AJR Am J Roentgenol. 2019;212(2):386–394. [DOI] [PubMed] [Google Scholar]
- 4.Eichler HG, Bloechl-Daum B, Broich K, et al. Data Rich, Information Poor: Can We Use Electronic Health Records to Create a Learning Healthcare System for Pharmaceuticals? Clin Pharmacol Ther. 2019;105(4):912–922. [DOI] [PMC free article] [PubMed] [Google Scholar]
- 5.Krumholz HM, Terry SF, Waldstreicher J. Data Acquisition, Curation, and Use for a Continuously Learning Health System. JAMA. 2016;316(16):1669–1670. [DOI] [PubMed] [Google Scholar]
- 6.Edmondson ME, Reimer AP. Challenges Frequently Encountered in the Secondary Use of Electronic Medical Record Data for Research. Comput Inform Nurs. 2020;38(7):338–348. [DOI] [PubMed] [Google Scholar]
- 7.Sittig DF, Wright A, Osheroff JA, et al. Grand challenges in clinical decision support. Journal of biomedical informatics. 2008;41(2):387–392. [DOI] [PMC free article] [PubMed] [Google Scholar]
- 8.Botsis T, Hartvigsen G, Chen F, Weng C. Secondary Use of EHR: Data Quality Issues and Informatics Opportunities. Summit Transl Bioinform. 2010;2010:1–5. [PMC free article] [PubMed] [Google Scholar]
- 9.Reimer AP, Madigan EA. Veracity in big data: How good is good enough. Health Informatics J. 2018:1460458217744369. [DOI] [PubMed] [Google Scholar]
- 10.Ferrao JC, Oliveira MD, Janela F, Martins HM. Preprocessing structured clinical data for predictive modeling and decision support. A roadmap to tackle the challenges. Applied clinical informatics. 2016;7(4):1135–1153. [DOI] [PMC free article] [PubMed] [Google Scholar]
- 11.Kirkendall ES, Ni Y, Lingren T, Leonard M, Hall ES, Melton K. Data Challenges With Real-Time Safety Event Detection And Clinical Decision Support. J Med Internet Res. 2019;21(5):e13047. [DOI] [PMC free article] [PubMed] [Google Scholar]
- 12.Austin PC, Daly PA, Tu JV. A multicenter study of the coding accuracy of hospital discharge administrative data for patients admitted to cardiac care units in Ontario. Am Heart J. 2002;144(2):290–296. [DOI] [PubMed] [Google Scholar]
- 13.Luna D, Franco M, Plaza C, et al. Accuracy of an electronic problem list from primary care providers and specialists. Stud Health Technol Inform. 2013;192:417–421. [PubMed] [Google Scholar]
- 14.Daskivich TJ, Abedi G, Kaplan SH, et al. Electronic health record problem lists: accurate enough for risk adjustment? Am J Manag Care. 2018;24(1):e24–e29. [PubMed] [Google Scholar]
- 15.Hong CS, Atlas SJ, Ashburner JM, et al. Evaluating a Model to Predict Primary Care Physician-Defined Complexity in a Large Academic Primary Care Practice-Based Research Network. J Gen Intern Med. 2015;30(12):1741–1747. [DOI] [PMC free article] [PubMed] [Google Scholar]
- 16.McCoy RG, Tulledge-Scheitel SM, Naessens JM, et al. The Method for Performance Measurement Matters: Diabetes Care Quality as Measured by Administrative Claims and Institutional Registry. Health Serv Res. 2016;51(6):2206–2220. [DOI] [PMC free article] [PubMed] [Google Scholar]
- 17.Martin S, Wagner J, Lupulescu-Mann N, et al. Comparison of EHR-based diagnosis documentation locations to a gold standard for risk stratification in patients with multiple chronic conditions. Applied clinical informatics. 2017;8(3):794–809. [DOI] [PMC free article] [PubMed] [Google Scholar]
- 18.Wright A, McCoy AB, Hickman TT, et al. Problem list completeness in electronic health records: A multi-site study and assessment of success factors. Int J Med Inform. 2015;84(10):784–790. [DOI] [PMC free article] [PubMed] [Google Scholar]
- 19.Reimer AP, Milinovich A. Using UMLS for electronic health data standardization and database design. J Am Med Inform Assoc. 2020;27(10):1520–1528. [DOI] [PMC free article] [PubMed] [Google Scholar]
- 20.Unified Medical Language system (UMLS). https://www.nlm.nih.gov/research/umls/index.html. Accessed August 29, 2019.
- 21.Milinovich A, Kattan MW. Extracting and utilizing electronic health data from Epic for research. Ann Transl Med. 2018;6(3):42. [DOI] [PMC free article] [PubMed] [Google Scholar]
- 22.Epstein RH, Dexter F. Development and validation of a structured query language implementation of the Elixhauser comorbidity index. J Am Med Inform Assoc. 2017;24(4):845–850. [DOI] [PMC free article] [PubMed] [Google Scholar]
- 23.Elixhauser A, Steiner C, Harris DR, Coffey RM. Comorbidity measures for use with administrative data. Medical care. 1998;36(1):8–27. [DOI] [PubMed] [Google Scholar]
- 24.The CORE Problem List Subset of SNOMED CT. https://www.nlm.nih.gov/research/umls/Snomed/core_subset.html. Accessed March, 2019.
- 25.Clarke B, CamiloValdes, Dobra A, Clarke J. A Bayes testing approach to metagenomic profiling in Bacteria. Statistics and Its Interface. 2014;0:1–13. [Google Scholar]
- 26.Clarke B, Clark J. Estimating the proportions in a mixed sample using transcriptomics. Stat Med. 2014;3(1):313–325. [Google Scholar]
- 27.Cutler A, Cutler DR, Stevens JR. Random Forests. In: Zhang C, Ma Y, eds. Ensemble Machine Learning. Boston, MA: Springer; 2012. [Google Scholar]
- 28.Mate S, Kopcke F, Toddenroth D, et al. Ontology-based data integration between clinical and research systems. PloS one. 2015;10(1):e0116656. [DOI] [PMC free article] [PubMed] [Google Scholar]
- 29.Weiler G, Schwarz U, Rauch J, et al. XplOit: An Ontology-Based Data Integration Platform Supporting the Development of Predictive Models for Personalized Medicine. Stud Health Technol Inform. 2018;247:21–25. [PubMed] [Google Scholar]
- 30.Sisk R, Lin L, Sperrin M, et al. Informative presence and observation in routine health data: A review of methodology for clinical risk prediction. J Am Med Inform Assoc. 2021;28(1):155–166. [DOI] [PMC free article] [PubMed] [Google Scholar]
- 31.Collins SA, Cato K, Albers D, et al. Relationship Between Nursing Documentation and Patients’ Mortality. Am J Crit Care. 2013;22(4):306–313. [DOI] [PMC free article] [PubMed] [Google Scholar]
- 32.Heincelman M, Gebregziabher M, Kirkland E, et al. Impact of Patient-Level Characteristics on In-hospital Mortality After Interhospital Transfer to Medicine Services: an Observational Study. J Gen Intern Med. 2020;35(4):1127–1134. [DOI] [PMC free article] [PubMed] [Google Scholar]
- 33.Altieri Dunn SC, Bellon JE, Bilderback A, et al. SafeNET: Initial development and validation of a real-time tool for predicting mortality risk at the time of hospital transfer to a higher level of care. PloS one. 2021;16(2):e0246669. [DOI] [PMC free article] [PubMed] [Google Scholar]
- 34.De Hond A, Raven W, Schinkelshoek L, et al. Machine learning for developing a prediction model of hospital admission of emergency department patients: Hype or hope? Int J Med Inform. 2021;152:104496. [DOI] [PubMed] [Google Scholar]
- 35.O’Malley KJ, Cook KF, Price MD, Wildes KR, Hurdle JF, Ashton CM. Measuring diagnoses: ICD code accuracy. Health Serv Res. 2005;40(5 Pt 2):1620–1639. [DOI] [PMC free article] [PubMed] [Google Scholar]
Associated Data
This section collects any data citations, data availability statements, or supplementary materials included in this article.
Data Availability Statement
The data underlying this article can be shared on reasonable request and approvals to the corresponding author.