

Abstract
Objective
Diversity and equity in medicine remain pivotal to care delivery. Data analysis on sex and racial diversity of pain medicine fellowship trainees and faculty in the United States are scant. We sought to characterize demographic and retention patterns among pain medicine fellows and faculty, who represent the emerging chronic pain management workforce.
Design
cross-sectional retrospective analysis.
Method
We conducted an analysis of data from the American Association of Medical Colleges (AAMC) and the United States Accreditation Council on Graduate Medical Education (ACGME)-approved residency and fellowship training-programs for each year from 2009 through 2019, inclusively. We compared changes in sex, racial/ethnicity composition and retention rates of fellows and faculty in the United States by practice setting.
Results
From 2009 to 2019, there was a 14% increase in the number of ACGME pain fellowship programs. From 2009 to 2019, the ratio of men to women pain fellows ranged from 5:1 to 3.7:1. Compared with their self-identified White peers, Asian (OR 0.44; 95% CI: 0.34–0.58), Black (OR 0.46; 95% CI: 0.30–0.72), and Native American/Alaskan Native (OR 0.26; 95% CI: 0.08–0.80) identifying individuals had significantly lower odds of being a pain fellow, P < 0.05. There was no significant difference in female (OR = 0.4, 95% CI: 0.148-1.09) and Black (OR 0.36; 95% CI: 0.11–1.12) program-directors. Pain-fellow in-state retention was 53%.
Conclusions
The demographics of pain medicine training programs reflect a persistent male vs. female gap with underrepresentation of racial minorities. Further research is needed to elucidate reasons underlying these disparities.
Keywords: Pain Medicine, Diversity, Race, Sex, Fellows, Faculty
Introduction
Diversity in medical training is important to drive excellence in clinical practice and produce a workforce that can address widening inequities in American healthcare [1]. Sex and race are key aspects of physician diversity with significant impact on health equity and access [1, 2]. Despite indications that women represent a growing majority of medical school matriculants, [2] their enrollment into post-graduate fellowship programs remains disproportionate to men [3, 4]. Recent reports imply that there is concordance between female program directorship and female pain fellow matriculation [5, 6]. Efforts to increase the number of women in pain fellowships remain promising as a better understanding of the determinants of their underrepresentation in medicine emerges.
Research examining enrollment rates of racial and ethnic minorities in pain medicine fellowships in the United States is limited. This gap in research is particularly relevant in light of recent evidence demonstrating that minority populations are disproportionately undertreated for chronic pain compared with non-Hispanic Whites [7, 8]. Individuals from underrepresented backgrounds, and those who receive medical training in disadvantaged communities, are more likely to practice medicine in areas where residents are predominantly Black, Latinx/Hispanic, and Native American/Alaskan Native [9, 10]. In addition to serving in marginalized communities, minority physicians are more likely to provide optimal pain care for chronic pain patients presenting to the emergency department, and receiving care from a physician of color is associated with clinically significant reduction in pain [11]. Other reports suggest that implicit bias affects the care received by ethnic and racial minorities [12, 13].
The lack of diversity in pain medicine is part of the broader context of decades-long disparities in medicine [14, 15]. Despite the National Academies’ call to action to foster diversity in the healthcare workforce in its 2004 report, “In the Nation’s Compelling Interest,” little progress has been made in that regard since publication of this important work [16]. Enrollment of Black or African American, Native Americans/Alaskan Native, and Hispanic trainees remains lower than their respective populations in the US Census at nearly all levels of academic medicine [17]. Strategies to increase diversity have lagged behind the widening gaps in representation [14, 17–21]. Although Black and Hispanic persons make up 13.5% and 18.3% of the US population, they account for 4.5% and 4.8% of trainees in academic pain medicine specialty programs, respectively [22]. This discrepancy warrants further exploration in the context of calls for racial equity with emphasis on recruitment and retention of a diverse and inclusive workforce [21, 22].
To gain further insight about diversity as trainees progress through careers in academic pain medicine, this study examines sex and racial demographics at various stages of training. By exploring the underrepresentation of racial minorities in pain medicine in the last decade, this article underscores the plausible intersection of race and sex and its emerging significance to diversity in pain medicine. Racial categories used in this article are based on self-identified race and ethnicity categories of correspondents in various publicly available survey data. Our analysis acknowledges the need for more data on gender diversity as current publicly available datasets have traditionally utilized sex-binary data (male vs. female). We evaluate program characteristics and demographics of program directors. The data indicate potential opportunities to further diversify pain fellowship programs.
Methods
We utilized the Strengthening the Reporting of Observational Studies in Epidemiology (STROBE) reporting statement checklist for this study.
Data Sources
We analyzed data from the American Association of Medical Colleges (AAMC) (https://www.aamc.org/data-reports/students-residents/interactive-data/report-residents/2019/executive-summary), the United States Accreditation Council on Graduate Medical Education (ACGME)-approved residency and fellowship training-program data resource book (https://www.acgme.org/About-Us/Publications-and-Resources/Graduate-Medical-Education-Data-Resource-Book), the American Medical Association Physician Masterfile (https://www.ama-assn.org/practice-management/masterfile/ama-physician-masterfile), and the Fellowship and Residency Electronic Interactive Database (FREIDA) (https://freida.ama-assn.org/).
Study Design and Population
We performed a cross-sectional, retrospective analysis of data from the American Association of Medical Colleges (AAMC) and the United States Accreditation Council on Graduate Medical Education (ACGME)-approved residency and fellowship training programs for each year from 2009 through 2019. We examined sociodemographic variables and pain practice location of pain medicine fellowship trainees. Sex data was available only as male vs. female with no other non-binary gender categories listed. Self-identified race and ethnicity data was available at the beginning of 2012.
Outcome Measures
Racial and ethnic distribution of pain fellows, program directors, and trainees were analyzed using publicly available data in the above listed data sources from 2009 through 2019. Only data for multi-disciplinary pain fellowship programs were collated. Pain medicine residents were defined as a combination of residents in anesthesiology, physical medicine and rehabilitation, emergency medicine, neurology, and psychiatry as these reflect the most common primary specialties for pain physicians in the United States prior to pain fellowship.
To compare performance of pain medicine to other procedural and interventional/or surgical fellowships in terms of rates of representation of Hispanic, Black, and Native Americans trainees, diversity data were obtained and total rates of the above racial groups computed for the following specialties: colorectal surgery, Moh’s surgery, neurosurgery, endovascular surgery, orthopedic surgery, otolaryngology, plastic surgery, plastics integrated, endovascular integrated, vascular interventional surgery, interventional radiology, general surgery, vascular surgery, and urology. Specialties were selected if they have consistently remained competitive in the match (defined by the National Resident Matching Program [NRMP] as filling at least 95% of the positions offered during the respective match period) each year from 2009 to 2019.
State level data included number of pain programs and pain fellows, size of pain division academic faculty, number of academic vs. community programs, number of practicing pain physicians, and US Census region. The academic vs. community programs are categories used by the Fellowship and Residency Electronic Interactive Database (FREIDA), and a list can be found online at https://freida.ama-assn.org/. The race and sex of program directors, number of pain programs and pain fellows, and size of pain division academic faculty were culled from the AAMC, NRMP, Electronic Residency Application Service (ERAS), ACGME, and FREIDA databases. Where this information was not available, the authors directly searched individual program’s online websites and reached out directly via personal communication to the respective program directors.
Statistical Analysis
All data analysis was performed using GraphPad Prism Version 8.0 (San Diego, CA) and SAS software, version 9.4 (Cary, NC). In order to compare the racial and ethnic distributions from the US Census, medical school graduates, residents in specialties aligned with pain medicine fellowship (anesthesiology, physical medicine and rehabilitation, emergency medicine, neurology, and psychiatry), and pain fellowship directors, nonparametric Spearman correlations and Spearman r’s were computed. An alpha of 0.05 was used to designate statistical significance.
Data for the 2018–2109 academic year were used in computation of odds ratios. Two-sided Fischer’s Exact Tests were performed, and odds ratios and 95% confidence intervals were computed to examine relationships between the type of pain fellowship program and race and sex of program director. This also tracked the odds of trainee to program director across the academic pain medicine ladder by self-identified race and ethnicity. Secondary analysis was performed to determine which point in the academic training pathway exerts the most influence on variations in the ethnic/racial distribution of minorities in pain medicine.
Results
The study identified a total of 2,736 US medical school students, 23,815 US residents, 3,256 pain fellows, and 90 program directors. The total number of residents is inclusive of trainees in the specialties of anesthesiology, physical medicine and rehabilitation, emergency medicine, neurology, and psychiatry. These specialties traditionally recruit and train pain physicians in the US (Table 1). Anesthesiology and neurology had the lowest percentages of Black, Hispanic, and Native American trainees (Table 1).
Table 1.
2018–2019 racial and ethnic diversity in the pain medicine specialty programs
| Career level | Non-Hispanic White | Asian | Hispanic* | Black | Native American/Alaskan Native | Other | Unknown |
|---|---|---|---|---|---|---|---|
| n (%) | n (%) | n (%) | n (%) | n (%) | n (%) | n (%) | |
| Anesthesiology (6346) | 2814 (44.3%) | 1102 (17.4%) | 240 (3.8%) | 304 (4.8%) | 18 (0.3%) | 206 (3.2%) | 1662 (26.2%) |
| Physical Medicine & Rehabilitation (1351) | 673 (49.8%) | 271 (20.1%) | 65 (4.8%) | 69 (5.1%) | 6 (0.4%) | 61 (4.5%) | 206 (15.2%) |
| Neurology (2750) | 1054 (38.3%) | 569 (20.7%) | 138 (5.0%) | 94 (3.4%) | 4 (0.1%) | 199 (7.2%) | 692 (25.2%) |
| Emergency Medicine (7461) | 4230 (56.7%) | 735 (9.9%) | 371 (5.0%) | 286 (3.8%) | 16 (0.2%) | 240 (3.2%) | 1583 (21.2%) |
| Psychiatry (5907) | 2460 (41.6%) | 1072 (18.1%) | 337 (5.7%) | 349 (5.9%) | 22 (0.4%) | 290 (4.9%) | 1377 (23.3%) |
| Pain Fellowship (380) | 168 (44.1%) | 101 (26.5%) | 11 (2.9%) | 14 (3.7%) | 1 (0.3%) | 20 (5.2%) | 66 (17.3%) |
| Program Director (90) | 51 (56.7%) | 32 (35.6%) | 4 (4.4%) | 3 (3.3%) | 0 (0) | 0 (0) | 0 (0) |
Hispanic is an ethnic, not a racial, category.
Of the 104 pain fellowship programs in 2018–2019, 90 programs participated in the NRMP match or had publicly available data. The number of pain fellowship programs steadily rose from 91 in 2009–2010 to 104 in 2018–2019, coinciding with a steady increase in the number of pain fellows, from 285 in 2009–2010 to 372 in 2018–2019 (Figure 1A). Pain fellowship program size remained stable from 2009–2019 with a range of one to ten fellows per program. The majority of the pain fellowships participating in the NRMP match were university and academic based programs (Figure 1B).
Figure 1.

Characteristics of Training Program and Changes in ACGME Pain Medicine Fellowships from 2009–2019. A) Figure shows trends in the number of pain fellows and fellowship programs from 2009 through 2019. B) Figures shows number of ACGME programs by program setting in 2018–2019 academic yea.
Sources:
Figure 2 shows ethnicity and racial distribution in the US Census, medical school matriculants, pain residents and fellows as well as program directors for 2018–2019. Hispanic, Black, and Native American persons were underrepresented at all levels from medical school to program directors. The trend of underrepresentation has held steady since 2012 (Supplementary Data). Racial and ethnicity distribution in the US Census were not significantly correlated with the racial distribution of medical students (Spearman r = 0.600, P = 0.35) nor pain fellows (Spearman r = 0.600, P = 0.35). Similarly, racial distribution of medical students and pain residents were not significantly correlated (Spearman r = 0.900, P = 0.08) and neither was the correlation between racial and ethnicity distribution of pain residents and pain fellows (Spearman r = 0.900, P = 0.08) nor that of pain fellows and program directors (Spearman r = 0.900, P = 0.08) (Figure 2).
Figure 2.

Distribution of trainees and fellowship program directors in pain medicine in 2018 by race and ethnicity.
Sources:
https://www.census.gov/acs/www/data/data-tables-and-tools/data-profiles/
https://www.aamc.org/system/files/d/1/92-applicant_and_matriculant_data_tables.pdf
Men comprised a majority of the distribution of pain fellows at a consistent rate each year from 2009–2010 to 2018–2019 (Figure 3A) at a ratio of 5:1 to 3.7:1, and they held the majority of pain fellowship program director positions compared with women (Figure 3B). After pain fellowship training, the majority of physicians did not choose to practice in medically underserved areas (Figure 4A) but most practiced in the state where they trained (Figure 4B). The decision to remain in the state was not influenced by sex (Figure 4C). The large majority of physicians who completed ACGME pain fellowships between 2009 and 2018 did not acquire a full-time faculty appointment (Figure 4D), and less than 15% of fellows had an appointment at any faculty level (Figure 4E).
Figure 3.
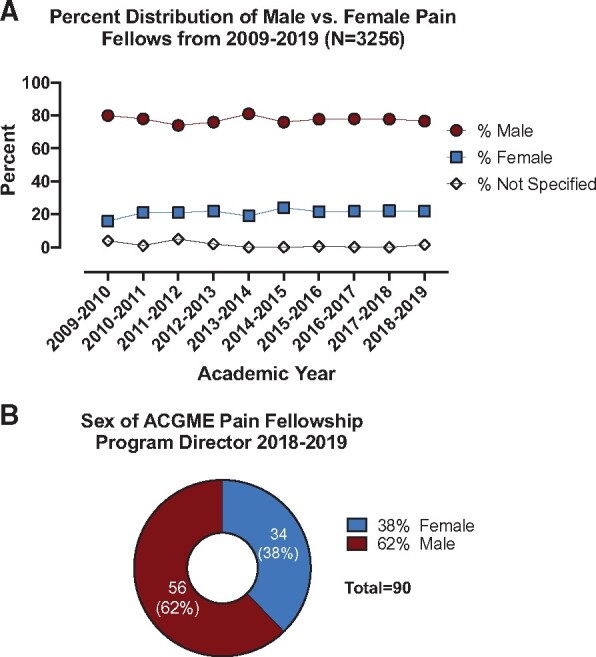
Distribution of pain fellows from 2009-2019 and pain fellowship program directors in 2018–2019 by sex. A) Shows the percent distribution of fellows by sex from 2009 through 2019. B) Shows sex of AGME pain fellowship program director in the 2018-2019 academic year.
Source:
Figure 4.

Career outcomes of those who have completed pain fellowship. A) Shows the practice location of practicing physicians who completed fellowship training from 2009 through 2018. B) Shows distribution of physicians who completed fellowship training from 2009 through 2018 and currently practicing in vs. out of the state where they trained. C) In vs. Out of State retention by Sex. D) Faculty appointment status of physicians who completed fellowship training from 2009 through 2018. E) Academic rank of physicians who completed fellowship training from 2009 through 2018.
Sources:
https://www.ama-assn.org/practice-management/masterfile/ama-physician-masterfile
For the academic year 2018–2019, there was an 8.17 times increase in the odds of a program director being non-Hispanic White, odds ratio (OR) = 8.17 (95% CI: 2.38–24.0, P < 0.05). Of all program directors (PDs) at academic programs, the proportion of PDs of color (non-White) was 33% whereas at non-academic programs, the proportion was 80%. There was non-significant decreased incidence of female program directors by 60% compared with males (OR = 0.4, 95% CI: 0.148–1.09, P = 0.07), with no significant difference between academic vs. non-academic programs. Accounting for race and sex, the incidence of White female program directors was 71% lower than non-White male directors, OR = 0.29 (95% CI: 0.122–0.715, P = 0.01).
Compared with their self-identified non-Hispanic White peers, individuals identifying as Asian/Pacific Islander (OR 0.44; 95% CI: 0.34–0.58, P = 0.01), Black (OR 0.46; 95% CI: 0.30–0.72, P = 0.04), and Native American/Alaskan Native (OR 0.26; 95% CI: 0.08–0.80, P = 0.03) had lower odds of being a pain fellow versus a fellow in a surgical fellowship, P < 0.05 (Table 2). The odds ratio of Black pain fellow to Black program director was OR 0.36; 95% CI: 0.11–1.12, P = 0.23. The odds ratio of Native American/Alaskan Native pain fellow to Native American/Alaskan Native program director was OR 0; 95% CI: 0.00–3.42, P = 0.35 (Table 2).
Table 2.
Odds ratio of race/ethnicity of pain fellow and program director
| Ethnicity/race | Pain fellow vs. other surgical fellows | Pain fellow vs. program director |
|---|---|---|
| Non-Hispanic White | OR (95% CI) | OR (95% CI) |
| Asian/Pacific Islander | 0.44 (0.34–0.58)* | 1.04 (0.63–1.73) |
| Hispanic** | 1.19 (0.67–2.17) | 0.97 (0.33–2.90) |
| Black | 0.46 (0.30–0.72)* | 0.36 (0.11–1.12) |
| Native American/Alaskan Native | 0.26 (0.08–0.80)* | 0 (0.00–3.42) |
P < 0.05.
Hispanic reflects ethnicity.
Of note, the odds ratio varied by sex of the trainee and program director. When compared with non-Hispanic Whites, the odds of a female pain fellow of color (non-White) was 0.33 and the odds of a non-White female PD was 1.2. Therefore, for females, the odds ratio of non-White pain fellow to program director was OR 0.28 (0.33/1.2), 95% CI 0.1–1.6, P = 0.45. For males, the odds of a non-White pain fellow vs. program director were 0.86 vs. 0.88, respectively, with odds ratio of 0.98, 95% CI: 0.93–2.92, P = 0.14.
Supplementary Data presents the total proportion of Black vs. Hispanic-identifying trainees across other specialties and fellowships for comparisons with pain medicine fellowships. Most of the specialties analyzed have higher representation than pain medicine of Hispanic trainees (Supplementary Data). Pain medicine has lower representation of trainees identifying as Black compared with family medicine.
In secondary analysis, to better understand the variance in racial/ethnicity distribution, we evaluated medical school application, matriculation, and graduation rates by race/ethnicity. As the applicant pool ultimately contributes to the graduate pool within four years, we focused on academic year 2015 (applicants and matriculants) and 2018 (graduates) to ascertain whether the disparities occur at the entry or exit point of medical school. The highest proportion of 2015 applicants were non-Hispanic White students (48%) compared with Hispanic (6.1%) and non-Hispanic Black (7.8%) students, P < 0.5 (Supplementary Data). Compared with their respective applicant pools, significantly more non-Hispanic White students (51%) were accepted than non-Hispanic Black (6.4%) or Hispanic students (6.3%), P < 0.05 (Supplementary Data). At graduation in 2018, more non-Hispanic White than non-Hispanic Black or Hispanic students graduated. The relative proportions exiting in 2018 compared with those entering medical school in 2015 was higher for non-Hispanic White students compared with Non-Hispanic Black or Hispanic peers. For example, 48% of those accepted in medical school in 2015 were White compared with 54.6% of those graduating in 2018. By contrast, 7.8% of those accepted in 2015 were non-Hispanic Black compared with 6.2% of those graduating in 2018. The differences in relative proportions were statistically significant, P < 0.05. Similar discrepancies in application, admission, and matriculation rates were observed in 2016 (Supplementary Data).
At the residency level, we focused on anesthesiology as a prototype for disparity analysis as it serves as the primary host of the majority of pain fellowship programs in the United States. From 2016 through 2019, the applicant pool to anesthesiology residency was predominantly non-Hispanic White (48–49%), Supplementary Data. As the 2017 applicant pool ultimately contributes to the 2018 pool of anesthesiology residents, we compared the two groups and found significant correlations by race/ethnicity. 47% of 2017 applicants vs. 63% of 2018 residents were non-Hispanic White, P < 0.05. In contrast to this, 7.6% of 2017 applicants vs. 6.8% of 2018 residents were non-Hispanic Black, and 8.6% of 2017 applicants vs. 5.4% of 2018 residents were Hispanic, P < 0.05 (Supplementary Data).
At the fellowship level, the ACGME, ERAS, and NRMP track pain fellowship application and matriculation rates as a multi-disciplinary specialty without disaggregating the data into the various primary pre-fellowship specialties. As such, our analysis was limited by the available data. From 2016 to 2019, pain fellowship application rates varied by race/ethnicity and the applicant pool each year was predominantly non-Hispanic White (Supplementary Data). Race/ethnicity composition of the 2017 pain fellowship applicant pool correlated significantly with the proportion of 2018 pain fellows, P < 0.05 (Supplementary Data). 41.9% of 2017 applicants vs. 40% of 2018 pain fellows were non-Hispanic White, P < 0.05. In contrast to this, 7% of 2017 applicants vs. 6.5% of 2018 pain fellows were non-Hispanic Black. Similarly, 4.5% of 2017 applicants vs. 3.2% of 2018 pain fellows were Hispanic, P < 0.05 (Supplementary Data).
Discussion
Despite an increase in the number of pain fellowship programs in the past decade (2009–2019), underrepresentation of pain medicine trainees and faculty from socially marginalized groups continues to persist. Within academic pain medicine, representation by race grew disproportionately. Individuals identifying as Hispanic, Native American, and Black have less representation as they progress from medical school to academic faculty. Odds ratios measure strength of association between exposure (race/ethnicity) and outcome (pain fellow or program director). As such, our data indicate that minorities have lower probability of becoming pain fellows or program directors simply by virtue of their ethnicity/race alone—this is reflective of broader systemic racial disparities. Potential confounders for the above association include sex, academic vs. private practice, size of academic pain division, among others. These factors need further exploration in future studies. Nonetheless, the fact that their race/ethnicity confers a disadvantage to academic pursuits for minorities in pain medicine and other specialties warrants concerted efforts by all stakeholders to reverse this disparity.
Our analysis suggests that traditional pain residency programs, particularly anesthesiology and neurology, have fewer minorities than other programs (Table 1). The disparity increases at the level of pain medicine fellowships. Other specialties and fellowships currently have a higher percentage of Hispanic trainees and demonstrate higher rates of diversity than pain medicine (3.2%), including: plastic surgery (7%), vascular surgery (4.2%), interventional radiology (3.5%), general surgery (5.1%), neurosurgery (4.2%), urology (4%), and family medicine (6.7%). Except for interventional radiology, the proportions of Hispanics were significantly higher for all the above specialties and fellowships when compared with pain medicine, P < 0.05. Individuals identifying as Native Americans were significantly underrepresented across all fellowships, including pain medicine.
Our secondary analyses provide some insights regarding ethnic/racial diversity at various points along the training pathway. Although data on the racial distribution of acceptance rates to anesthesiology programs are not publicly available, one can infer based on the higher proportion of non-Hispanic White Anesthesiology residents that more non-Hispanic Whites than minorities are accepted into this specialty relative to their respective applicant pools. Similarly, while there are no available data on racial distribution of acceptance rates to pain fellowship programs, there appears to be concordance between the non-Hispanic White anesthesiology applicant pool and the proportion of non-Hispanic White pain fellows. Notably, there were fewer Hispanic pain fellows compared with the proportion of Hispanic applicants.
Some take home points from our secondary analyses are noteworthy. Disparities in racial/ethnicity distribution exist at every level of academic training, from medical school through residency and pain fellowship training. Although it appears that medical schools contribute to this process given that fewer minorities matriculate into and graduate from medical school than their White peers, reasons for disproportionate racial/ethnicity distribution are complex and not fully understood. In its report, “Altering the Course: Black Males in Medicine,” the AAMC indicated that the pool of potential minority physicians is diminished way before medical school, starting in high school and further exacerbated at the collegiate level [23].
For the few minorities that make it into medical school and residency, prior reports indicate that explicit discrimination and microaggressions often serve as barriers to advancing to the next level [24–26]. As our analysis shows, residency (anesthesiology) programs accept fewer minorities from an already limited pool of applicants, and pain fellowship programs further maintain the status quo with little change in inequitable race/ethnicity distributions. While solutions to this problem may be complex, our analysis indicates that there are opportunities at every level to increase diversity. To begin to design comprehensive national strategies to address this challenge, we suggest that the ACGME, ERAS, NRMP as well as medical schools, residency, and fellowship programs begin to track diversity data and progression of minority trainees across the entire spectrum of training through to faculty position. Pain fellowships should also track racial/ethnicity data by primary specialty. All the above data should be publicly available to ensure institutional accountability. Along those lines, some have proposed a racial justice report card for academic medical institutions [27]. Beyond increasing the numbers and proportions of minorities, others have advocated for a cultural change across academic medical institutions and making diversity a part of accreditation criteria [28, 29]. These measures could potentially help establish more equitable academic medical institutions.
Additional Recommendations to Decrease Disparities in Pain Medicine Training
Several precedents exist for closing gaps in diversity of medical trainees and health inequities [30]. As an example, both University of Minnesota Medical School Duluth and University of Washington have Indigenous Health Pathway Programs that specifically prepare students for careers in American Indians and Alaska Native health and research [31, 32]. These programs have demonstrated a high success rate (80%) of training physicians regardless of their ethnicity/race who chose to work in underserved communities [31, 32]. In the field of dermatology, a recognition of significant disparities in skin care for ethnic minorities led some institutions to establish Ethnic Skin Centers to provide requisite skills for all their trainees to meet the skin health needs of people of color [33]. Some institutions have modified their training curriculum to incorporate health disparities and cultural competency to prepare all students to meet health needs of persons from minority backgrounds [34]. Prominent organizations such as the American Academy of Pain Medicine (AAPM) could also lead the design of similar programs with a focus on disparities in pain medicine. Academic journals in the field of pain medicine could further promote and support health disparities research. Together, the above strategies could help close some of the observed gaps in diversity of pain medicine trainees and faculty as presented in this article.
In the current climate of healthcare, where disparities are especially apparent, closing the diversity gap in our pain physician workforce is important to improving our country’s ability to deliver care for a diverse population of patients with chronic pain and musculoskeletal spine disorders. Our analysis indicates that there was an interaction of female sex and race for pain fellows, with lower odds of having a non-White female fellow. Similarly, there were lower odds of a non-White male pain fellow and male program director.
The observed disparities in sex, race, and ethnicity distribution in this analysis are not unique to pain medicine but reflect broader and complex societal inequities which need further exploration. Traditionally, several studies examining disparities have used the majority group, persons identifying as White, as a point of reference, and proportions have been compared with the US Census data [15–19]. Yet it remains to be established if this is the most appropriate reference point. Additionally, there are myriad reasons that may account for some of the observed disparities in mean ethnic and racial distribution. An observation of differences in racial and ethnicity distribution does not automatically imply prevalence of a problem. Nonetheless, the point remains that underrepresentation of physicians from socially disadvantaged backgrounds in pain medicine concurs with prior reports in other specialties [15–19].
Our study is limited by the nature of survey and self-reported information. We are not able to control for the quality and quantity of publicly available data. Notably, a broader definition of gender was not utilized in data collected by the AAMC and ACGME. Future research should consider the continuum of gender beyond sex binaries (male vs. female) and also start collecting more ethnocultural data. We suggest that specialties and organizations should begin to broaden the scope of their databases to be more inclusive of current demographics and reflective of overlapping race and gender identities. The diversity of non-ACGME pain fellowships and North American Spine Society (NASS) approved pain fellowships were not considered in this study. It is possible that the twenty NASS fellowships and numerous other pain or sport/spine fellowship programs could positively impact the diversity numbers in interventional pain medicine [35].
Additionally, our analysis did not account for promotion, salary, medical school debt, required number of work hours, and other factors which may affect diversity of pain fellows and fellowship program directors. A recent report indicates that the majority of medical graduates from underserved communities have more than $150,000 in debt compared with their White peers (who generally had no debt or on average had debt less than $150,000) [36]. This may contribute to fewer minority graduates starting careers in academic medicine, which traditionally have lower reimbursement rates. It is not clear to what degree this may impact the diversity of academic pain medicine trainees and faculty.
Despite the above limitations, a major strength of this study is that it provides further insight into the current status of diversity of the academic pain medicine training and physician workforce.
Conclusions
The demographics of pain medicine training programs reflect persistent underrepresentation of racial and ethnic minorities. Diversity in the healthcare training pool, however, yields a workforce that is culturally competent and improves access to care in underserved communities [37]. The analysis highlights opportunities to further diversify academic pain medicine fellowship programs. Further research is needed to fully elucidate the reasons underlying underrepresentation of racial and ethnic minorities in academic pain medicine fellowship programs.
Author Contributions
All authors contributed to the manuscript and agreed on the final document.
Supplementary Data
Supplementary data are available at Pain Medicine online.
Supplementary Material
Funding sources: This study was supported in part by the National Institutes of Health Medical Scientist Training Program Training Grant T32GM007205.
Conflict of interest: The authors do not have any relevant conflict of interest to disclose.
Disclosure: There are no financial conflicts to disclose pertaining to the current submission.
Outside disclosures:Dr. Goree reports personal fees from Abbott, personal fees from Stratus Medical, outside the submitted work; Dr. Goree reports personal fees from Abbott, personal fees from Stratus Medical, outside the submitted work; Dr. Vanterpool consults for Abbott, Nevro, and Boston Scientific.
Dr. Poree consults for Saluda, Medtronic, Nalu and Gimer. Brooks Leitner receives funding support from the National Institutes of Health Medical Scientist Training Program Training Grant T32GM007205.
References
- 1. Deville C, Hwang W-T, Burgos R, Chapman CH, Both S, Thomas CR.. Diversity in graduate medical education in the United States by race, ethnicity, and sex, 2012. JAMA Intern Med 2015;175(10):1706–8. [DOI] [PubMed] [Google Scholar]
- 2.AAMC. More Women than Men Enrolled in U.S. Medical Schools in 2017. Available at: https://www.aamc.org/news-insights/press-releases/more-women-men-enrolled-us-medical-schools-2017 (accessed June 29, 2020).
- 3. March JA, Adams JL, Portela RC, Taylor SE, McManus JG.. Characteristics and diversity of ACGME accredited emergency medical services fellowship programs. Prehosp Emerg Care 2019;23(4):551–9. [DOI] [PubMed] [Google Scholar]
- 4. Higgins MCSS, Hwang W-T, Richard C, et al. Underrepresentation of women and minorities in the United States IR Academic Physician Workforce. J Vasc Interv Radiol 2016;27(12):1837–44.e2. [DOI] [PubMed] [Google Scholar]
- 5. Doshi TL, Richter HC, Salisu M, Samen C.. Representation of women in pain medicine fellowships in the United States, 2017–2018. Pain Med 2019;21(2):e62–7. [DOI] [PubMed] [Google Scholar]
- 6. Hagedorn JM, Pittelkow T, Warner N, et al. Gender of pain medicine leadership and trainees: A survey study. Reg Anesth Pain Med 2019;44 (12):1091–3. [DOI] [PubMed] [Google Scholar]
- 7. Ly DP. Racial and ethnic disparities in the evaluation and management of pain in the outpatient setting, 2006–2015. Pain Med 2019;20(2):223–32. [DOI] [PMC free article] [PubMed] [Google Scholar]
- 8. Green CR, Anderson KO, Baker TA, et al. The unequal burden of pain: Confronting racial and ethnic disparities in pain. Pain Med 2003;4(3):277–94. [DOI] [PubMed] [Google Scholar]
- 9. Ko M, Heslin KC, Edelstein RA, Grumbach K.. The role of medical education in reducing health care disparities: The first ten years of the UCLA/Drew Medical Education Program. J Gen Intern Med 2007;22(5):625–31. [DOI] [PMC free article] [PubMed] [Google Scholar]
- 10. Komaromy M, Grumbach K, Drake M, et al. The role of Black and Hispanic physicians in providing health care for underserved populations. N Engl J Med 1996;334(20):1305–10. [DOI] [PubMed] [Google Scholar]
- 11. Heins A, Homel P, Safdar B, et al. Physician Race/ethnicity predicts successful emergency department analgesia. J Pain 2010;11(7):692–7. [DOI] [PubMed] [Google Scholar]
- 12. Meghani SH, Byun E, Gallagher RM.. Time to take stock: A meta-analysis and systematic review of analgesic treatment disparities for pain in the United States. Pain Med 2012;13(2):150–74. [DOI] [PubMed] [Google Scholar]
- 13. Sabin JA, Greenwald AG.. The influence of implicit bias on treatment recommendations for 4 common pediatric conditions: Pain, urinary tract infection, attention deficit hyperactivity disorder, and asthma. Am J Public Health 2012;102(5):988–95. [DOI] [PMC free article] [PubMed] [Google Scholar]
- 14. Poole KGJ, Jordan BL, Bostwick JM.. Mission drift: Are medical school admissions committees missing the mark on diversity? Acad Med 2020;95(3):357–60. [DOI] [PubMed] [Google Scholar]
- 15. Smedley BD, Butler AS, Bristow LR.. In the Nation's Compelling Interest: Ensuring Diversity in the Health-Care Workforce. Washington, DC: National Academies Press; 2004. [PubMed] [Google Scholar]
- 16. Merchant JL, Omary MB.. Underrepresentation of underrepresented minorities in academic medicine: The need to enhance the pipeline and the pipe. Gastroenterology 2010;138(1):19–26.e3. [DOI] [PubMed] [Google Scholar]
- 17. Lett LA, Orji WU, Sebro R.. Declining racial and ethnic representation in clinical academic medicine: A longitudinal study of 16 US medical specialties. PLoS One 2018;13(11):e0207274.. [DOI] [PMC free article] [PubMed] [Google Scholar]
- 18. Poon S, Kiridly D, Brown L, et al. Evaluation of sex, ethnic, and racial diversity across US ACGME–accredited orthopedic subspecialty fellowship programs. Orthopedics 2018;41(5):282–8. [DOI] [PubMed] [Google Scholar]
- 19. Choinski K, Lipsitz E, Indes J, et al. Trends in sex and racial/ethnic diversity in applicants to surgery residency and fellowship programs. JAMA Surg 2020;155(8):778–81. [DOI] [PMC free article] [PubMed] [Google Scholar]
- 20. Meghani SH, Polomano RC, Tait RC, Vallerand AH, Anderson KO, Gallagher RM.. Advancing a national agenda to eliminate disparities in pain care: directions for health policy, education, practice, and research. Pain Med 2012;13(1):5–28. [DOI] [PubMed] [Google Scholar]
- 21.U.S. Census Bureau. QuickFacts: United States. Available at: https://www.census.gov/quickfacts/fact/table/US/PST045219 (accessed July 20, 2020).
- 22. Silver JK, Bean AC, Slocum C, et al. Physician workforce disparities and patient care: A narrative review. Health Equity 2019;3(1):360–77. [DOI] [PMC free article] [PubMed] [Google Scholar]
- 23.Association of American Medical Colleges. Altering the Course: Black Males in Medicine. Washington, DC: Association of American Medical Colleges; 2015: 1–49. [Google Scholar]
- 24. Torres MB, Salles A, Cochran A.. Recognizing and reacting to microaggressions in medicine and surgery. JAMA Surg 2019;154(9):868–72. [DOI] [PubMed] [Google Scholar]
- 25. Ackerman-Barger K, Boatright D, Gonzalez-Colaso R, Orozco R, Latimore D.. Seeking inclusion excellence: Understanding racial microaggressions as experienced by underrepresented medical and nursing students. Acad Med 2020;95(5):758–63. [DOI] [PMC free article] [PubMed] [Google Scholar]
- 26. Espaillat A, Panna DK, Goede DL, Gurka MJ, Novak MA, Zaidi Z.. An exploratory study on microaggressions in medical school: What are they and why should we care? Perspect Med Educ 2019;8(3):143–51. [DOI] [PMC free article] [PubMed] [Google Scholar]
- 27.Racial Justice Report Card. WhiteCoats4BlackLives. Available at: https://whitecoats4blacklives.org/wp-content/uploads/2019/08/RJRC-2019-Full-Report-Final-8.28.19.pdf (accessed November 28, 2020).
- 28. Kundhal KK, Kundhal PS.. Cultural diversity: An evolving challenge to physician-patient communication. JAMA 2003;289(1):94.. [DOI] [PubMed] [Google Scholar]
- 29. Smedley BD, Butler AS, Bristow LR, eds. The Role of accreditation in increasing racial and ethnic diversity in the health professions. In: In the Nation's Compelling Interest: Ensuring Diversity in the Health-Care Workforce 2004. Washington, DC: National Academies Press; 2004:1–41. [PubMed] [Google Scholar]
- 30. Swartz TH, Palermo AG, Masur SK, Aberg JA.. The science and value of diversity: Closing the gaps in our understanding of inclusion and diversity. J Infect Dis Med 2019;220(Supplement_2):S33–S41.20 [DOI] [PMC free article] [PubMed] [Google Scholar]
- 31. Kost A, Benedict J, Andrilla CH, Osborn J, Dobie S.. Primary care residency choice and participation in an extracurricular longitudinal medical school program to promote practice with medically underserved populations. Acad Med 2014;89:162–8. [DOI] [PubMed] [Google Scholar]
- 32. Acosta D, Olsen P.. Meeting the needs of regional minority groups: The University of Washington’s programs to increase the American Indian and Alaskan Native physician workforce. Acad Med 2006;81(10):863–70. [DOI] [PubMed] [Google Scholar]
- 33. Tull R, McMichael A.. The impact of ethnic skin centers in the United States. Dermatology 1906;600:3. [DOI] [PubMed] [Google Scholar]
- 34. Lewis M, Prunuske A.. The Development of an Indigenous Health Curriculum for Medical Students. Acad Med 2017;92(5):641–8. [DOI] [PMC free article] [PubMed] [Google Scholar]
- 35.NASS. 2020-2021 Interventional Spine and Musculoskeletal Medicine (ISMM) Fellowships Match Information. North American Spine Society. Available at: https://www.spine.org/Portals/0/Assets/Downloads/Education/ISMMFellowshipDirectory.pdf (accessed July 17, 2020).
- 36. Dugger RA, El-Sayed AM, Dogra A, Messina C, Bronson R, Galea S.. The color of debt: Racial disparities in anticipated medical student debt in the United States. PLoS One 2013;8(9):e74693. [DOI] [PMC free article] [PubMed] [Google Scholar]
- 37. Smedley BD, Stith AY Colburn L, Evans CH, Institute of Medicine (US). The Right Thing to Do, The Smart Thing to Do: Enhancing Diversity in the Health Professions—Summary of the Symposium on Diversity in Health Professions in Honor of Herbert W. Nickens, M.D. Washington, DC: National Academies Press (US; ); 2001:1–366. [PubMed] [Google Scholar]
Associated Data
This section collects any data citations, data availability statements, or supplementary materials included in this article.