

Summary
Plant genomes demonstrate significant presence/absence variation (PAV) within a species; however, the factors that lead to this variation have not been studied systematically in Brassica across diploids and polyploids. Here, we developed pangenomes of polyploid Brassica napus and its two diploid progenitor genomes B. rapa and B. oleracea to infer how PAV may differ between diploids and polyploids. Modelling of gene loss suggests that loss propensity is primarily associated with transposable elements in the diploids while in B. napus, gene loss propensity is associated with homoeologous recombination. We use these results to gain insights into the different causes of gene loss, both in diploids and following polyploidization, and pave the way for the application of machine learning methods to understanding the underlying biological and physical causes of gene presence/absence.
Keywords: Brassica, pangenome, XGBoost, gene loss propensity, machine learning, transposable elements
Introduction
A single reference genome does not represent the gene content of a species due to gene presence/absence variation (PAV) between individuals. In plants, genome duplication through polyploidization provides an opportunity for differential gene loss and subsequent presence/absence variation between individuals, and species that have experienced relatively recent polyploidy often host a relatively high proportion of dispensable genes. Several studies have examined gene conservation and loss following polyploidization. Neofunctionalization of duplicated genes has been observed in cotton (Adams et al., 2003; Rong et al., 2010; Yang et al., 2017), while in Brassica napus, homoeologous exchange (HE) between chromosomes is associated with gene loss (Hurgobin et al., 2018) and with the generation of novel chimeric genes (Zhang et al., 2020).
Differential fractionation of genomes has been observed following ancient triplication in the diploid Brassica species B. rapa and B. oleracea (Cheng et al., 2014), while in octoploid strawberry (Fragaria ananassa), the diploid F. vesca subgenome dominates the other three subgenomes, having lost the fewest genes (Edger et al., 2019). Differential loss and retention of genes following two rounds of polyploidy has been reported in hexaploid bread wheat (Triticum aestivum) (Berkman et al., 2013), and differential subgenome retention and loss of genes has similarly been observed following tetraploidy in maize (Schnable et al., 2011; Woodhouse et al., 2010).
Amphidiploid B. napus (AC subgenome, 2n = 36) formed approximately 7500 years ago following hybridization of B. oleracea (C genome, 2n = 18) and B. rapa (A genome, 2n = 20) (Allender and King, 2010; Nagaharu, 1935). It is believed that the A subgenome is derived from an ancestor of European turnip, while the C subgenome derives from a common ancestor of kohlrabi, cauliflower, broccoli and Chinese kale (Lu et al., 2019), with the polyploid forming post domestication, with no apparent wild forms of B. napus. There is little support for a polyphyletic origin for B. napus, though there is evidence of introgression from B. rapa/B. oleracea after polyploidy (Allainguillaume et al., 2006; An et al., 2019). While there have been several studies of gene loss following polyploidy, these have either focused on individual plants which may not reflect species‐level changes due to extensive gene presence/absence variation between individuals of the same species (Edger et al., 2019; Edger et al., 2017; Rong et al., 2010; Yang et al., 2017), or they have focused on resynthesized amphidiploids (Bird et al., 2019). The datasets produced in pangenome studies offer a chance to investigate the physical mechanisms of gene loss using statistical approaches including machine learning.
In this study, we first produced a new genome assembly of Brassica napus cv. Darmor‐bzh. Then we examined gene conservation and loss at the species level by constructing and comparing pangenomes for B. napus and its diploid progenitors B. oleracea and B. rapa. Comparative modelling of the propensity for gene loss in the three species revealed that in the diploids, genes with propensity for loss are primarily associated with transposable elements, while in the polyploid B. napus, propensity for gene loss was associated with the position of the gene on the pseudomolecule. By constructing pangenomes and applying a novel modelling method, this study presents the first assessment and comparison of the mechanisms that underlie gene presence/absence variation in a polyploid and its diploid progenitors.
Results and discussion
A new Darmor‐bzh reference genome
A new 1192 Mbp Darmor‐bzh reference genome was assembled, which is 342 Mbp (40%) larger than the previous v4 assembly (850 Mbp) (Chalhoub et al., 2014), encoding 102 845 genes. The number of genes is similar to the 101 040 genes in the Darmor‐bzh v4 annotation (Chalhoub et al., 2014) and 94 586 to 100 919 genes in eight high‐quality B. napus genomes (Song et al., 2020). Both Darmor‐bzh assemblies contain the same number of complete BUSCOs (423, 99.5%). The v9 assembly contains 14 duplicated BUSCOs that collapse into single copies in the v4 assembly (Table S1). Both assemblies are collinear (Figure S1a). In the new v9 assembly, pseudomolecules are larger by an average of 15.1 Mbp ranging from 3.8 Mbp (A03) to 59.5 Mbp (C02). The size of chromosome C02 is 105.7 Mb in the v9 assembly compared with 46.2 Mbp in the old assembly (Figure S1b). The new region on C02 is not due to misplacement as it does not align with any other region in the 4.1 assembly (Figure S1c). The majority of the additional sequence in the v9 assembly consists of repetitive and transposable elements, with the assembly repeat content increasing twofold from 319 Mbp in v4 (49%) to 643 Mbp in the v9 assembly (68%) (Table 1, Table S2, Figure S2). The percentage of repeats is higher than reported in Song et al., (2020), which may be due to different de novo repeat‐finding pipelines. In the v9 assembly, the total size of all common repeat classes increased two‐fold. For example, Helitron repeat content grew from 153 to 240 Mbp (Tables S2–S4). The difference in the size of C02 is explained by the difference in assembled repetitive elements: in v4.1, C02 contains 26 Mbp of repetitive elements, while in the v9 assembly, C02 contains 91 Mbp of repeats.
Table 1.
Assembly statistics for the newly assembled B. napus cv. Darmor‐bzh v9 compared with v4.1 (Chalhoub et al., 2014)
| Assembly | Assembly size (Mb) | Anchored chromosome (Mb) | TEs (%) | Number of annotated genes | Completeness (BUSCO) |
|---|---|---|---|---|---|
| V4.1 (Chalhoub et al., 2014) | 850.3 | 645.4 | 46.5 | 101 040 | 99.5% |
| v9 | 1043.4 | 933.3 | 64.5 | 108 580 | 99.5% |
Construction of three new pangenomes
Using the iterative mapping and assembly approach (Bayer et al., 2020; Hurgobin and Edwards, 2017), we have assembled pangenomes for B. oleracea, B. rapa and B. napus, representing the C, A and amphidiploid AC subgenomes, using 87, 77 and 79 individuals respectively (Table 2). Compared to the reference assemblies, each pangenome increased in size and gene content. The model of gene numbers converges asymptotically with the addition of each new individual suggesting that we have assembled almost all of the genes for these three species (Figure 1).
Table 2.
Pangenome additional contigs assembly statistics
| Pangenome | Assembly size (Mbp) | Assembly N50 | Predicted genes |
|---|---|---|---|
| Brassica oleracea | 121.8 | 3848 | 6715 |
| Brassica rapa | 180.5 | 2500 | 19 767 |
| Brassica napus | 87.2 | 2295 | 5060 |
Figure 1.
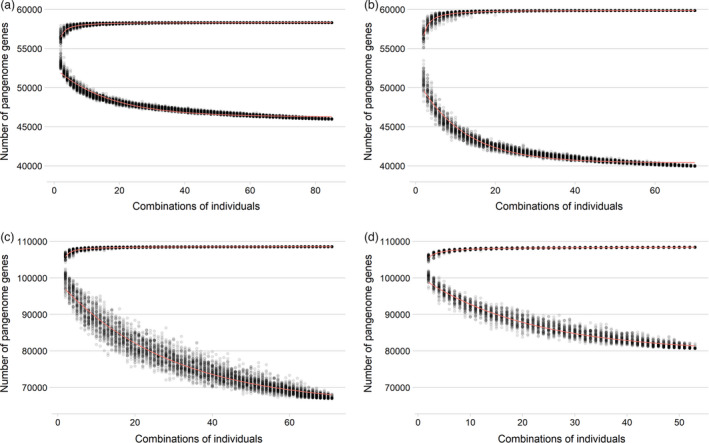
Pangenome models based on the (Golicz et al., 2016) gene number modelling method for (a) B. oleracea, (b) B. rapa, (c) B. napus (including synthetic lines) and (d) B. napus (excluding synthetic lines). Upper curves show the total pangenome after different combinations of individuals, the lower curve shows the number of core genes between all combinations of individuals.
Annotation of the pangenomes predicted 58 315 gene‐models in B. oleracea, 59 864 gene‐models in B. rapa and 108 580 gene‐models in B. napus. Out of these, 5963, 13 244 and 5735 gene‐models are located on newly assembled pangenome contigs of the three pangenomes. Modelling of the pangenome size resulted in predicted total gene numbers for B. oleracea, B. rapa and B. napus of 58 347 (+/−2), 59 923 (+/−4) and 108 586 (+/−4), with predicted core gene numbers of 46 261 (+/−7), 40 391 (+/−11) and 65 096 (+/−150) respectively. The predicted pangenome size of B. oleracea is lower than the first B. oleracea pangenome which predicted a pangenome size of 63 865 +/−31 (Golicz et al., 2016) perhaps because the first pangenome used a wild relative in the calculations (B. macrocarpa), leading to a higher estimate in the first pangenome, but also used different annotation methods and repeat‐masking methods. Similarly, the first B. napus pangenome predicted a pangenome size of 95 730 +/−11 (Hurgobin et al., 2018), lower than what we observe here. When we exclude synthetic lines, the predicted B. napus gene number drops to 108 537 (+/−9), while the core gene number increases to 79 663 (+/−119). Therefore, while the addition of the synthetic lines only increases the predicted total gene number by 49 genes, the proportion of genes that demonstrate presence/absence variation increases from 26 to 38% (Table 3).
Table 3.
Shared genes between the three pangenomes based on exon‐level read alignments. For B. rapa, FPSc (Fast Plants, self‐compatible) and non‐FPSc lines are compared. For B. napus, non‐synthetic and synthetic lines are compared
| B. oleracea pangenome | B. rapa pangenome | B. napus pangenome | ||||
|---|---|---|---|---|---|---|
| Total genes | 58 315 | 59 864 | 108 580 | |||
| Dispensable genes within the same species | 12 354 (21%) | With FPScs | 19 912 (33%) | With synthetics | 41 614 (38%) | |
| Without FPScs | 19 735 (33%) | Without synthetics | 27 930 (26%) | |||
| Core genes within the same species | 45 961 (79%) | With FPScs | 39 952 (67%) | With synthetics | 66 966 (62%) | |
| Without FPScs | 40 129 (67%) | Without synthetics | 80 650 (74%) | |||
| Present in all three species in at least one individual each | 57 717 (99%) | 57 941 (97%) | 104 465 (96%) | |||
| Present only in… | B. napus and B. oleracea | 226 (0.4%) | 0 | 648 (0.6%) | ||
| B. napus and B. rapa | 0 | 1198 (2%) | 2512 (2.3%) | |||
| B. oleracea and B. rapa | 12 (0.02%) | 16 (0.02%) | 0 | |||
| B. napus | 0 | 0 | 955 (0.9%) | |||
| B. rapa | 0 | 711 (1.1%) | 0 | |||
| B. oleracea | 360 (0.6%) | 0 | 0 | |||
Our findings suggest that the synthetics contribute a greater diversity of gene combinations without significantly increasing gene number. The discrepancy in gene content between synthetic and non‐synthetic B. napus lines is expected due to differential gene loss between the multiple independent polyploidization events. Natural B. napus is predicted to have derived from a single polyploidy event, while each of the 20 synthetic lines is more recently derived from combinations of 11 female and 14 male parents (Schmutzer et al., 2015). Synthetic lines also demonstrate a greater diversity of homoeologous exchange events followed by subgenome‐specific gene loss (Hurgobin et al., 2018).
Brassica rapa and B. oleracea diverged from a common ancestor around 3 MYA (Sun et al., 2019), so they may be expected to share a similar pangenome content. Based on read‐alignments out of 58 315 B. oleracea genes, 57 729 (99%) are present in at least one B. rapa individual, and similarly, out of 59 864 B. rapa genes, 57 957 (97%) are present in at least one B. oleracea individual. Of the 108 580 B. napus genes, 105 149 (97%) and 106 977 (99%) are present in at least one individual of B. oleracea and B. rapa respectively (Figure 2, Table 3). B. rapa has a greater proportion of dispensable genes (33%) than B. oleracea (21%) (Figure S3), suggesting greater genetic diversity in B. rapa, which is in line with a higher genetic diversity observed in the A subgenome of B. napus (Wu et al., 2019). Only 360, 711 and 955 genes were found to be unique in B. oleracea, B. rapa and B. napus respectively. Some of these are likely to be annotation artefacts or genes that have not yet been sampled in the other species, though this result does suggest that there may be genes unique to these species that could be of agronomic interest (Figure 3).
Figure 2.
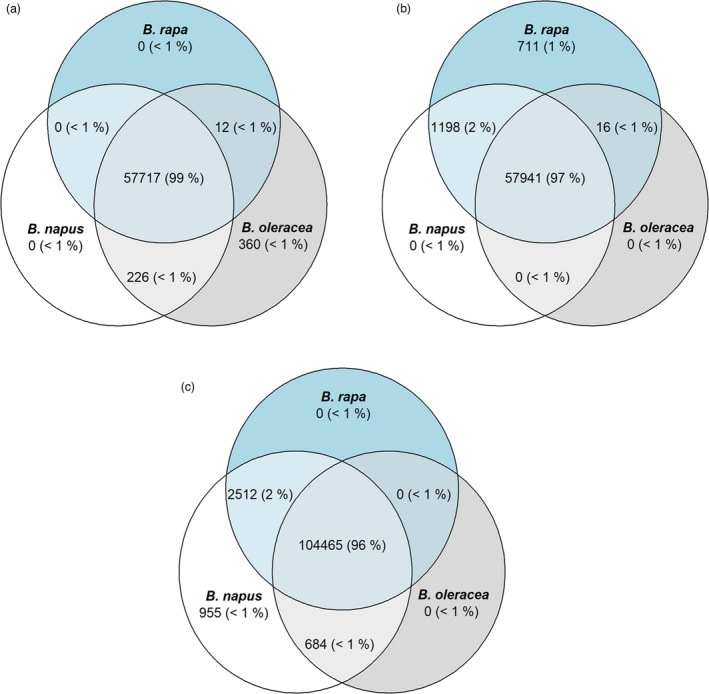
Genes shared across B. oleracea, B. rapa and B. napus in the three assembled pangenomes. (a) B. oleracea pangenome (58 315 genes), (b) B. rapa pangenome (59 864 genes) and (c) B. napus pangenome (108 580 genes).,
Figure 3.
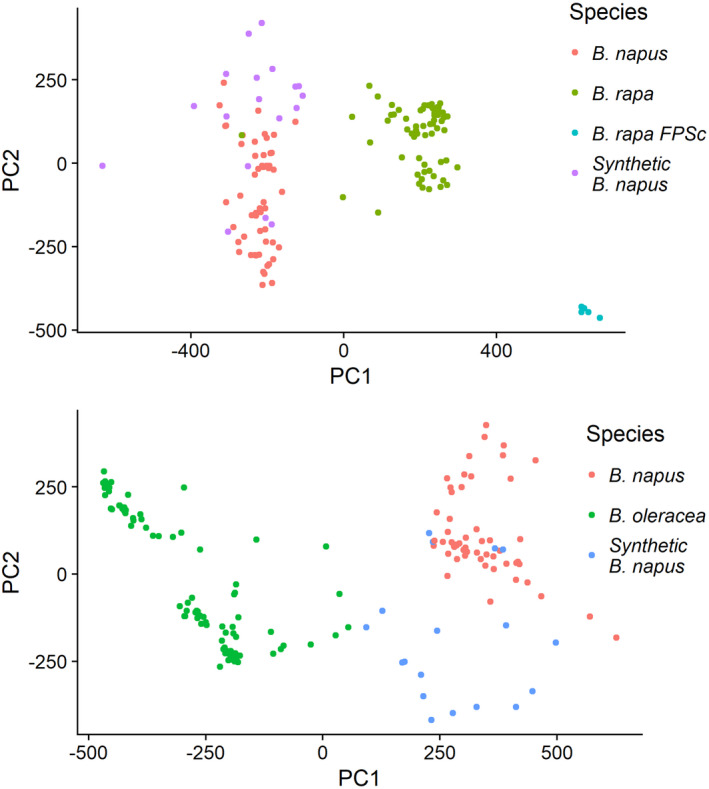
First two principal components based on PAV data of (a) A genome genes and (b) C genome genes. The PAV matrix of all B. napus genes was split into two subsets – (a) one containing only A‐genome genes and A‐genome species (B. rapa, fast‐cycling B. rapa FPSc, B. napus) and (b) one containing only C‐genome genes and C‐genome species (B. oleracea, B. napus). PCA was carried out using logistic singular value decomposition (SVD). In both cases 31% of variance was explained by the model.
Gene loss specific to B. Rapa rapid cycling lines
PCA‐clustering of B. rapa individuals identified a highly diverged cluster consisting of rapid cycling, self‐compatible lines that have undergone intensive selection (FastPlants sc, FPSc). In these individuals, an additional 177 genes were found to be dispensable compared to the non‐FPSc B. rapa individuals. Proteins encoded by these 177 genes share sequence identity with stress‐response genes including HVA22 (a stress‐response gene which regulates vesicular traffic (Brands and Ho, 2002)) and G‐type lectin S‐receptor‐like serine/threonine‐protein kinase SRK, a salinity‐stress linked regulator (Sun et al., 2013) which is also involved in self‐incompatibility (Zhang et al., 2011). The loss of these abiotic stress‐related genes may be associated with faster growth of these plants. As the FPSc lines are self‐compatible it may be expected that these lines have lost the self‐incompatibility‐linked genes SLG, SRK and SCR/SP11 within the S‐locus (Nasrallah, 1997). However, versions of these three genes are present in all of the FPSc lines, suggesting that self‐compatibility in these lines is not caused by gene loss but rather by previously described polymorphisms (Kitashiba and Nasrallah, 2014).
Dispensable genes are commonly associated with abiotic and biotic stress
Dispensable genes are annotated predominantly with GO‐terms associated with biotic and abiotic stress response for each of the three Brassica pangenomes (Table S5), with the term ‘defense response’ (GO:0006952) appearing significantly enriched in variable genes of B. oleracea, B. rapa and B. napus. Dispensability of stress response genes has been observed previously in crop pangenomes (Bayer et al., 2019; Golicz et al., 2016). In the B. oleracea pangenome, the GO terms ‘response to salt stress’ and ‘defense to bacterium’ were enriched in dispensable genes (Golicz et al., 2016), while in the wheat pangenome, ‘defense response’ was among the GO terms with the greatest enrichment in dispensable genes (Montenegro et al., 2017). Similar patterns were observed in the pangenomes of rice (Zhao et al., 2018), B. napus (Hurgobin et al., 2018), sesame (Yu et al., 2019), pigeon pea (Zhao et al., 2020), sunflower (Hübner et al., 2019) and soybean (Liu et al., 2020b), where biotic and abiotic stress resistance‐related genes were enriched among variable genes.
The strong but variable selection pressure on disease resistance genes associated with the presence or absence of associated pathogens likely impacts their differential conservation and loss between individuals. We found 206, 379 and 445 nucleotide‐binding leucine‐rich repeat (NLR) genes in B. oleracea, B. rapa and B. napus respectively. The B. oleracea pangenome contained 89 fewer NLR genes than the B. napus C subgenome, while in contrast, the B. rapa A subgenome assembly contained 52 more NLR genes than the B. napus A subgenome. Many of these additional B. rapa NLR genes were not found in the B. napus reference assembly, highlighting the importance of pangenomes for species comparisons (Figure S4a). This pattern of differential loss was not apparent for two other classes of genes involved in disease resistance, RLP and RLK (Figure S4b), suggesting that the observed differences are not assembly artefacts and that there is a range of R‐genes that are only present in the B. rapa gene pool and not in the B. napus gene pool.
Protein‐protein interaction networks and the pangenome
Gene conservation and loss are associated with many factors. It has previously been observed that genes associated with protein‐protein interaction networks tend to be more resistant to loss following polyploidy than genes outside of such networks. However, this resistance to loss is also affected by selection, with a greater loss of networked genes in new polyploids under strong selection than those under more relaxed selection (Schoenrock et al., 2017). This is exemplified in bread wheat, where the formation of the tetraploid occurred before domestication, while the hexaploid formed post domestication, with greater selection pressure that resulted in a greater loss of networked genes (Berkman et al., 2013).
In our newly assembled B. napus pangenome, excluding synthetic lines, 86% of core genes are predicted to be in networks, while only 72% of dispensable genes are predicted to be in networks (Table S6). There was a statistically significant difference in network retention between the two subgenomes, with 91% and 81% of core genes within networks in the A and the C subgenomes, respectively (X 2‐test, P < 0.005 in all cases).
The retention of networked genes is slightly higher in the diploid species, with 87% and 90% of B. oleracea and B. rapa core genes predicted to be in networks compared with 86% of B. napus core genes in networks (Table S6), while only 68% and 70% of dispensable genes are predicted to be in networks. In the two diploids, as in B. napus, there was a statistically significant association between membership in protein interaction networks and variable genes (X 2‐test, P < 0.005). The diploid genomes may be under greater pressure to maintain networked genes, as the presence of a duplicate gene set in the polyploid may partially compensate for the loss of genes in functional networks.
Searching for A and C genome ancestors
Several genomic studies have attempted to identify the diploid parents of B. napus (Lu et al., 2019; Song et al., 2020). Here, we compared PAV patterns based on PCA between the two B. napus subgenomes and the B. rapa and B. oleracea individuals. This identified close relatives for the A subgenome (Figure 5a) but not for the C subgenome (Figure 5b), similar to previous observations based on SNPs, suggesting a complex origin for the C subgenome (Song and Osborn, 1992). We hypothesized that there may be different ancestors for different C subgenome chromosomes. We therefore repeated this analysis for each chromosome and observed inconsistencies between chromosomes (Figures S6 and S7). For example, A05 shows very little divergence between individuals, which may be due to a previously described low frequency of homoeologous recombination of this chromosome (Pele et al., 2017). C03 and C09 diverged the most, possibly due to elevated crossover frequency. However, we found no chromosome‐specific ancestors, suggesting that the C‐genome ancestors are not represented by the publicly available B. oleracea data.
Figure 5.
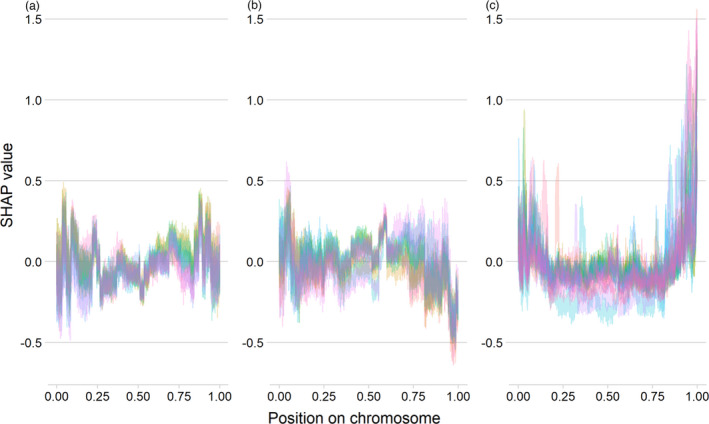
SHAP values as a measure of importance in predicting dispensable genes based on the genes’ position on the chromosomes in three XGBoost models trained for B. oleracea (a), B. rapa (b) and B. napus (c). The x‐axis represents the feature ‘Position on chromosome’ in Figure 4. Each line represents one chromosome. The y‐axis displays SHAP values, the higher the value, the more of an impact that gene’s position has towards the prediction of a dispensable gene. Negative SHAP values imply that this gene’s position has an impact towards the prediction of a core gene. Only on B. napus do SHAP values exceed 1, and then only at the telomeres of almost all chromosomes. In the diploids, genes located at the telomeres have negative SHAP values, i.e. their telomeres are not linked with the prediction of gene loss propensity.
Comparing transposon content between B. oleracea, B. rapa and B. napus
Many traits of agronomic interest in B. napus and its diploid ancestors have been linked with transposon insertions, including an LTR‐insertion linked with resistance to pod shattering and silique length (Liu et al., 2020a), and hAT, MITE and LINE insertions linked with flowering time (Song et al., 2020). In B. napus, a Helitron insertion within the promoter region of the self‐incompatibility gene BnSP11‐1 has been linked with self‐fertilization (Gao et al., 2016). This insertion has not been observed in the diploid ancestors, suggesting that it arose after the formation of the polyploid B. napus.
Here most classes of transposons show a similar abundance between the A and C subgenomes of B. napus and their respective diploid ancestors B. rapa and B. oleracea (Tables S2–S4, S7–S12). For example, the percentage of hAT (DNA/DTA) elements ranged from 0.8 to 0.9% in B. oleracea and 0.5 to 0.8% in the C subgenome of B. napus, and a range of 0.7% to 0.9% in B. rapa compared with 0.6% to 0.9% in the A subgenome of B. napus. However, other classes of transposons varied in abundance between the B. napus A and C subgenomes. For example, DNA/Helitron elements constitute 20.4% to 35% of the B. napus A subgenome but only 15% to 24.4% of the B. napus C subgenome, though they are similarly abundant in the diploid ancestors (22.5% to 27.9% in B. rapa, 22.5% to 23.9% in B. oleracea). The number of Helitrons observed here is higher than an earlier investigation into Helitrons in Brassicaceae (Hu et al., 2019) due to different computational analysis tools used. It is possible that the Helitrons found here are an overestimate of the true Helitron content as the accurate prediction of Helitrons remains challenging (Ou et al., 2019).
Class II DNA transposons of superfamily CACTA (DNA/DTC) make up between 1.9% to 2.4% of the B. oleracea genome and 0.9% to 1.4% of the B. rapa genome. We observed an increased number of CACTA transposons in the B. napus C subgenome compared to B. oleracea (2.4% compared with 1.9%). The greater abundance of CACTA elements in B. oleracea compared to B. rapa has been observed before (Alix et al., 2008) and CACTA elements have undergone several rounds of amplification since B. rapa and B. oleracea divergence. Similar CACTA expansions have been observed in amphidiploid cotton compared with its diploid ancestors (Chen et al., 2020), though in our study the difference may be due to repetitive elements collapsing in the B. oleracea assembly, while they were assembled correctly in the more complete B. napus assembly. A recent high‐quality genome of B. napus cv. ZS11 (Chen et al., 2021) found similar recent repeat expansions compared to the diploid ancestor which supports our findings.
Factors influencing gene loss propensity in the three pangenomes
We examined factors that may influence gene loss propensity. We built models that used genomic features to predict gene loss propensity in the three pangenomes to ask which genomic features have the largest impact on gene loss. These features include distance from centromeres (Mason et al., 2016), gene size, pseudomolecule size, distance from transposons, and in B. napus, whether a gene is located in a block syntenic with the homoeologous genome (Figure S8), using genes located only on pseudomolecules and ignoring B. napus genes only variable in synthetic lines. This builds on previous observations in B. oleracea showing that dispensable R‐genes are closer to transposable elements than expected (Bayer et al., 2019), frequent nonreciprocal homoeologous exchanges between chromosomes in B. napus (Sharpe et al., 1995), and lineage‐specific gene loss propensity across eukaryotes (Krylov et al., 2003). We compared five different statistical and machine learning approaches (Logistic Regression, Gaussian Naïve Bayes, Random Forest, AdaBoost and XGBoost) and settled on gradient boosting models (XGBoost) because this model showed the highest accuracy (0.86) and F1‐score (0.23) (Table S13). We built gradient boosting models predicting gene loss propensity while accounting for the strong class imbalance by using different sample weights, balancing of positive and negative weights, stratified test and training data, and a Bayesian hyperparameter search to optimize model parameters. These models achieved an accuracy of 85% (AUC: 0.7, average precision‐recall score: 0.2, F1: 0.18) in B. napus, 88% in B. oleracea (AUC: 0.6, average precision‐recall score: 0.1, F1: 0.01) and 86% in B. rapa (AUC: 0.6, average precision‐recall score: 0.14, F1: 0.02) (Figure S9). Confusion matrices revealed that all models had an almost 99% accuracy in predicting whether a gene is core (98% accuracy in B. napus), but poor accuracy in predicting whether a gene is dispensable (16% accuracy in B. napus) (Table S14). This indicates that the features used in these models do not fully explain gene loss, but explain the extent of gene retention. It is possible that a portion of gene loss in Brassica is truly random, in which case the model has no means to explain gene loss. Another possible reason for the low predictability of variable genes in this model is that there are different types of variable genes that we currently cannot distinguish. Genes that are lost due to homeologous recombination are indistinguishable from novel genes created by Helitrons copying exons in the genome.
There may be yet‐undiscovered features linked with gene loss that we have not incorporated in the model. Recent studies using synthetic B. napus lines suggest that the pattern of homoeologous exchanges is predictable on the chromosome level (Bird et al., 2019) which indicates that incorporating additional, not yet generated data may improve the model’s accuracy.
We assessed feature importance for each of the three models using Shapley Additive Explanation (SHAP) (Lundberg and Lee, 2017) values. A large positive SHAP value for a feature indicates that the higher the feature value, the more likely the model is to predict a variable gene. A large negative SHAP value indicates that the higher the feature value, the more likely the model is to predict a core gene. A small SHAP value around 0 indicates no association between the feature and the prediction. The features with the strongest impact on gene loss propensity were the length of the chromosome the gene was located on and the distance from the centromeres. In the diploid pangenomes, proximity to transposable elements was among 13 and 12 of the top 20 predictors of gene loss propensity in B. rapa and B. oleracea, respectively; however, in the B. napus pangenome‐based model, transposable elements appeared only three times within the top 20 strongest predictors. In B. napus, membership in homoeologous blocks and position on different chromosomes were among the strongest ten predictors (Figure 4). This suggests that different mechanisms of gene loss dominate in the diploids and the amphidiploids, with homoeologous exchanges being most strongly linked with gene dispensability in B. napus, and transposable elements being most strongly linked with gene dispensability in B. rapa and B. oleracea (Figure 4).
Figure 4.
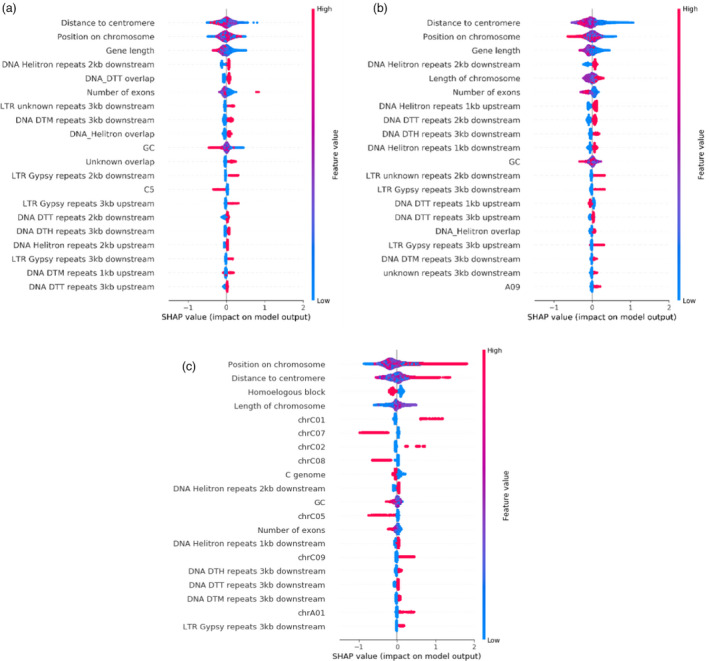
Impact of model output for the prediction of gene loss propensity measured via SHAP values for three XGBoost models trained for PAV data from B. oleracea (a), B. rapa (b) and B. napus (c). High feature values are displayed in red, low in blue. Twenty attributes with the strongest impact on the model are displayed. Binary variables are 1/0 encoded, so genes with a 1 for the dispensable C01 are located on the chromosome C01. In this case, high (red colour) with high SHAP values means that the presence of a gene on this chromosome is a stronger predictor of gene dispensability. The transposable element codes follow the nomenclature of (Wicker et al., 2007): DNA/DTT = CACTA, DNA/DTM = Mutator, DNA/DTH = PIF‐Harbinger.
We examined which rare factors have an impact on the prediction of gene loss propensity using the in‐built F‐score of XGBoost. In B. rapa, the strongest rare predictors of gene loss propensity were the presence of LTR and Helitron repeats, while in B. oleracea MITEs, LTRs and Helitron repeats were predominant (Figure S10). In B. napus, MITEs and pseudomolecule position were the strongest predictors of gene loss propensity. Interestingly, MITEs were common factors between B. oleracea and B. napus, suggesting that they play a greater role in the shared C genome.
When plotting the importance of ‘distance to centromere’ for each pseudomolecule separately, the B. napus model shows a clear pattern of increasing loss propensity distal to the centromeres, while in the corresponding plots for B. oleracea and B. rapa, gene loss propensity is distributed across the pseudomolecules (Figure 5). In wheat and B. napus, HEs show a similar pattern, with a greater number of HEs towards the telomeres (Zhang et al., 2020), and again indicates the importance of homoeologous recombination in predicting dispensable gene status in B. napus.
Subgenome dominance is a well‐established phenomenon in polyploids and has previously been observed for specific regions in B. napus (Wu et al., 2018; Xie et al., 2019; Zhou et al., 2016). However, studies of subgenome dominance differ in their methodology, with some focusing on differences in gene expression between homoeologous gene‐pairs, and others on gene loss. It has been shown that A subgenome regions are more likely to be replaced by C subgenome regions following homoeologous recombination (Bird et al., 2019; Hurgobin et al., 2018) but it is currently unclear if this is related to subgenome expression dominance.
Within B. napus, subgenome dominance has usually been observed through differences in gene expression levels between subgenomes (Bird et al., 2019) though it has also been associated with differential gene loss between the subgenomes (Hurgobin et al., 2018). Differential gene loss has also been linked to subgenome dominance in the tetraploid ancestors of A. thaliana (Thomas et al., 2006) and maize (Woodhouse et al., 2010). The pseudomolecules C01, C02 and C09 have the strongest association with gene loss propensity among the pseudomolecules tested. This agrees with previous observations showing preferential homoeologous exchange from the A subgenome to the C subgenome in B. napus (Hurgobin et al., 2018). Interestingly, these three chromosomes are also the fourth, second and third‐longest chromosomes in B. napus, suggesting that preferential loss may be associated with longer chromosomes, as previously observed (Chalhoub et al., 2014). However, the longest chromosome, C03, does not appear in the ranking of chromosomes associated with gene loss, suggesting that other mechanisms such as selection may prevent genes on C03 from being lost. Additional information such as variation in chromosome architecture and behaviour (e. g. crossover frequency) is likely to improve the accuracy of our models, as seen in B. rapa/B. oleracea where gene retention is associated with three‐dimensional chromosomal organization (Xie et al., 2019).
This study provides insights into the evolution of Brassica genomes through a comparative analysis of gene presence/absence variation at the species level. We have shown that gene loss propensity differs between the diploid progenitors of B. napus and highlight the genomic differences between synthetic and natural B. napus lines. We built models linking the physical location of genes with their gene loss propensity. These models show that the position of a gene on the chromosome is the strongest predictor of gene loss propensity in polyploid B. napus, while transposable elements have a greater role in gene loss in the diploids. These results pave the way for the application of machine learning methods to understanding the underlying biological and physical causes of gene presence/absence.
Methods
A new Darmor‐Bzh reference genome
A new Brassica napus cv. Darmor‐bzh reference genome assembly was assembled by NRGene using the DeNovoMAGICTM software platform (NRGene, Nes Ziona, Israel), a proprietary DeBruijn graph‐based assembler. This assembler used paired‐end Illumina reads (450 and 800 bp insert sizes) along with mate‐paired Illumina reads (2–4 and 8–10 kb insert sizes) with a total coverage >180×. Scaffolds were joined using 80× of 10× Chromium data and manually corrected using published genetic maps (Chalhoub et al., 2014). The scaffolds were ordered into pseudomolecules using the v4 assembly (Chalhoub et al., 2014) and RaGOO v1.02 (Alonge et al., 2019). Gene space completeness of both assemblies was assessed using BUSCO v5.1.2 (database: viridiplantae_odb10) (Simão et al., 2015). The two assemblies were aligned using minimap2 v2.18 and differences were visualized using pafr v0.0.2 (https://github.com/dwinter/pafr). Repeats in the new Darmor‐bzh assembly and the v4 assembly were searched using EDTA v1.9.6 (Ou et al., 2019) and mapped using RepeatMasker v2.0 (Smit and Hubley, 2008).
Construction of three new pangenomes
We assembled three pangenomes for B. napus, B. oleracea and B. rapa using the approach of Golicz et al., (2016). We used publicly available paired‐end Illumina reads with more than 9× coverage (except the reference cultivar Darmor‐bzh) of 87, 77 and 59 individuals for B. oleracea, B. rapa and B. napus respectively (Tables S15). We sequenced 20 additional B. napus individuals using Illumina HiSeq 3000 (PRJNA613532). This number of individuals is sufficient to capture the majority of gene content in the population as in previous pangenome assemblies, the rate with which novel gene content increases with each added individuals stops growing after 10 to 50 individuals (Gao et al., 2019; Golicz et al., 2016; Hurgobin et al., 2018; Montenegro et al., 2017).
We aligned these three datasets separately to the new B. napus assembly, the v2.1 B. oleracea assembly (Parkin et al., 2014) and the v3.0 B. rapa assembly (Zhang et al., 2018) respectively. Bowtie2 v2.2.9 (Langmead and Salzberg, 2012) was used for all read alignments (options: –end‐to‐end, –sensitive). The three sets of reads that did not align were assembled using MaSuRCA v3.2.3 (Zimin et al., 2013) into three pangenomes: one for B. oleracea using only B. oleracea individuals, one for B. rapa using only B. rapa individuals, and one for B. napus using only B. napus individuals. The resulting contigs were aligned with NCBI‐NR (accessed 2nd June 2019) using blast+ v2.5.0 (Camacho et al., 2009), and contigs with best hits outside the Viridiplantae were considered to be contamination and removed from subsequent steps.
Gene prediction
For each species pangenome and the reference genome, all publicly available paired RNASeq data (Table S16) were used in the BRAKER v2.0 (Hoff et al., 2019) gene prediction pipeline after each pangenome was soft‐masked using RepeatModeler (Smit and Hubley, 2008) and RepeatMasker (Smit et al., 1996) to avoid removing true genes (Bayer et al., 2018). BRAKER produces AUGUSTUS (Stanke et al., 2006) and GeneMark‐EX (Lomsadze et al., 2014) gene predictions. All RNASeq data were aligned using HISAT2 v2.1.0 (Kim et al., 2019) and converted into genome coordinates using StringTie v1.3.4 (Pertea et al., 2015). The RNASeq alignment coordinates were used together with RepeatModeler‐based repeat regions, AUGUSTUS and GeneMark‐EX predictions, and gene models of the already published B. oleracea v2.1 (Parkin et al., 2014), B. rapa v3 (Zhang et al., 2018) and B. napus v4 (Chalhoub et al., 2014) in the EVidenceModeler v1.1.1 (Haas et al., 2008) pipeline to produce final gene models. Gene models without RNASeq support and no hits in the previously published gene models were removed from the final annotation. Disease resistance gene analogue (RGA) candidates were predicted using RGaugury (Li et al., 2016).
Gene presence/absence calling
Gene presence/absence variation (PAV) was called using an approach based on SGSGeneLoss (Golicz et al., 2015). For each of the three pangenomes, we aligned all B. oleracea, B. rapa and B. napus reads using Bowtie2 v2.2.9 (Langmead and Salzberg, 2012). Mosdepth v0.2.2 (Pedersen and Quinlan, 2018) and bedtools v 2.27.0 (Quinlan and Hall, 2010) were used to calculate the coverage of all gene exons. Genes where all exon bases were covered by fewer than 2 reads and where the exons’ length was covered by less than 5% of their total length were deemed to be absent. While this may lead to some genes being incorrectly classified as present when they are absent, these parameters provide confidence that absent gene calls are truly absent. We used these results to calculate three PAV tables: one for the B. oleracea pangenome containing gene presence information all B. oleracea, B. rapa and B. napus individuals, one for the B. rapa pangenome containing gene presence information for all B. oleracea, B. rapa and B. napus individuals, and one for the B. napus pangenome containing gene presence information for all B. oleracea, B. rapa and B. napus individuals.
PAV‐based PCA modelling of dispensable and core genes and GO‐enrichment were performed using R v3.6.3 (R Core Team, 2020) using the packages logisticPCA (Landgraf and Lee, 2015), minpack.lm (Elzhov et al., 2010) and topGO (Alexa and Rahnenführer, 2009). GO‐terms were assigned to all proteins using PANNZER2 (Törönen et al., 2018) (accessed 5.7.2020, database: Viridiplantae). For each possible number of combinations of genomes, 500 000 pairs were chosen for the modelling of pangenome and core gene numbers.
Proteins were compared using DIAMOND v0.9.29.130 with the STRING v11 Arabidopsis database (Szklarczyk et al., 2019) to find proteins within functional networks. Association between network membership and gene status was assessed using the function chisq.test() implemented in R v3.6.3 (R Core Team, 2020). Genes were located within syntenic blocks by self‐comparison of the B. napus annotation using MCScanX (Wang et al., 2012).
Assessing gene loss propensity using machine learning
Gene absence was predicted by building three separate feature tables for the three genomes, using genes located on pseudomolecules only, and genes that are lost in at least 2 individuals. The feature tables contained for each gene: which pseudomolecule the gene is located on, GC content, distance to the end of the pseudomolecule, overlap/1kb/2kb/3kb distance to de novo predicted transposon‐classes as predicted by EDTA v1.9.6 (Ou et al., 2019), distance to the centromeres as described in (Mason et al., 2016), and, for B. napus, whether a gene was located within a syntenic block. Genes variable only in synthetic individuals were assumed to be core. Accuracy, F1‐score and AUC‐scores were compared between five machine learning approaches (logistic regression, Gaussian Naïve Bayes, Random Forest, AdaBoost and XGBoost). Three different XGBoost v1.0.2 models (Chen and Guestrin, 2016) were trained using the three PAV feature tables for the B. oleracea, B. rapa and B. napus pangenomes. For this we removed the PAV information of the other species – i.e. the B. oleracea pangenome gene feature table contained only information as to whether a gene was variable of B. oleracea individuals, not B. rapa or B. napus individuals.
Scikit‐learn v0.21.3 (Pedregosa et al., 2011) was used to calculate supporting statistics such as F1‐score, receiver operating characteristic curves and prediction accuracy. The feature table was split into an 80/20 training/test dataset while stratifying for the gene PAV output using scikit‐learn’s train_test_split() function with a random state of 123. Sample weights were computed using the compute_sample_weight function in scikit‐learn. The following XGBoost parameters were optimized using scikit‐optimize BayesSearchCV: learning_rate (step size shrinkage used in updates to prevent overfitting), min_child_weight (minimum sum of instance weight needed in child, used to decide whether to stop partitioning), max_depth (maximum depth of a tree), max_delta_step (maximum delta step for each leaf update), subsample (subsample ratio of all training instances), colsample_by_tree (subsample ratio of columns when constructing trees), colsample_by_level (subsample ratio of columns for each level), reg_lambda (L2 regularization term on weights), reg_alpha (L1 regularization term on weights), gamma (minimum loss reduction required to make a further partition), n_estimators (number of trees in the model) and scale_pos_weight (controls the balance of positive and negative weights) (Head et al., 2018). Model metrics were calculated using the scikit‐learn functions confusion_matrix, accuracy_score, roc_auc_score and f1_score, Feature importance in the trained models was assessed using TreeExplainer in Shapley Additive Explanations (SHAP) v0.31.0 (Lundberg and Lee, 2017).
Conflict of Interests
The authors declare no conflict of interests.
Author Contributions
PEB conceived the research. PEB, AS, AAG, YY and RA carried out the research.
SF, HL, HSC, IB, HR, SR, LJ, SL, MSB, ES, XW, GJK. JCP, BC, WJS and contributed to the genome assembly. YPL contributed additional B. rapa seeds. PEB, JB and DE co‐wrote the manuscript. All authors read and contributed to the manuscript.
Supporting information
Figure S1 Comparison between the v4.1 assembly (Chalhoub et al., 2014) and the new v9 assembly.
Figure S2 Comparison of repeat content by class in Mbp between the two assemblies showing that the six most abundant classes have roughly doubled in size in the v9 assembly.
Figure S3 Number of core and dispensable genes for the A and the C genome, compared between B. napus (with and without synthetic lines) and B. rapa/B. oleracea.
Figure S4 (a) NLR‐genes compared between B. napus, B. rapa and B. oleracea, along with additional pangenome contigs.
Figure S5 PCA plots based on PAV patterns of genes located on each chromosome in B. napus split into subgenomes A and C (subfigures A and B respectively) showing strong divergence in PAV patterns between some chromosomes of the B. napus A and the C subgenome, especially C03, C09, A05 and A07.
Figure S6 PCA plot showing divergence of individuals based on gene presence/absence patterns on the A genome. A) chromosome A01, B) A02, C) A03, D) A04, E) A05, F) A06, G) A07, H) A08, I) A09 and J) A10. FPSc: Fast Plants, self‐compatible.
Figure S7 PCA plot showing divergence of individuals based on gene presence/absence patterns on the C genome.
Figure S8 Different kinds of reciprocal and non‐reciprocal inheritances after homoeologous recombination in B. napus.
Figure S9 Receiver‐operating curves comparing the three XGBoost models trained on B. oleracea, B. rapa and B. napus data respectively.
Figure S10 Twenty features with the strongest impact on the B. rapa (A), B. oleracea (B) and B. napus (C) models measured by relative quantity as assessed using XGBoost’s inbuilt feature importance methods (‘cover’), showing that in rare feature attributes, the B. oleracea and the B. rapa model focus mostly on retrotransposons in its best‐predicting attributes, and in B. napus, the best predictors are pseudomolecule membership.
Table S1 BUSCO results for B. napus v4.1 (Chalhoub et al., 2014) and the new NRGene v9 assembly.
Table S2 Comparison of repeats between B. napus v4.1 and v9 assembly.
Table S3 Comparison of repeats between B. napus v4.1 and v9 assembly.
Table S4 Comparison of repeats between B. napus v4.1 and v9 assembly.
Table S5 Top 15 enriched GO terms in the dispensable genes of B. oleracea, B. rapa, B. napus, and B. napus without synthetic lines.
Table S6 Numbers of core and dispensable genes in STRING functional networks without synthetic lines.
Table S7 Count of transposable elements per pseudomolecule in the B. oleracea assembly.
Table S8 Total length (Mbp) of transposable elements per pseudomolecule in the B. oleracea assembly.
Table S9 Total length (Mbp) of transposable elements as percentage of total pseudomolecule length in the B. oleracea assembly.
Table S10 Count of transposable elements per pseudomolecule in the B. rapa assembly.
Table S11 Total length (Mbp) of transposable elements per pseudomolecule in the B. rapa assembly.
Table S12 Total length (bp) of transposable elements as percentage of total pseudomolecule length in the B. rapa assembly.
Table S13 Comparison of models using the B. napus gene loss data.
Table S14 Confusion matrix for the three XGBoost models trained on B. oleracea, B. rapa, and B. napus data.
Table S15 Data used for the assembly of the three pangenomes.
Table S16 RNASeq data used for the annotation of the three pangenomes.
Acknowledgements
This work is funded by the Australia Research Council (Projects DP1601004497, LP140100537 and LP130100925), and resources provided by the Pawsey Supercomputing Centre with funding from the Australian Government and the Government of Western Australia. Dr. Philipp Bayer acknowledges the support of the Forrest Research Foundation. YP Lim was supported by Korea Institute of Planning and Evaluation for Technology in Food, Agriculture, and Forestry (IPET) through Golden Seed Project (213006‐05‐4‐SB110), funded by Ministry of Agriculture, Food and Rural Affairs (MAFRA), Ministry of Oceans and Fisheries (MOF), Rural Development Administration (RDA) and Korea Forest Services (KFS), South Korea. This work was supported by UK Biotechnology and Biological Sciences Research Council BB/L002124/1 and BB/R019819/1 to IB.
Bayer, P. E. , Scheben, A. , Golicz, A. A. , Yuan, Y. , Faure, S. , Lee, H. , Chawla, H. S. , Anderson, R. , Bancroft, I. , Raman, H. , Lim, Y. P. , Robbens, S. , Jiang, L. , Liu, S. , Barker, M. S. , Schranz, M. E. , Wang, X. , King, G. J. , Pires, J. C. , Chalhoub, B. , Snowdon, R. J. , Batley, J. and Edwards, D. (2021) Modelling of gene loss propensity in the pangenomes of three Brassica species suggests different mechanisms between polyploids and diploids. Plant Biotechnol. J., 10.1111/pbi.13674
Data availability
All code generated for this study is available at https://github.com/AppliedBioinformatics/Brassica_oleracea_rapa_napus_code
All data generated for this study is available at BioProject PRJNA613532. The assemblies, annotations, PAV‐matrices and other supporting data are available at https://doi.org/10.26182/5f1936836a1c4 and http://brassicagenome.net/databases.php. JBrowse (Buels et al., 2016) and KnetMiner (Hassani‐Pak et al., 2020) instances are available at http://brassicagenome.net/databases.php.
References
- Adams, K.L. , Cronn, R. , Percifield, R. and Wendel, J.F. (2003) Genes duplicated by polyploidy show unequal contributions to the transcriptome and organ‐specific reciprocal silencing. Proc. Natl Acad. Sci. USA, 100, 4649–4654. [DOI] [PMC free article] [PubMed] [Google Scholar]
- Alexa, A. and Rahnenführer, J. (2009) Gene set enrichment analysis with topGO. Bioconductor Improve, 27, 1–26. [Google Scholar]
- Alix, K. , Joets, J. , Ryder, C.D. , Moore, J. , Barker, G.C. , Bailey, J.P. , King, G.J. et al. (2008) The CACTA transposon Bot1 played a major role in Brassica genome divergence and gene proliferation. Plant J. 56, 1030–1044. [DOI] [PubMed] [Google Scholar]
- Allainguillaume, J. , Alexander, M. , Bullock, J. , Saunders, M. , Allender, C.J. , King, G. , Ford, C.S. et al. (2006) Fitness of hybrids between rapeseed (Brassica napus) and wild Brassica rapa in natural habitats. Mol. Ecol. 15, 1175–1184. [DOI] [PubMed] [Google Scholar]
- Allender, C.J. and King, G.J. (2010) Origins of the amphiploid species Brassica napus L. investigated by chloroplast and nuclear molecular markers. BMC Plant Biol. 10, 54. [DOI] [PMC free article] [PubMed] [Google Scholar]
- Alonge, M. , Soyk, S. , Ramakrishnan, S. , Wang, X. , Goodwin, S. , Sedlazeck, F.J. , Lippman, Z.B. et al. (2019) RaGOO: fast and accurate reference‐guided scaffolding of draft genomes. Genome Biol. 20, 1–17. [DOI] [PMC free article] [PubMed] [Google Scholar]
- An, H. , Qi, X. , Gaynor, M.L. , Hao, Y. , Gebken, S.C. , Mabry, M.E. , McAlvay, A.C. et al. 2019) Transcriptome and organellar sequencing highlights the complex origin and diversification of allotetraploid Brassica napus . Nat. Commun. 10, 2878. [DOI] [PMC free article] [PubMed] [Google Scholar]
- Bayer, P.E. , Edwards, D. and Batley, J. (2018) Bias in resistance gene prediction due to repeat masking. Nat. Plants, 4, 762. [DOI] [PubMed] [Google Scholar]
- Bayer, P.E. , Golicz, A.A. , Tirnaz, S. , Chan, C.K. , Edwards, D. and Batley, J. (2019) Variation in abundance of predicted resistance genes in the Brassica oleracea pangenome. Plant Biotechnol. J. 17, 789–800. [DOI] [PMC free article] [PubMed] [Google Scholar]
- Bayer, P.E. , Golicz, A.A. , Scheben, A. , Batley, J. and Edwards, D. (2020) Plant pan‐genomes as the new reference. Nat. Plants 6, 914–920. [DOI] [PubMed] [Google Scholar]
- Berkman, P.J. , Visendi, P. , Lee, H.C. , Stiller, J. , Manoli, S. , Lorenc, M.T. , Lai, K. et al. (2013) Dispersion and domestication shaped the genome of bread wheat. Plant Biotechnol. J. 11, 564–571. [DOI] [PubMed] [Google Scholar]
- Bird, K.A. , Niederhuth, C. , Ou, S. , Gehan, M. , Chris Pires, J. , Xiong, Z. , VanBuren, R. et al. (2019) Replaying the evolutionary tape to investigate subgenome dominance in allopolyploid Brassica napus . bioRxiv, 814491. [DOI] [PMC free article] [PubMed]
- Brands, A. and Ho, T.H. (2002) Function of a plant stress‐induced gene, HVA22. Synthetic enhancement screen with its yeast homolog reveals its role in vesicular traffic. Plant Physiol. 130, 1121–1131. [DOI] [PMC free article] [PubMed] [Google Scholar]
- Buels, R. , Yao, E. , Diesh, C.M. , Hayes, R.D. , Munoz‐Torres, M. , Helt, G. , Goodstein, D.M. et al. (2016) JBrowse: a dynamic web platform for genome visualization and analysis. Genome Biol. 17, 66. [DOI] [PMC free article] [PubMed] [Google Scholar]
- Camacho, C. , Coulouris, G. , Avagyan, V. , Ma, N. , Papadopoulos, J. , Bealer, K. and Madden, T.L. (2009) BLAST+: architecture and applications. BMC Bioinformatics, 10, 421. [DOI] [PMC free article] [PubMed] [Google Scholar]
- Chalhoub, B. , Denoeud, F. , Liu, S. , Parkin, I.A. , Tang, H. , Wang, X. , Chiquet, J. et al. (2014) Early allopolyploid evolution in the post‐Neolithic Brassica napus oilseed genome. Science, 345, 950–953. [DOI] [PubMed] [Google Scholar]
- Chen, T. and Guestrin, C. (2016) Xgboost: a scalable tree boosting system. Proceedings of the 22nd ACM Sigkdd International Conference on Knowledge Discovery and Data Mining, pp. 785–794. ACM, New York, NY, USA. [Google Scholar]
- Chen, X. , Tong, C. , Zhang, X. , Song, A. , Hu, M. , Dong, W. , Chen, F. et al. (2021) A high‐quality Brassica napus genome reveals expansion of transposable elements, subgenome evolution and disease resistance. Plant Biotechnol. J. 19, 615–630. [DOI] [PMC free article] [PubMed] [Google Scholar]
- Chen, Z.J. , Sreedasyam, A. , Ando, A. , Song, Q. , De Santiago, L.M. , Hulse‐Kemp, A.M. , Ding, M. et al. (2020) Genomic diversifications of five Gossypium allopolyploid species and their impact on cotton improvement. Nat. Genet. 52, 525–533. [DOI] [PMC free article] [PubMed] [Google Scholar]
- Cheng, F. , Wu, J. and Wang, X. (2014) Genome triplication drove the diversification of Brassica plants. Hortic. Res. 1, 14024. [DOI] [PMC free article] [PubMed] [Google Scholar]
- Edger, P.P. , Poorten, T.J. , VanBuren, R. , Hardigan, M.A. , Colle, M. , McKain, M.R. , Smith, R.D. et al. (2019) Origin and evolution of the octoploid strawberry genome. Nat. Genet. 51, 541–547. [DOI] [PMC free article] [PubMed] [Google Scholar]
- Edger, P.P. , Smith, R. , McKain, M.R. , Cooley, A.M. , Vallejo‐Marin, M. , Yuan, Y. , Bewick, A.J. et al. (2017) Subgenome dominance in an interspecific hybrid, synthetic allopolyploid, and a 140‐year‐old naturally established neo‐allopolyploid monkeyflower. Plant Cell, 29, 2150–2167. [DOI] [PMC free article] [PubMed] [Google Scholar]
- Elzhov, T.V. , Mullen, K.M. and Bolker, B. (2010) R interface to the Levenberg‐Marquardt nonlinear least‐squares algorithm found in MINPACK. Plus Support for Bounds. 1.2‐1.
- Gao, C. , Zhou, G. , Ma, C. , Zhai, W. , Zhang, T. , Liu, Z. , Yang, Y. et al. (2016) Helitron‐like transposons contributed to the mating system transition from out‐crossing to self‐fertilizing in polyploid Brassica napus L. Sci. Rep. 6, 33785. [DOI] [PMC free article] [PubMed] [Google Scholar]
- Gao, L. , Gonda, I. , Sun, H. , Ma, Q. , Bao, K. , Tieman, D.M. , Burzynski‐Chang, E.A. et al. (2019) The tomato pan‐genome uncovers new genes and a rare allele regulating fruit flavor. Nat. Genet. 51, 1044–1051. [DOI] [PubMed] [Google Scholar]
- Golicz, A.A. , Bayer, P.E. , Barker, G.C. , Edger, P.P. , Kim, H. , Martinez, P.A. , Chan, C.K. et al. (2016) The pangenome of an agronomically important crop plant Brassica oleracea . Nat. Commun. 7, 13390. [DOI] [PMC free article] [PubMed] [Google Scholar]
- Golicz, A.A. , Martinez, P.A. , Zander, M. , Patel, D.A. , Van De Wouw, A.P. , Visendi, P. , Fitzgerald, T.L. et al. (2015) Gene loss in the fungal canola pathogen Leptosphaeria maculans . Funct. Integr. Genomics, 15, 189–196. [DOI] [PubMed] [Google Scholar]
- Haas, B.J. , Salzberg, S.L. , Zhu, W. , Pertea, M. , Allen, J.E. , Orvis, J. , White, O. et al. (2008) Automated eukaryotic gene structure annotation using EVidenceModeler and the Program to Assemble Spliced Alignments. Genome Biol. 9, R7. [DOI] [PMC free article] [PubMed] [Google Scholar]
- Hassani‐Pak, K. , Singh, A. , Brandizi, M. , Hearnshaw, J. , Amberkar, S. , Phillips, A.L. , Doonan, J.H. and Rawlings, C. (2020) KnetMiner: a comprehensive approach for supporting evidence‐based gene discovery and complex trait analysis across species. bioRxiv. [DOI] [PMC free article] [PubMed]
- Head, T. , MechCoder, L. and Shcherbatyi, I. (2018) scikit‐optimize/scikit‐optimize: v0. 5.2. Zenodo.
- Hoff, K.J. , Lomsadze, A. , Borodovsky, M. and Stanke, M. (2019) Whole‐genome annotation with BRAKER. Methods Mol. Biol. 1962, 65–95. [DOI] [PMC free article] [PubMed] [Google Scholar]
- Hu, K. , Xu, K. , Wen, J. , Yi, B. , Shen, J. , Ma, C. , Fu, T. et al. (2019) Helitron distribution in Brassicaceae and whole genome Helitron density as a character for distinguishing plant species. BMC Bioinformatics, 20, 1–20. [DOI] [PMC free article] [PubMed] [Google Scholar]
- Hübner, S. , Bercovich, N. , Todesco, M. , Mandel, J.R. , Odenheimer, J. , Ziegler, E. , Lee, J.S. et al. 2019) Sunflower pan‐genome analysis shows that hybridization altered gene content and disease resistance. Nat. Plants, 5, 54. [DOI] [PubMed] [Google Scholar]
- Hurgobin, B. and Edwards, D. (2017) SNP discovery using a pangenome: has the single reference approach become obsolete? Biology, 6, 21. [DOI] [PMC free article] [PubMed] [Google Scholar]
- Hurgobin, B. , Golicz, A.A. , Bayer, P.E. , Chan, C.K.K. , Tirnaz, S. , Dolatabadian, A. , Schiessl, S.V. et al. (2018) Homoeologous exchange is a major cause of gene presence/absence variation in the amphidiploid Brassica napus . Plant Biotechnol. J. 16, 1265–1274. [DOI] [PMC free article] [PubMed] [Google Scholar]
- Kim, D. , Paggi, J.M. , Park, C. , Bennett, C. and Salzberg, S.L. (2019) Graph‐based genome alignment and genotyping with HISAT2 and HISAT‐genotype. Nat. Biotechnol. 37, 907–915. [DOI] [PMC free article] [PubMed] [Google Scholar]
- Kitashiba, H. and Nasrallah, J.B. (2014) Self‐incompatibility in Brassicaceae crops: lessons for interspecific incompatibility. Breed. Sci. 64, 23–37. [DOI] [PMC free article] [PubMed] [Google Scholar]
- Krylov, D.M. , Wolf, Y.I. , Rogozin, I.B. and Koonin, E.V. (2003) Gene loss, protein sequence divergence, gene dispensability, expression level, and interactivity are correlated in eukaryotic evolution. Genome Res. 13, 2229–2235. [DOI] [PMC free article] [PubMed] [Google Scholar]
- Landgraf, A.J. and Lee, Y. (2015) Dimensionality reduction for binary data through the projection of natural parameters. arXiv preprint arXiv:1510.06112.
- Langmead, B. and Salzberg, S.L. (2012) Fast gapped‐read alignment with Bowtie 2. Nat. Methods, 9, 357–359. [DOI] [PMC free article] [PubMed] [Google Scholar]
- Li, P. , Quan, X. , Jia, G. , Xiao, J. , Cloutier, S. and You, F.M. (2016) RGAugury: a pipeline for genome‐wide prediction of resistance gene analogs (RGAs) in plants. BMC Genom. 17, 852. [DOI] [PMC free article] [PubMed] [Google Scholar]
- Liu, J. , Zhou, R. , Wang, W. , Wang, H. , Qiu, Y. , Raman, R. , Mei, D. et al. (2020a) A copia like‐retrotransposon insertion in the upstream region of SHATTERPROOF 1 gene, BnSHP1. A9 is associated with quantitative variation in pod shattering resistance in oilseed rape. J. Exp. Bot. 71, 5402–5413. [DOI] [PMC free article] [PubMed] [Google Scholar]
- Liu, Y. , Du, H. , Li, P. , Shen, Y. , Peng, H. , Liu, S. , Zhou, G.‐A. et al. (2020b) Pan‐genome of wild and cultivated soybeans. Cell, 182, 162–176.e13. [DOI] [PubMed] [Google Scholar]
- Lomsadze, A. , Burns, P.D. and Borodovsky, M. (2014) Integration of mapped RNA‐Seq reads into automatic training of eukaryotic gene finding algorithm. Nucleic Acids Res. 42, e119. [DOI] [PMC free article] [PubMed] [Google Scholar]
- Lu, K. , Wei, L. , Li, X. , Wang, Y. , Wu, J. , Liu, M. , Zhang, C. et al. (2019) Whole‐genome resequencing reveals Brassica napus origin and genetic loci involved in its improvement. Nat. Commun. 10, 1154. [DOI] [PMC free article] [PubMed] [Google Scholar]
- Lundberg, S.M. and Lee, S.‐I. (2017) A unified approach to interpreting model predictions. Advances in Neural Information Processing Systems, pp. 4765–4774. Curran Associates Inc., Red Hook, NY, USA: [Google Scholar]
- Mason, A.S. , Rousseau‐Gueutin, M. , Morice, J. , Bayer, P.E. , Besharat, N. , Cousin, A. , Pradhan, A. et al. (2016) Centromere locations in Brassica A and C genomes revealed through half‐tetrad analysis. Genetics, 202, 513–523. [DOI] [PMC free article] [PubMed] [Google Scholar]
- Montenegro, J.D. , Golicz, A.A. , Bayer, P.E. , Hurgobin, B. , Lee, HueyTyng , Chan, C.‐K. , Visendi, P. et al. (2017) The pangenome of hexaploid bread wheat. Plant J. 90, 1007–1013. [DOI] [PubMed] [Google Scholar]
- Nagaharu, U. (1935) Genome analysis in Brassica with special reference to the experimental formation of B. napus and peculiar mode of fertilization. Jpn J. Botany, 7, 389–452. [Google Scholar]
- Nasrallah, J.B. (1997) Evolution of the Brassica self‐incompatibility locus: a look into S‐locus gene polymorphisms. Proc. Natl Acad. Sci. USA, 94, 9516–9519. [DOI] [PMC free article] [PubMed] [Google Scholar]
- Ou, S. , Su, W. , Liao, Y.i. , Chougule, K. , Agda, J.R.A. , Hellinga, A.J. , Lugo, C.S.B. et al. (2019) Benchmarking transposable element annotation methods for creation of a streamlined, comprehensive pipeline. Genome Biol. 20, 1–18. [DOI] [PMC free article] [PubMed] [Google Scholar]
- Parkin, I.A. , Koh, C. , Tang, H. , Robinson, S.J. , Kagale, S. , Clarke, W.E. , Town, C.D. et al. (2014) Transcriptome and methylome profiling reveals relics of genome dominance in the mesopolyploid Brassica oleracea . Genome Biol. 15, R77. [DOI] [PMC free article] [PubMed] [Google Scholar]
- Pedersen, B.S. and Quinlan, A.R. (2018) Mosdepth: quick coverage calculation for genomes and exomes. Bioinformatics, 34, 867–868. [DOI] [PMC free article] [PubMed] [Google Scholar]
- Pedregosa, F. , Varoquaux, G. , Gramfort, A. , Michel, V. , Thirion, B. , Grisel, O. , Blondel, M. et al. (2011) Scikit‐learn: Machine learning in Python. J Machine Learning Res. 12, 2825–2830. [Google Scholar]
- Pele, A. , Falque, M. , Trotoux, G. , Eber, F. , Negre, S. , Gilet, M. , Huteau, V. et al. (2017) Amplifying recombination genome‐wide and reshaping crossover landscapes in Brassicas. PLoS Genet. 13, e1006794. [DOI] [PMC free article] [PubMed] [Google Scholar]
- Pertea, M. , Pertea, G.M. , Antonescu, C.M. , Chang, T.C. , Mendell, J.T. and Salzberg, S.L. (2015) StringTie enables improved reconstruction of a transcriptome from RNA‐seq reads. Nat. Biotechnol. 33, 290–295. [DOI] [PMC free article] [PubMed] [Google Scholar]
- Quinlan, A.R. and Hall, I.M. (2010) BEDTools: a flexible suite of utilities for comparing genomic features. Bioinformatics, 26, 841–842. [DOI] [PMC free article] [PubMed] [Google Scholar]
- R Core Team . (2020) R: A language and environment for statistical computing. R Foundation for Statistical Computing, Vienna, Austria. [Google Scholar]
- Rong, J. , Feltus, F.A. , Liu, L. , Lin, L. and Paterson, A.H. (2010) Gene copy number evolution during tetraploid cotton radiation. Heredity (Edinb), 105, 463–472. [DOI] [PubMed] [Google Scholar]
- Schmutzer, T. , Samans, B. , Dyrszka, E. , Ulpinnis, C. , Weise, S. , Stengel, D. , Colmsee, C. et al. (2015) Species‐wide genome sequence and nucleotide polymorphisms from the model allopolyploid plant Brassica napus . Scientific Data, 2, 150072. [DOI] [PMC free article] [PubMed] [Google Scholar]
- Schnable, J.C. , Springer, N.M. and Freeling, M. (2011) Differentiation of the maize subgenomes by genome dominance and both ancient and ongoing gene loss. Proc. Natl Acad. Sci. USA, 108, 4069–4074. [DOI] [PMC free article] [PubMed] [Google Scholar]
- Schoenrock, A. , Burnside, D. , Moteshareie, H. , Pitre, S. , Hooshyar, M. , Green, J.R. , Golshani, A. et al. (2017) Evolution of protein‐protein interaction networks in yeast. PLoS One, 12, e0171920. [DOI] [PMC free article] [PubMed] [Google Scholar]
- Sharpe, A. , Parkin, I. , Keith, D. and Lydiate, D. (1995) Frequent nonreciprocal translocations in the amphidiploid genome of oilseed rape (Brassica napus). Genome, 38, 1112–1121. [DOI] [PubMed] [Google Scholar]
- Simão, F.A. , Waterhouse, R.M. , Ioannidis, P. , Kriventseva, E.V. and Zdobnov, E.M. (2015) BUSCO: assessing genome assembly and annotation completeness with single‐copy orthologs. Bioinformatics, 31, 3210–3212. [DOI] [PubMed] [Google Scholar]
- Smit, A.F. , Hubley, R. and Green, P. (1996) 2010 RepeatMasker Open‐3.0. http://www.repeatmasker.org
- Smit, A.F. and Hubley, R. (2008) RepeatModeler Open‐1.0. Available fom http://www.repeatmasker.org/
- Song, J.‐M. , Guan, Z. , Hu, J. , Guo, C. , Yang, Z. , Wang, S. , Liu, D. et al. (2020) Eight high‐quality genomes reveal pan‐genome architecture and ecotype differentiation of Brassica napus . Nat. Plants, 6, 34–45. [DOI] [PMC free article] [PubMed] [Google Scholar]
- Song, K. and Osborn, T.C. (1992) Polyphyletic origins of Brassica napus: new evidence based on organelle and nuclear RFLP analyses. Genome, 35, 992–1001. [Google Scholar]
- Stanke, M. , Keller, O. , Gunduz, I. , Hayes, A. , Waack, S. and Morgenstern, B. (2006) AUGUSTUS: ab initio prediction of alternative transcripts. Nucleic Acids Res. 34, W435–439. [DOI] [PMC free article] [PubMed] [Google Scholar]
- Sun, D. , Wang, C. , Zhang, X. , Zhang, W. , Jiang, H. , Yao, X. , Liu, L. et al. (2019) Draft genome sequence of cauliflower (Brassica oleracea L. var. botrytis) provides new insights into the C genome in Brassica species. Hortic. Res. 6, 1–11. [DOI] [PMC free article] [PubMed] [Google Scholar]
- Sun, X.‐L. , Yu, Q.‐Y. , Tang, L.‐L. , Ji, W. , Bai, X. , Cai, H. , Liu, X.‐F. et al. (2013) GsSRK, a G‐type lectin S‐receptor‐like serine/threonine protein kinase, is a positive regulator of plant tolerance to salt stress. J. Plant Physiol. 170, 505–515. [DOI] [PubMed] [Google Scholar]
- Szklarczyk, D. , Gable, A.L. , Lyon, D. , Junge, A. , Wyder, S. , Huerta‐Cepas, J. , Simonovic, M. et al. (2019) STRING v11: protein‐protein association networks with increased coverage, supporting functional discovery in genome‐wide experimental datasets. Nucleic Acids Res. 47, D607–D613. [DOI] [PMC free article] [PubMed] [Google Scholar]
- Thomas, B.C. , Pedersen, B. and Freeling, M. (2006) Following tetraploidy in an Arabidopsis ancestor, genes were removed preferentially from one homeolog leaving clusters enriched in dose‐sensitive genes. Genome Res. 16, 934–946. [DOI] [PMC free article] [PubMed] [Google Scholar]
- Törönen, P. , Medlar, A. and Holm, L. (2018) PANNZER2: a rapid functional annotation web server. Nucleic Acids Res. 46, W84–W88. [DOI] [PMC free article] [PubMed] [Google Scholar]
- Wang, Y. , Tang, H. , Debarry, J.D. , Tan, X. , Li, J. , Wang, X. , Lee, T.H. et al. (2012) MCScanX: a toolkit for detection and evolutionary analysis of gene synteny and collinearity. Nucleic Acids Res. 40, e49. [DOI] [PMC free article] [PubMed] [Google Scholar]
- Wicker, T. , Sabot, F. , Hua‐Van, A. , Bennetzen, J.L. , Capy, P. , Chalhoub, B. , Flavell, A. et al. (2007) A unified classification system for eukaryotic transposable elements. Nat. Rev. Genet. 8, 973–982. [DOI] [PubMed] [Google Scholar]
- Woodhouse, M.R. , Schnable, J.C. , Pedersen, B.S. , Lyons, E. , Lisch, D. , Subramaniam, S. and Freeling, M. (2010) Following tetraploidy in maize, a short deletion mechanism removed genes preferentially from one of the two homologs. PLoS Biol. 8, e1000409. [DOI] [PMC free article] [PubMed] [Google Scholar]
- Wu, D. , Liang, Z. , Yan, T. , Xu, Y. , Xuan, L. , Tang, J. , Zhou, G. et al. (2019) Whole‐genome resequencing of a worldwide collection of rapeseed accessions reveals the genetic basis of ecotype divergence. Mol. Plant, 12, 30–43. [DOI] [PubMed] [Google Scholar]
- Wu, J. , Lin, L. , Xu, M. , Chen, P. , Liu, D. , Sun, Q. , Ran, L. et al. (2018) Homoeolog expression bias and expression level dominance in resynthesized allopolyploid Brassica napus . BMC Genom. 19, 586. [DOI] [PMC free article] [PubMed] [Google Scholar]
- Xie, T. , Zhang, F.‐G. , Zhang, H.‐Y. , Wang, X.‐T. , Hu, J.‐H. and Wu, X.‐M. (2019) Biased gene retention during diploidization in Brassica linked to three‐dimensional genome organization. Nat. Plants, 5, 822–832. [DOI] [PubMed] [Google Scholar]
- Yang, Z. , Gong, Q. , Qin, W. , Yang, Z. , Cheng, Y. , Lu, L. , Ge, X. et al. (2017) Genome‐wide analysis of WOX genes in upland cotton and their expression pattern under different stresses. BMC Plant Biol. 17, 113. [DOI] [PMC free article] [PubMed] [Google Scholar]
- Yu, J. , Golicz, A.A. , Lu, K. , Dossa, K. , Zhang, Y. , Chen, J. , Wang, L. et al. (2019) Insight into the evolution and functional characteristics of the pan‐genome assembly from sesame landraces and modern cultivars. Plant Biotechnol. J. 17, 881–892. [DOI] [PMC free article] [PubMed] [Google Scholar]
- Zhang, L. , Cai, X. , Wu, J. , Liu, M. , Grob, S. , Cheng, F. , Liang, J. et al. (2018) Improved Brassica rapa reference genome by single‐molecule sequencing and chromosome conformation capture technologies. Hortic. Res. 5, 50. [DOI] [PMC free article] [PubMed] [Google Scholar]
- Zhang, X. , Wang, L. , Yuan, Y. , Tian, D. and Yang, S. (2011) Rapid copy number expansion and recent recruitment of domains in S‐receptor kinase‐like genes contribute to the origin of self‐incompatibility. FEBS J. 278, 4323–4337. [DOI] [PubMed] [Google Scholar]
- Zhang, Z. , Gou, X. , Xun, H. , Bian, Y. , Ma, X. , Li, J. , Li, N. et al. (2020) Homoeologous exchanges occur through intragenic recombination generating novel transcripts and proteins in wheat and other polyploids. Proc. Natl Acad. Sci. USA, 117, 14561–14571. [DOI] [PMC free article] [PubMed] [Google Scholar]
- Zhao, J. , Bayer, P. , Ruperao, P. , Saxena, R. , Khan, A. , Golicz, A. , Nguyen, H. et al. (2020) Trait associations in the pangenome of pigeon pea (Cajanus cajan). Plant Biotechnol. J. 18, 1946–1954. [DOI] [PMC free article] [PubMed] [Google Scholar]
- Zhao, Q. , Feng, Q. , Lu, H. , Li, Y. , Wang, A. , Tian, Q. , Zhan, Q. et al. (2018) Pan‐genome analysis highlights the extent of genomic variation in cultivated and wild rice. Nat. Genet. 50, 278–284. [DOI] [PubMed] [Google Scholar]
- Zhou, J. , Tan, C. , Cui, C. , Ge, X. and Li, Z. (2016) Distinct subgenome stabilities in synthesized Brassica allohexaploids. Theor. Appl. Genet. 129, 1257–1271. [DOI] [PubMed] [Google Scholar]
- Zimin, A.V. , Marcais, G. , Puiu, D. , Roberts, M. , Salzberg, S.L. and Yorke, J.A. (2013) The MaSuRCA genome assembler. Bioinformatics, 29, 2669–2677. [DOI] [PMC free article] [PubMed] [Google Scholar]
Associated Data
This section collects any data citations, data availability statements, or supplementary materials included in this article.
Supplementary Materials
Figure S1 Comparison between the v4.1 assembly (Chalhoub et al., 2014) and the new v9 assembly.
Figure S2 Comparison of repeat content by class in Mbp between the two assemblies showing that the six most abundant classes have roughly doubled in size in the v9 assembly.
Figure S3 Number of core and dispensable genes for the A and the C genome, compared between B. napus (with and without synthetic lines) and B. rapa/B. oleracea.
Figure S4 (a) NLR‐genes compared between B. napus, B. rapa and B. oleracea, along with additional pangenome contigs.
Figure S5 PCA plots based on PAV patterns of genes located on each chromosome in B. napus split into subgenomes A and C (subfigures A and B respectively) showing strong divergence in PAV patterns between some chromosomes of the B. napus A and the C subgenome, especially C03, C09, A05 and A07.
Figure S6 PCA plot showing divergence of individuals based on gene presence/absence patterns on the A genome. A) chromosome A01, B) A02, C) A03, D) A04, E) A05, F) A06, G) A07, H) A08, I) A09 and J) A10. FPSc: Fast Plants, self‐compatible.
Figure S7 PCA plot showing divergence of individuals based on gene presence/absence patterns on the C genome.
Figure S8 Different kinds of reciprocal and non‐reciprocal inheritances after homoeologous recombination in B. napus.
Figure S9 Receiver‐operating curves comparing the three XGBoost models trained on B. oleracea, B. rapa and B. napus data respectively.
Figure S10 Twenty features with the strongest impact on the B. rapa (A), B. oleracea (B) and B. napus (C) models measured by relative quantity as assessed using XGBoost’s inbuilt feature importance methods (‘cover’), showing that in rare feature attributes, the B. oleracea and the B. rapa model focus mostly on retrotransposons in its best‐predicting attributes, and in B. napus, the best predictors are pseudomolecule membership.
Table S1 BUSCO results for B. napus v4.1 (Chalhoub et al., 2014) and the new NRGene v9 assembly.
Table S2 Comparison of repeats between B. napus v4.1 and v9 assembly.
Table S3 Comparison of repeats between B. napus v4.1 and v9 assembly.
Table S4 Comparison of repeats between B. napus v4.1 and v9 assembly.
Table S5 Top 15 enriched GO terms in the dispensable genes of B. oleracea, B. rapa, B. napus, and B. napus without synthetic lines.
Table S6 Numbers of core and dispensable genes in STRING functional networks without synthetic lines.
Table S7 Count of transposable elements per pseudomolecule in the B. oleracea assembly.
Table S8 Total length (Mbp) of transposable elements per pseudomolecule in the B. oleracea assembly.
Table S9 Total length (Mbp) of transposable elements as percentage of total pseudomolecule length in the B. oleracea assembly.
Table S10 Count of transposable elements per pseudomolecule in the B. rapa assembly.
Table S11 Total length (Mbp) of transposable elements per pseudomolecule in the B. rapa assembly.
Table S12 Total length (bp) of transposable elements as percentage of total pseudomolecule length in the B. rapa assembly.
Table S13 Comparison of models using the B. napus gene loss data.
Table S14 Confusion matrix for the three XGBoost models trained on B. oleracea, B. rapa, and B. napus data.
Table S15 Data used for the assembly of the three pangenomes.
Table S16 RNASeq data used for the annotation of the three pangenomes.
Data Availability Statement
All code generated for this study is available at https://github.com/AppliedBioinformatics/Brassica_oleracea_rapa_napus_code
All data generated for this study is available at BioProject PRJNA613532. The assemblies, annotations, PAV‐matrices and other supporting data are available at https://doi.org/10.26182/5f1936836a1c4 and http://brassicagenome.net/databases.php. JBrowse (Buels et al., 2016) and KnetMiner (Hassani‐Pak et al., 2020) instances are available at http://brassicagenome.net/databases.php.