

Abstract
Ageing of the immune system, or immunosenescence, contributes to the morbidity and mortality of the elderly1,2. To define the contribution of immune system ageing to organism ageing, here we selectively deleted Ercc1, which encodes a crucial DNA repair protein3,4, in mouse haematopoietic cells to increase the burden of endogenous DNA damage and thereby senescence5–7 in the immune system only. We show that Vav-iCre+/−;Ercc1−/fl mice were healthy into adulthood, then displayed premature onset of immunosenescence characterized by attrition and senescence of specific immune cell populations and impaired immune function, similar to changes that occur during ageing in wild-type mice8–10. Notably, non-lymphoid organs also showed increased senescence and damage, which suggests that senescent, aged immune cells can promote systemic ageing. The transplantation of splenocytes from Vav-iCre+/−;Ercc1−/fl or aged wild-type mice into young mice induced senescence in trans, whereas the transplantation of young immune cells attenuated senescence. The treatment of Vav-iCre+/−;Ercc1−/fl mice with rapamycin reduced markers of senescence in immune cells and improved immune function11,12. These data demonstrate that an aged, senescent immune system has a causal role in driving systemic ageing and therefore represents a key therapeutic target to extend healthy ageing.
Old age is the greatest risk factor, by orders of magnitude, for most chronic diseases1. Diseases cluster in individuals so curing one disease will not affect the fraction of healthy elderly2. This led to the argument for therapeutically targeting fundamental ageing processes to compress the period of morbidity in old age13. Proof of concept comes from a new class of drugs known as senolytics that selectively kill senescent cells6. Senescence is a tumour-suppressor mechanism that is activated in response to stress and results in cell cycle arrest and a secretory phenotype that is pro-inflammatory and tissue damaging14. Senescent cells are known to be key drivers of ageing, and senolytics are able to delay or attenuate numerous age-related diseases, suppress frailty and extend healthy ageing5–7. It is clear that a single senolytic will not kill all senescent cells15. Therefore, which senescent cell types drive ageing most potently, and therefore are the most important to target therapeutically, remains a crucial question.
During ageing, the immune system loses its ability to mount an effective response against pathogens and cancer cells. This decline in immune function is termed immunosenescence and is characterized by changes in the naive: memory T cell ratio, CD4:CD8 ratio, impaired calcium-mediated signalling and thymic atrophy16. In addition, many immune cell types senesce with ageing, expressing increased levels of p16INK4a (also known as CDKN2A) and p21CIP1 (CDKN1A) and a senescence-associated secretory phenotype (SASP)17–19. These age-dependent changes limit the effectiveness of vaccinations, increase disease susceptibility, and contribute to mortality in older adults16. However, the contribution of the aged immune system to systemic ageing, independent of increasing susceptibility to infection and cancer, is poorly understood.
Reducing expression of the endonuclease ERCC1–XPF impairs the repair of DNA damage and accelerates accumulation of endogenous oxidative lesions and senescent cells in several tissues of mice3,4. This causes premature onset of morbidities and histopathology associated with old age in mice and humans20–24. Thus, by removing this DNA repair enzyme, ageing is accelerated owing to normal physiological processes. Here, we used a floxed allele of Ercc1 to determine the effect of the aged immune system on other tissues. The HS21/45 promoter of the mouse Vav1 proto-oncogene was used to drive the expression of a codon-improved Cre recombinase25 to delete Ercc1 in haematopoietic cells, and the effect on the immune compartment and peripheral organs was evaluated.
Loss of immune cells
Vav-iCre+/−;Ercc1−/fl mice were bred and shown to have Ercc1 knocked out in lymphoid organs but not in other tissues (Extended Data Fig. 1a, b). The C terminus of ERCC1, which was floxed, is essential for binding and stabilizing XPF (which is encoded by Ercc4) in vivo24,26. Thus, the endonuclease ERCC1–XPF holoenzyme is absent in the immune compartment. Vav-iCre+/−;Ercc1−/fl mice were born with Mendelian frequency and showed no physical differences from littermates into adulthood (Extended Data Fig. 2). γH2AX, a marker of genotoxic stress, was increased in splenic tissue from 8–10-month-old Vav-iCre+/−;Ercc1−/fl mice compared to controls, as were levels of the oxidative DNA lesion 8-oxo-guanine (Fig. 1a), consistent with a deficiency in the DNA repair machinery. Despite an increase in oxidative stress in the spleen and bone marrow of the Vav-iCre+/−;Ercc1−/fl mice (Extended Data Fig. 1c–i), other oxidative DNA lesions, cyclopurines, were not increased in splenic tissue from Vav-iCre+/−;Ercc1−/fl mice (Extended Data Fig. 1j). One explanation is that these lesions or a threshold of genotoxic stress kills immune cells, as reported for the nervous system4. Indeed, the Vav-iCre+/−;Ercc1−/fl mice developed a progressive peripheral leukopenia (Fig. 1b). The white blood cell count was not affected in younger mice, which indicates a degenerative rather than developmental process. A complete blood count revealed leukopenia was driven by a reduction of lymphocytes (Extended Data Table 1).
Fig. 1 |. Deletion of Ercc1 in haematopoietic cells causes accelerated ageing of the immune system.

a, Immunoblot detection of γH2AX in splenic lysates from 9-month-old mice. Levels of 8-oxo-guanine (8-OHdG) in spleens from 8–10-month-old mice (n = 6 mice per group). WT, wild type. b, Peripheral white blood cell (WBC) counts of Vav-iCre+/− and Vav-iCre+/−;Ercc1−/fl mice (n = 4, 7, 8 and 5 Vav-iCre+/−; n = 3, 6, 8 and 6 Vav-iCre+/−;Ercc1−/fl, at 3, 5–6, 12 and 18 months, respectively). c, Flow cytometric quantification of peripheral blood B and T cells in 4–5-month-old mice (n = 15–16 Vav-iCre+/−; n = 6 Vav-iCre+/−;Ercc1−/fl) (see Supplementary Table 3 for sample size details). d, e, Splenic (d) and bone marrow (e) lymphocyte populations in 8–10-month-old mice (n = 8–11/7 Vav-iCre+/−;Ercc1−/fl; n = 4/4 Vav-iCre+/− mice, for spleen/bone marrow). f, Analysis of CD4+ splenocytes from 8–10-month-old mice for memory (CD44+CD127+), exhaustion (PD-1+) and apoptosis (VAD-FMK+) markers (n = 6 mice per group). g, Splenic weights normalized to body weight (n = 3 at 3 months; n = 7 at 8–10 months). h, KLH delayed-type hypersensitivity data after sensitization of 5-month-old Vav-iCre or ≥24-month-old wild-type mice. Footpad swelling at 48 h after challenge (n = 6 Vav-iCre+/−; n = 7 Vav-iCre+/−;Ercc1−/fl; n = 5 WT). i, KLH antibodies measured by ELISA one month after challenge (n = 3/6 Vav-iCre+/−; n = 3/7 Vav-iCre+/−;Ercc1−/fl; n = 3/5 2-year-old wild-type challenged with PBS/KLH). j, Cytotoxicity of splenic natural killer cells from 8–12-month-old Vav-iCre mice (n = 5 mice per group). k, Senescence marker expression in flow-sorted cell populations from spleens (T, natural killer cells) and bone marrow (B cells, macrophages) of 5-month-old Vav-iCre mice (n = 4 mice per group). Expression is normalized to age-matched Vav-iCre+/− controls (blue-dashed line). l, Senescence marker expression in splenic tissue (top) and bone marrow (bottom) from 8–11-month-old Vav-iCre and old wild-type mice (n = 3–9 Vav-iCre+/−; n = 6–9 Vav-iCre+/−;Ercc1−/fl; n = 4–7 two-year-old WT, depending on the gene). Data are mean ± s.d. *P < 0.05, **P < 0.01, ***P < 0.001, ****P < 0.0001, unpaired two-tailed Student’s t-test (a, c–g, j, k), one-way ANOVA (h, i, l) or two-way ANOVA (b) with Tukey’s test.
Flow cytometry of peripheral blood cells revealed that the fraction of T cells, but not B cells, was significantly reduced in Vav-iCre+/−;Ercc1−/fl mice compared to littermates at 4–5 months old (Fig. 1c). In older mutant mice, the fraction of T cells was reduced in the spleen and B cells were reduced in the bone marrow of Vav-iCre+/−;Ercc1−/fl mice relative to wild-type controls (Fig. 1d, e). This was confirmed by measuring the absolute numbers of splenocytes, B cells (B220+CD19+) and T cells (CD4+ and CD8+), which were all significantly reduced in Vav-iCre;Ercc1−/fl mice compared to controls (Extended Data Fig. 1k, l). By contrast, lymphocyte counts were stable during ageing in wild-type mice (Extended Data Fig. 1m, n).
There was a shift towards increased memory T cells (CD44+) (Fig. 1f) in the spleen of Vav-iCre+/−;Ercc1−/fl mice, similar to normal ageing16. PD-1, a marker of T cell activation and exhaustion27, was increased in CD4+ cells from Vav-iCre+/−;Ercc1−/fl mouse spleen compared to controls (Fig. 1f). The caspase inhibitor and marker of apoptosis VAD-FMK was not significantly increased in splenic CD4+ and CD8+ cells from Vav-iCre+/−;Ercc1−/fl mice (Fig. 1f, Extended Data Fig. 1o). By 5 months of age, when DNA lesions were measured, mutant mice had significantly reduced numbers of immune cells in several compartments, and cell numbers continued to decline as the mice aged (Fig. 1b, Extended Data Table 1). Consistent with this, at 8–10 months of age, Vav-iCre+/−;Ercc1−/fl mice had reduced splenic and thymic weights (Fig. 1g, Extended Data Fig. 1p). Histopathological analysis of lymphoid tissues revealed loss of splenic germinal centres in Vav-iCre+/−;Ercc1−/fl mice as well as lymph node atrophy (Extended Data Fig. 1q). These data indicate that Ercc1 deletion in haematopoietic cells causes an accelerated degenerative process in the immune system, similar, but not identical to what occurs with normal ageing in mice8. It also establishes that immune cells are vulnerable to endogenous DNA damage, which can cause cell death.
Impaired immune function
To determine whether immune function is affected in Vav-iCre+/−;Ercc1−/fl mice, a delayed-type hypersensitivity (DTH) assay was performed. Five-month-old mutant mice and littermates, plus old wild-type mice, were immunized with keyhole limpet hemocyanin (KLH) then challenged 2 weeks later by the injection of antigen or vehicle into the footpad. Footpad swelling was reduced in Vav-iCre+/−;Ercc1−/fl and aged wild-type mice compared to young, wild-type mice (Fig. 1h, Extended Data Fig. 3a, b). Serum levels of anti-KLH antibodies were reduced in Vav-iCre+/−;Ercc1−/fl and aged wild-type mice (Fig. 1i, Extended Data Fig. 3c). This demonstrates that both cellular and humoral immune function were compromised in adult Vav-iCre+/−;Ercc1−/fl mice. Notably, two-month-old Vav-iCre+/−;Ercc1−/fl mice had a normal DTH response (Extended Data Fig. 3d), confirming that Vav-iCre+/−;Ercc1−/fl phenotypes are degenerative, analogous to ageing. Natural killer cell-mediated cytotoxicity, a biomarker of healthy immune ageing9, was impaired in Vav-iCre+/−;Ercc1−/fl mice (Fig. 1j). These data reveal innate and adaptive immune functions are impaired in Vav-iCre+/−;Ercc1−/fl mice.
Immune cell senescence
Senescence affects immune cell differentiation and function18. Immune cell populations were therefore isolated from lymphoid tissues collected from 5-month-old Vav-iCre+/−;Ercc1−/fl mice by flow cytometry and senescence markers (p16Ink4a and p21Cip1 mRNA) and SASP (Tnf, Mcp1 (also known as Ccl2), Il6 and Il1b mRNA)14,28,29 were quantified. As expected, expression of Ercc1 was significantly reduced in these cell types (Extended Data Fig. 3e). p16 and p21 were significantly increased in Vav-iCre+/−;Ercc1−/fl mice B cells (B220+CD19+), T cells (CD3+), natural killer cells (CD3−NK1.1+) and macrophages (CD11b+F4/80+) compared to littermates (Fig. 1k). SASP expression was increased in T cells, natural killer cells and macrophages in a cell-type specific pattern. Splenocytes, bone marrow cells and peripheral CD3+ cells from aged but not young Vav-iCre+/−;Ercc1−/fl mice expressed increased levels of senescence and SASP markers compared to controls, analogous to aged wild-type mice (Fig. 1l, Extended Data Fig. 3f, g). The mRNA expression of p16 and p21 was higher in single-cell suspensions from spleens and bone marrow of male mutant mice than female mice28,29 (Extended Data Fig. 3h, i). This demonstrates that increased endogenous DNA damage via Ercc1 deletion causes increased senescence in immune cells.
A downstream consequence of endogenous genotoxic stress is increased levels of reactive oxygen species, leading to further macro-molecular damage3. Splenocytes from 5-month-old Vav-iCre+/−;Ercc1−/fl mice had increased levels of superoxide anion (Extended Data Fig. 1c). NRF2 is activated by oxidative stress, but can be lost after chronic stress14,30. The expression of NRF2 (encoded by Nfe2l2) and its targets Cat, Nqo1 and Hmox1 were significantly increased in 5-month-old mutant mice compared to controls, but not in younger mice (Extended Data Fig. 1d, e). In older Vav-iCre+/−;Ercc1−/fl mice, Nfe2l2 expression was significantly lower than controls, comparable to aged wild-type mice (Extended Data Fig. 1d, e). Catalase activity diminished with age in splenic tissue from Vav-iCre+/−;Ercc1−/fl and wild-type mice (Extended Data Fig. 1f, g). The antioxidant glutathione (GSH) was also reduced in the spleens of Vav-iCre+/−;Ercc1−/fl mice (Extended Data Fig. 1h). Concomitantly, adducts of 4-hydroxynonenal (HNE), a lipid peroxidation product, increased in the spleens of Vav-iCre+/−;Ercc1−/fl mice (Extended Data Fig. 1i). These data reveal increased oxidative stress in lymphoid tissues of Vav-iCre+/−;Ercc1−/fl mice, consistent with accelerated ageing.
To characterize which immune cell subsets were senescent, mass cytometry was performed on splenocytes from 10–12-month-old Vav-iCre+/−;Ercc1−/fl and aged wild-type mice (Fig. 2, Extended Data Fig. 4). viSNE analysis was performed on CD45+ cells to determine the expression of p16 and p21 in immune cell populations. viSNE distinguished CD3+, CD4+ and cytotoxic CD8+ T cells, T regulatory (Treg) cells (FOXP3), natural killer cells (NK1.1), B cells (CD19) and CD11b+ myeloid cells (Extended Data Fig. 4). The CD11b+ myeloid cell cluster appeared particularly enriched for both p16 and p21 in Vav-iCre+/−;Ercc1−/fl mice and aged wild-type mice (Fig. 2a, Extended Data Fig. 4a). Twelve distinct immune cell types were analysed for the expression of p16, p21 and CENP-B senescence markers (Extended Data Fig. 4). The frequency of p16+, p21+ and CENP-B+ cells varied within and between immune cell subsets. Although there was a trend for increased p16+, p21+ and CENP-B+ cells in immune cells from Vav-iCre+/−;Ercc1−/fl mice, significant differences were only detected in T cell subsets for p16 expression (Fig. 2b). CD4+CD44+PD1+ cells exhibited increased expression of p16 and p21, consistent with these being senescence-associated T cells31. The frequency of p16+, p21+ and CENP-B+ cells was significantly increased in most immune cell types from two-year-old wild-type mice compared with 10–12-month-old Vav-iCre+/− controls (Fig. 2b, Extended Data Fig. 4), whereas in 10–12-month-old Vav-iCre+/−;Ercc1−/fl mice, the frequency of only p16+ T cells was significantly increased compared to age-matched Vav-iCre+/−; controls. Expression of PD-1 was increased in CD4+ cells in aged wild-type mice (Fig. 2b). FOXP3+, FOXP3− and RORγT+ CD4+CD44+PD-1+ subsets had increased p16+ cells in Vav-iCre+/−;Ercc1−/fl mice and aged wild-type mice (Extended Data Fig. 4), which indicates increased senescence in Treg cells and non-Treg CD4+ cells. B cells, natural killer T cells and CD11b+ myeloid cells had increased p16 expression in Vav-iCre+/−;Ercc1−/fl mice compared to age-matched controls (Fig. 2b), consistent with the RNA data (Fig. 1). Aged wild-type mice had significantly increased frequencies of CENP-B+ cells for all the populations analysed (Extended Data Fig. 4). This demonstrates that Vav-iCre+/−;Ercc1−/fl and aged wild-type mice have similar, but not identical, subsets of immune cells undergoing senescence.
Fig. 2 |. Identification of senescent immune cell types by CyTOF.

a, Representative viSNE plots identifying immune cells that express p16 (top), p21 (middle) and PD-1 (bottom) from 10–12-month-old Vav-iCre+/− or Vav-iCre+/−;Ercc1−/fl mice, or a 2-year-old wild-type mouse. b, Quantification of p16- and p21-expressing immune cell subsets (n = 6 Vav-iCre+/−; n = 6 Vav-iCre+/−;Ercc1−/fl; n = 7 2-year-old WT mice analysed in a single CyTOF experiment). NKT cells, natural killer T cells. Data are mean ± s.d. *P < 0.05, **P < 0.01, Kruskal–Wallis test with Dunn’s correction. See Extended Data Fig. 4 for additional data.
Senescence in solid organs
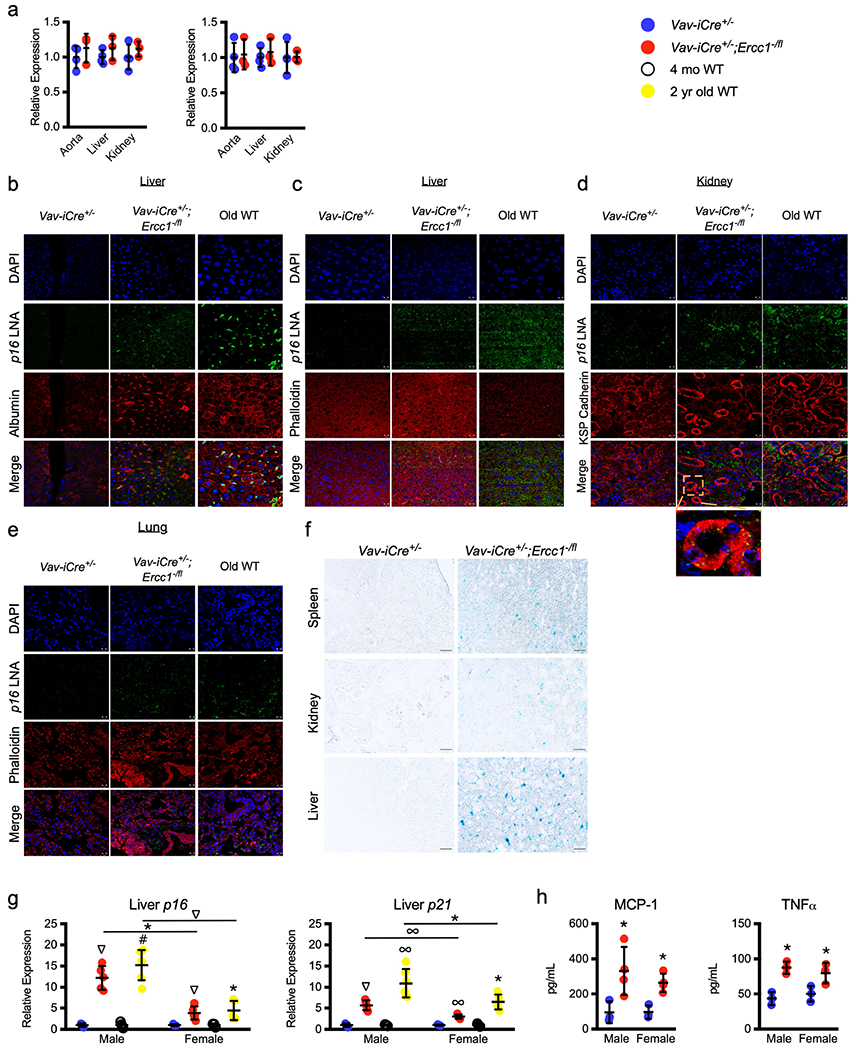
To determine whether immune senescence in Vav-iCre+/−;Ercc1−/fl mice affects non-lymphoid organs, tissues were collected from 8–11-month-old mice and DNA damage, oxidative stress and senescence were measured (Fig. 3, Extended Data Figs. 5, 6). The expression of p16 and p21 was increased in many tissues of older, but not younger Vav-iCre+/−;Ercc1−/fl mice compared to controls (Fig. 3a, b, Extended Data Fig. 5a). Thus, immune senescence precedes peripheral senescence. p16 in situ hybridization revealed that p16 expression occurred in non-immune parenchymal cells (Fig. 3c, Extended Data Fig. 5b–e). In the liver, p16 staining co-localized with the actin-stain phalloidin and albumin-expressing cells with enlarged nuclei, consistent with hepatocytes. In the kidney, the p16 signal overlapped with cells staining for kidney-specific cadherin, which was expressed in distal tubules and collecting ducts. In the lung, p16 staining occurred in airway epithelia. Finally, senescence-associated β-galactosidase (SA-β-gal) staining was increased in renal tubules and polyhedral cells in the liver, suggestive of hepatocytes6,32 (Extended Data Fig. 5f). The expression of senescence markers was greater in male Vav-iCre+/−;Ercc1−/fl mice than in female mice, consistent with wild-type mice (Extended Data Fig. 5g, h). The liver and, to a lesser extent, kidneys of Vav-iCre+/−;Ercc1−/fl mice had increased oxidative DNA lesions, HNE adducts and oxidized GSH levels (Fig. 3d, Extended Data Fig. 6a–c). These data suggest an aged immune system drives systemic changes associated with normal ageing.
Fig. 3 |. An aged immune system drives senescence and loss of tissue homeostasis in non-lymphoid organs.

Several senescence and tissue damage markers were measured in 8–11-month-old Vav-iCre mice and old wild-type mice (see Supplementary Table 3 for sample size details). a, b, Expression of p16 (a) and p21 (b) (n = 5–10 mice) in mutant mice was normalized to Vav-iCre+/− controls (blue line). GI, gastrointestinal; VAT, visceral adipose tissue. c, Representative images of in situ hybridization on hepatic sections for p16 mRNA (green), albumin (red) to detect hepatocytes, and DAPI (blue nuclei). See also Extended Data Fig. 5. d, Hepatic 8-oxo-guanine DNA adducts and HNE protein adducts measured by ELISA (n = 6–8 mice per group). Glutathione ratio (reduced glutathione (GSH) to oxidized glutathione (GSSG) ratio) in livers of Vav-iCre+/−;Ercc1−/fl mice (n = 6), Vav-iCre+/− controls (n = 6) and aged wild-type mice (n = 7). e, Serum aminotransferase levels (n = 9 mice per group). ALT, alanine aminotransferase; AST, aspartate transaminase. f, Urinary protein levels from Vav-iCre (n = 18) and old wild-type (n = 9) mice measured by Bradford assay. g, Serum amylase levels in Vav-iCre+/−;Ercc1−/fl (n = 5), Vav-iCre+/− (n = 6), and old wild-type (n = 4) mice. h, Glycosaminoglycan (GAG) levels in intervertebral discs of Vav-iCre+/−;Ercc1−/fl (n = 7) and Vav-iCre+/− (n = 4) mice. i, Wound area after cardiotoxin injury of the gastrocnemius (n = 3 mice per group). j, Serum β2-microglobulin (β2M) levels determined by ELISA of Vav-iCre+/−;Ercc1−/fl and Vav-iCre+/− mice (n = 9 mice per group) and aged wild-type mice (n = 5). k, Serum SASP protein levels in Vav-iCre+/−;Ercc1−/fl (n = 6–7, depending on the protein), Vav-iCre+/− controls (n = 5–6) and old wild-type (n = 5–7) mice, measured by ELISA. l, Lifespan of Vav-iCre+/−;Ercc1−/fl (n = 9) and Vav-iCre+/− (n = 13) mice. Data are mean ± s.d. *P < 0.05, **P < 0.01, ***P < 0.001, ****P < 0.0001, two-tailed unpaired Student’s t-test (a, b, h, i), one-way ANOVA with Tukey’s test (d–g, j, k), or log-rank (Mantel–Cox) test (l).
Tissue damage
Notably, the senescence and oxidative stress observed in immune organs of Vav-iCre+/−;Ercc1−/fl mice were sufficient to cause tissue damage in non-deleted organs. Hepatic damage markers alanine and aspartate aminotransferase were increased in serum from Vav-iCre+/−;Ercc1−/fl mice compared to age-matched Vav-iCre+/− controls (Fig. 3e). Albumin and kidney damage markers were increased in the urine from Vav-iCre+/−;Ercc1−/fl mice (Fig. 3f, Extended Data Fig. 6d–f). Levels of the pancreatic dysfunction marker amylase were increased in Vav-iCre+/−;Ercc1−/fl mouse serum (Fig. 3g). The above changes also occurred in aged wild-type mice (Fig. 3d–g). The level of glycosaminoglycans, in particular aggrecan, was reduced in the intervertebral discs Vav-iCre+/−;Ercc1−/fl mice (Fig. 3h, Extended Data Fig. 6g, h), characteristic of age-related disc degeneration23,33,34. p16 expression was significantly increased in immune-privileged tissues such as the intervertebral disc (Extended Data Fig. 6i) and brain (Fig. 3a, b). Histological and molecular evidence of disc ageing was also present (Extended Data Fig. 6j). Regeneration after muscle injury was impaired in Vav-iCre+/−;Ercc1−/fl mice compared to controls (Fig. 3i, Extended Data Fig. 6k) and the ratio of infiltrating M2 to M1 macrophages was significantly reduced (Extended Data Fig. 6l). Grip strength was diminished in older Vav-iCre+/−;Ercc1−/fl mice (Extended Data Fig. 6m). Levels of serum β2-microglobulin (Fig. 3j), GDF-15, IL-1β, MCP-1, osteopontin and TNF were increased in Vav-iCre+/−;Ercc1−/fl and aged wild-type mice (Fig. 3k). Increases in these SASP factors was age-dependent and progressive in the mutant mice (Extended Data Fig. 7a). However, quantification of age-related histopathological lesions in Vav-iCre+/−;Ercc1−/fl mice did not reveal a significant increase compared with age-matched Vav-iCre+/− controls (Extended Data Fig. 7b). Finally, the lifespan of Vav-iCre+/−;Ercc1−/fl mice was significantly reduced (Fig. 3l). These data demonstrate that an aged immune system can drive the loss of tissue homeostasis, frank damage and age-associated changes in several peripheral organs that contribute to reduced lifespan.
Cell non-autonomous mechanism
To prove that immune cells from Vav-iCre+/−;Ercc1−/fl mice drive secondary senescence and ageing pathology in trans, splenocytes were isolated from mutant mice and two-year-old wild-type mice then transplanted into p16Ink4a-luciferase reporter mice35. Vav-iCre+/−;Ercc1−/fl splenocytes had significantly increased levels of luciferase signal at 1 and 2 weeks after transplantation compared to splenocytes from Vav-iCre+/− donors (Fig. 4a). Splenocytes from aged wild-type mice resulted in an even greater induction of luciferase signal. Recipient mice had higher levels of p16, p21 and luciferase reporter mRNA in several non-lymphoid organs (Fig. 4b, Extended Data Fig. 8a) when administered aged splenocytes (mutant or old wild-type) compared to those from young mice. There were also increased SASP proteins in the serum of recipient mice transplanted with aged splenocytes (Fig. 4c). The increased bioluminescence in recipient reporter mice persisted for one month (Extended Data Fig. 8b). Transplanted splenocytes were found in several organs of recipient mice regardless of the donors (Extended Data Fig. 8c). Transplantation of splenocytes from Vav-iCre+/−;Ercc1−/fl mice into progeroid Ercc1−/Δ mice significantly reduced their lifespan (Fig. 4d), reinforcing the conclusion that the aged or senescent immune cells drive accelerated ageing and the decreased lifespan of Vav-iCre+/−;Ercc1−/fl mice (Fig. 3l).
Fig. 4 |. Adoptive transfer of splenocytes from Vav-iCre+/−;Ercc1−/fl and aged wild-type mice are sufficient to drive senescence in trans.

Splenocytes from 8–10-month-old Vav-iCre+/−;Ercc1−/fl mice, Vav-iCre+/− controls, or two-year-old wild-type mice were injected retro-orbitally into 3–4-month-old p16Ink4+/Luc senescence reporter mice (n = 2 donor mice per genotype). a, Representative images and weekly measures of luminescence in recipient mice (n = 3 recipient mice for Vav-iCre+/−;Ercc1−/fl or Vav-iCre+/− splenocytes; n = 4 recipients for old WT splenocytes). b, Tissues were collected from recipient mice 2 weeks after the final imaging and the expression of the p16- and the p16-driven luciferase reporter were measured by quantitative PCR with reverse transcription (qRT–PCR). c, Levels of serum SASP factors MCP-1 (left) and TNF (right) in recipient mice 2 weeks after adoptive transfer. d, Lifespan of Ercc1−/Δ mice after adoptive transfer of splenocytes from 19-month-old Vav-iCre+/−;Ercc1−/fl or Vav-iCre+/− (n = 2 donors per group) mice. Recipient mice were 2 months of age when transplanted (n = 5 for mutant; n = 6 for control splenocytes). Data are mean ± s.d. *P < 0.05, **P < 0.01, ***P < 0.001, ****P < 0.0001, one-way ANOVA with Tukey’s test (b, c), or log rank (Mantel–Cox) test (d).
Cell autonomous mechanism
The data above suggest that aged splenocytes can drive cell non-autonomous senescence in several tissues through a gain-of-function mechanism. To determine whether a loss-of-function mechanism also contributes, splenocytes from young wild-type mice were transplanted into Ercc1−/Δ mice and the expression of senescence markers was measured one month after transplantation (Extended Data Fig. 9a). Splenocytes from young mice reduced senescence in several tissues of Ercc1−/Δ mice (Extended Data Fig. 9b) and levels of circulating SASP factors (Extended Data Fig. 9c). More acutely, two doses of young splenocytes (Fig. 5a) reduced p16 and p21 mRNA in tissues from Ercc1−/Δ recipient mice (Fig. 5b), circulating SASP factors (Fig. 5c) and markers of tissue damage (alanine aminotransferase, aspartate aminotransferase or amylase) (Fig. 5d, e). These data support a loss-of-function mechanism in which aged immune cells are unable to suppress senescence.
Fig. 5 |. Transplantation of splenocytes from young mice suppresses senescence and tissue damage in aged recipients, whereas rapamycin improves immune function of Vav-iCre+/−;Ercc1−/fl mice.

a, Adoptive transfer: 3-month-old Ercc1−/Δ mice were injected retro-orbitally with 5 × 10⁶ splenocytes (SPL) from 2-month-old wild-type mice (n = 2 donors) or vehicle only (PBS) at days 1 and 4. At day 7, tissues were collected from recipient mice (n = 4 mice per group) and uninjected age-matched wild-type mice. b, Expression of senescence markers p16 and p21 measured by qRT–PCR. Gene expression was normalized to that of untreated, age-matched wild-type mice (horizontal dashed line). c, SASP proteins activin A, GDF-15, MCP-1 and IL-1β were measured in the serum of recipient mice by single- or multiplex-ELISA. d, Serum aminotransferase levels. e, Serum amylase levels. f, Mice were treated with or without rapamycin (Rapa; 4 mg kg−1 intraperitoneally, three times per week) for 6 weeks starting at 3 months of age, followed by 1 week of no drug, then a DTH assay was initiated with KLH (Methods). Footpad swelling was measured 48 h after antigenic challenge (n = 3/7 Vav-iCre+/−;Ercc1−/fl or n = 3/6 Vav-iCre+/− mice +/− rapamycin, respectively). g, One month after DTH challenge, anti-KLH antibodies were measured by ELISA (n values as in f). h, Peripheral WBC count 1 month after DTH challenge (n = 3/7 Vav-iCre+/− and for Vav-iCre+/−;Ercc1−/fl +/− rapamycin, respectively). i, Expression of p16 in peripheral blood mononuclear cells (PBMCs), measured by qRT–PCR. Data are mean ± s.d. *P < 0.05, **P < 0.01, ***P < 0.001, ****P < 0.0001, one-way ANOVA (b–e) or two-way ANOVA (f–i) with Tukey’s test.
Rapamycin rejuvenates immune cells
Inhibition of mTOR activity with a rapamycin analogue in elderly people enhances their response to influenza vaccination and reduces infection rates11,12, which indicates that immunosenescence can be modulated. To determine whether Vav-iCre+/−;Ercc1−/fl mice model this, mice were treated with rapamycin and immune function was measured. Footpad swelling, titres of anti-KLH serum and white blood cell counts were increased in rapamycin-treated Vav-iCre+/−;Ercc1−/fl mice compared to untreated controls (Fig. 5f–h, Extended Data Fig. 9d). Expression of p16 and p21 in CD3+ peripheral T cells was reduced by rapamycin, as were serum levels of MCP-1 and TNF (Fig. 5i, Extended Data Fig. 9e, f), which suggests modulation of both the gain- and loss-of-function mechanisms by which immune senescence drives systemic ageing.
The key conclusions from this study are that immune cells are vulnerable to endogenous DNA damage, which if unrepaired causes cell death or senescence. Senescence in the immune compartment, as occurs with normal ageing, affects innate and adaptive immunity, in particular follicular helper T cell and natural killer cell function, and potently drives senescence and age-related changes in solid organs. The mechanism behind parenchymal damage appears to be a combination of cell autonomous (loss-of-function) and cell non-autonomous (gain-of-function, for example, SASP). We conclude that targeting senescent immune cells with senolytic drugs has great potential for suppressing multi-morbidities of old age.
Online content
Any methods, additional references, Nature Research reporting summaries, source data, extended data, supplementary information, acknowledgements, peer review information; details of author contributions and competing interests; and statements of data and code availability are available at https://doi.org/10.1038/s41586-021-03547-7.
Methods
Data reporting
No statistical methods were used to predetermine sample size. The mice were randomly assigned to experimental groups, except in experiments that required specific genotypes and ages, and investigators were blinded to allocation during experiments and outcome assessment, except for rare instances in which blinding was not possible.
Animals
Vav-iCre mice (obtained from The Jackson Laboratory, strain name B6.Cg-Tg(Vav1-icre)A2Kio/J) were previously described25. The cDNA for exons 8–10 of Ercc1 along with a neomycin cassette all flanked by loxP sites was inserted into the Ercc1 locus in frame with exon 7 to create a floxed allele of Ercc1 (Supplementary Fig. 2a). Ercc1+/fl FVB/N mice were crossed with C57BL/6J Vav-iCre+/−;Ercc1+/− mice to create Vav-iCre+/−;Ercc1−/fl mice carrying one knockout and one floxed allele excised by codon improved Cre (iCre) recombinase in haematopoietic cells (Supplementary Fig. 2b). Wild-type mice were purchased from Jackson Laboratory. Ercc1−/Δ mice were bred as previously described36. p16-luciferase reporter mice were obtained from Ohio State University35. All experimental mice maintained were in an F1 background from two inbred parents (FVB/N and C57BL/6J) to create congenic mice without strain-specific pathology. Ear punches were used for animal identification and genotyping by TransnetYX. Mice were group housed in ventilated micro-isolator cages on Allentown racks. Mouse cages were changed every two weeks. Mice were handled in a HEPA filtered laminar flow hood with gloves and forceps that were disinfected between cages, and bedding and equipment were autoclaved. All mice were fed irradiated chow (Teklad Global Soy Protein-Free Rodent diet 2020), and chlorinated water was provided through the Edstrom Reverse Osmosis (RO) automatic watering system supplied to the racks through water manifolds. All animal studies were conducted in compliance with the US Department of Health and Human Services Guide for the Care and Use of Laboratory Animals and were approved by The Scripps Research Institute and University of Minnesota Institutional Animal Care and Use Committee.
RNA isolation and qRT–PCR
Gene expression analysis was performed as previously described3,37. Tissues were collected from euthanized mice and flash-frozen in liquid nitrogen. Tissues were homogenized using FastPrep-24 homogenizer (MP Biomedicals) and total RNA was isolated by Trizol extraction according to manufacturer’s specifications (Thermo Fisher). Total RNA was quantified using a Nanodrop spectrophotometer (Thermo Fisher) and 1 μg of total RNA used to generate cDNA via the Transcriptor First Strand cDNA synthesis kit (Roche) according to the manufacturer’s specifications. Gene expression changes in p16Ink4a, p21Cip1, Il6, Mcp1 and Tnf were quantified by qRT–PCR reactions using 20 μl reaction volumes and a StepOne thermocycler (Thermo Fisher) with input of 50 ng total RNA per reaction (except p16Ink4a, 100 ng total RNA). For each sample, reactions were performed in duplicate. Data were analysed by the ΔΔCt method and expression was normalized to Gapdh. Primer sequences are as follows: B2m Fwd 5′- CGGCCTGTATGCTATCCAGA-3′, B2m Rev 5′-GGGTGAATTCAGTGTGAGCC-3′; Cdkn1a (p21Cip1) Fwd 5′-GTCAGGCTGGTCTGCCTCCG-3′, Cdkn1a(p21Cip1) Rev5′-CGGTCCCGTGGACAGTGAGCAG-3′; Cdkn2a (p16Ink4a) Fwd 5′-CCCAACGCCCCGAACT-3′, Cdkn2a (p16Ink4a) Rev 5′-GCAGAAGAGCTGCTACGTGAA-3′; Ercc1 Fwd 5′- AAAAGCTGGAGCAGAACT-3′, Ercc1 Rev 5′-AAGAGCTGTTCCAGGGAT-3′Gapdh Fwd 5′-AAGGTCATCCCAGAGCTGAA-3′, Gapdh Rev 5′-CTGCTTCACCACCTTCTTGA-3′; Il6 Fwd 5′-CTGGGAAATCGTGGAAT-3′, Il6 Rev 5′-CCAGTTTGGTAGCATCCATC-3′; Mcp1 Fwd 5′-GCATCCACGTGTTGGCTCA-3′, Mcp1 Rev 5′-CTCCAGCCTACTCATTGGGATCA-3′; Tnf Fwd 5′-ATGAGAAGTTCCCAAATGGC-3′, Tnf Rev 5′-CTCCACTTGGTGGTTTGCTA-3′; Hmox1 Fwd 5′-AGAATGCTGAGTTCATGAAGAA-3′, Hmox1 Rev 5′-CTGCTTGTTGCGCTCTATCTC-3′; Nqo1 Fwd 5′-TGCTATGAACTTCAACCCCA-3′, Nqo1Rev5′-GGCGTCCTTCCTTATATGCT-3′; Nfe2l2 Fwd 5′-GCTTTTGGCAGAGACATTCC-3′, Cat Fwd 5′-ATAGCCAGAAGAGAAACCCA-3′, Cat Rev 5′-TTCATGTGCCGGTGACCAT-3′; Firefly luciferase Fwd 5′-GCCATGAAGCGCTACGCCCTGG-3′, luciferase Rev 5′-TCTTGCTCACGAATACGACGGTGG-3′.
Isolation of peripheral blood CD3+ T cells
Isolation of CD3+ T cells was performed as previously described37. Blood was obtained from mice by cardiac puncture, immediately placed into 1/10th volume of 0.5 M EDTA and gently mixed to prevent coagulation. Samples were centrifuged at 300g for 10 min in a tabletop centrifuge. Supernatant was discarded and the cell pellet was suspended in 1 ml ACK buffer (150 mM NH4Cl, 10 mM KHCO3, 0.1 mM Na2EDTA, pH 7.4) to lyse red blood cells and then incubated at room temperature for 10 min. Cells were spun down and ACK lysis was repeated for a second time. Cells were then spun down, washed in 1× Dulbecco’s PBS (DPBS), and resuspended in 1× DPBS with 0.5% FBS and 2 mM EDTA. Them, 50 μl of CD3–biotin conjugate (Miltenyi Biotech) was added to the cell suspension solution and incubated for 30 min on ice. Cells were centrifuged at 100g for 10 min and washed twice in resuspension buffer. The cell pellet was then resuspended in 500 μl of resuspension buffer and 100 μl of anti-biotin microbeads added before a 15-min incubation on ice. Cells were washed twice, resuspended in 500 μl of resuspension buffer and applied to MACS column attached to a magnet. Cells were washed with three column volumes of buffer before elution. Cells were centrifuged and RNA isolation was conducted using a RNeasy kit (Qiagen) according to manufacturer’s specifications. qRT–PCR analysis of senescence markers was performed as indicated above.
Immunoblotting
Snap-frozen livers from mice were incubated in RIPA buffer (Thermo-Fisher) on ice for 30 min after being homogenized with a FastPrep-24 homogenizer. Samples were centrifuged at 17,000g for 15 min at 4 °C. Supernatant was resuspended in 2× SDS loading buffer and 50 μg of total protein run on a 4–15% SDS–PAGE gel (Bio-Rad) before being transferred to nitrocellulose membrane. Membranes were blocked for 1 h in 10% milk TBS-T solution at room temperature before incubation in anti-ERCC1 (Santa Cruz Biotechnology, sc-17089), anti-γH2AX (Novus Biologicals, NB100-384, 1:2,000) and anti-GAPDH (Abcam, ab8425, 1:5,000) antibody at 4 °C overnight. After washing, samples were incubated in either horse anti-mouse HRP (Cell Signaling Technology, 7076S) or goat anti-rabbit HRP secondary antibody (Thermo-Fisher, 656120, 1:2,000) in 5% milk TBS-T solution for 3 h before washing and visualization with ECL (Thermo-Fisher).
Fluorescent in situ hybridization
Detection of p16 mRNA was performed as previously described6,37,38. In brief, liver, lung and kidney sections were deparaffinized, rehydrated and boiled in sodium citrate buffer. Slides were prehybridized in a 4× SSC solution containing 3% BSA at 55 °C. Slides were then incubated with either a scrambled non-specific probe or a custom-designed p16 LNA probe (5′-TCTCATGCCATTCCTTTCCTGT-3′, Exiqon) diluted in hybridization buffer containing 10% dextran sulfate in 4× SSC. Slides were hybridized at 55 °C for 1 h and then submitted to a series of five washes of decreasing stringency. Sections were imaged using confocal scanning laser microscopy.
SA-β-gal staining
Fresh tissues from 8–11-month-old Vav-iCre+/−;Ercc1−/fl and littermate controls were fixed in 10% neutral buffered formalin (NBF) for 3–4 h and then transferred to 30% sucrose overnight. Tissues were then embedded in cryo-embedding medium (OCT) and cryosectioned at 5 μm for staining of SA-β-gal (pH 6.0) at 37 °C for 16–24 h in SA-β-gal staining solution (40 mM citric acid in sodium phosphate buffer, 5 mM K4[Fe(CN)6] 3H2O, 5 mM K3[Fe(CN)6], 150 mM sodium chloride, 2 mM magnesium chloride and 1 mg ml−1 X-gal dissolved in N,N-dimethylformamide). Slides were imaged at 20× with a Panoptiq slide scanner (ViewSiq).
Multiplex analysis of SASP factors
Quantitation of SASP factor abundance was performed as previously described37,39. Serum levels of SASP were measured in Vav-iCre+/−;Ercc1−/fl and littermate controls (n = 3–9 mice per group) at different ages using a multiplex assay using the Milliplex Map Mouse Metabolic Hormone Magnetic Bead Panel kit (MCP-1 and TNF) (Millipore Sigma). Serum (10 μl) of serum was analysed in duplicate and analyte concentrations were quantified on a Luminex 200 (Luminex Corporation) microplate reader. Serum levels of 1L-1β, activin A, GDF-15 and osteopontin were measured by single-analyte ELISA (Abcam; R&D Systems) using a Varioskan plate reader (Thermo-Fisher).
Body weight and NMR measurement of body composition
A Bruker LF minispec body composition analyser (Bruker) was used to measure body composition of mice (11–25 mice per group). Body weights were measured by use of a standard top loader balance (Ohaus) and body composition was investigated by using non-invasive nuclear magnetic resonance technique to rapidly measure the percentage fat, lean mass and fluid in non-anaesthetized mice.
Comprehensive blood counts
Tail bleeds from mice were analysed using a SciL Vet ABC Plus (Henry Schein Animal Health) or HemaTrue (Heska) haematology analyser.
Analysis of functional markers
Serum levels of amylase (pancreatic dysfunction), alanine aminotransferase and aspartate aminotransferase (liver damage markers) were quantified by ELISA (Abcam) using a Varioskan plate reader (Thermo-Fisher).
Adoptive transfers and in vivo imaging detection of luciferase activity
Approximately 5 × 10⁶ splenocytes were obtained from 8–10-month-old Vav-iCre+/− and Vav-iCre+/−;Ercc1−/fl and 2-year-old wild-type mice. Red blood cells were lysed in ACK buffer and then cells were washed in 1× DPBS and resuspended in 100 μl of 1× DPBS before being retro-orbitally injected into 3–4-month-old isoflurane-anaesthetized p16Ink4+/Luc mice. Isoflurane-anaesthetized mice were subcutaneously injected with 10 μl per gram body weight d-luciferin substrate (Caliper Life Sciences; 15 mg ml−1 in 1× DPBS) and were imaged weekly using an IVIS Lumina (PerkinElmer) as previously described35,37.
Immune cell transplantations into progeroid mice
Approximately 5 × 10⁶ splenocytes were obtained from 2-month-old wild-type mice. Red blood cells were lysed in ACK buffer and then cells were washed in 1× DPBS and resuspended in 100 μl of DBPS before being retro-orbitally injected into 3-month-old isoflurane-anaesthetized Ercc1−Δ mice. Mice were euthanized one month later, and tissues collected for the senescence marker analysis and circulating SASP factors.
Homing of immune cells in recipient mice
Splenocytes (10 × 106 cells) from 7- or 26-month old wild-type male mice were retro-orbitally injected into 7-month-old female recipient mice. Twenty-four hours after injection, tissues were collected and snap-frozen in liquid nitrogen. DNA was isolated using DNeasy blood and tissue kit (Qiagen) as specified by the manufacturer. Equivalent amounts of total DNA for each sample in a specific tissue was used to amplify the Sry gene by PCR. PCR products were electrophoresed in a gel containing SYBR Safe (Thermo-Fisher) and imaged on an iBright gel imager (Thermo-Fisher).
Sry Fwd 5′-TTGTCTAGAGAGCATGGAGGGCCATGTCAA-3′, Sry Rev 5′- CCACTCCTCTGTGACACTTTAGCCCTCCGA-3′.
Histopathology
Tissues were collected from euthanized mice and fixed in 10% neutral buffered formalin. Tissues were processed and paraffin embedding before sectioning (4-μm thickness). Sections were stained with haematoxylin and eosin. Specimens were interpreted by a board-certified veterinary pathologist for age-related pathology.
Geropathology
The Geropathology Grading Platform (GGP) is a grading system to assess mouse biological ageing through the measurement of pathological status of several tissues using a standardized scoring system. The scoring system generates a numerical score for the total lesions in each tissue, which are then averaged in each mouse to generate a composite lesion score (CLS)40.
Delayed-type hypersensitivity measurements
Mice were sensitized by a 100 μl subcutaneous injection of freshly prepared KLH antigen (2 mg ml−1) emulsified 1:1 in Freund’s complete adjuvant (Thermo-Fisher). The emulsion was mixed by forcing the adjuvant-immunogen mixture through a small orifice. Two weeks later after sensitization, anaesthetized mice were challenged by injecting 20 μg of KLH dissolved in 10 μl of 1× DPBS or 1× DPBS vehicle only in rear footpads. The mice were monitored to ensure they regained consciousness before being returned to their cages. Paw thickness of each hind paw was monitored with a spring-loaded caliper (Dyer) at 0, 24, 48 and 72 h after antigen administration. Only the 0 h point was measured under anaesthesia.
Anti-KLH antibodies ELISA
Serum obtained from mice in the DTH experiments was analysed for the presence of mouse anti-KLH antibodies using the anti-KLH IgG ELISA (Life Diagnostics Inc.) and a SpectraMax plate reader (Molecular Devices). Blood samples were collected from the tail vein.
Peripheral blood and lymphoid analysis by flow cytometry
The spleens and bone marrow were converted into single-cell suspensions and washed with sterile PBS. Red blood cells were depleted with red blood cell lysis buffer (150 mM ammonia chloride, 1 mM sodium bicarbonate and 0.1 mM EDTA at pH 7.7) and the cells were extensively washed before being passed through a cell strainer. Subsequently, the cells were re-suspended in FACS buffer (2% FBS, 1× PBS, 2 mM EDTA and 0.04% sodium azide) at 3.75 × 10⁶ cells per ml. A 200 μl aliquot of each sample was transferred into 96-well polypropylene round-bottom plates (BD Bioscience). To minimize background noise, Fc receptors were blocked using anti-CD16/CD32 monoclonal antibody (1:600 dilution; purchased from BD Pharmagin) for 20 min at 10 °C. The cells were stained with fluorochrome conjugated monoclonal antibody (purchased from either BD Pharmagin or eBioscience) at the appropriate titre for 45 min at 10 °C. The cells were washed with FACS buffer twice and fixed using 2% paraformaldehyde. For intracellular staining, the cells were processed using a cytofix/cytoperm buffer kit purchased from BD Pharmingen and used according to the manufacturer’s instructions. Whole blood was collected in heparinized tubes and analysed as described above after red blood cell lysis. The samples were processed on a BD LSR II flow cytometer (BD Bioscience) and analysed using Flowjo software (Tristar, Inc.). The absolute number of each cell type was calculated by multiplying the percentage calculated by the total splenic cell number.
Sorting of immune cell populations
Bone marrow and splenocytes were obtained from 5-month-old Vav-iCre+/− and Vav-iCre+/−;Ercc1−/fl mice. Samples were incubated in ACK lysis buffer to lyse red blood cells before being washed in 1× DPBS before incubating in Fc block for 15 min on ice. Splenocytes were stained with CD3-PE and NK1.1-FITC for 30 min on ice to sort T and natural killer cells. Bone marrow was stained with CD19-APC, B220-FITC, F4/80-PE-Cy7 and CD11b-PE purchased from either BD Pharmagin or eBioscience) to sort B cells and macrophages. Cells (5 × 10⁴) were sorted into FBS using a BD Aria III flow cytometer. Sorted cells were washed in 1× DPBS and snap frozen in liquid nitrogen. Total RNA was isolated from cells using RNeasy kit and analysed for the expression of senescence and SASP markers as described above.
Natural killer cell cytotoxicity assay
Spleens collected from 8–12-month-old mice were pressed through a 70-μm filter using a 3 ml syringe filter and rinsed through in 1× DPBS. Samples were centrifuged at 1,000 rpm for 10 min in a tabletop centrifuge. Supernatant was discarded and the cell pellet was suspended in 1 ml ACK buffer (150 mM NH4Cl,10 mM KHCO3, 0.1 mM Na2EDTA, pH 7.4) to lyse red blood cells and then incubated on ice for 5 min. Cells were then spun down, washed in 1× DPBS, and resuspended in 1× DPBS with 0.5% FBS and 2 mM EDTA. Then, 50 μl of anti-CD3–biotin conjugate (Miltenyi Biotech) was used added to the cell suspension solution and incubated for 30 min on ice. Cells were centrifuged at 1,000 rpm for 10 min and washed twice in resuspension buffer. The cell pellet was then resuspended in 500 μl of resuspension buffer and 100 μl of anti-biotin microbeads added before a 15 min incubation on ice. Cells were washed twice and then resuspended in 500 μl of resuspension buffer and applied to MACS column attached to a magnet. Column elution fraction was collected and then centrifuged and resuspended and incubated with 50 μl anti-NK1.1–biotin conjugate on ice for 30 min. Cells were washed with three column volumes of buffer before elution. Cells were then counted to determine ‘effector’ natural killer” cell numbers for use in cytotoxicity assays. Approximately 1 × 10⁶ K562 ‘target’ cells were incubated in 2 ml of complete medium with 20 μl of 3 mM DiOC18 stain for 1 h at 37 °C. Cells were then washed twice in 1× DPBS to washout the remaining DiOC18 stain and resuspend in cells in complete medium at a density of 1 × 10⁶ per ml. Suspensions of effector cells were prepared in complete medium to yield effector:target ratios of 15:1, 5:1 and 0:1 by mixing 130 μl of effector cells with 10 μl of target cells. The cell volume was increased to 995 μl and 5 μl of 10 mg ml−1 DAPI propidium iodide solution was added, followed by incubation at 37 °C for 4 h. Cells were washed in 1× DPBS three times and lysis was measured by flow cytometry.
CyTOF analysis
Maxpar reagents including water, cell staining buffer (CSB), cell acquisition solution, Cell-ID Intercalator-Ir, Fix and Perm Buffer and EQ Four Element Calibration Beads were purchased from Fluidigm. The eBiosciences FoxP3/Transcription Factor staining buffer set was used for fixation/permeabilization and purchased from (Thermo Fisher). Antibodies used for cell surface labelling and phenotyping were either purchased directly from Fluidigm or purchased from the designated manufacturer (Supplementary Information). Custom-conjugated antibodies were generated in-house through the Mayo Clinic Hybridoma Core using Maxpar X8 antibody labelling kits (Fluidigm) according to the manufacturer’s protocol.
Isolated splenocytes were resuspended in 1 ml of CSB. Samples were then washed twice with CSB. An antibody cocktail of the extracellular markers was prepared as a master mix before adding 50 μl of cocktail to samples resuspended in 50 μl of CSB. Samples were then incubated at room temperature for 45 min. After washing twice with CSB, cells were permeabilized with fixation/permeabilization buffer (eBioscience). Afterwards, samples were washed and resuspended in CSB before the addition of a cocktail of intracellular antibody markers and incubation at room temperature for 45 min. Cells were washed and then fixed with 2% PFA for 30 min. Cells were resuspended in intercalation solution with Perm/Fix buffer (Fluidigm) and incubated overnight at 4 °C. On the next morning, cells were washed with PBS and resuspended in a 1:10 solution of calibration beads and CAS at a concentration of 0.5 χ 106 cells ml−1. Before data acquisition, samples were filtered through a 35-μm blue cap tube (Falcon).
Samples were loaded onto a Helios CyTOF system (Fluidigm) using an attached autosampler and were acquired at a rate of 200–400 events per second. Data were collected as. FCS files using the CyTOF software (version 6.7.1014). After acquisition, intrafile signal drift was normalized to the acquired calibration bead signal using the CyTOF software. CyTOF fcs files were analysed using Flowjo version 10 using the gating strategy shown in Supplementary Fig. 5. Generation of graphs and statistical analysis were performed in GraphPad Prism 8. Statistical significance was determined by performing a non-parametric Kruskal–Wallis test along with Dunn’s correction for multiple comparisons. viSNE analysis was performed using Cytobank software. CD45+ cells from all 19 samples were equally sampled for a total of 1,299,999 events and the analysis was performed with 3,000 iterations and a perplexity of 50. We used 15 channels for the analysis: TCRβ, CD3e, CD62L, CD4, CD8, CD44, GATA3, FOXP3, Tbet, RORγT, CD25, CD19, CD11b, CD11c and NK1.1. viSNE illustrations were generated in Cytobank.
Measurement of cyclopurine lesions
DNA was isolated from tissues, which was pulverized with a mortar and pestle under liquid nitrogen. Cyclopurine lesions were measured by liquid chromatography-triple mass spectrometry (LC–MS/MS/MS) using an LTQ linear ion trap mass spectrometer using our recently described conditions with some modifications. Nuclease P1 (0.1 U μg−1 DNA), phosphodiesterase 2 (0.000125 U μg−1 DNA), 20 nmol of erythro-9-(2-hydroxy-3-nonyl)adenine EHNA and a 20-μ1 solution containing 300 mM sodium acetate (pH 5.6) and 10 mM zinc chloride were added to isolated nuclear DNA. In this context, EHNA served as an inhibitor for deamination of 2′-deoxyadenosine to 2′-deoxyinosine induced by adenine deaminase. The above digestion mixture was incubated at 37 °C for 48 h. Alkaline phosphatase (0.05 U μg−1 DNA), phosphodiesterase 1 (0.00025 U μg−1 DNA) and 40 μl of 0.5 M Tris-HCl buffer (pH 8.9) were then added. The digestion was continued at 37 °C for 2 h and subsequently neutralized by the addition of formic acid. Then, appropriate amounts of uniformly 15N-labelled standard lesions were added, which included R-cdG, S-cdG, R-cdA and S-cdA. The digestion mixture was subsequently extracted twice with chloroform. The resulting aqueous layer was subjected to off-line high-performance liquid chromatography (HPLC) separation for the enrichment of the lesions under study, as previously described.
The LC–MS/MS/MS experiments were conducted using an LTQ linear ion trap mass spectrometer. In brief, a 0.5 × 150 mm Zorbax SB-C18 column (particle size, 5 μm, Agilent) was used for the separation of the above-enriched lesion fractions, and the flow rate was 4.0 μl min−1. A solution of 0.1% (v/v) formic acid in water (solution A) and a solution of 0.1% (v/v) formic acid in methanol (solution B) were used as mobile phases for the analyses of all four cyclopurine lesions–that is, the (5′R) and (5′S) diastereomers of cdA and cdG, after HPLC enrichment, and a gradient of 5 min 0–20% B, 30 min 20–80% B, and 5 min 80% B was used for the separation.
EPR quantification of O2•−
Spleen tissue (25 mg) was homogenized in ice-cold HBSS (pH 7.4) containing 100 mM DTPA. The homogenate was then exposed to the EPR hydroxylamine spin probe CMH (1-hydroxy-3-methoxycarbon yl-2,2,5,5-tetramethylpyrrolidine), 200 mM, for 10 min at 25 °C and then centrifuged at 1,000g and the supernatant (50 ml) was placed into an EMXnano EPR cavity for analysis. Controls were performed with added superoxide dismutase (purified CuZnSOD) to validate signal from O2•−. Values for signal intensity are arbitrary units of signal intensity taken from the up-field peak of the characteristic three-line spectrum from the nitrogen splitting.
Measurement of splenic catalase activity
Catalase activity was measured as previously described3 by detection of hydrogen peroxide at 240 nm using a Cary 300 BIO UV-VI (Varian) spectrophotometer at 30 s intervals for a total of 1 min. Catalase activity per milligram of protein (k mg−1) was quantified using the following formula: k mg−1 = [3ln(Ainitial/Afinal)]/[milligrams of protein × time].
Quantitation of 8-oxo-guanine DNA lesions
Tissues from mice were analysed for 8-oxo-guanine levels using the ELISA kit (Abcam) according to manufacturer’s specifications.
Lipid peroxidation products
Tissues from mice were analysed for HNE adducts using the OxiSelect HNE Adduct Competitive ELISA kit (Cell Biolabs) according to manufacturer’s specifications as previously described3.
Quantification of glutathione
Fresh tissues from mice were immediately homogenized in 5% sulfosalicylic acid and subsequently analysed for the concentration of reduced (GSH) and oxidized (GSSG) glutathione using the Glutathione Assay Kit (Cayman Chemical) as previously described3.
Short-course rapamycin administration
Three-month-old Vav-iCre+/− and Vav-iCre+/−;Ercc1−/fl mice were given intraperitoneal injections of 4 mg kg−1 rapamycin (LC Laboratories) that was formulated with 5% PEG-400 and 5% Tween-80 every other day for six weeks. Mice were given one week for washout before beginning delayed-type hypersensitivity experiments as described above.
β2-microglobulin measurement
Analysis of serum and urinary levels of β2-microglobulin was performed by ELISA (Abcam) as specified by the manufacturer.
Intervertebral disc aggrecan immunofluorescence
Mouse lumbar intervertebral disc tissue were isolated from spines and fixed overnight at 4 °C in 2% paraformaldehyde. For immunofluorescent staining, the tissues were cryoprotected with 30% sucrose in PBS overnight at 4 °C, then embedded in OCT (Tissue-Tek). Serial axial plane cryosections were cut at thicknesses of 5 μm. The tissue sections were rehydrated in PBS, permeabilized and blocked with 0.25% Triton X-100, 10% goat serum and 1% BSA in PBS for 30 min at room temperature. Incubation with anti-aggrecan (AB1031, Millipore) was carried out overnight at 4 °C following blocking. The sections were then incubated with secondary antibodies (Cy3-conjugate Goat anti-rabbit IgG, Jackson Laboratory) for 60 min at room temperature, according to the manufacturer’s protocols. Immunostained sections were imaged and analysed using a Nikon instrument A1 confocal laser microscope and NIS-elements microscopy imaging software.
1,9-Dimethylmethylene blue (DMMB) colorimetric assay for sulfated glycosaminoglycans
For each mouse, nucleus pulposus tissue isolated from four lumbar IVDs of each mouse were pooled and digested using papain at 60 °C for 2 h. GAG content was measured in duplicates by the DMMB procedure using chondroitin-6-sulfate (Millipore Sigma C-8529) as a standard41. The DNA concentration of each sample was measured using the Pico-Green assay (Molecular Probes) and used to normalize the glycosaminoglycan values.
Muscle injury
Cardiotoxin (CTX; 4 μM, Millipore Sigma, C9759) was injected intramuscularly into the gastrocnemius muscles of the recipient mice. Five days after injury, the mice were euthanized, and the muscles were collected and flash-frozen in liquid nitrogen-cooled 2-methylbutane. Serial 10-μm cryosections were then stained with haematoxylin and eosin (H&E) for the identification of the injury area. Image acquisition was performed with a Nikon Eclipse Ci at 2-20× magnification. To measure the injured area, at least six random 2× magnification fields were blindly measured with Image J.
Grip strength analysis
Body weights were collected for each mouse and grip strength was measured using a BIO-GS3 grip strength meter (Bioseb).
Immunohistochemistry
Cryosections from CTX and non-CTX injured muscle were fixed with 5% formalin, blocked with 5% donkey serum, and then incubated with antibodies specific for CD68 (marker of M1 macrophages, ab53444, 1:200, Abcam) and CD163 (marker of M2 macrophages, Sc-33560, 1:50, Santa Cruz) were used to evaluate the ratio of M1/M2 macrophages as a parameter for inflammation in the muscle. Alexafluor 594-conjugated anti-rabbit IgG (1:500; Invitrogen, A21207) and Alexafluor 488-conjugated anti-rat IgG (1:500; Invitrogen, A21208) were used as secondary antibodies. The nuclei were stained with DAPI. All the stained sections were visualized on a Nikon Eclipse Ni-E fluorescence microscope. Ten random pictures per slide were taken and they were blindly measured with Image J.
Schematics
All mouse images in schematics found in figures and extended data figures were adapted from BioRender.
Reporting summary
Further information on research design is available in the Nature Research Reporting Summary linked to this paper.
Extended Data
Extended Data Fig. 1 |. Molecular changes in Vav-iCre+/−;Ercc1−/fl mice.

a, Expression of Ercc1 was measured in tissues from 8–10-month-old Vav-iCre+/−;Ercc1−/fl and Ercc1−/fl control mice (n = 5–7 Vav-iCre+/−;Ercc1−/fl; n = 3–5 Ercc1−/fl, depending on the tissue (see Supplementary Table 3 for sample size details). b, Detection of ERCC1 in splenic lysates from a 9-month-old Vav-iCre+/−;Ercc1−/fl mice and littermate control by immunoblot. c, Superoxide anion levels were measured by electron paramagnetic resonance (EPR) in splenic tissue from 6–8-month-old Vav-iCre+/−;Ercc1−/fl and littermate control mice (n = 5 mice per group). d, e, Expression of the transcription factor NRF (Nfe2l2) and its downstream targets (Cat, Nqo1, Hmox1) measured by qRT–PCR in spleen (d) and bone marrow (e) of Vav-iCre+/−;Ercc1−/fl and littermate control mice at several ages (n = 3 at 3- and 5-months-old; n = 5 8–10-months-old) and in two-year-old wild-type mice (n = 5). f, Catalase activity measured in splenic tissue from 8–10-month-old Vav-iCre+/−;Ercc1−/fl (n = 6) and Vav-iCre+/− (n = 3) mice (Methods). g, Catalase activity in 4-month-old (n = 3) and 24-month-old (n = 6) wild-type mice. h, i, The ratio of reduced to oxidized glutathione (GSH/GSSG) (Methods) (h) and levels of HNE protein adducts (i) measured by ELISA in splenic lysates of Vav-iCre+/−;Ercc1−/fl and littermate control mice at 8–11 months of age (n = 6 mice per group). j, Levels of four cyclopurine adducts in splenic tissue from 8–10-month-old Vav-iCre+/−;Ercc1−/fl mice and littermate controls (n = 4–5 Vav-iCre+/−;Ercc1−/fl; n = 5 Vav-iCre+/−; see Supplementary Table 3 for sample size details) measured by liquid chromatograph–tandem mass spectrometry (LC–MS/MS/MS) (Methods). k, Total splenocyte cell counts from 8–10-month-old Vav-iCre+/−;Ercc1−/fl (n = 14) mice and Vav-iCre+/− (n = 12) mice. l, The absolute number of T (CD4+, CD8+) and B (B220+CD19+) cells in spleens from the same mice (n = 10/4 Vav-iCre+/−;Ercc1−/fl; n = 8/3 Vav-iCre+/− for CD4+ or CD8+/ B220+CD19+ measures, respectively) (Methods). m, Total splenocyte cell counts from young (7-month-old; n = 10) and old (24-month-old; n = 17) wild-type mice. n, The absolute number of CD4+, CD8+ and B220+CD19+ cell in spleens from the same mice (n = 8/3 young WT; n = 17/7 old wild-type mice for CD4+ or CD8+/B220+CD19+ measures, respectively). o, Analysis of CD8+ splenocytes from 8–10-month-old mice for memory (CD44+CD127+), exhaustion (PD-1+) and apoptosis (VAD-FMK+) markers (n = 6 mice per group). p, Thymic weight normalized to total body weight (n = 3 at 3 months old; n = 4–5 at 8–10 months old per group). q, Histology images (20×) of spleen and lymph nodes from 8–10-month-old Vav-iCre mice. Scale bar, 100 μm. GC, germinal centres. Data are mean ± s.d. *P < 0.05, ∞P < 0.01, ∇P < 0.001, #P < 0.0001, unpaired two-tailed Student’s t-test (a, c–e for the 3- and 5-month-old mice, g–p), one-way ANOVA (d, e for the 8–10-month-old mice) or two-way (f) with Tukey’s test.
Extended Data Fig. 2 |. Vav-iCre+/−;Ercc1−/fl mice maintain normal weight and body composition.

a, Body weight (BW) of three different age groups of mice by genotype. b–d, Percentage fat (b), lean mass (c) and fluid (d) measured by NMR at three ages of mice (n = 8–25 mice per group) (see Supplementary Table 3 for sample size details). Data are mean ± s.d. P values (not significant) were determined by one-way ANOVA with Tukey’s test.
Extended Data Fig. 3 |. Measurement of immune function and lymphoid organ senescence in Vav-iCre+/−;Ercc1−/fl mice.

a, Footpad swelling measurements at several time points after antigenic (KLH) challenge, separated by mouse genotype (n = 7 Vav-iCre+/−;Ercc1−/fl; n = 6 Vav-iCre+/−; n = 5 old WT mice). b, Footpad swelling by genotype (n = 7 Vav-iCre+/−;Ercc1−/fl; n = 6 Vav-iCre+/−; n = 5 WT mice). c, Quantification of anti-KLH antibodies by ELISA one month after antigenic challenge (n = 3/7 Vav-iCre+/−;Ercc1−/fl; n = 3/6 Vav-iCre+/−; n = 3/3 Ercc1−/fl for naive (uninjected) and KLH-challenged (injected) mice, respectively). d, DTH assay in 2-month-old mice Vav-iCre+/−;Ercc1−/fl (n = 5) and Vav-iCre+/− (n = 8) controls. Data are mean ± s.d. ∞P < 0.01, ∇P < 0.001, #P < 0.0001, two-way ANOVA with Tukey’s test. e, Quantification of Ercc1 expression by qRT–PCR in flow-sorted immune cell populations isolated from spleen (T and natural killer cells) and bone marrow (B cells and macrophages) of 5-month-old Vav-iCre+/−;Ercc1−/fl mice and littermate controls (n = 4 Vav-iCre+/−;Ercc1−/fl; n = 3 Vav-iCre+/−). Data are mean ± s.d. ∇P < 0.001, #P < 0.0001, two-tailed unpaired Student’s t-test. f, Senescence marker expression in CD3+ peripheral T cells from 8–11-month-old Vav-iCre and old wild-type mice (n = 3–9 Vav-iCre+/−; n = 6–9; Vav-iCre+/−;Ercc1−/fl; n = 4–7 two-year-old wild-type, depending on the gene) (see Supplementary Table 3 for sample size details). g, Measurement of senescence marker expression by qRT–PCR in splenic tissue and bone marrow from 2–3-month-old Vav-iCre mice (n = 3). h, Expression of senescence markers in splenic tissue from 8–10-month-old Vav-iCre+/−;Ercc1−/fl and old wild-type mice relative to controls by gender (n = 3–4/3–4 Vav-iCre+/−; n = 3–5/3–4 Vav-iCre+/−;Ercc1−/fl; n = 3–6/3–5 4-month-old WT; n = 5/5 two-year-old WT males/females, respectively) (see Supplementary Table 3 for sample size details). i, Expression of senescence markers in bone marrow of Vav-iCre+/−;Ercc1−/fl mice (n = 3–4/3–4 Vav-iCre+/−; n = 3–4/4–5 Vav-iCre+/−;Ercc1−/fl males/females, respectively). Data are mean ± s.d. *P < 0.05, ∞P < 0.01, ∇P < 0.001, #P < 0.0001, unpaired two-tailed Student’s t-test (e, g), one-way ANOVA (f) or two-way ANOVA (a–d, h, i) with Tukey’s test.
Extended Data Fig. 4 |. Identification of immune cell types and senescent cells by CyTOF.

a, viSNE analysis of total CD45+ cells to identify immune cell types. Representative viSNE plots are from a Vav-iCre+/− control mouse at 10–12 months of age. See Supplemental Fig. 5 for the gating strategy. b, The proportion of the indicated immune cell subsets that express p16, p21 or CENP-B from 10–12-month-old Vav-iCre+/−;Ercc1−/fl (n = 6), Vav-iCre+/−; (n = 6), and >2-year-old wild-type (n = 7) mice was determined by CyTOF. Each dot is an independent mouse. Data are mean ± s.d. *P < 0.05, **P < 0.01, ***P < 0.001, Kruskal–Wallis test with Dunn’s correction for multiple comparisons.
Extended Data Fig. 5 |. Co-localization of p16 mRNA with parenchymal markers in non-lymphoid tissues from Vav-iCre+/−;Ercc1−/fl mice.
a, Measurement of senescence marker expression in the organs of 5-month-old Vav-iCre mice (n = 3 mice per group). b–e, Representative images of p16 in situ hybridization with immunostain or chemical stain for parenchymal markers of liver (b, c), kidney (d) and lung (e) sections from 8–11-month-old Vav-iCre+/−;Ercc1−/fl mice, littermate control Vav-iCre+/− mice and 2-year-old wild-type mice stained for albumin (liver), phalloidin (liver and lung) or kidney-specific (KSP)-cadherin in the red channel, DAPI (blue), and p16 LNA probe (green). The full set of images from Fig. 3c is shown in b. Original magnification, ×40. Scale bar, 10 μm. f, Representative images of SA-β-gal staining on tissues from 8–10-month-old Vav-iCre+/−;Ercc1−/fl and littermate controls. Original magnification, ×20. Scale bar, 50 μm. g, Senescence marker expression in the livers of 8–11-month-old Vav-iCre+/−;Ercc1−/fl (n = 5 male and 4–5 female) (see Supplementary Table 3 for sample size details by gender and gene) and littermate control mice (n = 3 male and 3–4 female) as well as 4-month-old (n = 3 male and 3–4 female) and 2-year-old (n = 6 male and 4–5 female) wild-type mice. h, Levels of circulating SASP factor proteins measured by multiplex ELISA in serum from Vav-iCre+/−;Ercc1−/fl (n = 3 male and 3–4 female) and Vav-iCre+/− (n = 3 male and 3 female) mice. Data are mean ± s.d. *P < 0.05, ∞P < 0.01, ∇P < 0.001, #P < 0.0001, unpaired two-tailed Student’s t-test (a) or two-way ANOVA with Tukey’s test (g, h).
Extended Data Fig. 6 |. Cell non-autonomous effects of an aged immune system in non-lymphoid tissues of Vav-iCre+/−;Ercc1−/fl mice.

a, Cyclopurine adducts were measured in the liver and kidneys of 8–11-month-old Vav-iCre+/−;Ercc1−/fl (n = 5) and littermate control Vav-iCre+/− (n = 5 for liver and n = 6 for kidney) by LC–MS/MS/MS (Methods). b, Markers of oxidative stress including HNE protein adducts and the ratio of reduced to oxidized glutathione (GSH/GSSG) measured in the kidneys from 8–11-month-old Vav-iCre+/−;Ercc1−/fl and littermate control Vav-iCre+/− mice (n = 6 mice per group). HNE measure by ELISA. GSH/GSSG measured by chromogenic assay (Methods). c, 8-oxoguanine DNA adducts measured by ELISA in the spleen, liver and kidney of mice at various ages (n = 5–6/5–6/5 Vav-iCre+/−;Ercc1−/fl; n = 5–6/5–6/5 Vav-iCre+/−; n = 5/5/10 old WT mice for spleen/liver/kidney, respectively) (see Supplementary Table 3 for sample size details by genotype and tissue). d, Urinary levels of pro-geronic factor β2-microglobulin and MCP-1 measured by ELISA in 8–11-month-old Vav-iCre+/−;Ercc1−/fl and littermate controls (n = 9 mice per group). e, Renal Mcp1 (also known as Ccl2) expression in 8–11-month-old Vav-iCre+/−;Ercc1−/fl mice (n = 7 per group) measured by qRT–PCR. f, Representative Coomassie-stained gel of urine samples from 8–11-month-old Vav-iCre+/−;Ercc1−/fl and littermate control mice demonstrating increased proteinuria. Recombinant albumin (Alb) was loaded on the gel as a control (lanes 6, 12) and its approximate molecular mass denoted by a box (marker ladder lanes 1, 5, 7, 11, 13–14). Each lane represents a unique mouse. g, Representative images from tissue sections stained for aggrecan (red) and DAPI (blue) in the nucleus pulposus (NP) of intervertebral discs from 8–11-month-old Vav-iCre+/−;Ercc1−/fl and littermate control mice. h, Quantification of aggrecan staining (n = 4 Vav-iCre+/−; n = 7 Vav-iCre+/−;Ercc1−/fl). i, Measurement of senescence marker expression in the intervertebral discs of 8–11-month-old Vav-iCre+/−;Ercc1−/fl and littermate control mice (n = 4 mice per group) by qRT–PCR. j, Representative images of sections of intervertebral discs from 9-month-old mice stained with haematoxylin and eosin (H&E) and safranin O to detect proteoglycans. Arrows point to the anulus fibrosus. k, Representative images of gastrocnemius muscle sections from 8–11-month-old Vav-iCre+/−;Ercc1−/fl and littermate control mice after cardiotoxin injury (Methods) stained with haematoxylin and eosin or immunostained for M1 (CD68, green) and M2 (CD163, red) macrophages. l, Quantification of the ratio of M2/M1 macrophages (n = 4 Vav-iCre+/−; n = 8 Vav-iCre+/−;Ercc1−/fl mice). m, Body weight and grip strength of Vav-iCre+/−;Ercc1−/fl and littermate controls at the indicated ages (n = 8 Vav-iCre+/−;Ercc1−/fl; n = 4 Vav-iCre+/− at both ages). Data are mean ± s.d. *P < 0.05, ∞P < 0.01, ∇P < 0.001, #P < 0.0001, two-tailed unpaired Student’s t-test (a, b, d, e, h, i, l, m) or two-way ANOVA with Tukey’s test (c).
Extended Data Fig. 7 |. Age-associated increase in serum SASP factors of Vav-iCre+/−;Ercc1−/fl mice and wild-type mice.

a, This is an extension of the data shown in Fig. 3k, including two younger ages of mice. Circulating SASP factors were measured by ELISA (n = 3 for 2–3-month-old, n = 4 for 5-month-old, n = 5–7 for 8–11-month-old, n = 7 for 24-month-old) (see Supplementary Table 3 for sample size details). Data are mean ± s.d. *P < 0.05, *P < 0.01, ∇P < 0.001, #P < 0.0001, two-way ANOVA with Tukey’s test. b, Haematoxylin and eosin sections of brain, kidney and liver from 17-month-old Vav-iCre+/−;Ercc1−/fl and littermate controls (n = 5 mice per group) were scored for age-associated histopathological lesions using the Geropathology Grading Platform to generate a composite lesion score for each organ (CLS). Data are mean ± s.d. P values (not significant) were determined by two-tailed unpaired Student’s t-test.
Extended Data Fig. 8 |. Time course of bioluminescence signal in p16-luciferase mice transplanted with splenocytes and tissue distribution of transplanted cells.

a, Splenocytes from 8–10-month-old Vav-iCre+/−;Ercc1−/fl, Vav-iCre+/− controls, or 2-year-old wild-type mice were injected retro-orbitally into 3–4-month-old p16Ink4+/Luc senescence reporter mice (n = 2 donor mice per genotype) as described in Fig. 4. Tissues were collected from recipient mice 2 weeks after the final imaging and the expression of p21 was measured by qRT–PCR. Data are mean ± s.d. *P < 0.05, ∇P < 0.01, one-way ANOVA with Tukey’s test. b, Splenocytes (5 × 10⁶ cells) from 9–10-month-old Vav-iCre+/−;Ercc1−/fl and Vav-iCre+/− mice were injected retro-orbitally into 3–4-month-old p16Luc/Luc senescence reporter mice (n = 2 donor mice per genotype; n = 4 p16Luc/Luc recipient mice for Vav-iCre+/−;Ercc1−/fl splenocytes; n = 3 receiving Vau-iCre+/− splenocytes). Weekly measurements of luminescence in recipient reporter mice. Data are mean ± s.d. *P < 0.05, ∞P < 0.01, two-tailed unpaired Student’s t-test. c, Splenocytes from 7- or 26-month-old male mice were injected retro-orbitally into female mice to track distribution of the transplanted cells (n = 2 donor mice and n = 3 recipient mice per age group; n = 2 uninjected controls). Tissues were collected 24 h after injection. Expression of the Sry gene on the Y chromosome measured by qRT–PCR in RNA isolated from tissues of recipient mice was used to track homing of immune cells to various recipient mouse organs. There was little difference in immune cell homing if the donor mice were young or old.
Extended Data Fig. 9 |. Suppression of senescence in progeroid mice by transplantation of young immune cells.

a, Schematic of adoptive transfer: 3-month-old progeroid Ercc1−/Δ mice (n = 4 mice/treatment group) were injected retro-orbitally with 5x10⁶ splenocytes from 2-month-old WT mice or vehicle only (PBS) (n = 6 donors). One month later, the recipient mice and uninjected age-matched wild-type mice were euthanized, and tissues collected. b, Expression of senescence markers in organs of recipient mice (n = 4 Ercc1−/Δ + splenocytes; n = 3–6 Ercc1−/Δ + PBS) (see Supplementary Table 3 for sample size details by organ/endpoint). Gene expression was normalized to that of uninjected, age-matched wild-type controls (n = 4–7) represented as horizontal dashed line. c, SASP factor proteins MCP-1 and TNF were measured in the serum of recipient mice by multiplex ELISA (n = 4 Ercc1−/Δ + splenocytes; n = 6 Ercc1−/Δ + PBS) and compared to untreated, age-matched wild-type mice (n = 4–6). d, Footpad swelling of mice describe above and in Fig. 5f at several time points after antigenic challenge (n = 3/7 Vav-iCre+/−;Ercc1−/fl or n = 3/6 Vav-iCre+/−; mice +/− rapamycin, respectively). e, Expression of p21 in PBMCs, measured by qRT-PCR. f, Serum MCP-1 and TNF measured by multiplex ELISA (n = 3/5 +/− rapamycin, respectively). Data are mean ± s.d. *P < 0.05, ∞P < 0.01, ∇P < 0.001, #P < 0.0001 one-way ANOVA (b, c) or two-way ANOVA (d–f) with Tukey’s test. Mouse images in schematic were used with permission from BioRender.
Extended Data Table 1 |.
Complete blood counts with differential
| WBC | Lym | Mono | Gran | RBC | HGB | HCT | PLT | ||
|---|---|---|---|---|---|---|---|---|---|
| 3 months | 103/mm2 | 103/mm2 | 103/mm2 | 103/mm2 | 104/mm2 | g/dL | % | 103/mm2 | n |
|
| |||||||||
| Vav-iCre+/− | 9.2 ± 1.6 | 6.8 ± 1.1 | 0.6 ± 0.1 | 1.9 ± 0.7 | 9.4 ± 1.3 | 13.4 ± 1.0 | 41.6 ± 2.3 | 714 ± 123 | 4 |
| VavCre+/−;Ercc1−/fl | 10.1 ± 1.1 | 8.2 ± 1.3 | 0.4 ± 0.2 | 1.4 ± 0.4 | 9.8 ± 0.7 | 14.6 ± 0.6 | 41.7 ± 2.8 | 848 ± 123 | 3 |
| WBC | Lym | Mono | Gran | RBC | HGB | HCT | PLT | ||
| 5-6 months | 103/mm2 | 103/mm2 | 103/mm2 | 103/mm2 | 104/mm2 | g/dL | % | 103/mm2 | n |
|
| |||||||||
| Vav-iCre+/− | 8.8 ± 1.0 | 6.8 ± 0.8 | 0.6 ± 0.2 | 1.4 ± 0.3 | 9.7 ± 0.7 | 14.1 ± 1.6 | 39.7 ± 3.6 | 618 ± 140 | 7 |
| VavCre+/− ;Ercc1−/fl | 5.2 ± 0.6** | 2.8 ± 0.6**** | 0.7 ± 0.2 | 1.7 ± 0.4 | 9.3 ± 1.0 | 14.0 ± 1.0 | 40.8 ± 2.5 | 633 ± 153 | 6 |
| WBC | Lym | Mono | Gran | RBC | HGB | HCT | PLT | ||
| 12 months | 103/mm2 | 103/mm2 | 103/mm2 | 103/mm2 | 104/mm2 | g/dL | % | 103/mm2 | n |
|
| |||||||||
| Vav-iCre+/− | 8.6 ± 2.6 | 6.5 ± 1.8 | 0.5 ± 0.2 | 1.6 ± 0.7 | 9.8 ± 0.8 | 14.0 ± 1.5 | 41.3 ± 1.6 | 554 ± 233 | 8 |
| VavCre+/−;Ercc1−/fl | 2.5 ± 1.3**** | 1.0 ± .5**** | 0.3 ± 0.1 | 1.0 ± 0.3 | 9.2 ± 0.7 | 14.0 ± 1.1 | 40.6 ± 2.5 | 504 ± 166 | 8 |
| WBC | Lym | Mono | Gran | RBC | HGB | HCT | PLT | ||
| 16-18 months | 103/mm2 | 104/mm2 | 103/mm2 | 103/mm2 | 104/mm2 | g/dL | % | 103/mm2 | n |
|
| |||||||||
| Vav-iCre+/− | 6.7 ± 2.2 | 4.7 ± 1.5 | 0.5 ± 0.1 | 1.0 ± 0.2 | 9.6 ± 0.8 | 14.5 ± 1.6 | 40.2 ± 5.0 | 490 ± 160 | 5 |
| VavCre+/− ;Ercc1−/fl | 2.0 ± 1.0*** | 0.9 ± 0.6*** | 0.3 ± 0.2 | 0.8 ± 0.3 | 8.7 ± 0.9 | 13.2 ± 1.4 | 37.3 ± 4.2 | 510 ± 107 | 6 |
Data are mean ± s.d. Statistical significance was determined using a two-tailed unpaired Student’s t-test.
P < 0.01
P < 0.001
P < 0.0001
Supplementary Material
Acknowledgements
This work was supported by the National Institutes of Health (NIH) grants P01 AG043376 (P.D.R., L.J.N., E.E.K., J.H.), RO1 AG063543 (L.J.N.), R56 AG059676 (L.J.N.), U19 AG056278 (P.D.R., L.J.N., W.C.L.), P01 AG062413 (P.D.R., L.J.N.), R56 AG058543 (W.C.L.), R01 AG044376 (N.V.V.) and the Glenn Foundation (L.J.N., C.E.B.). M.J.Y. is supported by The Irene Diamond Fund/American Federation on Aging Research Postdoctoral Transition Award. Mass cytometry and panel design were performed by S. Farwana and K. D. Pavelko at the Mayo Clinic Immune Monitoring Core. We thank J. Zhao, C. Bukata, K. Melos and M. Calubag for their assistance in measuring senescence. All mouse illustrations were made with BioRender.
Footnotes
Competing interests L.J.N. and P.D.R. are co-founders of NRTK Biosciences, a start-up biotechnology company developing senolytic drugs.
Supplementary information The online version contains supplementary material available at https://doi.org/10.1038/s41586-021-03547-7.
Peer review information Nature thanks Joan Mannick, Björn Schumacher and the other, anonymous, reviewer(s) for their contribution to the peer review of this work.
Data availability
Reasonable requests for all data presented in this Article will be honoured by the corresponding authors.
References
- 1.Kennedy BK et al. Geroscience: Linking aging to chronic disease. Cell 159, 709–713 (2014). [DOI] [PMC free article] [PubMed] [Google Scholar]
- 2.St Sauver JL et al. Risk of developing multimorbidity across all ages in an historical cohort study: differences by sex and ethnicity. BMJ Open 5, e006413 (2015). [DOI] [PMC free article] [PubMed] [Google Scholar]
- 3.Robinson AR et al. Spontaneous DNA damage to the nuclear genome promotes senescence, redox imbalance and aging. Redox Biol. 17, 259–273 (2018). [DOI] [PMC free article] [PubMed] [Google Scholar]
- 4.Wang J, Clauson CL, Robbins PD, Niedernhofer LJ & Wang Y The oxidative DNA lesions 8,5′-cyclopurines accumulate with aging in a tissue-specific manner. Aging Cell 11, 714–716 (2012). [DOI] [PMC free article] [PubMed] [Google Scholar]
- 5.Baker DJ et al. Naturally occurring p16Ink4a-positive cells shorten healthy lifespan. Nature 530, 184–189 (2016). [DOI] [PMC free article] [PubMed] [Google Scholar]
- 6.Zhu Y et al. The Achilles’ heel of senescent cells: from transcriptome to senolytic drugs. Aging Cell 14, 644–658 2015). [DOI] [PMC free article] [PubMed] [Google Scholar]
- 7.Xu M et al. Senolytics improve physical function and increase lifespan in old age Nat. Med 24, 1246–1256 (2018). [DOI] [PMC free article] [PubMed] [Google Scholar]
- 8.Pettan-Brewer C & Treuting PM Practical pathology of aging mice. Pathobiol. Aging Age Relat. Dis 1, (2011). [DOI] [PMC free article] [PubMed] [Google Scholar]
- 9.Bumgardner SA et al. Genetic influence on splenic natural killer cell frequencies and maturation among aged mice Exp. Gerontol 104, 9–16 (2018). [DOI] [PubMed] [Google Scholar]
- 10.Liu Y et al. Expression of p16INK4a in peripheral blood T-cells is a biomarker of human aging Aging Cell 8, 439–448 (2009). [DOI] [PMC free article] [PubMed] [Google Scholar]
- 11.Mannick JB et al. mTOR inhibition improves immune function in the elderly. Sci. Transl. Med 6, 268ra179 (2014). [DOI] [PubMed] [Google Scholar]
- 12.Mannick JB et al. TORC1 inhibition enhances immune function and reduces infections in the elderly. Sci. Transl. Med 10, eaaq1564 (2018). [DOI] [PubMed] [Google Scholar]
- 13.Olshansky SJ Articulating the case for the longevity dividend Cold Spring Harb. Perspect. Med 6, a025940 (2016). [DOI] [PMC free article] [PubMed] [Google Scholar]
- 14.van Deursen JM The role of senescent cells in ageing Nature 509, 439–446 (2014). [DOI] [PMC free article] [PubMed] [Google Scholar]
- 15.Kirkland JL & Tchkonia T Cellular senescence: a translational perspective EBioMedicine 21, 21–28 (2017). [DOI] [PMC free article] [PubMed] [Google Scholar]
- 16.Goronzy JJ & Weyand CM Understanding immunosenescence to improve responses to vaccines Nat. Immunol 14, 428–436 (2013). [DOI] [PMC free article] [PubMed] [Google Scholar]
- 17.Krishnamurthy J et al. Ink4a/Arf expression is a biomarker of aging J. Clin. Invest 114, 1299–1307 (2004). [DOI] [PMC free article] [PubMed] [Google Scholar]
- 18.Vicente R, Mausset-Bonnefont AL, Jorgensen C, Louis-Plence P & Brondello JM Cellular senescence impact on immune cell fate and function Aging Cell 15, 400–406 (2016). [DOI] [PMC free article] [PubMed] [Google Scholar]
- 19.Pinti M et al. Aging of the immune system: Focus on inflammation and vaccination Eur. J. Immunol 46, 2286–2301 (2016). [DOI] [PMC free article] [PubMed] [Google Scholar]
- 20.Cho JS, Kook SH, Robinson AR, Niedernhofer LJ & Lee BC Cell autonomous and nonautonomous mechanisms drive hematopoietic stem/progenitor cell loss in the absence of DNA repair Stem Cells 31, 511–525 (2013). [DOI] [PMC free article] [PubMed] [Google Scholar]
- 21.Gregg SQ et al. A mouse model of accelerated liver aging caused by a defect in DNA repair Hepatology 55, 609–621 (2012). [DOI] [PMC free article] [PubMed] [Google Scholar]
- 22.Lavasani M et al. Muscle-derived stem/progenitor cell dysfunction limits healthspan and lifespan in a murine progeria model Nat. Commun 3, 608 (2012). [DOI] [PMC free article] [PubMed] [Google Scholar]
- 23.Nasto LA et al. Genotoxic stress accelerates age-associated degenerative changes in intervertebral discs Mech. Ageing Dev 134, 35–42 (2013). [DOI] [PMC free article] [PubMed] [Google Scholar]
- 24.Niedernhofer LJ et al. A new progeroid syndrome reveals that genotoxic stress suppresses the somatotroph axis Nature 444, 1038–1043 (2006). [DOI] [PubMed] [Google Scholar]
- 25.Siegemund S, Shepherd J, Xiao C & Sauer K IC>hCD2-iCre and Vav-iCre mediated gene recombination patterns in murine hematopoietic cells PLoS ONE 10, e0124661 (2015). [DOI] [PMC free article] [PubMed] [Google Scholar]
- 26.Su Y, Orelli B, Madireddy A, Niedernhofer LJ & Schärer OD Multiple DNA binding domains mediate the function of the ERCC1-XPF protein in nucleotide excision repair J. Biol. Chem 287, 21846–21855 (2012). [DOI] [PMC free article] [PubMed] [Google Scholar]
- 27.Sharpe AH & Pauken KE The diverse functions of the PD1 inhibitory pathway Nat. Rev. Immunol 18, 153–167 (2017). [DOI] [PubMed] [Google Scholar]
- 28.Sharpless NE & Sherr CJ Forging a signature of in vivo senescence Nat. Rev. Cancer 15, 397–408 (2015). [DOI] [PubMed] [Google Scholar]
- 29.Coppé JP, Desprez PY, Krtolica A & Campisi J The senescence-associated secretory phenotype: the dark side of tumor suppression Annu. Rev. Pathol 5, 99–118 (2010). [DOI] [PMC free article] [PubMed] [Google Scholar]
- 30.Zhang H, Davies KJA & Forman HJ Oxidative stress response and Nrf2 signaling in aging Free Radic. Biol. Med 88 (Pt B), 314–336 (2015). [DOI] [PMC free article] [PubMed] [Google Scholar]
- 31.Shimatani K Nakashima Y, Hattori M, Hamazaki Y & Minato N PD-1+ memory phenotype CD4+ T cells expressing C/EBPɑ underlie T cell immunodepression in senescence and leukemia Proc. Natl Acad. Sci. USA 106, 15807–15812 (2009). [DOI] [PMC free article] [PubMed] [Google Scholar]
- 32.Zhao J et al. Quantitative analysis of cellular senescence in culture and in vivo Curr. Protoc. Cytom 79, 9.51.1–9.51.25 (2017). [DOI] [PubMed] [Google Scholar]
- 33.Munshi R et al. MCP-1 gene activation marks acute kidney injury J. Am. Soc. Nephrol 22, 165–175 (2011). [DOI] [PMC free article] [PubMed] [Google Scholar]
- 34.Argyropoulos CP et al. Rediscovering β-2 microglobulin as a biomarker across the spectrum of kidney diseases Front. Med. (Lausanne) 4, 73 (2017). [DOI] [PMC free article] [PubMed] [Google Scholar]
- 35.Burd CE et al. Monitoring tumorigenesis and senescence in vivo with a p16INK4a-luciferase model Cell 152, 340–351 (2013). [DOI] [PMC free article] [PubMed] [Google Scholar]
- 36.Ahmad A et al. ERCC1-XPF endonuclease facilitates DNA double-strand break repair Mol. Cell. Biol 28, 5082–5092 (2008). [DOI] [PMC free article] [PubMed] [Google Scholar]
- 37.Yousefzadeh MJ et al. Mouse models of accelerated cellular senescence Methods Mol. Biol 1896, 203–230 (2019). [DOI] [PMC free article] [PubMed] [Google Scholar]
- 38.Tabibian JH, O’Hara SP, Splinter PL, Trussoni CE & LaRusso NF Cholangiocyte senescence by way of N-ras activation is a characteristic of primary sclerosing cholangitis Hepatology 59, 2263–2275 (2014). [DOI] [PMC free article] [PubMed] [Google Scholar]
- 39.Yousefzadeh MJ et al. Circulating levels of monocyte chemoattractant protein-1 as a potential measure of biological age in mice and frailty in humans Aging Cell 17, e12706 (2018). [DOI] [PMC free article] [PubMed] [Google Scholar]
- 40.Ladiges W Pathology assessment is necessary to validate translational endpoints in preclinical aging studies Pathobiol. Aging Age Relat. Dis 6, 31478 (2016). [DOI] [PMC free article] [PubMed] [Google Scholar]
- 41.Farndale RW, Buttle DJ & Barrett AJ Improved quantitation and discrimination of sulphated glycosaminoglycans by use of dimethylmethylene blue Biochim. Biophys. Acta 883, 173–177 (1986). [DOI] [PubMed] [Google Scholar]
Associated Data
This section collects any data citations, data availability statements, or supplementary materials included in this article.
Supplementary Materials
Data Availability Statement
Reasonable requests for all data presented in this Article will be honoured by the corresponding authors.