

Abstract
Objectives:
New CBCT devices have been developed which can provide “low-dose CBCTs (LD-CBCT)”. Aim of this study is to investigate the suitability of LD-CBCT for measurement of alveolar buccal/oral bone.
Methods and materials:
Vestibular and oral bone loss of the teeth of seven porcine mandibles free of soft tissues were investigated by Micro-CT and three CBCT-modes: high-dose (HD), standard-dose (SD) and low-dose (LD). Radiographic measurements of bone loss (bl) and vestibular and oral bone thickness (bt) were made by two raters at 69 sites. Measurement means and differences, Intraclass correlation (ICC) and Bland–Altman plots were calculated.
Results:
ICCs between raters(r) concerning bl were 0.954 for HD, 0.949 for SD and 0.945 for LD; concerning bt they were 0.872 for HD, 0.845 for SD and 0.783 for LD. Means of differences of bt measurements were −0.01 mm(r1)/0.00 mm(r2) for HD, 0.04 mm(r1)/0.02 mm(r2) for SD and 0.02 mm(r1)/0.04 mm(r2) for LD; for bl measurements they were 0.06 mm(r1)/0.05 mm(r2) for HD, −0.01 mm(r1)/0.13 mm(r2) for SD and 0.07 mm(r1)/0.16 mm(r2) for LD.
Linear regression indicates no noticeable differences between methods and the raters with respect to bl and bt.
Conclusions
Relating to the CBCT-device used in this study, LD-CBCT is a promising method to detect and describe buccal and oral periodontal bl and bt. Further studies with human anatomic structures must confirm these results.
Keywords: Cone Beam Computed Tomography, Low-Dose Cone Beam Computed Tomography, computed radiography, periodontitis, periodontal bone defects, orthodontics
Introduction
In dentistry, the standard in imaging is still the two-dimensional radiographs, e.g. panoramic views, lateral cephalometric radiographs, bitewings and periapical images. A lot of clinically relevant information can be drawn from these images with a relatively low amount of radiation dose.1,2 Superimpositions due to anatomical structures, geometric distortions and the two-dimensional representational limit of the informative value of these X-ray images.3 To overcome these limitations, CBCT is one modality to enable three-dimensional imaging. Technical progress has made their use interesting for an increasing amount of indications. Contemporary established devices primarily involve high asset costs and use higher radiation doses compared to the established two-dimensional methods mentioned before.4,5 In recent years, CBCT devices with smaller field of views and the possibility of lower radiation doses have been developed. In general, LD-CBCTs enable the acquisition of three-dimensional images with radiation doses comparable to the doses of panoramic views and lateral cephalometric radiographs.5 A review by Ludlow et al provides an overview of the available devices and associated results. According to this review, radiation doses of 12–29 µSv are attainable.4 As a consequence of the as low as diagnostically achievable (ALADA) principle, this fact makes LD-CBCTs interesting for orthodontic indications for instance. A three-dimensional illustration of a present buccal periodontal defect could help the orthodontist to avoid an out-of-the-bone tooth movement followed by the risk of a gingival recession.6 This risk especially exists with lower incisors movements. Accordingly, the treatment could become more patient specific.7 Studies about the capacity of CBCT to illustrate the bone morphology around teeth and implants have already been published, but only a few of them dealt with the actual precision of CBCT in detecting buccal bone by LD protocols.8–13
Thus, this study aims to evaluate the suitability of LD-CBCT to image alveolar buccal and oral bone adjacent to teeth in porcine hemimandibles. We assert that LD-CBCT is as suitable to image alveolar bone adjacent to teeth as high-dose CBCT (HD-CBCT) and standard-dose CBCT (SD-CBCT) in this experimental setting.
Methods and materials
This ex vivo study consists of 7 porcine hemimandibles with a total of 69 default sites at 35 teeth were investigated radiographically by Micro-CT(MCT) and three CBCT-modes: high-dose (HD), standard-dose (SD) and low-dose (LD). A case number planning was not made because the number of sites was limited by the amount of available teeth.
The pig mandibles used were free of soft tissue. Images of two hemimandibles were acquired simultaneously with a CBCT for each measurement. The hemimandibles were positioned to imitate a full arch mimicking the shape of a whole mandible. Teeth were all free of decay and restorative materials.
Micro-computed tomography
CT examinations were performed using an industrial MCT (Y.Fox; Yxlon, Garbsen, Germany) equipped with an open multifocus X-ray tube and a 14-bit amorphous silicon flat panel detector (Varian PaxScan 2520 D/CL; Varian, Palo Alto, CA).14,15 Each hemimandible was positioned in the field of view under the X-ray source. Imaging was performed with a tube voltage of 80 KV (current 75 µA), a rotation of 360° within 33 s scan time and a continuous image acquisition at 30 fps (frames per second) resulting in 990 projections. Reconstruction of RAW-Data was done by a filtered back projection algorithm with a matrix of 512 × 512 x 512 (Reconstruction Studio, Tera Recon). Pixel spacing was 0.0568 x 0.0568 mm with a slice thickness of 0.07 mm.
Cone beam computed tomography
Imaging was performed on a CBCT (Orthophos 3D SL ®, DentsplySirona
Quantitative Radiology, Verona, Italy) with the following three different volumetric acquisition protocols:
2.1 s radiation time, 10 mA, 85 kV, FOV 8 × 8 cm2, isotropic voxel size 0.16 mm, Dose–Area-product (DAP) 47 mGy cm2
4.3 s radiation time, 10 mA, 85kV, FOV 8 × 8 cm2, isotropic voxel size 0.16 mm, DAP 334 mGy cm2
14.2 s radiation time, 6 mA, 85 kV, FOV 8 × 8 cm2, isotropic voxel size 0.08 mm, DAP 657 mGy cm2
Image review
For analysis, MCT and CBCT data were exported in DICOM format to the application software OSIRIX pro (aycanOsiriX 2.06.000). Windowing and levelling were allowed. Evaluations were all performed on a certified monitor (EIZO, RadiForce RS 210) in the same dark room.
The review of the images in MCT was done by three dentists (MR, SS, HG) with more than eight years (MR, SS) and 15 years (HG) of experience in CBCT-diagnostics for consensus in order to define a gold-standard. The orientation procedure was as follows1: The center of the root canal was identified in the axial plane,2 afterwards, the sagittal plane was orientated along the root canal.3 A quantitative image analysis was then made in the corresponding coronal plane. The distance from cementoenamel junction to the most coronal point of the buccal and oral bone was measured at 69 default sites. Furthermore, the thickness of the buccal and oral bone at these 69 sites was measured 0.2 mm apically of the alveolar crest. The raters could adjust the brightness and contrast setting for best display. Characterizing anatomic landmarks at the crown were noted to allow reproducibility in all three CBCT data sets. Procedure of measurements is explained in Figure 1.
Figure 1.
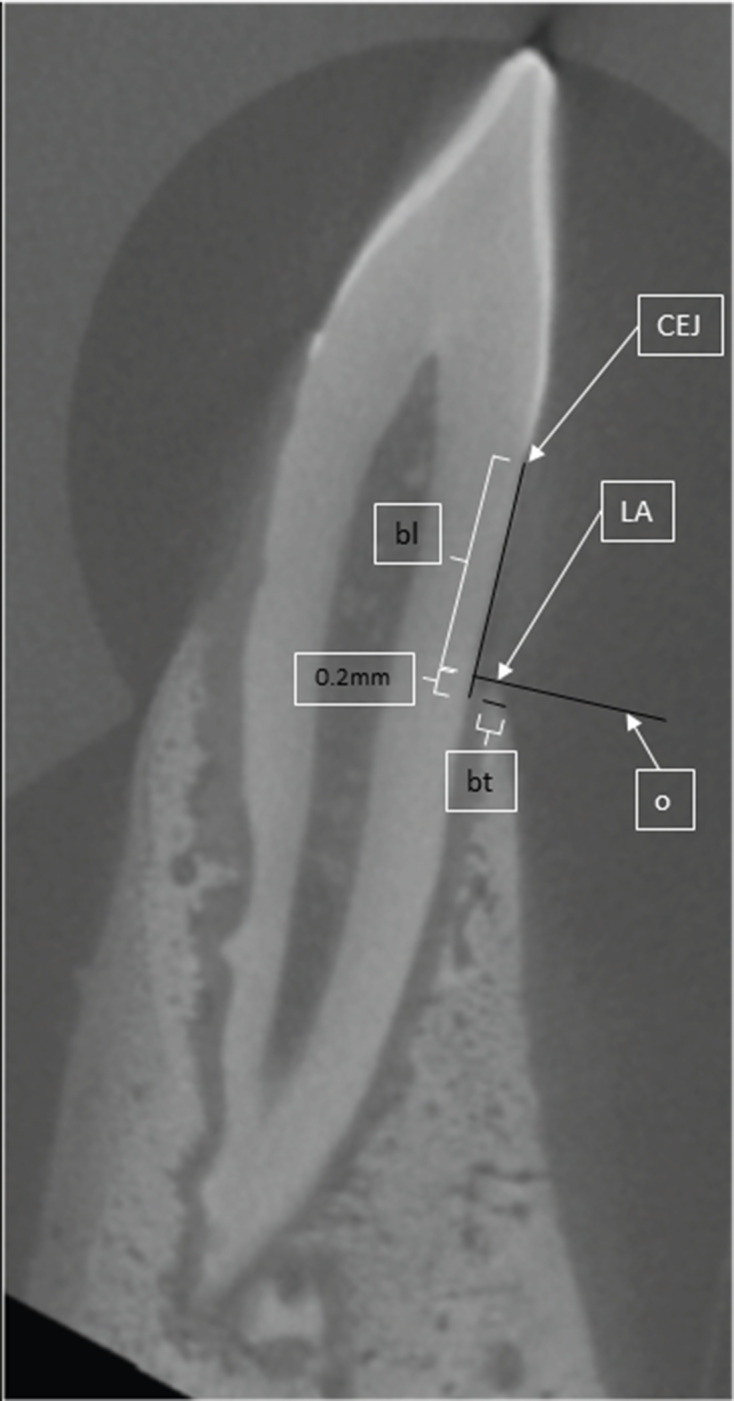
scheme of measurements. CEJ = Cemento-Enamel-Junction, LA = Limbus Alveolaris; bl = vertical bone loss, distance from CEJ to LA; o = orthogonal to bl and tangential to LA, bt = horizontal bone thickness, parallel too
Evaluation of CBCT images was done likewise separately by two raters (r1 and r2) with more than 8 years in CBCT imaging (MR, SS) blinded to the Micro-CT measurements and the measurements of the spare CBCT data 10 weeks after MCT-measurements. There was a gap of 2 weeks between the measurements of LD, SD and HD (Figure 2). Anatomic landmarks and an image of the corresponding layers of the CBCT protocol analysed were given to allow the very same position in all data sets. Rater 1 reproduced all maeasurements after 2 months to allow the calculation of intrarater reliability.
Figure 2.

Examples of device- and protocol-dependent images of the same tooth. (a) Micro-CT, (b) HD-CBCT, (c) SD-CBCT, (d) LD-CBCT. LD-CBCT, low-dose CBCT; HD-CBCT, high-dose CBCT; SD-CBCT, standard-dose CBCT.
For calibration, the raters both reproduced measurements of 260 default sites in HD-CBCT-Scans of human mandibles and achieved a Lin´s concordance coefficient (CCC) of 0.994 (95% confidence interval: [0.992; 0.995])
Statistical analysis
Measurements were descriptively documented by listing their means and standard deviations (SDs). Differences between clinical and radiographic measurements were calculated and described by their means and standard deviations. Bland–Altmann plots were created including 95% limits of agreement; where, the clinical measurements were defined as gold-standard. The intraclass correlation coefficient (ICC) including the 95% CI was calculated to assess the interrater reliability as well as the intrarater reliability. Linear mixed regression was used to identify relevant differences between the different methods and between the raters with respect to bt and bl. The difference of the measured values to MCT was used as the dependent variable. The examiner and method (SD-CBCT vs HD-CBCT, LD-CBCT vs HD-CBCT) were included as fixed effects. The jaw was entered the model as a random effect. Regression coefficients (Estimate) with associated 95% CIs and p-values are reported. Since this is an explorative data analysis p-values are of descriptive nature. For statistical analysis the software R v. 4.0.2 in combination with the packages “BlandAltmanLeh” and, “DescTools” were used.16–19
Results
In total, 69 default sites of 35 roots of pig molars and premolars were investigated radiographically in 3 different CBCT protocols and compared to MCT measurements.
The mean distance of vertical measurements (bl) in Micro-CT was 4.0 mm in Micro-CT. the mean of bl-measurements were 4.0 (r1) / 4.1 (r2) in LD-CBCT, in SD-CBCT 3.9 mm (r1)/4.1 mm (r2) in SD-CBCT and in HD-CBCT 4.0 mm (r1)/ 4.0 mm (r2) in HD-CBCT. Corresponding standard deviations are recorded in Table 1.
Table 1.
Descriptive statistic of measurements
| Device | bl-Mean (mm) | SD | bt-Mean (mm) | SD | ||||
|---|---|---|---|---|---|---|---|---|
| MCT | 4.0 | 1.16 | 0.5 | 0.16 | ||||
| Rater 1 | Rater 2 | |||||||
| Device | bl-Mean (mm) | SD | bt-Mean (mm) | SD | bl-Mean (mm) | SD | bt-Mean (mm) | SD |
| HD-CBCT | 4.0 | 1.19 | 0.5 | 0.27 | 4.0 | 1.17 | 0.5 | 0.28 |
| SD-CBCT | 3.9 | 1.18 | 0.5 | 0.27 | 4.1 | 1.18 | 0.5 | 0.33 |
| LD-CBCT | 4.0 | 1.23 | 0.5 | 0.24 | 4.1 | 1.16 | 0.5 | 0.32 |
SD, standard deviation; HD-CBCT, high-dose-CBCT; SD-CBCT, standard-dose-CBCT; LD-CBCT, low-dose-CBCT; MCT, Micro-CT
For bl measurements, the ICC between Rater 1 and Rater 2 was 0.945 for LD-CBCT, 0.949 for SD-CBCT and 0.954 for HD-CBCT. Exact values including 95% confidence interval are shown in Table 2. All protocols showed also high intrarater reliability for both bl and bt-measurements. For bl measurements, the following ICC values resulted: LD-CBCT 0.996, SD-CBCT 0.999 and HD-CBCT 0.998 (Table 3).
Table 2.
ICC-values of interrater agreement of Rater 1 and Rater 2
| Measurement | device | ICC | Lower CI | Upper CI |
|---|---|---|---|---|
| bl | LD-CBCT | 0.945 | 0.913 | 0.965 |
| SD-CBCT | 0.949 | 0.920 | 0.968 | |
| HD-CBCT | 0.954 | 0.927 | 0.971 | |
| bt | LD-CBCT | 0.783 | 0.684 | 0.854 |
| SD-CBCT | 0.845 | 0.768 | 0.897 | |
| HD-CBCT | 0.872 | 0.801 | 0.919 |
CI, Confidence interval; HD-CBCT, high-dose-CBCT;ICC, Intraclass correlation coefficient; LD-CBCT, low-dose-CBCT; SD-CBCT, standard-dose-CBCT.
Table 3.
ICC-values of intrarater agreement
| Measurement | Device | ICC | Lower CI | Upper CI |
|---|---|---|---|---|
| bl | LD-CBCT | 0.996 | 0.994 | 0.997 |
| SD-CBCT | 0.999 | 0.998 | 0.999 | |
| HD-CBCT | 0.998 | 0.997 | 0.999 | |
| bt | LD-CBCT | 0.978 | 0.968 | 0.985 |
| SD-CBCT | 0.985 | 0.977 | 0.99 | |
| HD-CBCT | 0.985 | 0.976 | 0.99 |
CI, Confidence interval; HD-CBCT, high-dose-CBCT;ICC, Intraclass correlation coefficient; LD-CBCT, low-dose-CBCT; SD-CBCT, standard-dose-CBCT.
Regression analysis showed no noticeable differences between the measurements of the different CBCT protocols and between the measurements of the two raters (Table 4).
Table 4.
Mixed model regression (n = 345)
| Measurement | Device/Rater | Estimate | Lower CL | Upper CL | p-value |
|---|---|---|---|---|---|
| bl | SD-CBCT vs HD-CBCT | −0.03 | −0.494 | 0.433 | 0.898 |
| LD-CBCT vs HD-CBCT | 0.06 | −0.29 | 0.41 | 0.737 | |
| R2 vs R1 | 0.09 | −0.26 | 0.44 | 0.615 | |
| bt | SD-CBCT vs HD-CBCT | 0.057 | −0.067 | 0.182 | 0.368 |
| LD-CBCT vs HD-CBCT | 0.046 | −0.048 | 0.14 | 0.341 | |
| R2 vs R1 | −0.012 | −0.107 | 0.082 | 0.796 |
HD-CBCT, high-dose CBCT; LD-CBCT, low-dose CBCT; SD-CBCT, standard-dose CBCT.
A linear mixed regression model was calculated for bt and bl, respectively. The difference of the measured values to MCT was used as the dependent variable. The jaw was considered in the model as a random effect. The examiner and method (SD-CBCT vs HD-CBCT, LD-CBCT vs HD-CBCT) were included as fixed effects. Regression coefficient (Estimate), associated confidence interval (CI), and p-value are reported.
The means of differences of all bl-measurements from LD-CBCT to Micro-CT were 0.07 mm (r1)/0.16 mm (r2), from SD-CBCT to Micro-CT −0.01 mm (r1)/ 0.13 mm (r2) and from HD-CBCT to Micro-CT 0.06 mm (r1)/0.05 mm (r2). Standard deviations can be seen in the corresponding Bland–Altman plot. (Figure 3)
Figure 3.

Bland–Altman Plots of bl-measurements. Bland–Altman LD = LD CBCT vs MCT-measurements; Bland–Altman SD = SD CBCT vs MCT; Bland–Altman HD = HD CBCT vs MCT; upper and lower dashed lines: 95% of values are in between these two lines, middle dashed line: mean difference. The mean of differences of all bl-measurements (A + B) from LD-CBCT to Micro-CT were 0.07 mm ±1.96 SD:[−0.63; 0.78] (r1)/0.16 mm ±1.96 SD:[ −0.45; 0.77](r2), (C + D) from SD-CBCT to Micro-CT −0.01 mm ±1.96 SD:[ −0.68;0.64](r1)/ 0.13 ± 1.96SD:[−0.47; 0.75] and (E + F) from HD-CBCT to Micro-CT 0.06 mm ±1.96SD: [−0.50; 0.63](r1)/0.05 mm ±1.96 SD: [−0.51;0.62](r2). LD-CBCT, low-dose CBCT; HD-CBCT, high-dose CBCT; SD-CBCT, standard-dose CBCT.
The mean of bt-measurements in MCT was 0.5 mm SD, the mean bt in LD-CBCT 0.5 mm(r1)/0.5 mm(r2), in SD-CBCT 0.5 mm (r1)/0.5 mm (r2) and in HD-CBCT 0.5 mm (r1)/0.5 mm (r2) (Table 1).
For bt-measurements, the ICCs between Rater 1 and Rater 2 were 0.783 for LD-CBCT, 0.845 for SD-CBCT and 0.872 for HD-CBCT (Table 2). For bt measurements, the intrarater ICCs were 0.978 in LD-CBCT, 0.985 in SD-CBCT and 0.985 in HD-CBCT (Table 4).
The means of differences of all bt-measurements from LD-CBCT to Micro-CT were 0.02 mm (r1)/0.03 mm (r2), from SD-CBCT to Micro-CT 0.04 mm (r1)/ 0.02 and from HD-CBCT to Micro-CT −0.01 mm (r1)/0.00 mm (r2). (Figure 4)
Figure 4.

Bland–Altman Plots of bt-measurements. LD = LD CBCT, MCT = micro CT, SD = SD CBCT, HD = HD CBCT; upper and lower dashed lines: 95% of values are in between these two lines, middle solid line: mean difference; The means of differences of all bt-measurements (A + B) from LD-CBCT to Micro-CT were 0.02 mm ±1.96 SD:[−0.39; 0.43] (r1)/0.03 mm ±1.96 SD:[−0.28; 0.35](r2), (C + D) from SD-CBCT to Micro-CT 0.04 mm ±1.96 SD:[−0.31; 0.40](r1)/ 0.02 ± 1.96SD:[−0.33; 0.37] and E + F) from HD-CBCT to Micro-CT −0.01 mm ±1.96SD: [−0.32; 0.30](r1)/0.00 mm ±1.96 SD: [−0.33; 0.34](r2). LD-CBCT, low-dose CBCT; HD-CBCT, high-dose CBCT; SD-CBCT, standard-dose CBCT.
Discussion
The hypotheses of this study, that LD-CBCT was as suitable to image alveolar bone adjacent to teeth as HD-CBCT and SD-CBCT in this experimental setting can be confirmed for the CBCT device used. The high ICC-values indicate excellent inter- and intrarater reliability for both types of measurements (bl and bt) for all CBCT protocols used.20
All protocols showed high concordances with Micro-CT measurements for both raters. Higher deviations of the means were observed for LD- CBCT during the analysis of bl measurements. Limits of agreements are less than 0.8 mm for both raters. The higher deviations may be due to contrasts in LD-CBCT, which are less prevalent, and the structures are harder to define. The cementoenamel junction, which was used as a local identifier for the measurements, are easier to observe in HD-CBCT than in LD-CBCT. This could explain higher deviations in LD-CBCTs in both raters.
The limits of agreements are less than 0.43 mm in bt, which is also a very good result. Linear regression indicated no significant differences between LD-CBCT measurements and HD-CBCT measurements. It follows that HD-CBCTs does not provide substantially more information of bt, using these experimental settings cf. LD-CBCTs independent of the rater. The mean of differences of bt measurements are all almost around 0. This shows that there is almost no under- or overestimation of bt. Existing studies showed similar results.11 The mean of bt-measurements (0.5 mm) is close to the mean of measurements in human studies.21 As a result, the anatomy of the bone laminas measured in this study reflect the anatomy of human bone laminas.
The mean of differences of bl show almost no over- or underestimation in HD-CBCTs and only a slight overestimation of bl in LD-CBCT. Another study exhibited similar results for CBCTs.11 A study by Patcas et al showed higher deviations represented by higher limits of agreements. This could be due to the lower resolutions selected and that they had human cadavers with gingiva. This probably contributes to a slightly lower CNR (contrast-to-noise-ratio). In our study a high resolution CBCT-device of a newer generation was used.
Differences in Micro-CT can be explained by the higher image quality compared to CBCTs. Moreover, the partial volume effect in CBCTs might be higher and can cause differences in bt and bl measurements. The image becomes more diffuse in bordering tissues of different densities such as bone and periodontal ligament or dentine and enamel. A clear and sharp depiction of the tissue’s edges becomes harder.22 The slightly better results of HD-CBCT could also be explained by the smaller isotropic voxelsize of 0.08 mm as compared to an isotropic voxelsize of 0.16 mm in SD and LD protocols. This possibly results in a reduction of the partial volume effect in HD-CBCT.23
Overall, the very good results of LD-CBCT in this study are promising for a possible implementation of LD-CBCT in routine clinical use in the future. The low DAP of 47 mGy·cm² is only slightly higher than the one used for digital Panoramic views (28 mGy·cm²) but far lower compared to analog Panoramic views (88 mGy·cm²).24 According to the manufacturer of the CBCT used in this study, the DAP of a lateral cephalometric image – acquired with one of these devices – is in the range of 22 to 26 mGy·cm².25 Thus, a combination of a Panoramic view and a lateral Cephlompetric as often used in orthodontic routine can could result in a higher DAP compared to LD-CBCT. LD-CBCT on the other hand provides truly three-dimensional information and allows for computing multiplanar reformations. Additionally, the DAP of a full mouth status taken for periodontic indications is in the range of about 67 mGy·cm² using conventional digital radiographic techniques.24 This is also higher than the DAP of the LD-CBCT in our study. Therefore, patients may benefit from more anatomic information with an even lower radiation dose level when receiving a LD-CBCT. Future studies have to investigate more indications and devices for LD-CBCT aiming for an evidence-based use of different imaging techniques.
A limitation of this study is the fact that it was performed with porcine hemimandibles and not with humans. The teeth had no restorative treatments. Accordingly, no artifacts of dental materials were present.26 Moreover, no soft tissues, e.g. cheek and gingiva were present. This leads to a lower CNR resulting in a better illustration of the bone in this setting compared to in vivo images of a human mandible with cheek and gingiva.27 The ex vivo conditions of this study leads to the absence of natural motion, e.g. caused by a head tremor leading to motion artifacts. These can deteriorates the images’ quality and the information of the images.26
Besides, the present study included only two expert observers to assess the modalities, as the main aim was to investigate the performance capabilities of the different CBCT protocols. However, it has already been shown, e.g. in the field of endodontics, that diagnostic results in CBCT findings also depend on the level of experience of the investigators.28 The study cited involved the detection of apical osteolysis. Such experience-dependent findings must also be assumed for the periodontal structures examined in our study, the oral and vestibular bone. An existing study on reliability of measurements of marginal bone level has shown that the interrater reliability is lower when different levels of experience of the examiners are included compared to the present study (0.4 vs 0.945 (LD-CBCT)).29 This fact should always be kept in mind when interpreting the data of this study.
Conclusion
This study demonstrates that LD-CBCT seems to be a highly precise and reliable method to detect and describe periodontal bl and bt relating to the CBCT-device used. Accordingly, it could help to better plan and predict the success of orthodontic and periodontic therapy with a low radiation dosage. Further studies with different devices and human anatomic structures must be performed to confirm these results.
Footnotes
Acknowledgments: Special thanks to Mrs Henriette Waldecker of the Department of dento-maxillofacial surgery of the University hospital Heidelberg for their technical support.
Author contributions: Maurice Rütters, Sinan Sen, Ti-Sun Kim, Christopher Lux, Dorothea Kronsteiner and Holger Gehrig contributed substantially to the study conception and design. Substantial material preparation and data collection were performed by Maurice Rütters, Sinan Sen and Vanessa Weyer. Substantial analysis was performed by Dorothea Kronsteiner, Maurice Rütters and Sinan Sen. The first draft of the manuscript was written by Maurice Rütters and Sinan Sen, all authors commented on previous versions of the manuscript. All authors read and approved the final manuscript.
Funding: The work was supported by the Department of Operative Dentistry, the Department of Orthodontics and the Department of Oral and -Maxillofacial Surgery of the University Hospital Heidelberg. Maurice Ruetters is partly funded by the Physician-Scientist Program of Heidelberg University, Faculty of Medicine. Open Access funding enabled and organized by Projekt DEAL.
Ethical approval: Ethical approval was not necessary because no human participants were involved. This study is based on animals (porcine mandibles) and these animals had already been sacrificed and dissected for educational purpose before this study. No additional harming on the animals has been performed to perform this study.
Contributor Information
Maurice Ruetters, Email: maurice.ruetters@med.uni-heidelberg.de.
Holger Gehrig, Email: holger.gehrig@med.uni-heidelberg.de.
Dorohtea Kronsteiner, Email: kronsteiner@imbi.de.
Vanessa Weyer, Email: vanessa.weyer@medma.uni-heidelberg.de.
Ti-Sun Kim, Email: ti-sun.kim@med.uni-heidelberg.de.
Christopher J. Lux, Email: christopher.lux@med.uni-heidelberg.de.
REFERENCES
- 1.Grünheid T, Kolbeck Schieck JR, Pliska BT, Ahmad M, Larson BE. Dosimetry of a cone-beam computed tomography machine compared with a digital X-ray machine in orthodontic imaging. Am J Orthod Dentofacial Orthop 2012; 141: 436–43. doi: 10.1016/j.ajodo.2011.10.024 [DOI] [PubMed] [Google Scholar]
- 2.Qiang W, Qiang F, Lin L. Estimation of effective dose of dental X-ray devices. Radiat Prot Dosimetry 2019; 183: 418–22. doi: 10.1093/rpd/ncy159 [DOI] [PubMed] [Google Scholar]
- 3.Furhmann A. Zahnärztliche Radiologie. Stuttgart: Georg Thieme Verlag KG 2013;: 189.p.. [Google Scholar]
- 4.Ludlow JB, Davies-Ludlow LE, White SC. Patient risk related to common dental radiographic examinations: the impact of 2007 International Commission on radiological protection recommendations regarding dose calculation. J Am Dent Assoc 2008; 139: 1237–43. doi: 10.14219/jada.archive.2008.0339 [DOI] [PubMed] [Google Scholar]
- 5.Ludlow JB, Timothy R, Walker C, Hunter R, Benavides E, Samuelson DB, et al. Effective dose of dental CBCT-a meta analysis of published data and additional data for nine CBCT units. Dentomaxillofac Radiol 2015; 44: 20140197. doi: 10.1259/dmfr.20140197 [DOI] [PMC free article] [PubMed] [Google Scholar]
- 6.Cortellini P, Bissada NF. Mucogingival conditions in the natural dentition: narrative review, case definitions, and diagnostic considerations. J Clin Periodontol 2018; 45 Suppl 20(Suppl 20): S190–8. doi: 10.1111/jcpe.12948 [DOI] [PubMed] [Google Scholar]
- 7.Lee RJ, Weissheimer A, Pham J, Go L, de Menezes LM, Redmond WR, et al. Three-Dimensional monitoring of root movement during orthodontic treatment. Am J Orthod Dentofacial Orthop 2015; 147: 132–42. doi: 10.1016/j.ajodo.2014.10.010 [DOI] [PubMed] [Google Scholar]
- 8.Yeung AWK, Harper B, Zhang C, Neelakantan P, Bornstein MM. Do different cone beam computed tomography exposure protocols influence subjective image quality prior to and after root canal treatment? Clin Oral Investig 2021; 25: 2119-2127. doi: 10.1007/s00784-020-03524-w [DOI] [PMC free article] [PubMed] [Google Scholar]
- 9.Ruetters M, Hagenfeld D, ElSayed N, Zimmermann N, Gehrig H, Kim T-S. Ex vivo comparison of CBCT and digital periapical radiographs for the quantitative assessment of periodontal defects. Clin Oral Investig 2020; 24: 377–84. doi: 10.1007/s00784-019-02933-w [DOI] [PubMed] [Google Scholar]
- 10.Mol A, Balasundaram A. In vitro cone beam computed tomography imaging of periodontal bone. Dentomaxillofac Radiol 2008; 37: 319–24. doi: 10.1259/dmfr/26475758 [DOI] [PubMed] [Google Scholar]
- 11.Patcas R, Müller L, Ullrich O, Peltomäki T. Accuracy of cone-beam computed tomography at different resolutions assessed on the bony covering of the mandibular anterior teeth. Am J Orthod Dentofacial Orthop 2012; 141: 41–50. doi: 10.1016/j.ajodo.2011.06.034 [DOI] [PubMed] [Google Scholar]
- 12.Schwindling FS, Hilgenfeld T, Weber D, Kosinski MA, Rammelsberg P, Tasaka A. In vitro diagnostic accuracy of low-dose CBCT for evaluation of peri-implant bone lesions. Clin Oral Implants Res 2019; 30: 1200–8. doi: 10.1111/clr.13533 [DOI] [PubMed] [Google Scholar]
- 13.Sun L, Zhang L, Shen G, Wang B, Fang B. Accuracy of cone-beam computed tomography in detecting alveolar bone dehiscences and fenestrations. Am J Orthod Dentofacial Orthop 2015; 147: 313–23. doi: 10.1016/j.ajodo.2014.10.032 [DOI] [PubMed] [Google Scholar]
- 14.Şen S, Erber R, Kunzmann K, Kirschner S, Weyer V, Schilling L, et al. Assessing abrasion of orthodontic surface sealants using a modified ophthalmic optical coherence tomography device. Clin Oral Investig 2018; 22: 3143–57. doi: 10.1007/s00784-018-2410-5 [DOI] [PubMed] [Google Scholar]
- 15.Weyer V, Maros ME, Kronfeld A, Kirschner S, Groden C, Sommer C, et al. Longitudinal imaging and evaluation of SAH-associated cerebral large artery vasospasm in mice using micro-CT and angiography. J Cereb Blood Flow Metab 2020; 40: 2265–77. doi: 10.1177/0271678X19887052 [DOI] [PMC free article] [PubMed] [Google Scholar]
- 16.Team RC R: A language and environment for statistical computing: R Foundation for Statistical Computing, Vienna, Austria. 2013. Available from: http://www.R-project.org/.
- 17. Matthias Gamer J.L. 2012. Ian Fellows Puspendra Singh. irr: Various Coefficients of Interrater Reliability and Agreement. R package. version 0.84 Available from: http://CRAN.R-project.org/package=irr..
- 18. Andri S, al etmult. 2020. DescTools: Tools for descriptive statistics. R package. version 0.99.38.
- 19. Lehnert B. 2015b. BlandAltmanLeh: Plots (Slightly Extended) Bland-Altman Plots. R package. version 0.3.1.
- 20.Fleiss JL. Reliability of measurement. The Design and Analysis of Clinical Experiments 1999;: 1. -–32p.. [Google Scholar]
- 21.Lee S, Hwang S, Jang W, Choi YJ, Chung CJ, Kim K-H. Assessment of lower incisor alveolar bone width using cone-beam computed tomography images in skeletal class III adults of different vertical patterns. Korean J Orthod 2018; 48: 349–56. doi: 10.4041/kjod.2018.48.6.349 [DOI] [PMC free article] [PubMed] [Google Scholar]
- 22.Joseph PM, Spital RD. The exponential edge-gradient effect in X-ray computed tomography. Phys Med Biol 1981; 26: 473–87. doi: 10.1088/0031-9155/26/3/010 [DOI] [PubMed] [Google Scholar]
- 23.Maret D, Telmon N, Peters OA, Lepage B, Treil J, Inglèse JM, et al. Effect of voxel size on the accuracy of 3D reconstructions with cone beam CT. Dentomaxillofac Radiol 2012; 41: 649–55. doi: 10.1259/dmfr/81804525 [DOI] [PMC free article] [PubMed] [Google Scholar]
- 24.Hingst V, Weber M-A. Dentale Röntgendiagnostik mit der Panoramaschichtaufnahme – Technik und typische Bildbefunde. Radiologe 2020; 60: 77–92. doi: 10.1007/s00117-019-00620-1 [DOI] [PubMed] [Google Scholar]
- 25.GmbH DSD. Bensheim: Dentsply Sirona Deutschland GmbH. 2020 [updated 2020;26.10.. [Google Scholar]
- 26.Schulze R, Heil U, Gross D, Bruellmann DD, Dranischnikow E, Schwanecke U, et al. Artefacts in CBCT: a review. Dentomaxillofac Radiol 2011; 40: 265–73. doi: 10.1259/dmfr/30642039 [DOI] [PMC free article] [PubMed] [Google Scholar]
- 27.Souza PHC, da Costa NP, Veeck EB. Influence of soft tissues on mandibular gray scale levels. Braz Oral Res 2004; 18: 40–4. doi: 10.1590/S1806-83242004000100008 [DOI] [PubMed] [Google Scholar]
- 28.Parker JM, Mol A, Rivera EM, Tawil PZ. Cone-Beam computed tomography uses in clinical Endodontics: observer variability in detecting periapical lesions. J Endod 2017; 43: 184–7. doi: 10.1016/j.joen.2016.10.007 [DOI] [PubMed] [Google Scholar]
- 29.Al-Okshi A, Paulsson L, Rohlin M, Ebrahim E, Lindh C. Measurability and reliability of assessments of root length and marginal bone level in cone beam CT and intraoral radiography: a study of adolescents. Dentomaxillofac Radiol 2019; 48: 20180368. doi: 10.1259/dmfr.20180368 [DOI] [PMC free article] [PubMed] [Google Scholar]