

Abstract
Background.
In May 2018, the World Health Organization (WHO) Director-General issued a global call to eliminate cervical cancer (CC) as a public health problem, which will involve setting ambitious screening and vaccination coverage targets. We performed a comparative modeling analysis using two models from the Cancer Intervention and Surveillance Modeling Network (CISNET) to explore the impact of adopting CC coverage targets outlined by the WHO on cervical cancer incidence in the United States.
Methods.
We used two independently-developed CISNET models that involved a dynamic multicohort-modeling platform to capture changes in human papillomavirus (HPV)-induced CC over time, including herd effects from vaccination. We evaluated nine alternative prophylactic HPV vaccination and cervical screening scale-up scenarios compared with a ‘status quo’ scenario that involved no additional interventions in the context of a threshold for CC elimination of 4 cases/100,000 women.
Findings.
Under status-quo assumptions, both models projected that CC incidence would fall below 4/100,000 women by year 2038–2046. Scaling up screening coverage to 90% was the most impactful intervention in terms of expediting elimination timing (10–13 years earlier) and relative cancer reductions, averting an average of 1,400–2,088 additional cases per year over 2020–2100. Increasing HPV vaccination coverage to 90% or vaccinating adults aged 26–45 years had minimal impacts on CC incidence. Sensitivity analysis using different population structures generated a range of −10/+27 years around ‘status quo’ predictions.
Interpretation.
These validated CISNET-Cervical models, which reflect uncertainty in the natural history of CC, found that the United States is on track to eliminate cervical cancer as a public health problem by 2038–2046. Elimination timing could be brought forward to 2028–2033 if higher screening coverage is achieved. These national average estimates do not apply to all subgroups of women; therefore, reaching under-screened and under-vaccinated women remain key to achieving CC elimination for all women.
INTRODUCTION
In May 2018, the World Health Organization (WHO) Director-General issued a global call for action towards the elimination of cervical cancer as a public health problem (1), which involves setting ambitious screening and vaccination coverage goals. The draft WHO strategic plan for elimination proposes a cervical cancer incidence target of four cases per 100,000 women per year. Similar to other high-income countries, the age-standardized cervical cancer incidence rates in the U.S. are low (approximately seven cases per 100,000 women (2)), but currently above the WHO elimination incidence target threshold. The draft strategy of the WHO coverage targets currently involves achieving coverage targets of 90% of girls vaccinated against human papillomavirus (HPV) by age 15, 70% of women screened, and 90% compliance with precancer and invasive cancer treatment recommendations (1).
Although the U.S. was one of the first countries to implement prophylactic human papillomavirus (HPV) vaccination, the U.S. has not achieved the same high coverage among adolescent girls and boys as other countries, such as the United Kingdom and Australia (3). In addition, screening practice is sub-optimal; many women are underscreened and an estimated 14% of women are never screened (4). Although there are improvements expected from switching to primary HPV testing compared with Pap-based screening (5), the effectiveness of screening is dependent on high, routine coverage and compliance to follow-up and treatment recommendations. The combined effect of HPV vaccination and HPV-based screening will likely lead to substantial declines in cervical cancer incidence in the U.S. in the near term; however, adopting WHO elimination coverage goals has potential to improve the effectiveness and efficiency of current cervical cancer control efforts.
Given the decades-long natural history of HPV infection to cervical cancer, understanding the timing of the future cervical cancer burden in the U.S. under current primary and secondary prevention efforts requires the use of mathematical simulation models, which have been used to support the planning of the WHO’s elimination goals (1). Using comparative modeling enhances model transparency and can help guide public health research and priorities. We performed a comparative modeling analysis using two cervical cancer models from the Cancer Intervention and Surveillance Modeling Network (CISNET) consortium (https://cisnet.cancer.gov/) to explore the impact of adopting the WHO screening and vaccination coverage goals on timing of cervical cancer elimination strategies in the U.S.
METHODS
Analytic overview
We used two CISNET-Cervical microsimulation models (Harvard and Policy1-Cervix [Cancer Council New South Wales, Australia]) to project age-standardized cervical cancer incidence rates per 100,000 women and the number of cervical cancer cases averted over 2019–2100 associated with adopting the WHO cervical cancer screening and vaccination coverage goals, as well as other potential strategies (Table 1).
Table 1.
Alternative cervical cancer screening and human papillomavirus (HPV) high-coverage scenarios under current and expanded U.S. cervical cancer control strategies
| Scenario | Screening | Vaccinationa | |||
|---|---|---|---|---|---|
|
| |||||
| Current U.S. Strategy | Coverage (years 2020+) | Strategy | Coverage (years 2020+) | ||
|
| |||||
| ‘Status quo’ | 1 | Cytology-based screening (ages 21–65) | ’Status quo’b | Girls aged 12–26, Boys aged 12–21 | ’Status quo’d |
|
| |||||
| WHO High-coverage Targets | 2 | Cytology-based screening (ages 21–65) | 90% coveragec | Girls aged 12–26, Boys aged 12–21 | ’Status quo’d |
| 3 | Cytology-based screening (ages 21–65) | ’Status quo’b | Girls aged 12–26, Boys aged 12–21 | 90% girls-only aged 12 (‘Status quo’ boys)e | |
| 4 | Cytology-based screening (ages 21–65) | 90% coveragec | Girls aged 12–26, Boys aged 12–21 | 90% girls-only aged 12 (‘Status quo’ boys)e | |
|
| |||||
| Alternative Targets | 5 | Cytology-based screening (ages 21–65) | ‘Status quo’b | Girls aged 12–26, Boys aged 12–21 | 90% girls + 90% boys aged 12e |
| 6 | Cytology-based screening (ages 21–65) | 90% coveragec | Girls aged 12–26, Boys aged 12–21 | 90% girls + 90% boys aged 12e | |
| 7 | Cytology-based screening (ages 21–65) | ‘Status quo’b | Girls aged 12–45, Boys aged 12–45 | ‘Status quo’ + extended MAC age 45f | |
| 8 | Cytology-based screening (ages 21–65) | 90% coveragec | Girls aged 12–45, Boys aged 12–45 | ‘Status quo’ + extended MAC age 45f | |
| 9 | Cytology-based screening (ages 21–65) | ‘Status quo’b | Girls aged 12–26, Boys aged 12–21 | Gradual scale-up 90% girls-only by age 17g | |
| 10 | Cytology-based screening (ages 21–65) | 90% coveragec | Girls aged 12–26, Boys aged 12–21 | Gradual scale-up 90% girls-only by age 17g | |
Abbreviations: MAC, multi-age cohort catch-up
Assumes nonavalent HPV vaccine (HPV-9) starting in 2015 onward and historical vaccination coverage using the first-generation quadrivalent vaccine (HPV-4) starting in 2007 for girls and 2010 for boys. For example, under status quo assumptions, the cumulative HPV vaccination coverage for girls turning 12 in 2020 was assumed to reach 65% by age 17 years and 75% by age 26 years. For boys turning 12 in 2020, cumulative vaccination coverage was assumed to reach 55% by age 17 years and 62% by age 21 years (Tables A6 and A7).Vaccine provides 95% lifelong efficacy against vaccine-targeted HPV types.
Assumes screening frequency, and compliance to diagnostic colposcopy/biopsy and precancer treatment referral based on empirical data from the New Mexico HPV Pap Registry. For example, we assumed approximately 9%, 16%, 11%, 35%, and 14% attended screening every 1, 2, 3, 4, or 5 years; while 14% of women were assumed to never participate in screening. Among the women who attend primary screening, we assumed compliance to recommended colposcopy/biopsy or precancer treatment varied from 47% to 76%, depending on cytological or histologic severity (Tables A4 and A5)..
Screening coverage assumes 90% compliance to primary screening test, follow-up/surveillance, colposcopy and treatment in years 2020+. Primary screening compliance assumes 90% of women comply with 3-year cytology and 10% of women never attend screening.
Vaccination coverage was based on data from NIS-TEEN.
Assumes 90% coverage is achieved at age 12 in years 2020+ (girls between ages 13 and 26 in year 2020 continue to follow cumulative uptake reported in NIS-TEEN).
Assumes ‘Status quo’ vaccine coverage based on data from NIS-TEEN and ongoing vaccine uptake of 2.6% per year in females aged 27–45 years and 1.9% per year in males age 22–45 years.
Gradual scale-up of vaccination involves 90% coverage achieved over 5 years (at age 17 years); no change to uptake at age 12 (29.5%); 32.35% uptake each year until age 17; uptake at ages 18+ in year 2020 continue to follow cumulative uptake reported in NIS-TEEN.
We defined the ‘elimination year’ as the year when age-standardized incidence consistently fell below four cases per 100,000, and additionally considered a lower (highly aspirational) US-specific and informal potential threshold of one case per 100,000 women. Base-case results assumed age-standardization using the 2000 US Standard Population (6); sensitivity analysis explored the impact of alternative population structures for global comparisons (Supplementary Appendix Section 3), including the female 2015 World Population, as now recommended for any comparisons between countries and for all incidence estimates to inform WHO strategic planning for cervical cancer elimination (7). We calculated the number of cervical cancer cases by applying female population projections for 2019–2100 from the United Nations (8).
Microsimulation models
The Harvard and Policy1-Cervix CISNET models, which have been described in detail previously (5, 9, 10), differ with respect to the type and number of health states, HPV genotype categorizations, histological cancer types (squamous cell carcinoma in Harvard model; all cervical cancer in Policy1-Cervix), cycle length and data sources used to parameterize the model prior to fitting to the U.S. setting (Appendix Sections 1–2). Both models take into account empirical data from a range of sources by ensuring the resulting model predictions simultaneously correspond to observed data across multiple detailed epidemiological targets.
The Harvard model is an individual-based (i.e., microsimulation) model of cervical carcinogenesis that tracks a birth cohort of individual women through a series of monthly transitions beginning at age 9 years over their lifetimes (11). Each month, a woman may acquire or clear an HPV infection, progress or regress to/from CIN2 or CIN3 and progress to invasive cervical cancer. In contrast to the other CISNET-cervix models, CIN2 and CIN3 are modeled as non-sequential precancerous health states with distinct probabilities of progression to cancer, whereas CIN1 is interpreted as a microscopic manifestation of acute HPV infection and is therefore incorporated into the HPV-infected state. Preclinical cancer may be detected through symptoms or may progress to a more advance clinical stage. Each month, all women are subjected to all-cause mortality and hysterectomy; women with cervical cancer additionally face excess mortality from cervical cancer. Transitions can be a function of age (i.e., HPV incidence), time spent in a health state (i.e., HPV clearance, precancer progression/regression), HPV genotype (HPV16, HPV18, HPV31, HPV33, HPV45, HPV52, HPV58, pooled other high-risk types, and pooled low-risk types), and history of HPV infection (natural immunity). Initial model parameterization of HPV incidence and clearance, progression and regression from CIN2 or CIN3 involved a multi-disciplinary approach requiring analysis of primary empirical data (12, 13), and supplemented by data from published literature and expert opinion (see Supplementary Appendix and Burger et al (10)). Finally, for parameters with high uncertainty, we relied on a multi-parameter calibration process (11) to maximize correspondence between model-projected outcomes and empirical targets.
Policy1-Cervix is a comprehensive model of HPV transmission, HPV vaccination, cervical precancer, cancer survival, screening, diagnosis and treatment. The platform has been used to perform policy evaluations across a range of countries including Australia, England, New Zealand, USA and China (see Supplementary Appendix). The model simulates HPV infection which can persist and/or progress to CIN1, CIN2, or CIN3; CIN 3 can then progress to invasive cervical cancer. Progression and regression rates depend on the underlying HPV types present (HPV16, HPV18, pooled HPV31, HPV33, HPV45, HPV52, HPV58, and pooled other high-risk types), and can also vary by age, generally being more aggressive in older women. Unique to Policy1-Cervix, the model incorporates more aggressive post-treatment natural history to capture increased risk of cervical precancer and cancer in women previously treated for precancer (14). Finally, in addition to the model inputs (e.g., background mortality) and calibration targets standardized across the CISNET models, Policy1-Cervix incorporates data improved survival for women with screen-detected cancer based on published studies (Appendix Section 3.4). Base case results for Policy1-Cervix represent the aggregate results across each birth cohort for a simulation run of 100 million women per birth cohort, utilizing a natural history parameter set that has been selected based on consistency with a wide range of age- and type-specific targets across multiple settings (see Supplementary Appendix).
Both models applied common inputs from the U.S. population, including age-specific hysterectomy rates based on National Hospital Discharge Survey (15); all-cause mortality from the Berkeley Mortality Database (16); and conditional 5-year stage-specific cervical cancer survival from the Surveillance, Epidemiology, and End Results (SEER) program (17). In sensitivity analysis we explored the impact of birth-cohort-specific hysterectomy rates (Appendix Section 3.1). Birth-cohort-specific hysterectomy rates were derived using nationally-representative data on hysterectomy incidence from 1965–2009 in the U.S. and result in lower future estimates of benign hysterectomy prevalence. The models projected age-standardized cervical cancer incidence rates per 100,000 women and the number of cervical cancer cases between 2019 and 2100. Base case results assumed age-standardization based on the 2000 US Standard Population (ages 0–99 years), consistent with Surveillance, Epidemiology and End Results Program (SEER) (6); sensitivity analysis explored the impact of alternative population structures on the ‘elimination year’ (7); in particular, when we used the 2015 World Population from ages 0–99 years (WP2015), which is the benchmark population structure being used for global predictions by the WHO. We calculated the number of cervical cancer cases by applying female population projections between 2019 and 2100 (using linear interpolation for single years) from the United Nations Development Programme (8).
To standardize the models to the HPV and cervical disease burden in the U.S, we selected sources for calibration target data on the basis of representativeness of the general population, sampling methods, and sample size. All data were collected from populations prior to HPV vaccination. Age-specific prevalence of HPV infections was based on data from the New Mexico HPV Pap Registry (NMHPVPR), the only statewide screening registry in the United States (18), HPV type distribution in cases of CIN and cancer were also included as calibration target data. For CIN 2 and CIN 3, HPV type distribution was based on data from the NMHPVPR (19) for cancer, HPV type distribution in cancer was based on a recent study by the US Centers for Disease Control and Prevention (CDC) using tissue samples from US population-based cancer registries (20). Both models achieved good fit to common calibration targets and validation targets of historical (1950–1959) and current (2008–2012) cervical cancer incidence (Figures A2–A4).
Scenarios
We compared a scenario reflecting ‘status quo’ cervical cancer screening and HPV vaccination coverage to nine alternative screening and vaccination scale-up scenarios (Table 1). ‘Status quo’ screening involved 3-yearly cytology screening in women aged 21–65 years with management according to established guidelines (21). Similar to previous analyses (4), screening practice was based on empirical lab-based data from the New Mexico HPV Pap Registry and reflected a distribution of over- and under-screening (Table A3). For example, we assumed approximately 9%, 16%, 11%, 35%, and 14% attended screening every 1, 2, 3, 4, or 5 years, while 14% of women were assumed to never participate in screening. Among women who attend primary screening, we assumed compliance to recommended colposcopy/biopsy or precancer treatment varied from 47% to 76%, depending on preceding cytological or histologic severity (Tables A4 and A5). Age- and sex-specific HPV vaccination coverage was based on NIS-TEEN interviews, including historical vaccination coverage using the quadrivalent vaccine starting in 2007 for girls and 2010 for boys and the nonavalent HPV vaccine from 2015 onwards, based on updated U.S. guidelines (Appendix Section 3). For example, under status quo assumptions, the cumulative HPV vaccination coverage for girls who turn age 12 years in 2020 was assumed to reach ~65% by age 17 years and ~75% by age 26 years. For boys who turn age 12 years in 2020, cumulative vaccination coverage was assumed to reach ~55% by age 17 years and ~62% by age 21 years (Tables A6 and A7). Vaccination was assumed to provide 95% lifelong protection against incident HPV infections targeted by the vaccines.
The ‘WHO coverage strategies’ involved immediate 90% vaccination coverage of 12-year-old girls starting in 2020, and/or 90% screening coverage and 90% follow-up compliance to colposcopy/biopsy and precancer treatment, if indicated. We assumed no change in current access or delivery of treatment or palliation for invasive cervical cancer from that currently experienced in the U.S. Screening coverage of 90% was applied as assuming 10% of women were never screened, and the remaining 90% complied with the recommended 3-year screening interval. ‘Alternative strategies’ varied assumptions for vaccination by sex (including boys), age (including elective mid-adult vaccination of men and women to age 45 years), and delayed timing of vaccination coverage target (cumulative uptake of 90% achieved before age 18, rather than at age 12 years). Based on a recently published framework of recommended reporting standards for model-based analyses of HPV-related disease (22), we have included the HPV-FRAME checklist in Supplementary Appendix Section 4.
Role of the funding source
This study was supported by funding from the U.S. National Cancer Institute (U01CA199334). The contents are solely the responsibility of the authors and do not necessarily represent the official views of the National Cancer Institute. The funder of the study had no role in study design, data collection, data analysis, data interpretation, or writing of the report. The corresponding author had full access to all of the data and the final responsibility to submit for publication.
RESULTS
Under ‘status quo’ screening and vaccination assumptions, cervical cancer incidence was projected to fall below a rate of four per 100,000 women between 2038 (Harvard) and 2046 (Policy1-Cervix) and did not fall below one per 100,000 women by 2100 in either model (Figure 1). Scaling up vaccination coverage to 90% in girls only had minimal impact on the elimination year, (one year earlier in the Harvard model; three years earlier in Policy1-Cervix). In contrast, scaling up screening coverage to 90% achieved a rate below four per 100,000 women 10–13 years earlier (between years 2028 and 2033) (Figure 1). The alternative scenarios involving scaling up vaccination targeting additional groups (e.g., boys, mid-adult women) also had only marginal effect on the elimination year, and had no effect compared to scaling up coverage in girls only (Table 2).
Figure 1. Age-standardized (U.S. 2000 Population ages 0–99 years) incidence per 100,000 women under ‘status quo’ and two high-coverage screening and vaccination scenarios for two CISNET-Cervical disease simulation models.
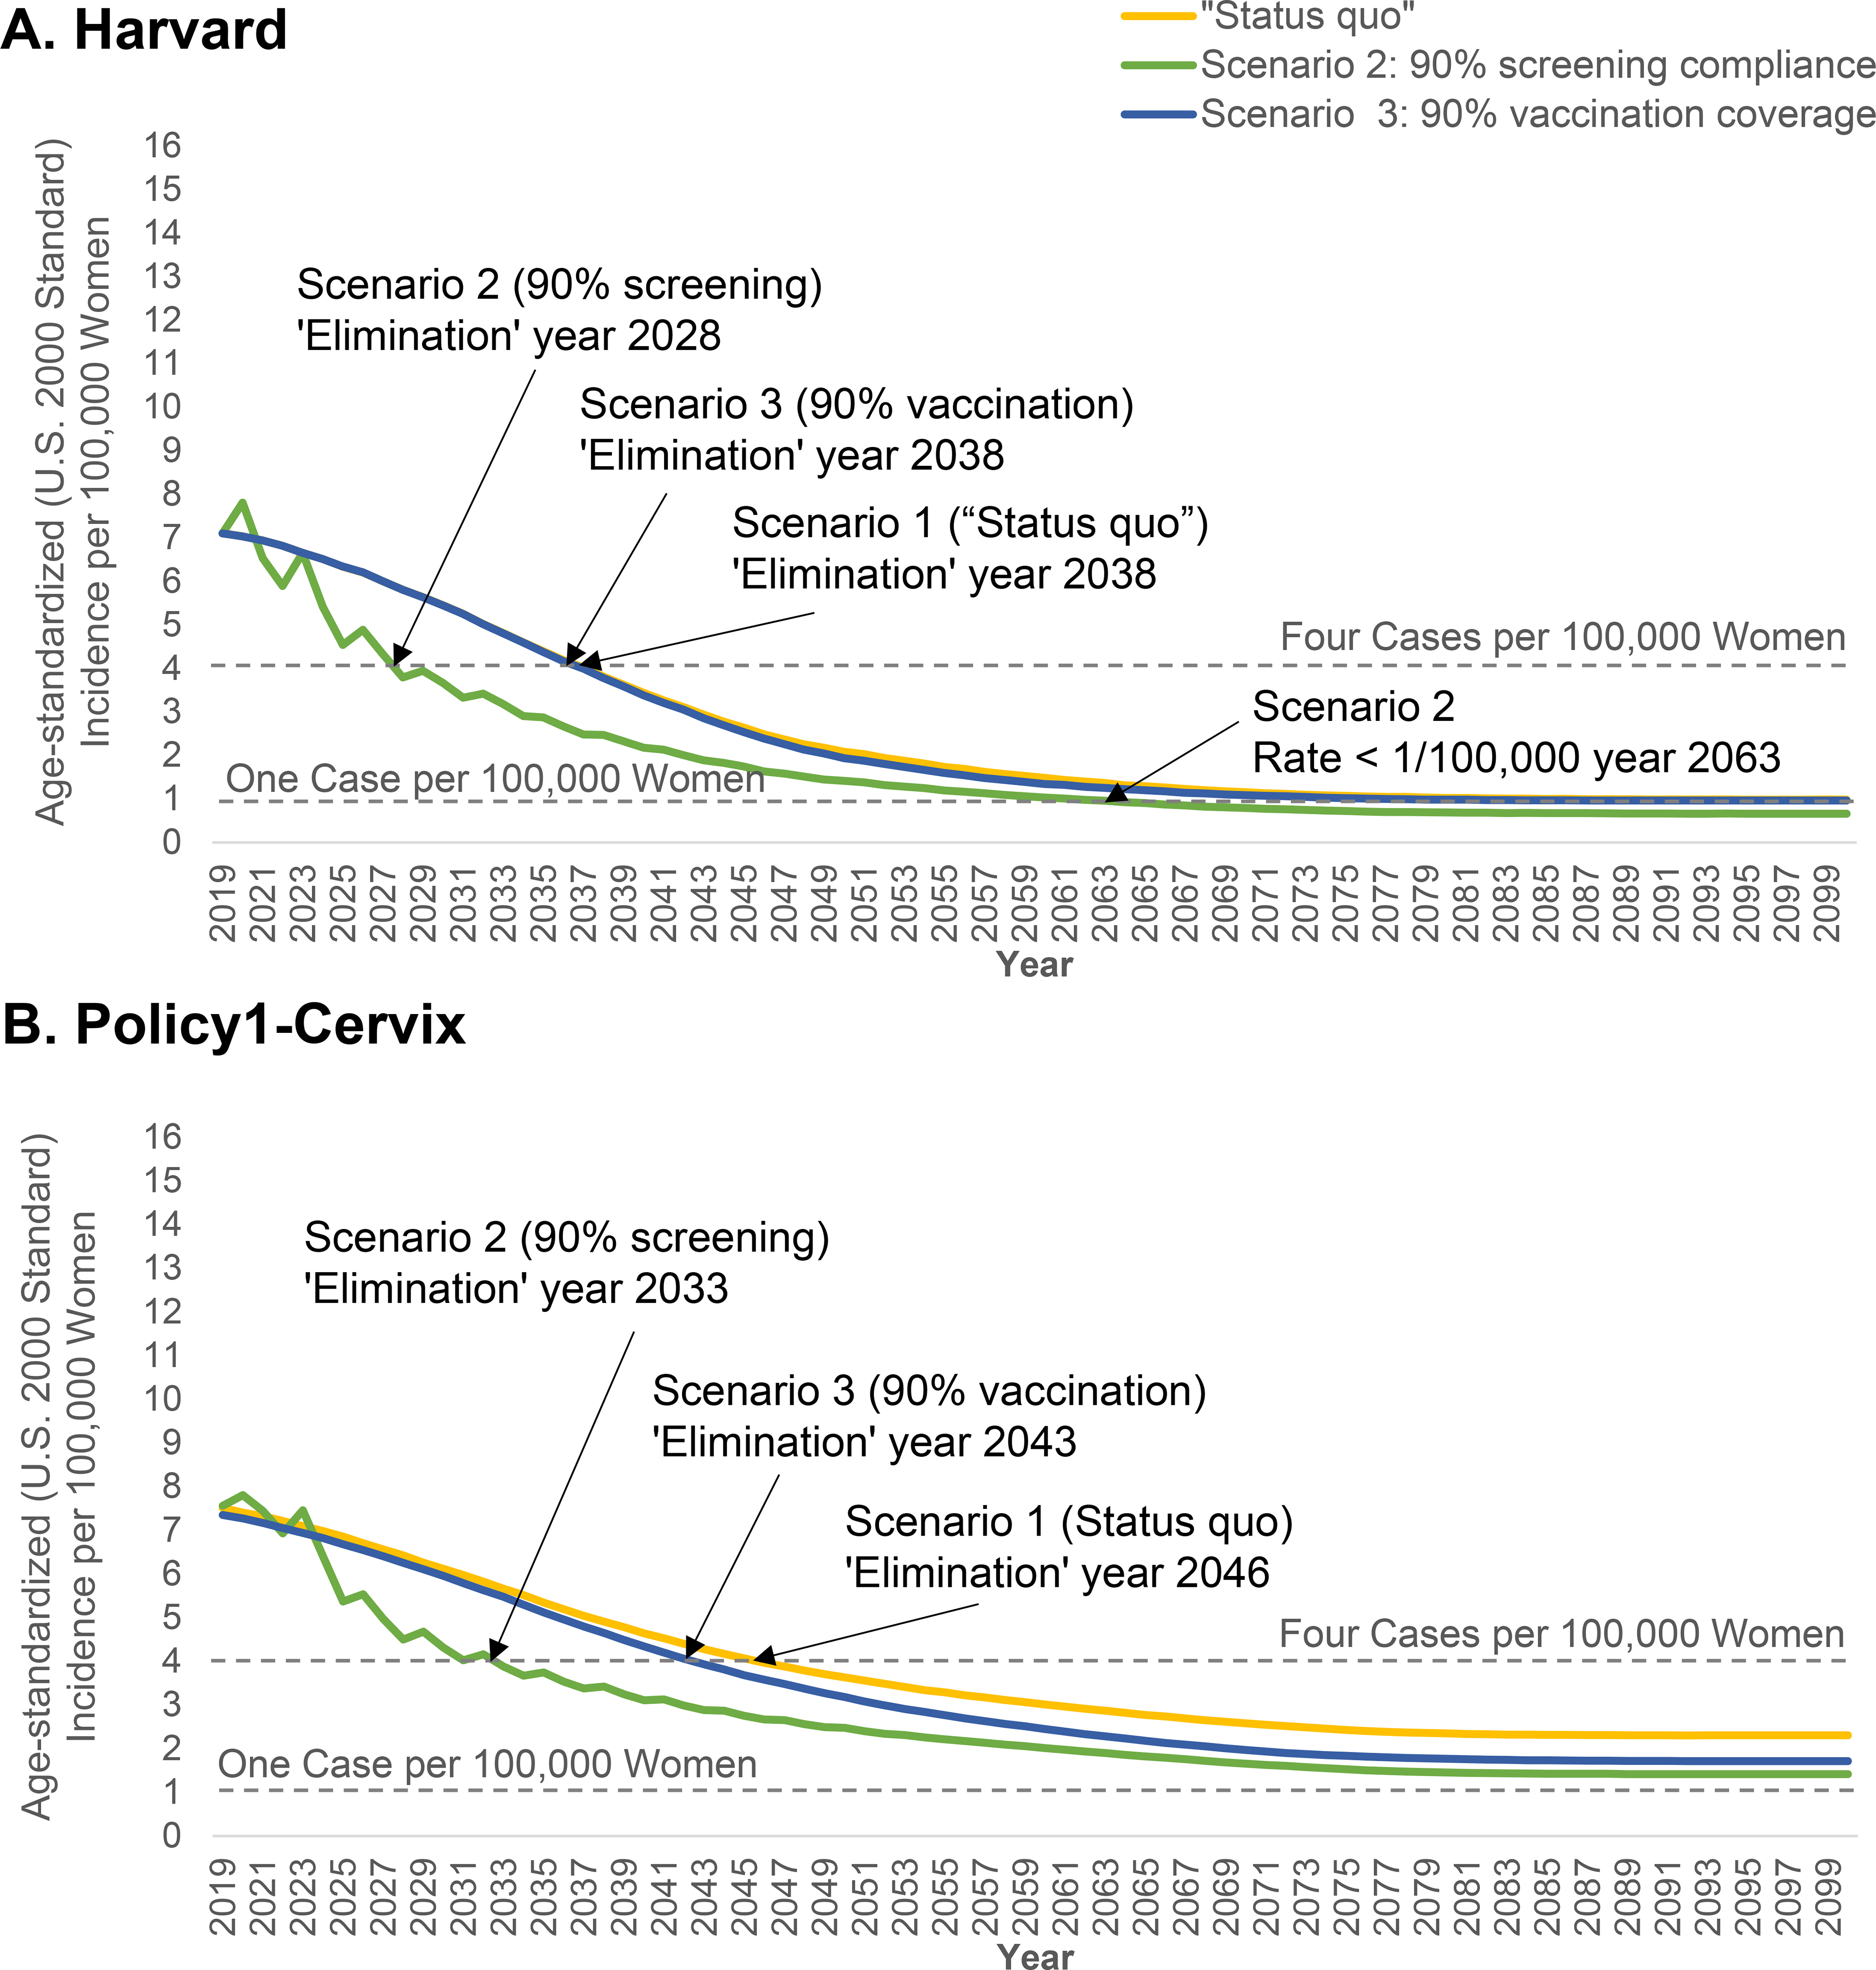
‘Status quo’ screening involved 3-yearly cytology screening in women aged 21–65 years with management according to established guidelines. Screening practice was based on empirical lab-based data from the New Mexico HPV Pap Registry. Age- and sex-specific HPV vaccination coverage was based on NIS-TEEN interviews, including historical vaccination coverage using the quadrivalent vaccine starting in 2007 for girls and 2010 for boys and the nonavalent HPV vaccine from 2015 onwards, based on updated U.S. guidelines (Appendix Section 3). Vaccination was assumed to provide 95% lifelong protection against incident HPV infections targeted by the vaccines. The “sawtooth” pattern associated with the screening coverage scale-up scenarios reflect the detection of prevalent preclinical cancers among the under- and over-screeners converging to a 3-yearly interval in the year 2020.
Table 2.
‘Elimination year’ for each screening and vaccination scenario assuming an elimination threshold of 4 per 100,000 women (U.S. 2000 Standard Population ages 0–99 years)
| Scenario | Elimination Year (4 per 100,000 women) |
|||
|---|---|---|---|---|
| Harvard | Policy1-Cervix | |||
|
| ||||
| Current | 1 | ‘Status quo’ Screening + ‘Status quo’ Vaccination | 2038 | 2046 |
|
| ||||
| WHO High-coverage Targets | 2 | 90% Screening + ‘Status quo’ Vaccination | 2028 | 2033 |
| 3 | ‘Status quo’ Screening + 90% Girls-only Vaccination | 2037 | 2043 | |
| 4 | 90% Screening + 90% Girls-only Vaccination | 2028 | 2033 | |
|
| ||||
| Alternative Targets | 5 | ‘Status quo’ Screening + 90% Girls/Boys Vaccination | 2037 | 2043 |
| 6 | 90% Screening + 90% Girls/Boys Vaccination | 2028 | 2033 | |
| 7 | ‘Status quo’ Screening + Low Coverage MAC Vaccination | 2037 | 2042 | |
| 8 | 90% Screening + Low Coverage MAC Vaccination | 2028 | 2033 | |
| 9 | ‘Status quo’ Screening + 90% Gradual Girls-only Vaccination | 2037 | 2043 | |
| 10 | 90% Screening + 90% Gradual Girls-only Vaccination | 2028 | 2033 | |
Abbreviations: MAC, multi-age cohort catch-up; WHO, World Health Organization
Depending on strategy and model, increasing only vaccination averted an average of 95–650 additional cases per year compared with the ‘status quo’, while increasing only screening coverage averted an average of 1,400–2,088 additional cases per year compared with the ‘status quo’ (Figure 2). Under ‘status quo’ assumptions, the elimination year varied up to 27 years when we used different populations for age-standardizing, and varied by up to two years when we assumed lower future benign hysterectomy rates (Table 3). Importantly, our projections for the U.S. elimination year were approximately the same as our base case when we used the WP2015 population structure, which is the benchmark population structure being used for global predictions by the WHO. Compared to improving cytology screening coverage, improved screening coverage in the context of switching to 5-yearly primary HPV screening for women aged ≥30 years brought forward elimination by five years in Policy1-Cervix to 2028 (not shown).
Figure 2. Projections in annual number of cervical cancer cases averted for alternative screening and human papillomavirus (HPV) assumptions compared with ‘status quo’ screening and vaccination assumptions for two CISNET-Cervical disease simulation models.
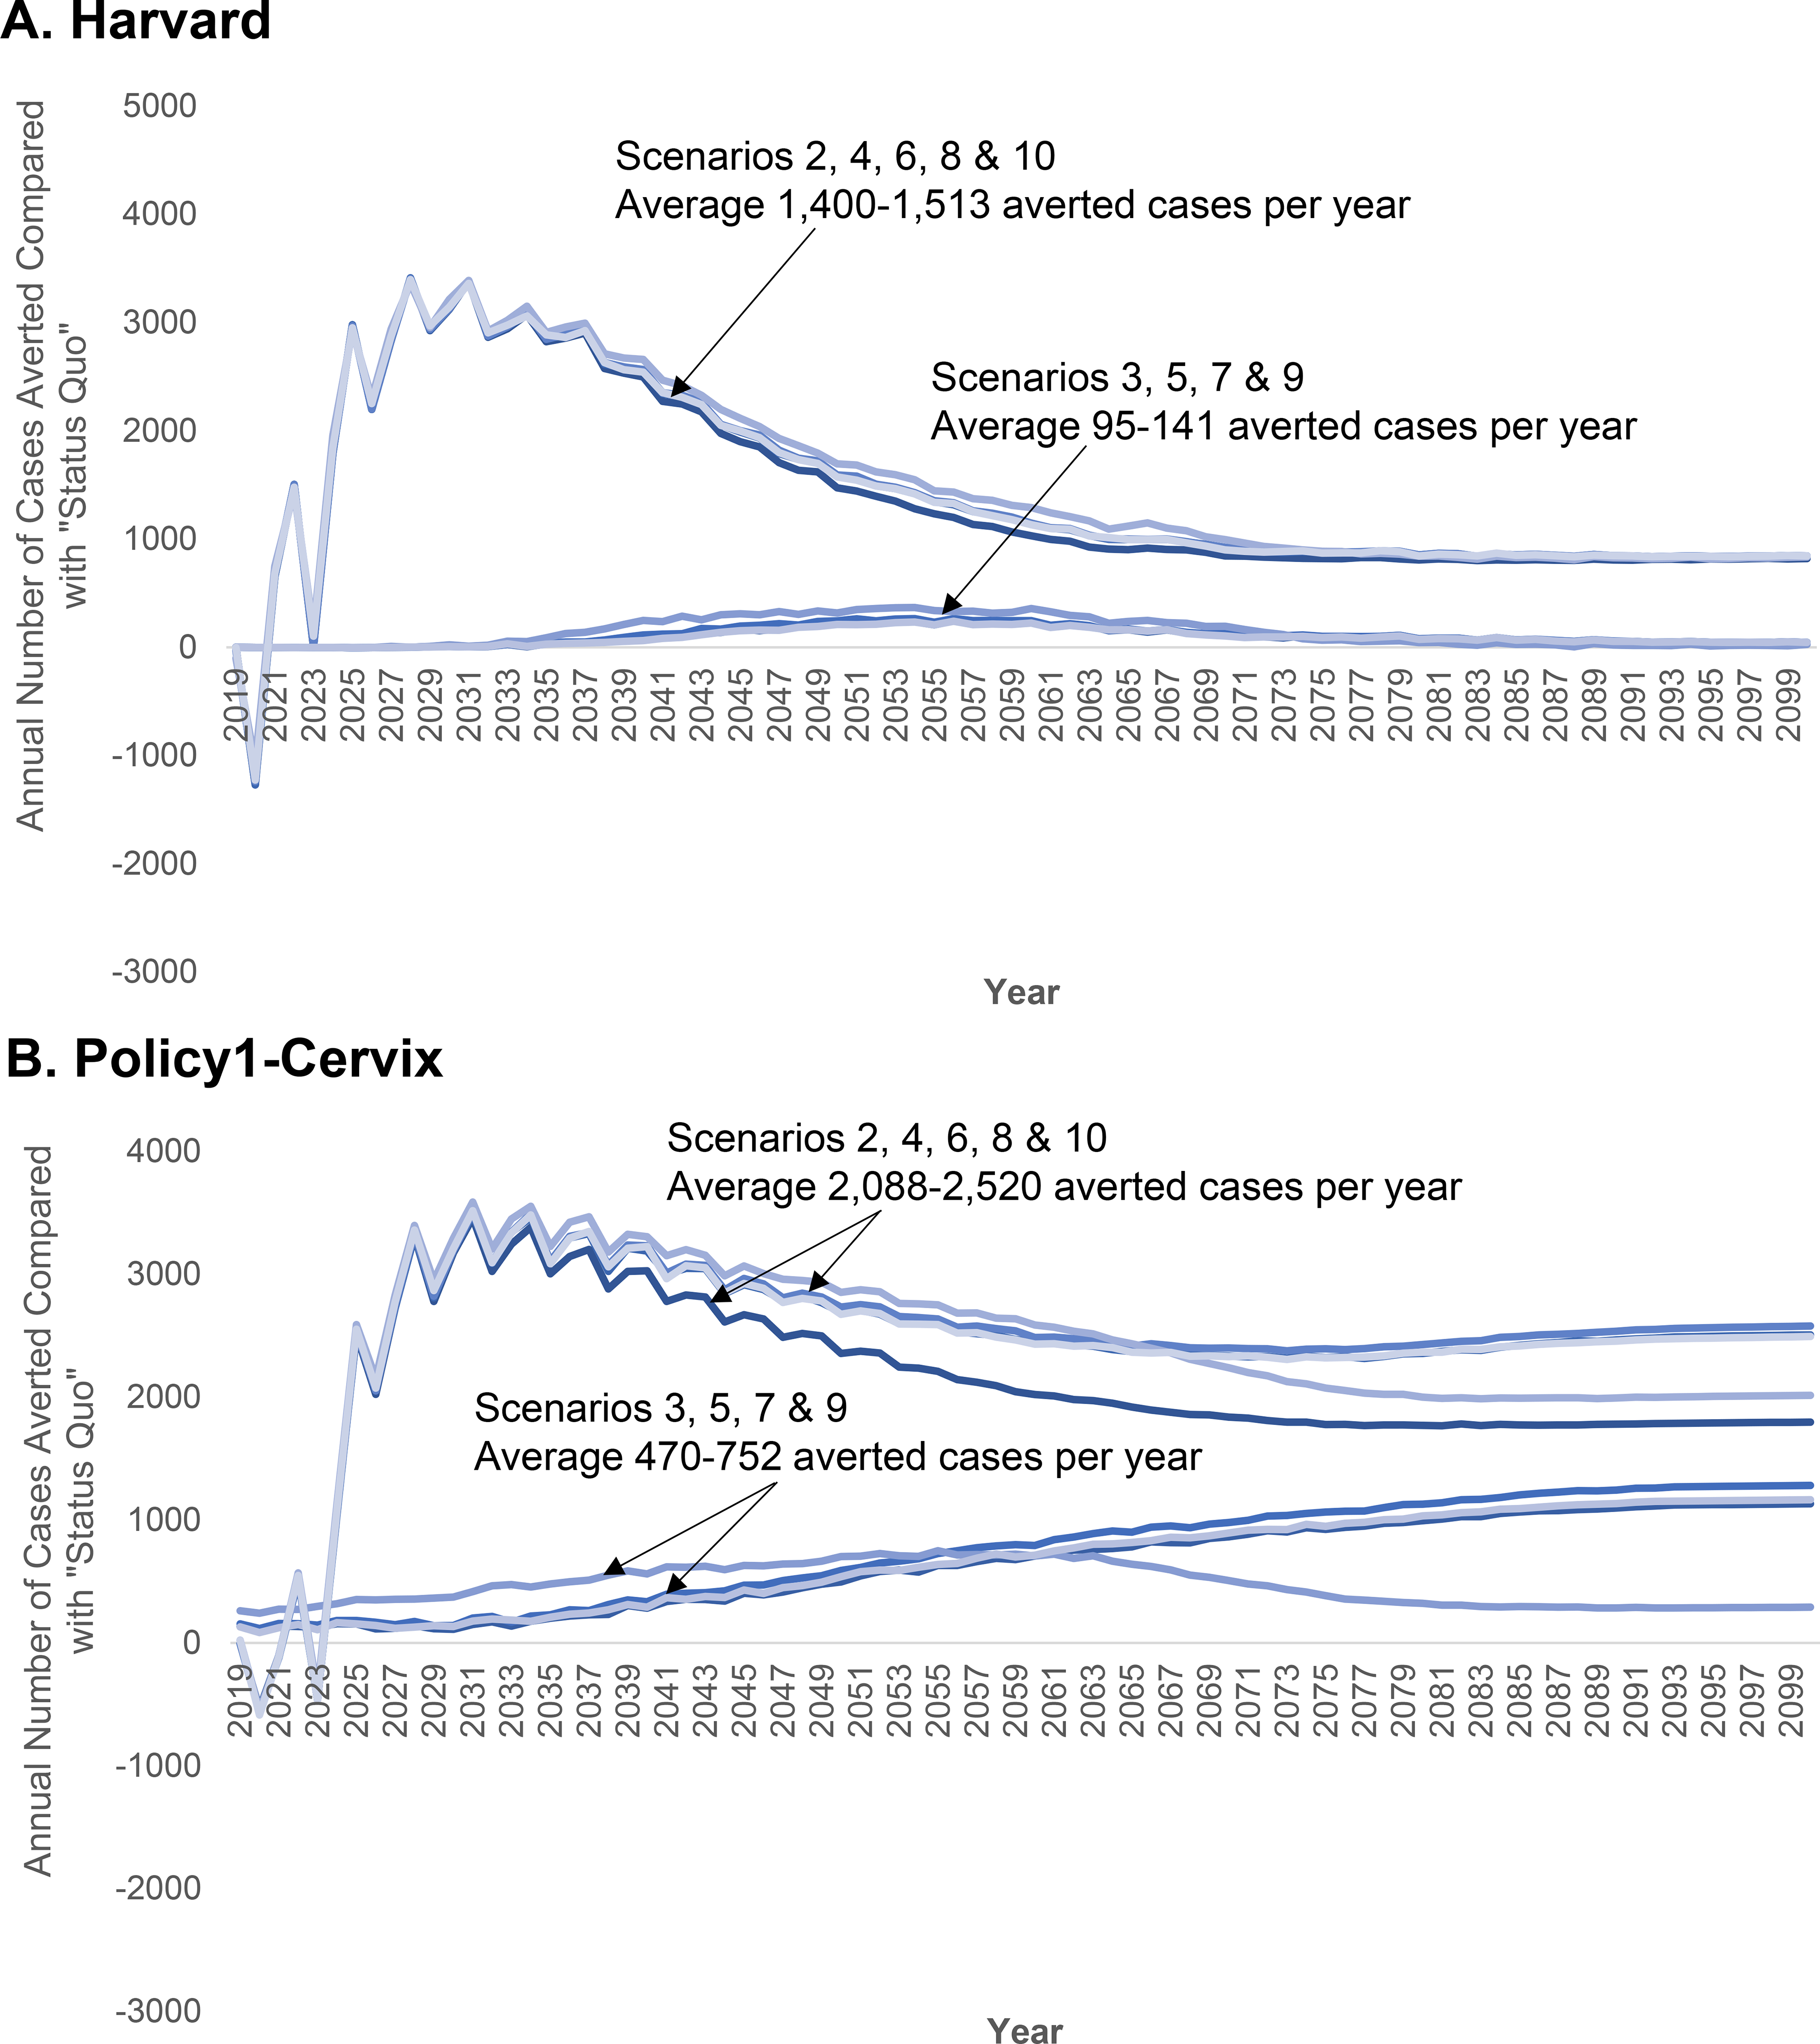
‘Status quo’ screening involved 3-yearly cytology screening in women aged 21–65 years with management according to established guidelines. Screening practice was based on empirical lab-based data from the New Mexico HPV Pap Registry. Age- and sex-specific HPV vaccination coverage was based on NIS-TEEN interviews, including historical vaccination coverage using the quadrivalent vaccine starting in 2007 for girls and 2010 for boys and the nonavalent HPV vaccine from 2015 onwards, based on updated U.S. guidelines (Appendix Section 3). Vaccination was assumed to provide 95% lifelong protection against incident HPV infections targeted by the vaccines. See Table 1 for alternative cervical cancer control strategies and assumptions. The “sawtooth” pattern associated with the screening coverage scale-up scenarios reflect the detection of prevalent preclinical cancers among the under- and over-screeners converging to a 3-yearly interval in the year 2020. “Negative” averted cancer cases stem from earlier detection of preclinical cancers when screening coverage is scaled-up.
Table 3.
Sensitivity analysis of the impact of population structurea used for age-standardizing and varying future hysterectomy rates on ‘elimination year’ assuming an elimination target of four per 100,000 women and ‘status quo’ screening and vaccination.
| Assumption | Harvard (Base Elimination Yearb = 2038) | Policy1-Cervix (Base Elimination Yearb = 2046) |
|---|---|---|
|
| ||
| Ages 0–99 years | ||
|
| ||
| Varying Hysterectomy (U.S. 2000 Standard Population) c | +0 | +2 |
| 2015 World Populationd | −4 | −5 |
| WHO 2000 World Standard Million | −4 | −6 |
| Unweighted (average) Population | +8 | +22 |
|
| ||
| Ages 9–99 years | ||
|
| ||
| U.S. 2000 Standard Population | +3 | +6 |
| 2015 World Populationd | +0 | +3 |
| WHO World Standard Million | −1 | +0 |
| Unweighted (average) Population | +12 | +27 |
|
| ||
| Ages 0–84 years | ||
|
| ||
| U.S. 2000 Standard Population | −1 | −1 |
| 2015 World Populationd | −4 | −6 |
| WHO 2000 World Standard Million | −4 | −7 |
| UNDP 2020 Population Structure | +1 | +6 |
| Segi Population Structure | −6 | −10 |
| Unweighted (average) Population | +4 | +12 |
Base elimination year is based on incidence rates that are age-standardized to the US 2000 population (aged 0–99 years), consistent with Surveillance, Epidemiology and End Results Program (SEER) data
Assuming birth-cohort-specific estimates for rates of benign hysterectomy (see Appendix Section 3.1)
Reflects the population structure that is the benchmark population structure being used for global predictions by the WHO (Supplementary Appendix Table A10).
Neither model predicted that cervical cancer incidence would fall below the highly aspirational potential US-specific threshold of less than one case per 100,000 by 2100 under status quo screening and vaccination assumptions (Figure 1). The Harvard model predicted rates could fall below this threshold in 2062 provided screening coverage was scaled up to 90% (assuming 3-yearly cytology), while in Policy1-Cervix rates only fell below this threshold in the context of scaled-up primary HPV screening coupled with scaled-up vaccination of adolescent females (either at age 12 or by age 17 years) (not shown).
DISCUSSION
We found that the U.S. is on track to achieve cervical cancer elimination (incidence less than 4 per 100,000 women) by 2038–2046, but that improving cervical screening coverage could substantially expedite the timing of cervical cancer elimination in the U.S. by 10–13 years (by 2028–2033). To our knowledge, this study is the first comparative modeling analysis to project the timeframe to cervical cancer elimination in the U.S.
The variation in timing of elimination between the two models reflects the underlying uncertainty in the HPV transmission and cervical cancer disease process. Despite the 8-year difference in the status quo projections, there is greater convergence between the models when screening and vaccination are scaled up, both demonstrating that increasing screening coverage has a greater impact than increasing vaccination coverage.
The models projected cervical cancer elimination in the U.S. will occur 10–18 years later than what was projected for Australia, which had early introduction of high-coverage vaccination and has transitioned to HPV-based screening (9). Our U.S. projections for elimination timing are, however, slightly earlier than projected in a global analysis (23). As noted in that analysis (23), the difference is likely due to more conservative assumptions for ‘status quo’ coverage than applied in the current analysis. Similar to projections from Australia (9), the ‘elimination year’ was relatively sensitive to the population used for age-standardization and benign hysterectomy assumptions (more so than to vaccination coverage). The standard population age range and structure used for age-standardization is often arbitrarily chosen but does impact the year of “elimination” (in our analysis by up to 27 years), and is likely to impact differentially on the relative importance of screening compared with vaccination. For example, population structures that place a greater weight on cancer incidence in younger women will tend to produce lower age-standardized rates and also reflect vaccine impact more quickly, and thereby predict an earlier elimination year. In contrast, older age population structures that place a greater weight on cancer incidence in older women will tend to produce higher age-standardized rates and therefore a later elimination year, and are likely to imply more policy emphasis on the importance of screening. However, it is critical to note that a standard population for cervical cancer elimination calculations has been proposed (23) and is critical to use this when elimination timing is being compared between countries. Country-specific analyses should ensure cervical cancer incidence rates are evaluated in the context of both local and global population structures (i.e., using WP2015, the standard for comparing elimination timing across countries).
In contrast, further increases in vaccination coverage had relatively little effect on the predicted year on elimination in the U.S. Current HPV vaccination rates in the U.S. achieve cumulative coverage of ~75% by age 26 years in females and ~62% by age 21 years in males, sufficiently high that improving vaccination coverage to 90% did not yield substantial gains beyond that already experienced, taking into account existing herd immunity. The added benefits of scaling up vaccination coverage were greater in Policy1-Cervix compared with Harvard, likely due to differential estimates of herd effects, stemming from differences in our dynamic model assumptions, such as our sexual behavior networks. Consequently, herd immunity in the Harvard model under ‘status quo’ assumptions (i.e., cumulative coverage of ~75% and ~62% among females and males, respectively) were large enough such that extending direct protection to many of the unvaccinated women that were already receiving some level of indirect protection did not yield substantial gains. Our findings do not suggest that efforts to increase vaccination coverage are unnecessary, but rather that this is not the most expeditious way to reduce cervical cancer in the U.S. due to the long lead-time. Eventually vaccination should reduce reliance on screening (24–27). Additionally, high HPV vaccination coverage remains important in reducing HPV-related non-cervical cancers and genital warts, in both men and women.
Several limitations are worth noting. We did not consider the cost-effectiveness of the various strategies, nor the health benefits beyond cervical cancer. In particular, the cost-effectiveness of the increasingly incremental gains for vaccination and screening participation interventions required to reach the notional threshold rates of <1 per 100,000 has not been established. We also did not consider the changes to screening performance and practices, as cohorts of HPV-vaccinated girls and adolescents reach cervical cancer screening age, including the likelihood that vaccinated women could be screened less frequently or the possibility that cytology sensitivity could potentially be affected due to a de-training effect in the context of lower disease prevalence (28). Each of these limitations may have led to differences in long-term projections, but are less likely to have affected our estimates for the elimination year. An earlier analysis for Australia found no difference in the estimated year of elimination (at a 4 per 100,000 women-year threshold) even in the extreme situation where cohorts who were age-eligible for nonavalent vaccine were not screened at all – as elimination was already on track to be achieved there through the combination of primary HPV screening and quadrivalent vaccination with high coverage (9). As with all model-based analyses, a further limitation is that all models reflect the quality of the data used to inform them. To some extent this limitation is mitigated in this analysis by ensuring that the models fit to a range of detailed empirical targets. For example, we rely on high-quality data from the NMHPVPR to inform population-level estimates of HPV prevalence, as well as screening coverage and compliance. As discussed previously (4), screening practice in New Mexico may not be generalizable nationally; however, cancer burden and demographics are broadly consistent. Additionally, these average results estimated at the national level do not consider different subgroups of women. Cervical cancer risk varies substantially within the U.S. and is elevated in never or under-screened women (29); therefore it is understandable that scaled-up screening (where the proportion of never-screened women reduced from 14% to 10%, and under-screened women was 0%) led to such immediate and high effectiveness. New screening modalities such as HPV testing on self-collected samples could help reduce the proportion of women who are never and under-screened, and the longer screening interval of five years for HPV-based screening may make higher coverage rates more attainable (30). Reaching under-screened women and achieving timely vaccination of groups who are less likely to be screened remain key to realizing cervical cancer elimination equitably.
We assumed immediate changes to cervical cancer screening and vaccination beginning in year 2020; any delay in achieving the coverage targets would delay the timing of elimination. Therefore, our projections can be viewed as the earliest these interventions would achieve the WHO target of ‘elimination’.
Under ‘status quo’ assumptions, two independent models found that cervical cancer rates would fall below four per 100,000 women in the next 2–3 decades. ‘Elimination’ may be expedited if screening coverage is improved.
Supplementary Material
RESEARCH IN CONTEXT.
Evidence before this study
In our literature search, we identified two studies that estimated the time to elimination of cervical cancer 1) globally and 2) in Australia; however, there are none that used a comparative modeling approach or projected the timing of elimination in the United States for the “status quo” and under a range of scenarios for scaling up human papillomavirus (HPV) vaccination, screening and follow-up for surveillance.
Added value of this study
This analysis adds value by evaluating the potential for and timing of cervical cancer elimination as a public health problem in the United States, and whether this could be expedited by adopting WHO coverage targets. We simulated current screening and HPV vaccination as practiced in the United States, including the introduction and scale-up of HPV vaccination in 2007. In this comparative model-based analysis, cervical cancer incidence is projected to fall below four per 100,000 women by 2038–2046, which could be brought forward to 2028–2033 if screening coverage is improved. Increasing screening coverage could reduce rates below one per 100,000 women by 2063, while expanding vaccination target populations (e.g., to mid-adult women) had minimal impact on future cervical cancer incidence rates.
Implications of all the available evidence
The findings of this study offer two model-based projections of the achievability and timeliness of achieving WHO elimination targets under current and improved WHO coverage goals. The United States is on track to eliminate cervical cancer as a public health problem by 2038–2046. This goal can be expedited by improving screening coverage. These national average estimates do not apply to all subgroups of women; therefore, reaching under-screened and under-vaccinated women remain key to achieving cervical cancer elimination for all women.
Acknowledgments
This study was funded by U.S. National Cancer Institute grant (U01CA199334). Emily A Burger receives salary support from the Norwegian Cancer Society (#198073), and Megan A Smith receives salary support from the National Health and Medical Research Council, Australia (APP1159491) and Cancer Institute NSW (ECF181561).
NCI statement
The contents are solely the responsibility of the authors and do not necessarily represent the official views of the National Cancer Institute.
Declarations of Interests
KC is the co-PI of an investigator-initiated trial of cervical cancer screening, Compass, run by the VCS Foundation, which is a government-funded not-for-profit charity. Neither KC nor her institution have received funding from industry for this or any other research project. All other authors declare no conflicts. All other authors have no conflicts of interest to declare.
REFERENCES
- 1.World Health Organization. Draft: Global Strategy Towards the Elimination of Cervical Cancer as a Public Health Problem. Available at: https://www.who.int/docs/default-source/documents/cervical-cancer-elimination-draft-strategy.pdf?sfvrsn=380979d6_4 Accessed: July 18, 2019.
- 2.National Cancer Institute: Surveillance, Epidemiology, and End Results (SEER) Program (www.seer.cancer.gov) Cancer Stat Facts: Cervical Cancer. Available at: https://seer.cancer.gov/statfacts/html/cervix.html Accessed October 9, 2019.
- 3.Brotherton JML, Bloem PN. Population-based HPV vaccination programmes are safe and effective: 2017 update and the impetus for achieving better global coverage. Best Pract Res Clin Obstet Gynaecol. 2018;47:42–58. [DOI] [PubMed] [Google Scholar]
- 4.Kim JJ, Campos NG, Sy S, Burger EA, Cuzick J, Castle PE, et al. Inefficiencies and High-Value Improvements in U.S. Cervical Cancer Screening Practice: A Cost-Effectiveness Analysis. Ann Intern Med. 2015;163(8):589–97. [DOI] [PMC free article] [PubMed] [Google Scholar]
- 5.Kim JJ, Burger EA, Regan C, Sy S. Screening for Cervical Cancer in Primary Care: A Decision Analysis for the US Preventive Services Task ForceUSPSTF Modeling Study: Screening for Cervical Cancer in Primary CareUSPSTF Modeling Study: Screening for Cervical Cancer in Primary Care. JAMA. 2018;320(7):706–14. [DOI] [PMC free article] [PubMed] [Google Scholar]
- 6.National Cancer Institute. Surveillance, Epidemiology, and End Results Program. Standar Populations- Single Ages. Available at https://seer.cancer.gov/stdpopulations/stdpop.singleages.html. Accessed May 10, 2019 [ [Google Scholar]
- 7.Ahmad OB, Boschi-Pinto C, Lopez AD, Murray CJ, Lozano R, Inoue M. Age standardization of rates: a new WHO standard. Geneva: World Health Organization. 2001;9(10). [Google Scholar]
- 8.United Nations, Department of Economic and Social Affairs, Population Division (2017). World Population Prospects: The 2017 Revision, custom data acquired via website. Available at https://population.un.org/wpp/DataQuery/. Accessed May 10, 2019 [
- 9.Hall MT, Simms KT, Lew J-B, Smith MA, Brotherton JML, Saville M, et al. The projected timeframe until cervical cancer elimination in Australia: a modelling study. The Lancet Public Health. 2019;4(1):e19–e27. [DOI] [PubMed] [Google Scholar]
- 10.Burger EA, de Kok I, Groene E, Killen J, Canfell K, Kulasingam S, et al. Estimating the Natural History of Cervical Carcinogenesis Using Simulation Models: A CISNET Comparative Analysis. J Natl Cancer Inst. 2019. [DOI] [PMC free article] [PubMed] [Google Scholar]
- 11.Campos NG, Burger EA, Sy S, Sharma M, Schiffman M, Rodriguez AC, et al. An updated natural history model of cervical cancer: derivation of model parameters. American journal of epidemiology. 2014;180(5):545–55. [DOI] [PMC free article] [PubMed] [Google Scholar]
- 12.Herrero R, Hildesheim A, Rodriguez AC, Wacholder S, Bratti C, Solomon D, et al. Rationale and design of a community-based double-blind randomized clinical trial of an HPV 16 and 18 vaccine in Guanacaste, Costa Rica. Vaccine. 2008;26(37):4795–808. [DOI] [PMC free article] [PubMed] [Google Scholar]
- 13.Munoz N, Mendez F, Posso H, Molano M, van den Brule AJ, Ronderos M, et al. Incidence, duration, and determinants of cervical human papillomavirus infection in a cohort of Colombian women with normal cytological results. The Journal of infectious diseases. 2004;190(12):2077–87. [DOI] [PubMed] [Google Scholar]
- 14.Legood R, Smith M, Lew JB, Walker R, Moss S, Kitchener H, et al. Cost effectiveness of human papillomavirus test of cure after treatment for cervical intraepithelial neoplasia in England: economic analysis from NHS Sentinel Sites Study. BMJ (Clinical research ed). 2012;345:e7086. [DOI] [PMC free article] [PubMed] [Google Scholar]
- 15.Lew JB, Simms K, Smith M, Lewis H, Neal H, Canfell K. Effectiveness Modelling and Economic Evaluation of Primary HPV Screening for Cervical Cancer Prevention in New Zealand. PloS one. 2016;11(5):e0151619. [DOI] [PMC free article] [PubMed] [Google Scholar]
- 16.Lew JB, Simms KT, Smith MA, Hall M, Kang YJ, Xu XM, et al. Primary HPV testing versus cytology-based cervical screening in women in Australia vaccinated for HPV and unvaccinated: effectiveness and economic assessment for the National Cervical Screening Program. The Lancet Public health. 2017;2(2):e96–e107. [DOI] [PubMed] [Google Scholar]
- 17.Simms KT, Laprise JF, Smith MA, Lew JB, Caruana M, Brisson M, et al. Cost-effectiveness of the next generation nonavalent human papillomavirus vaccine in the context of primary human papillomavirus screening in Australia: a comparative modelling analysis. The Lancet Public health. 2016;1(2):e66–e75. [DOI] [PubMed] [Google Scholar]
- 18.Wheeler CM, Hunt WC, Cuzick J, Langsfeld E, Pearse A, Montoya GD, et al. A population-based study of human papillomavirus genotype prevalence in the United States: baseline measures prior to mass human papillomavirus vaccination. Int J Cancer. 2013;132(1):198–207. [DOI] [PMC free article] [PubMed] [Google Scholar]
- 19.Joste NE, Ronnett BM, Hunt WC, Pearse A, Langsfeld E, Leete T, et al. Human papillomavirus genotype-specific prevalence across the continuum of cervical neoplasia and cancer. Cancer Epidemiol Biomarkers Prev. 2015;24(1):230–40. [DOI] [PMC free article] [PubMed] [Google Scholar]
- 20.Saraiya M, Unger ER, Thompson TD, Lynch CF, Hernandez BY, Lyu CW, et al. US assessment of HPV types in cancers: implications for current and 9-valent HPV vaccines. J Natl Cancer Inst. 2015;107(6):djv086. [DOI] [PMC free article] [PubMed] [Google Scholar]
- 21.Curry SJ, Krist AH, Owens DK, Barry MJ, Caughey AB, Davidson KW, et al. Screening for cervical cancer: US Preventive Services Task Force recommendation statement. Jama. 2018;320(7):674–86. [DOI] [PubMed] [Google Scholar]
- 22.Canfell K, Kim JJ, Kulasingam S, Berkhof J, Barnabas R, Bogaards JA, et al. HPV-FRAME: A consensus statement and quality framework for modelled evaluations of HPV-related cancer control. Papillomavirus Res. 2019;8:100184. [DOI] [PMC free article] [PubMed] [Google Scholar]
- 23.Simms KT, Steinberg J, Caruana M, Smith MA, Lew J-B, Soerjomataram I, et al. Impact of scaled up human papillomavirus vaccination and cervical screening and the potential for global elimination of cervical cancer in 181 countries, 2020–99: a modelling study. The Lancet Oncology. 2019;20(3):394–407. [DOI] [PubMed] [Google Scholar]
- 24.Simms KT, Smith MA, Lew JB, Kitchener HC, Castle PE, Canfell K. Will cervical screening remain cost-effective in women offered the next generation nonavalent HPV vaccine? Results for four developed countries. International journal of cancer. 2016;139(12):2771–80. [DOI] [PubMed] [Google Scholar]
- 25.Kim JJ, Burger EA, Sy S, Campos NG. Optimal Cervical Cancer Screening in Women Vaccinated Against Human Papillomavirus. J Natl Cancer Inst. 2017;109(2). [DOI] [PMC free article] [PubMed] [Google Scholar]
- 26.Pedersen K, Burger EA, Nygard M, Kristiansen IS, Kim JJ. Adapting cervical cancer screening for women vaccinated against human papillomavirus infections: The value of stratifying guidelines. Eur J Cancer. 2018;91:68–75. [DOI] [PMC free article] [PubMed] [Google Scholar]
- 27.Naber SK, Matthijsse SM, Rozemeijer K, Penning C, de Kok IM, van Ballegooijen M. Cervical Cancer Screening in Partly HPV Vaccinated Cohorts - A Cost-Effectiveness Analysis. PloS one. 2016;11(1):e0145548. [DOI] [PMC free article] [PubMed] [Google Scholar]
- 28.Franco EL, Mahmud SM, Tota J, Ferenczy A, Coutlee F. The expected impact of HPV vaccination on the accuracy of cervical cancer screening: the need for a paradigm change. Archives of medical research. 2009;40(6):478–85. [DOI] [PubMed] [Google Scholar]
- 29.Smith JS, Brewer NT, Saslow D, Alexander K, Chernofsky MR, Crosby R, et al. Recommendations for a national agenda to substantially reduce cervical cancer. Cancer causes & control : CCC. 2013;24(8):1583–93. [DOI] [PMC free article] [PubMed] [Google Scholar]
- 30.Arbyn M, Smith SB, Temin S, Sultana F, Castle P. Detecting cervical precancer and reaching underscreened women by using HPV testing on self samples: updated meta-analyses. BMJ. 2018;363:k4823. [DOI] [PMC free article] [PubMed] [Google Scholar]
Associated Data
This section collects any data citations, data availability statements, or supplementary materials included in this article.