

Abstract
Cancer recurrence after surgery remains an unresolved clinical problem1–3. Bone marrow-derived myeloid cells contribute in forming the premetastatic microenvironment required for disseminating tumour cells to engraft distant sites4–6. Presently, there are no effective interventions that prevent premetastatic microenvironment formation6,7. Here, we show that after surgical removal of primary lung, breast, and esophageal cancers, low dose adjuvant epigenetic therapy disrupts the premetastatic microenvironment and inhibits lung metastases by its selective effect on myeloid derived suppressor cells (MDSCs). In murine pulmonary metastases models, MDSCs are key factors in premetastatic microenvironment formation after primary tumour resection. Adjuvant epigenetic therapy, using low dose DNA methyltransferase and histone deacetylase inhibitors, 5-azacytidine (Aza) and entinostat, disrupts the premetastatic niche by inhibiting the trafficking of MDSCs through the downregulation of CCR2 and CXCR2, and by promoting MDSC differentiation into a more interstitial macrophage-like phenotype. Decreased MDSCs accumulation in the premetastatic lung produces longer disease-free and overall survival compared to chemotherapy. Our data demonstrate that even after primary tumour removal, MDSCs contribute to the development of premetastatic niches and settlement of residual tumour cells. A combination of low dose adjuvant epigenetic modifiers that disrupts this premetastatic microenvironment and inhibits metastases may represent a novel adjuvant approach to cancer.
Despite advances in traditional cancer treatment and newly developed immunotherapies, cancer recurrence after surgery of non-small cell lung cancer (NSCLC), esophageal cancer, and breast cancer remains high at 35-76%2,8, 30-66%9,10, and 20-66%3, respectively. Most cancer-related mortalities post-resection are due to metastases1,2. In early stage NSCLC, in particular, 30-55% of patients die from recurrent metastatic disease after surgery with curative intent8,11, and standard adjuvant chemotherapy confers an absolute 5-year survival benefit of only 3-10%11. Current immune directed neoadjuvant therapies using immune checkpoint blockade rely on the presence of the primary tumour to generate tumour antigen specific T-cell responses12. But in clinical practice, the majority of early stage NSCLC tumours are removed without neoadjuvant intervention11,13. Novel strategies are needed which decrease tumour recurrence and metastases in the absence of a primary tumour.
MDSCs Delineate Premetastatic Niches
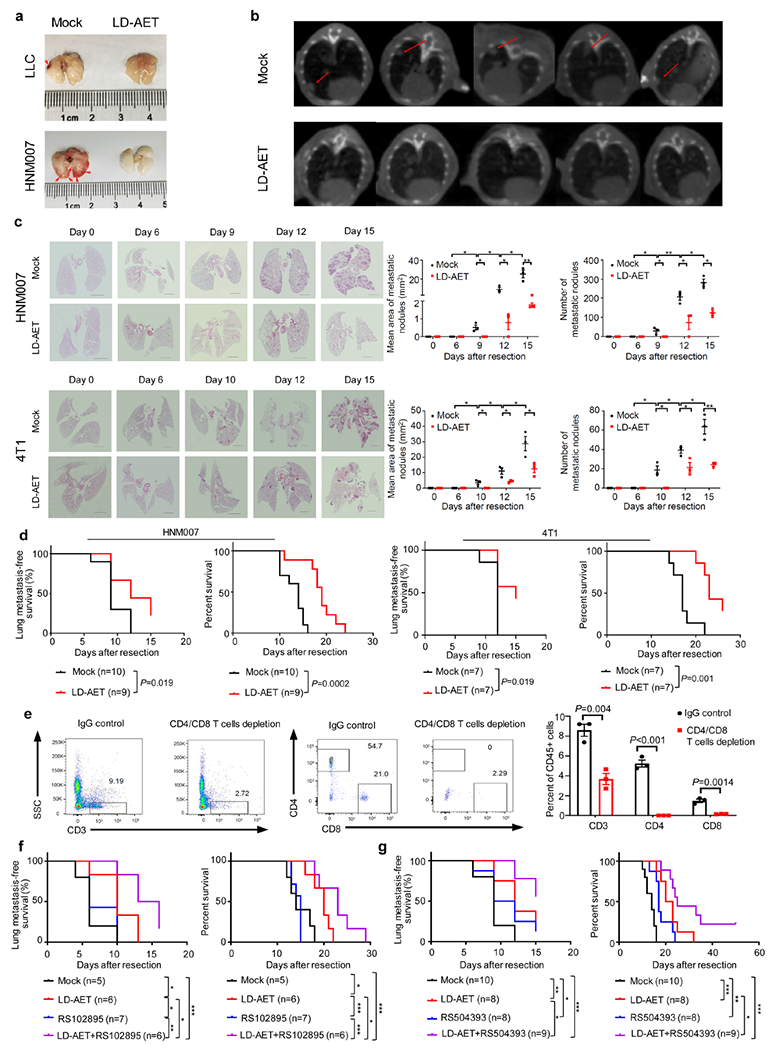
In 2011, we initiated a randomized, phase II adjuvant clinical trial using low dose Aza and entinostat in patients with stage I (T1-2aN0) NSCLC. The trial was prematurely terminated after 13 patients enrolled due to the requirement for Aza to be given in an outpatient clinic. Nevertheless, patients tolerated the therapy well with a low postsurgical recurrence rate (14.3% vs. 33.3%), suggesting that epigenetic therapy may decrease relapses after curative surgery (Extended Data Fig.1a-c, Supplementary Table 1). Previously, we found that combined epigenetic modifiers blunt metastases in an aggressive, mouse model of NSCLC with an immune competent microenvironment14. We now reveal a key mechanism of action of adjuvant epigenetic therapy on premetastatic niches which could underlie these findings. Low dose adjuvant epigenetic therapy (LD-AET) modulates innate immune factors in the lung microenvironment to inhibit tumour recurrence in three aggressive, syngeneic models of pulmonary metastasis post-resection - Lewis lung carcinoma (LLC), HNM007 esophageal squamous cell carcinoma (LLC and HNM007 mice have no extrapulmonary metastases), and 4T1 mammary cancer (Fig.1a, Extended Data Fig.2a-e).
Figure 1. Low dose adjuvant epigenetic therapy disrupts the lung premetastatic microenvironment by affecting MDSCs.
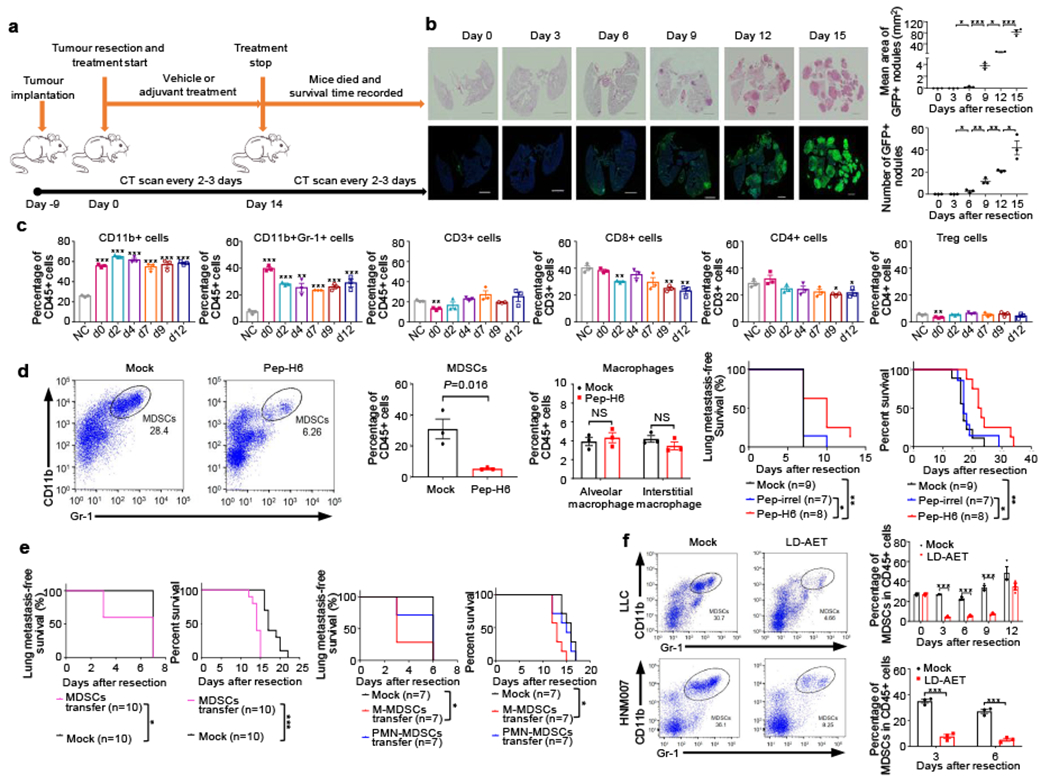
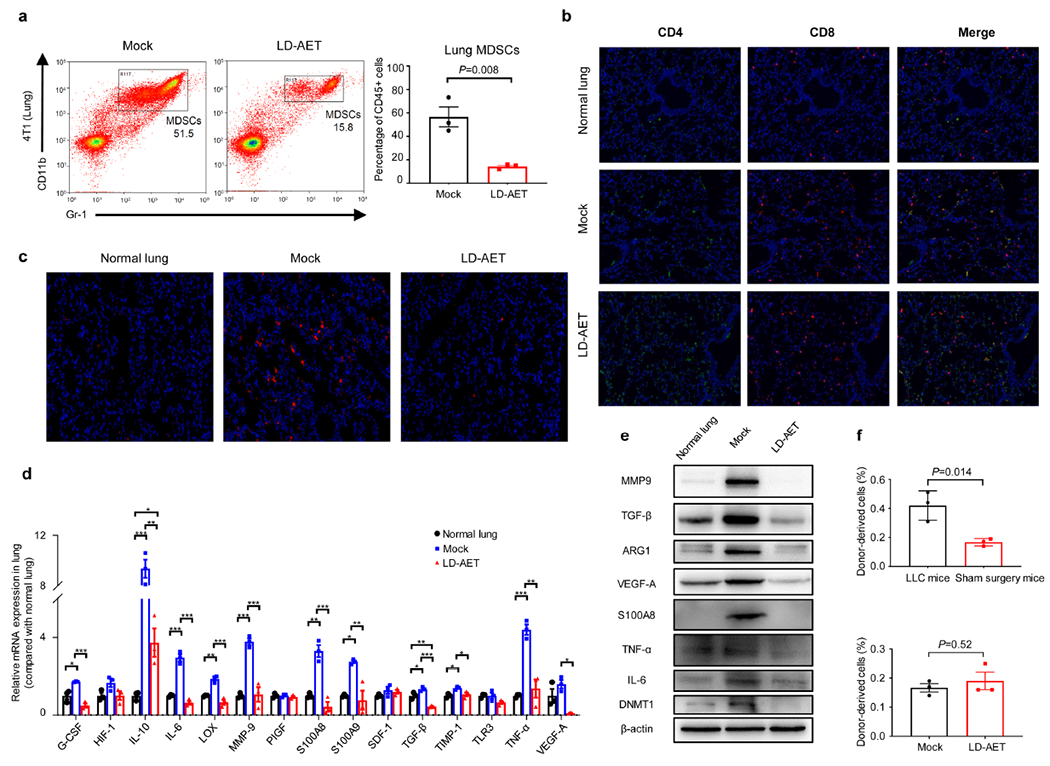
a, Timeline of murine metastatic models with treatment schedules. b, Longitudinal H&E and immunofluorescence staining of lung tissue showed the presence of tumour cells from day 6 in the LLC metastasis model. Immunofluorescence staining was performed using GFP (green) antibodies. Merged images contain DAPI DNA staining demarcating cell nuclei (blue). Scale bar, 2 mm. Graph shows the area and numbers of metastatic nodules (n=3 mice at each time point). Two-sample two-sided t-test. c, Immune cell profiles of lungs in the LLC metastasis model. Single cell suspensions from both lungs were analyzed by FACS (n=3 mice at each timepoint). NC: negative control, normal lung from C57BL/6 mice. Two-sample two-sided t-test was used in comparison with NC. d, FACS showing lung MDSCs in LLC metastasis mice at day 3 were depleted using Pep-H6 (left panels). Column diagram showing the effect of Pep-H6 on the percentages of lung MDSCs and macrophages (middle panels) at day 3 (n=3 mice in each group). Two-sample two-sided t-test. Kaplan-Meier curves showing disease-free and overall survival of LLC metastasis mice after MDSCs depletion (right panels). Two-sided log-rank test. Pep-irrel, irrelevant control peptibody. e, Kaplan-Meier curves showing disease-free and overall survival of LLC metastasis mice after transfusion of lung MDSCs (5 × 10⁶, left panels) and of bone marrow M-MDSCs (5 × 10⁶, right panels) or bone marrow PMN-MDSCs (5 × 10⁶, right panels). All transfusions conducted on day 1 and day 4, respectively. Two-sided log-rank test. f, FACS showing representative effects of low dose adjuvant epigenetic therapy (LD-AET) on lung MDSCs in LLC and HNM007 metastasis mice at day 3. Column diagrams showing the effect of LD-AET on lung MDSCs in LLC and HNM007 mice (n=3 at each timepoint). Two-sample two-sided t-test. Bars show mean ± s.e.m. *P< 0.05, **P< 0.01, ***P< 0.001.
It is known that the microenvironment of distant organs, the targets of future metastases, are not passive receivers of circulating tumour cells, but instead are selectively modified by the primary tumour prior to metastases 6,7,15,16. Sowing the ‘seeds’ of metastasis is dependent on tumour-secreted factors and tumour-shed extracellular vesicles that enable the ‘soil’ (premetastatic microenvironment) at distant metastatic sites to support the colonization of incoming cancer cells6,7,15,16. To study whether LD-AET affects premetastatic microenvironment dynamics, we used highly aggressive pulmonary metastatic murine models exhibiting pulmonary metastases in 90-100% of mice post-resection, and with median disease-free survival times fewer than fourteen days (Fig.1a-b, Extended Data Fig.2a-d).
In the LLC pulmonary metastasis mice, there is no GFP+ tumour cell infiltration of the lung detectable by haemotoxylin-&-eosin (H&E) and immunofluorescence staining until day 6 post-resection (Fig.1b). In contrast, CD11b+ cells, including CD11b+Gr-1+ cells, are already substantially increased in the lung on the day of resection (day 0) (Fig.1c). CD11b+Gr-1+ cells harvested from the lungs three days after primary tumour resection (day 3) and before tumour cell infiltration, inhibited both T-cell proliferation and activation in vitro, suggesting that recruited CD11b+Gr1+ cells in the lungs are functional MDSCs (Extended Data Fig.3a). These MDSCs were the most increased immune component of all CD11b+ cells in tumour-bearing mice just before resection. Strikingly, even post-resection, these MDSCs persisted in the lung, but not in the liver until day 12, as the predominant immune cells compared to the non-tumour bearing mice in the LLC and HNM007 models (Fig.1c, Extended Data Fig.3b-c). We then used Pep-H6, a peptibody that selectively targets MDSCs with minimal effect of other immune components to deplete MDSCs17 (Fig.1d). Peptibody-mediated MDSCs depletion resulted in an increase in both disease-free and overall survival of the mice (Fig.1d). In contrast, MDSCs from the day 3 lung premetastatic niche injected intravenously induced earlier metastases and shorter overall survival (Fig.1e), indicating that these MDSCs had a significant role in metastasis in this system. Our results indicate that MDSCs accumulation in the lungs preceded metastases development and delineated premetastatic niches. To test the differential role of monocytic MDSCs (M-MDSCs, CD11b+Ly6ChighLy6G−) versus polymorphonuclear MDSCs (PMN-MDSCs, CD11b+Ly6ClowLy6G+) on lung metastasis formation, we transferred bone marrow M-MDSCs or PMN-MDSCs in LLC pulmonary metastasis mice. We found that compared to vehicle, transferring M-MDSCs (not PMN-MDSCs) resulted in a higher lung metastasis rate at day 3 in LLC pulmonary metastasis mice, suggesting the predominant role of M-MDSCs in establishing the premetastatic microenvironment (Fig.1e).
LD-AET Impedes Migration of MDSCs
Recently, we found that low doses of Aza and entinostat are well tolerated and clinically effective in heavily pretreated NSCLC patients18, and with others, showed that they target MDSCs19,20. Low dose Aza (100nM) and entinostat (50nM) in vitro had limited effect on the proliferation of LLC1, HNM007 and 4T1 cells (Extended Data Fig.4a). Similarly, these doses did not influence the viability or apoptosis of bone marrow MDSCs sorted from LLC and HNM007 pulmonary metastasis mice (Extended Data Fig.4b-c). We determined in vivo doses of Aza and entinostat (0.5mg/kg/day and 5mg/kg/day, respectively) that had no effect on primary tumour growth nor caused any weight loss in immune-compromised mice with LLC and HNM007 tumours (Extended Data Fig.4d-f). These doses also had limited effect on the proliferation and apoptosis of CD45.1 donor cells in vivo (Extended Data Fig.4g-h). Importantly, the above doses of drugs in our murine models decreased MDSCs and niche-promoting molecules in the premetastatic lung (Fig. 1f, Extended Data Fig.5a-e). Moreover, the percentage of donor CD45.1+ MDSCs in the lung is not impacted by LD-AET in the control sham surgery mice (tumour-naïve recipient mice) (Extended Data Fig.5f). Based on these findings, we hypothesize that LD-AET can inhibit MDSCs accumulation in the lung and prevent the formation of premetastatic niches in our pulmonary metastasis models.
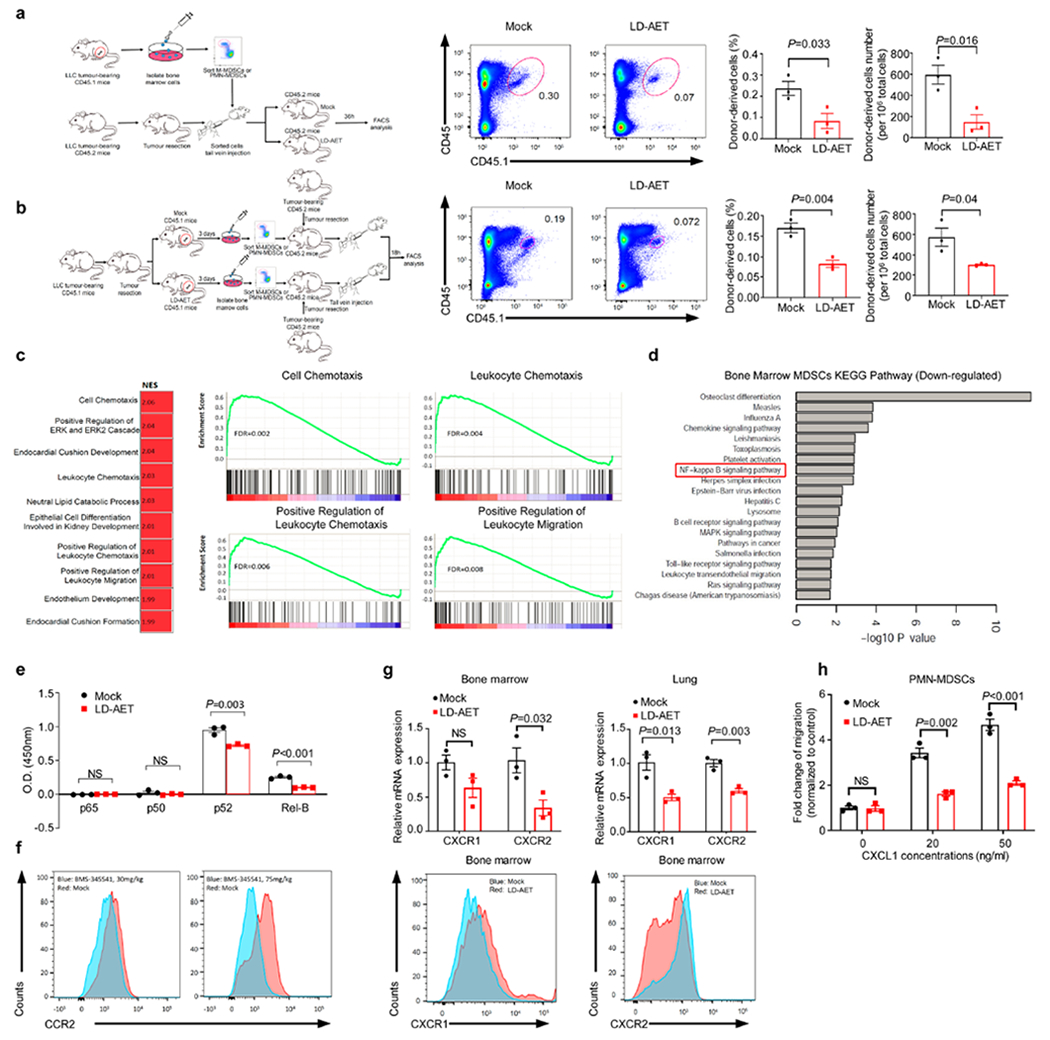
When CD45.1+ M-MDSCs or CD45.1+ PMN-MDSCs (5×10⁶ cells each) are adoptively transferred on day0 to CD45.2+ mice, thirty-six hours after transfusion, CD45.1+ cells decreased by 40-80% in the lungs of recipient mice treated with LD-AET (Fig.2a, Extended Data Fig.6a). Also, when the same number of bone marrow CD45.1+ M-MDSCs or PMN-MDSCs are adoptively transferred from mock (day3) and LD-AET treated mice (day3) respectively into CD45.2 mice on day0, as expected 18 hours after transfusion, the CD45.1+ cells from LD-AET treated mice were significantly fewer than those from vehicle-treated mice in the lungs of CD45.2+ recipient mice (Fig.2b, Extended Data Fig.6b). These results demonstrate that LD-AET impedes migration of MDSCs to the premetastatic microenvironment in the LLC pulmonary metastasis model. Together with the previous finding that only M-MDSCs transfusion increased lung metastases, these results showed that although LD-AET impairs the migration of both M-MDSCs and PMN-MDSCs, its targeting of the trafficking of M-MDSCs may play a more important role than its targeting of PMN-MDSCs in our LLC pulmonary metastatic model.
Figure 2. Low dose adjuvant epigenetic therapy inhibits M-MDSCs migration from the bone marrow to the lung premetastatic microenvironment by downregulating CCR2 expression.
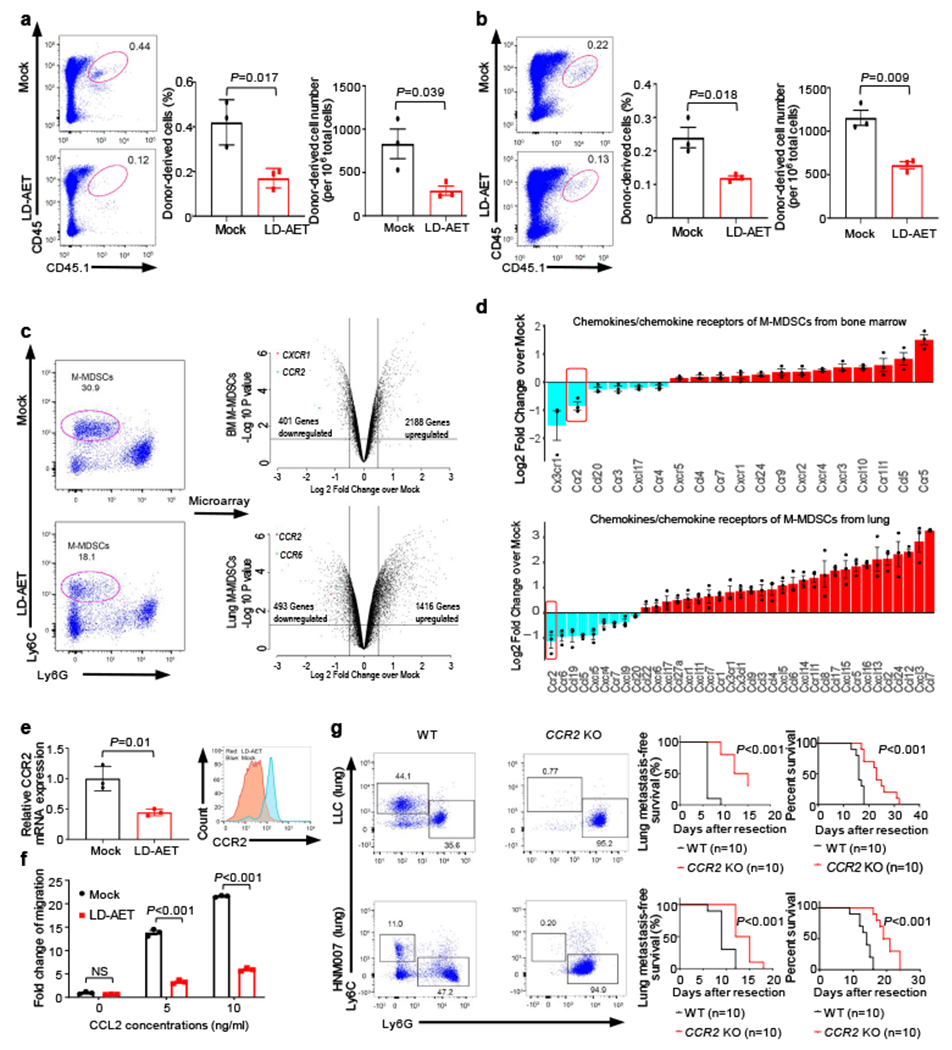
The effect of LD-AET on M-MDSCs transferred from CD45.1 to CD45.2 mice (a) and the trafficking ability of adoptively transferred M-MDSCs from LD-AET or vehicle treated CD45.1 mice in CD45.2 recipient mice (b). FACS and graphs showing percentages and absolute numbers of donor-derived cell subsets (CD45.1+ cells) in the both lungs of LLC recipient metastasis mice (n=3 mice per group). c, Cell sorting schema for harvesting M-MDSCs on day 3 post-resection (left panels). Volcano plots showing RNA expression differences of bone marrow and lung M-MDSCs between LD-AET and vehicle treated LLC metastasis mice (right panels, n=3 biological replicates). d, Agilent cDNA array expression of chemokines/chemokine receptors in M-MDSCs from bone marrow and lungs of LD-AET and vehicle treated LLC metastasis mice (n=3 biological replicates). FDR adjusted P values of CCR2 are 0.005 (bone marrow) and 0.016 (lung). e, Effect of LD-AET on CCR2 expression in bone marrow M-MDSCs (BM-M-MDSCs) from LLC metastasis mice on day 3 by quantitative-PCR (left panel, n=3 biological replicates) and FACS (right panel). f, Transwell migration assay of sorted BM-M-MDSCs from LD-AET or vehicle treated LLC metastasis mice (day 3) induced by CCL2 for 60 minutes. Fold changes normalized to migration of the cells in the unstimulated mock group (set at 1) (n=3 biological replicates). g, FACS showing representative results of lung MDSCs in CCR2 KO and wild-type (WT) LLC and HNM007 (left panels) metastasis mice at day 3. Kaplan-Meier curves showing disease-free and overall survival of CCR2 KO and WT LLC (upper panels) and HNM007 (lower panels) metastasis mice. Two-sided log-rank test. a-f, two-sample two-sided t-test. Bars show mean ± s.e.m.
To identify differences in lung and bone marrow MDSCs from mock and LD-AET treated mice on day3 post-resection, we compared the gene expression of M-MDSCs (excluding differentiated MHC-II+ and F4/80+ macrophages) sorted from these two groups in LLC pulmonary metastasis mice (Fig.2c). Gene set enrichment analysis (GSEA) of lung M-MDSCs showed that LD-AET induced a substantial change in gene sets associated with immune cell chemotaxis and migration (Extended Data Fig.6c). Interestingly, CCR2 expression in both bone marrow and lung M-MDSCs was significantly downregulated in the LD-AET group (Fig.2d). Since CCR2 is a key regulator of monocytic cell migration from the bone marrow to the tumour microenvironment5,21, these data suggest that LD-AET may affect trafficking of M-MDSCs to the premetastatic lung by, at least in part, downregulating CCR2.
Quantitative PCR and flow cytometry confirmed that both mRNA and protein levels of CCR2 in bone marrow M-MDSCs decreased after LD-AET (Fig.2e). Bone marrow M-MDSCs harvested on day3 from LD-AET treated LLC pulmonary metastasis mice show reduced migration in a transwell assay after induction with CCL2 (Fig.2f). Additionally, both the absolute number and percentage of M-MDSCs in the lung premetastatic microenvironment are negligible in CCR2 KO mice and differed from CCR2 wild type mice (Fig.2g). Compared to the CCR2 wild type C57BL/6 mice, the CCR2 KO mice have a longer disease-free and overall survival both in the LLC and HNM007 pulmonary metastasis models (Fig.2g).
We next tested the mechanism of action of LD-AET on CCR2 expression in bone marrow M-MDSCs. The Database for Annotation, Visualization and Integrated Discovery (DAVID) pathway analysis reveals that the activity of the NF-κB signaling pathway was significantly downregulated in bone marrow M-MDSCs from LLC pulmonary metastasis mice treated with LD-AET (Extended Data Fig.6d). In bone marrow M-MDSCs, LD-AET resulted in a highly significant reduction in Rel-B and p52 activation compared to that found in mock mice (Extended Data Fig.6e). There was a limited effect on p50 and p65 activation. Furthermore, three days with treatment of BMS-345541, a highly selective IKB kinase (IKK) allosteric site inhibitor, resulted in decreased expression of CCR2 on bone marrow M-MDSCs in vivo (Extended Data Fig.6f). Although we cannot rule out a direct effect of LD-AET on CCR2 expression as well as other signaling pathways, our findings suggest that LD-AET treatment may affect, at least in part, the expression of CCR2 in bone marrow M-MDSCs via the modulation of the noncanonical NF-κB pathway22.
CXCR2 and CXCR1 are known to be important for their role in trafficking PMN-MDSCs from the bone marrow to the tumour microenvironment23,24. We found that CXCR2 is downregulated in bone marrow and lung PMN-MDSCs by LD-AET in the LLC pulmonary metastasis model (Extended Data Fig.6g). In a transwell migration assay, the migration of PMN-MDSCs from the bone marrow of LD-AET treated mice is significantly decreased after induction with CXCL1 (Extended Data Fig.6h). Thus, LD-AET may inhibit trafficking of both M-MDSCs and PMN-MDSCs from the bone marrow to the premetastatic microenvironment by downregulating CCR2 and CXCR2 expression, respectively.
LD-AET Skews Differentiation of M-MDSCs
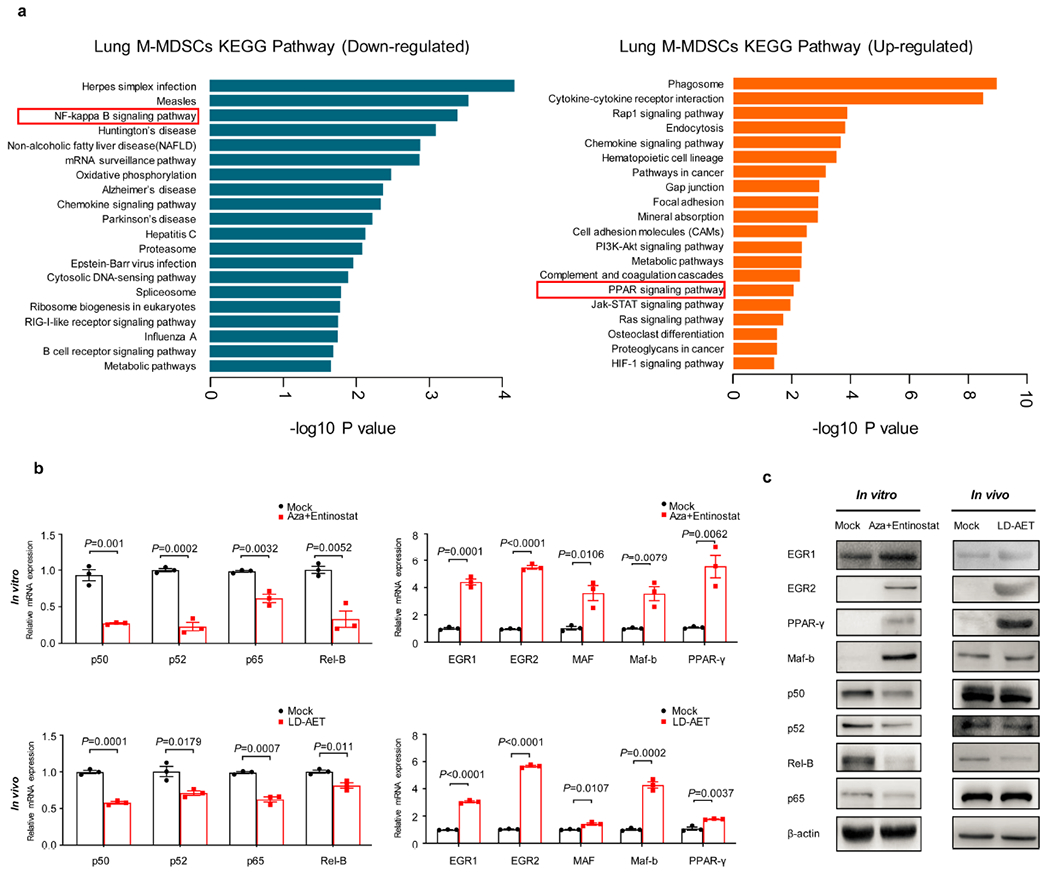
Further query of GSEA derived data indicates that gene sets related to macrophage or myeloid differentiation and activation were upregulated in lung M-MDSCs from LLC pulmonary metastasis mice treated with LD-AET (Fig.3a). Moreover, DAVID pathway analysis reveals that the NF-κB and PPAR signaling pathways were significantly downregulated and upregulated, respectively (Extended Data Fig.7a). Consistent with differential regulation of these pathways occurring during monocyte-to-macrophage differentiation25, there is a preferential increase in transcription factors related to monocytic differentiation that are mainly macrophage related (EGR1, EGR2, MAFB, MAF, PPAR-γ)25,26, and not dendritic cell related (SPIB, RELB, STAT3, FOXP1)26,27 (Fig.3b). The related factors have also been validated in vitro and in vivo by qPCR and Western Blot analyses (Extended Data Fig.7b-c). In vitro epigenetic treatment of splenic M-MDSCs from LLC tumour-bearing mice decreases the percentage and absolute number of M-MDSCs significantly while those of macrophages increased significantly (Fig.3c), implying that LD-AET might promote the differentiation of M-MDSCs into macrophages.
Figure 3. Low dose adjuvant epigenetic therapy skews M-MDSCs towards an interstitial macrophage-like population in the lung premetastatic microenvironment.
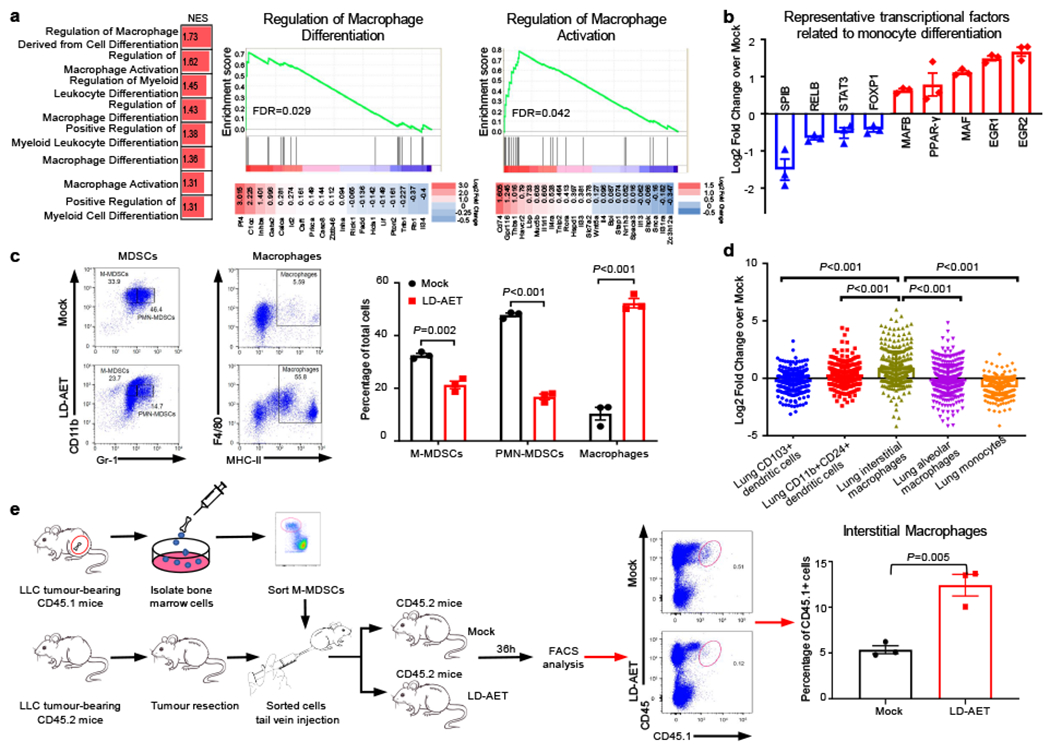
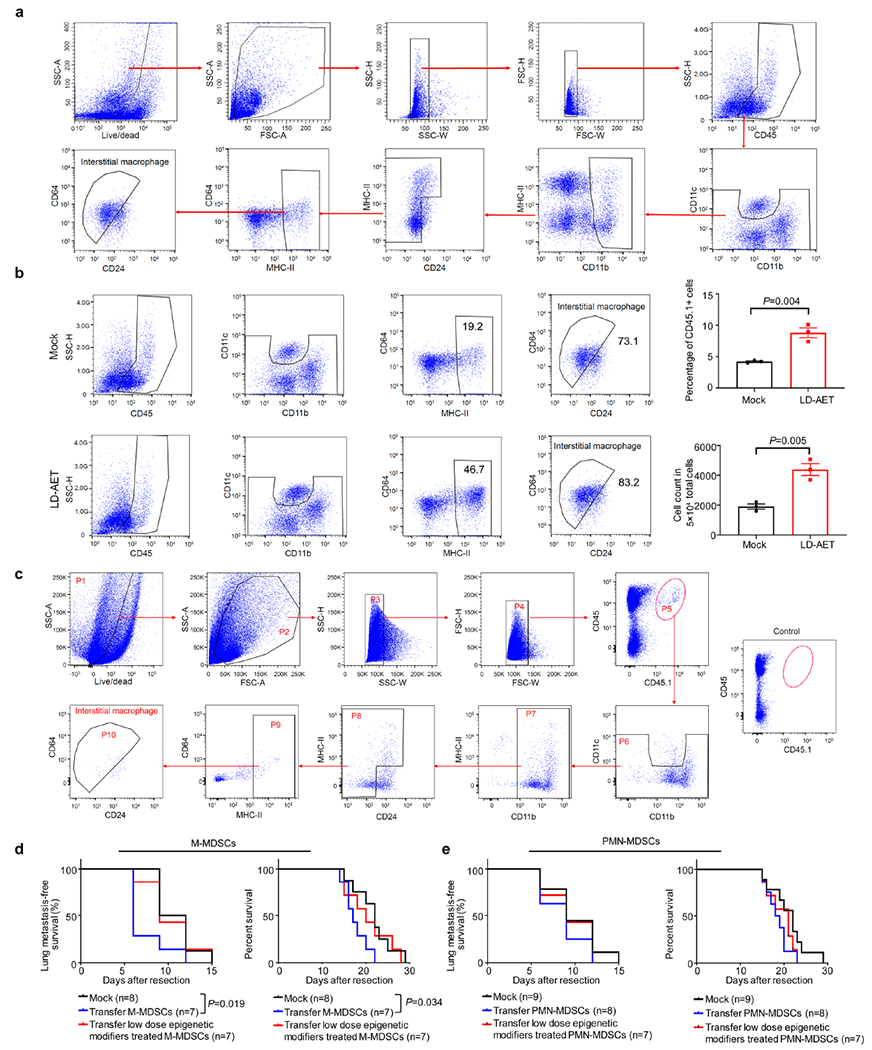
a, GSEA analysis revealed that macrophage or myeloid differentiation and activation gene sets were upregulated (left panel) in lung M-MDSCs from LLC metastasis mice treated with LD-AET. Representative upregulated GSEA plots with core-enriched genes (right panels). NES: normalized enrichment score. FDR: false discovery rate. Colour gradation is representative of log2 fold change over mock (n=3 biological replicates). Gene set enrichment P values, NES values and FDR values reported are calculated with 1,000 permutations in the GSEA software. FDR q-value < 0.25 was deemed significant. b, Significant changes of representative transcription factors (FDR adjusted P-value<0.05) associated with monocytic differentiation (n=3 biological replicates). c, FACS showing the differentiation of sorted M-MDSCs in vitro. Splenic M-MDSCs from LLC metastasis mice were cultured for 3 days with tumour conditioned medium (TCM) (n=3 biological replicates). d, The top 200 significantly upregulated genes (FDR adjusted P-value<0.05) were mapped back to the reference ImmGen populations, the following populations from naïve mice were used: Lung CD103+ dendritic cells, DC_103+11b−_Lu; CD11b+24+lung dendritic cells, DC_103–11b+24+_Lu; Lung interstitial macrophages, MF_11c-11b+_Lu; Lung alveolar macrophages, MF_Alv_Lu; Lung monocytes, Mo_Lu. The expressions of these 200 genes in six populations were transformed by zero-mean normalization. Mann-Whitney U test, two-sided. n=3 biological replicates. e, FACS showing LD-AET can skew the differentiation of transferred M-MDSCs towards an interstitial macrophage-like phenotype in vivo. Purified 5×10⁶ CD45.1+ BM-M-MDSCs (day0) were adoptively transferred into CD45.2+ recipient mice within 24 hours post-resection (n=3 in each group) in LLC metastasis model. Mice received LD-AET or vehicle for 36 hours. b, c and e, two-sample two-sided t-test. All bars show mean ± s.e.m.
ImmGen characterization further defined the resulting populations in the lung premetastatic microenvironment28. Our top two hundred upregulated genes in LD-AET treated lung M-MDSCs map specifically to lung interstitial macrophages (Fig.3d, Supplementary Table 2). Additionally, flow cytometry shows lung interstitial macrophages (CD11b+CD11c+CD64highMHC-II+CD24−)29 increasing in LD-AET treated mice (Extended Data Fig.8a-b). This observation is confirmed by adoptively transferring 5×10⁶ CD45.1+ M-MDSCs into CD45.2+ mice. As expected, thirty-six hours after transfer, the CD45.1+ M-MDSCs differentiated towards a more interstitial macrophage-like phenotype in the lungs of LD-AET treated CD45.2 mice (Extended Data Fig. 8c, Fig.3e). In summary, LD-AET may skew the M-MDSCs towards an interstitial macrophage-like phenotype in the lung premetastatic microenvironment. This MDSC-to-macrophage program acquisition is associated with CCR2 downregulation, a known consequence of monocyte-to-macrophage differentiation30, thus also establishing the functional implications of our aforementioned transcriptional data. Moreover, we found that transferring CCR2 WT M-MDSCs rescued metastases in CCR2 KO mice and resulted in shorter overall survival times, while transferring CCR2 WT PMN-MDSCs did not produce a similar effect. In contrast, transferring the LD-AET treated CCR2 WT M-MDSCs only brought limited change to both the lung metastatic rate and overall survival time in CCR2 KO mice (Extended Data Fig.8d-e). These findings imply that decreased M-MDSCs accumulation in the premetastatic niche due to LD-AET is mainly dependent on CCR2 signaling.
LD-AET Increases Overall Survival
Additionally, in our murine models, LD-AET reduces pulmonary metastases as shown by H&E staining, gross pathological findings, and Cone Beam Computed Tomography (CBCT) imaging (Fig.4a, Extended Data Fig.9a-c). Importantly, in all three murine models, LD-AET prolongs the disease-free and overall survival time (Fig.4b, Extended Data Fig.9d). Compared to adjuvant chemotherapy, LD-AET confers both a longer disease-free and overall survival in the LLC model (Fig.4c). Previously, we found that epigenetic therapy resulted in strong attraction of CD8+ T-cells to NSCLC tumours and a reversal of the immune exhaustion profile of these cells14. However, when we depleted CD4 and CD8 T-cells (from day 1 to day 6) in our LLC pulmonary metastasis model, we observed that there was no difference during LD-AET either in disease-free or overall survival, indicating that metastases reduction was T-cell independent (Extended Data Fig.9e, Fig.4d). Finally, the combination of LD-AET and CCR2 antagonists in our LLC and HNM007 murine models shows synergy in disease-free and overall survival (Fig.4e, Extended Data Fig.9f-g).
Figure 4. Low dose adjuvant epigenetic therapy inhibits pulmonary metastases and prolongs overall survival in murine models mainly by affecting MDSCs.
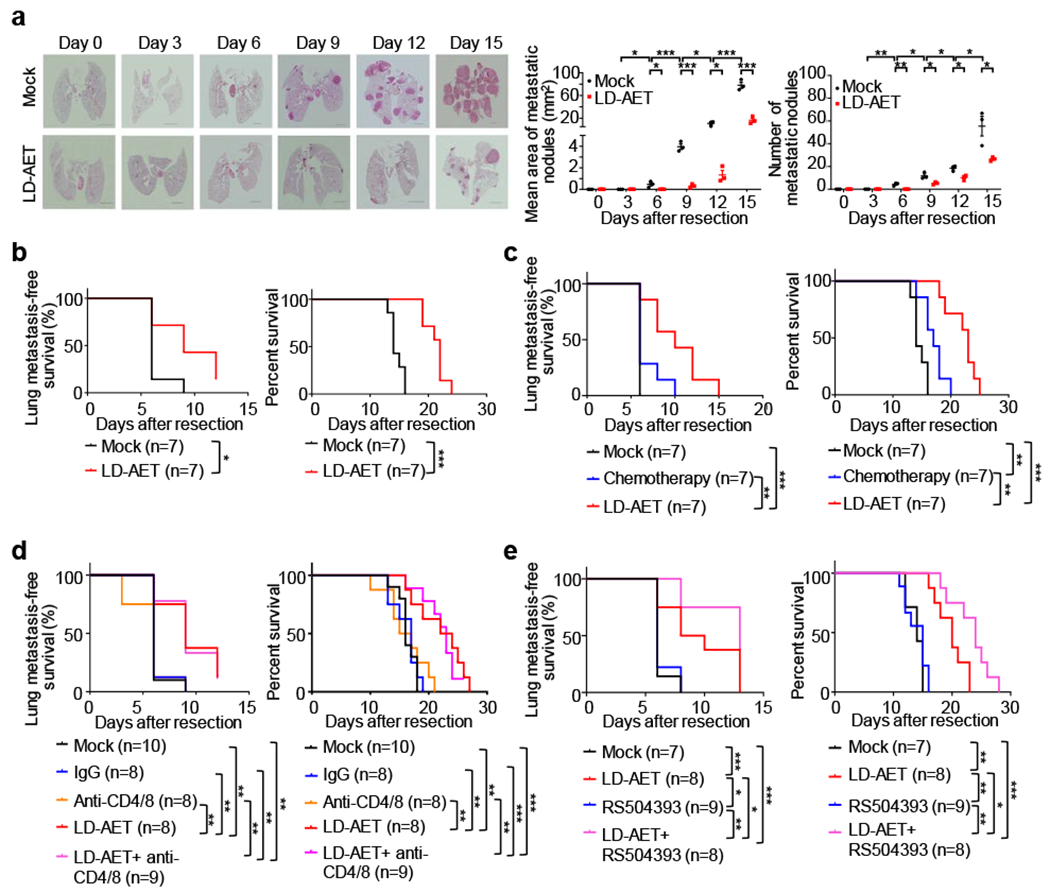
a, Representative H&E-stained images of lung sections from LLC metastasis mice treated with LD-AET or vehicle at different time points after surgery. Scale bar, 2 mm. Graph shows the area and numbers of metastatic nodules. At each time point, 3 mice were sacrificed for analysis. For each sample, sections from 3 levels were analyzed. Tumour area was quantitated using Aperio Imagescope software. Two-sample two-sided t-test. All bars are mean ± s.e.m. b, Kaplan-Meier curves showing the disease-free and overall survival of LLC metastasis mice treated with LD-AET or vehicle. c. Kaplan-Meier curves showing the disease-free and overall survival of the LLC metastasis mice treated with paclitaxel plus cisplatin chemotherapy, LD-AET or vehicle. d, Kaplan-Meier curves showing the disease-free survival and overall survival of mice treated with vehicle, IgG (isotype control), anti-CD4/CD8 (T-cell depletion antibody), LD-AET, and anti-CD4/CD8 combination with LD-AET in LLC metastasis model. e, Kaplan-Meier curves showing the disease-free survival and overall survival of mice treated with vehicle, CCR2 antagonist (RS504393, Sigma), LD-AET and RS504393 in combination with LD-AET in the LLC metastasis model. b-e, two-sided log-rank test. *P < 0.05, **P < 0.01, ***P < 0.001.
Our novel observation that the lung premetastatic niche persists even post-resection has translational implications. First, the results stress a new potential use of epigenetic treatment as adjuvant therapy focused on the perturbation of MDSCs. Second, our findings suggest that LD-AET with CCR2-antagonists may be an emerging paradigm to prevent MDSCs accumulation in the premetastatic niche, thus inhibiting metastases and extending survival. Third, we provide compelling evidence that if M-MDSCs successfully migrate to the lung premetastatic niche, epigenetic modifiers can skew the population to a more interstitial macrophage-like phenotype, antagonizing their pro-metastatic functionality in that microenvironment (Extended Data Fig.10). Post-resection recurrence of early stage cancer, especially for the tumour types studied here, is a profound clinical challenge and effective adjuvant therapies are lacking. LD-AET represents an innovative and potentially efficacious treatment to utilize in the absence of manifest primary tumour-burden after resection. Our therapeutic paradigm may augment the efficacy of early cancer resection, which still represents the most effective cure, while robustly inhibiting recurrence. We plan to translate these pre-clinical findings to a clinical trial in early stage cancer using LD-AET and CCR2-anatagonists to prevent metastatic recurrence.
Methods
Cell lines and cell culture.
Lewis lung carcinoma cells (LLC1) and 4T1 cells were obtained from ATCC and cultured in RPMI 1640 medium (GIBCO) supplemented with 10% fetal bovine serum (FBS, GIBCO). HNM007, a p53-null murine esophageal squamous cell carcinoma cell line transformed by HRASG12V, was kindly provided by Prof. S Singhal (University of Pennsylvania) and cultured in Dulbecco’s modified Eagle’s medium (DMEM, GIBCO) containing FBS at 10% v/v. Cells were maintained in a humidified incubator at 37°C in the presence of 5% CO2 and passaged every 2-3 days. Cell lines were routinely tested for mycoplasma and immediately tested upon suspicion. None of the cell lines used in the reported experiments tested positive.
LLC1 and HNM007 cells were kept in RPMI 1640 medium or DMEM with a reduced (3%) serum concentration for 48 hours. After that time, supernatants were collected, aliquoted and kept at −80°C. For MDSC culture, tumour supernatant (3% FBS) containing 10ng/ml GM-CSF (tumour conditioned medium, TCM) were used.
LLC tissue and HNM007 tissue.
The Lewis lung carcinoma (LLC) tissue (P3 working stock)31, labeled with a Pol2-Luc/GFP lentiviral vector, was kindly provided by Prof. Glenn Merlino (NCI-Frederick).
To generate HNM007 tissues, mice were injected subcutaneously in the right flank with 1.0 × 10⁵ viable HNM007 cells in 0.1 mL of PBS and Matrigel (1:1, v/v). On reaching 500-750 mm3, tumours were surgically removed, and lung metastases were monitored periodically by cone beam computed tomography (CBCT) imaging. This transplantation was referred to as passage zero (P0). The lung nodules were identified by CBCT imaging, resected and then subcutaneously transplanted into other mice (passage one, P1). The same procedure was repeated eight times (from P2 to P9), and the lung nodules were then collected and subcutaneously transplanted into 50 mice as passage ten (P10). When the P10 tumours reached 500-750 mm3, they were collected into 100 tubes and frozen in liquid nitrogen as working stocks. All the HNM007 tumours in our studies were expanded from the P10 working stock.
Animals.
Female C57BL/6 mice and BALB/c mice were purchased from Charles River Laboratories (Wilmington, MA). Female mice congenic in murine CD45 at the Ly5 locus (B.6SJL-Ptprca Pepcb/BoyJ Ly5.1) were obtained from Jackson Laboratory (Bar Harbor, ME). Female NOD/SCID/g-chain knockout (NSG) mice, bred and housed at the Johns Hopkins Animal Care Facility, were used. B6.129S4-Ccr2tm1Ifc/J mice were kindly provided by Prof. Sharon A. McGrath-Morrow (Johns Hopkins University). All mice were maintained in pathogen-free conditions and used for experiments at age of 6-8 weeks. The Guide for the Care and Use of Laboratory Animals published by the National Institutes of Health (NIH publication 96-01, revised 1996) were followed, and all protocols were approved by the Johns Hopkins University Animal Care and Use Committee.
Lung spontaneous metastasis model.
For preclinical studies, a vial of P3 LLC tumour was expanded subcutaneously in ten C57BL/6 mice (equals P4). The expanded tumours were resected at 500-750 mm3 and transplanted subcutaneously into the required number of mice for the actual drug study (P5). In the HNM007 lung metastasis model, a vial of P10 HNM007 tumour was expanded subcutaneously in ten C57BL/6 mice (equals P11). The expanded tumours were resected at 500-750 mm3 and transplanted subcutaneously into the required number of mice for the actual drug study (P12). For the 4T1 lung metastasis model, 2 × 10⁵ 4T1 cells were injected into the BALB/c mouse mammary fat pad using a tuberculin syringe. For all models of spontaneous lung metastasis, the primary tumours were surgically removed at 500-750 mm3, and the mice were randomized into treatment groups. For the sham surgery study, tumour-naïve mice underwent a 2.0 cm skin incision and closure in right flank. Mice were treated as follows: azacitidine 0.5 mg/kg (PBS vehicle) subcutaneously injected and daily for 14 days. entinostat 5.0 mg/kg (LLC and HNM007 pulmonary metastasis model) and 2.5mg/kg (4T1 pulmonary metastasis model) (1% DMSO in PBS vehicle) IP injected daily for 14 days. In vivo, the CCR2 inhibitor, RS504393 (Sigma) 2mg/kg (PBS vehicle) or RS102895 (Sigma) 2mg/kg (PBS vehicle), was injected IP daily for 14 days. In vivo, the NF-κB inhibitor, BMS-345541(Selleck) 30mg/kg/d or 75mg/kg/d (3% Tween 80 and sterile water), was orally administered daily for 3 days. Adjuvant chemotherapy regimen was paclitaxel 20mg/kg/week IP plus cisplatin 3mg/kg, BIW, IP for 2 weeks. The size of the subcutaneous tumours was measured manually and calculated by V (mm3) = 0.5 × L × W2, where L is length and W is width in millimeter. The metastasis or recurrence was monitored by CBCT imaging. The time from primary tumour resection to metastases detection by CBCT imaging and to death was defined as the disease-free survival (DFS) and overall survival (OS) period, respectively.
Xenograft studies in NSG mice.
LLC tissue (P5) and HNM007 tissue (P12) were transplanted subcutaneously into the flanks of mice. Drug treatments were started 6-8 days post transplantation, when palpable tumours could be discerned. Treatment was continued for the entire duration of the study and mice were sacrificed before tumour volumes exceeded 2,000 mm3.
CD4+/CD8+ T-cell depletion experiment.
CD4 antibody (BioXcell, clone GK1.5) and CD8 antibody (BioXcell, clone 116-13.1) mediated CD4+ and CD8+ T-cell depletion in LLC pulmonary metastasis mice was initiated within 24 hours post primary tumour resection. Mice were injected intraperitoneally with 500μg of CD4 and CD8 antibodies at day 1 and day 4, respectively after resection. As controls, mouse IgG2a isotype control (BioXcell, clone C1.18.4) and Rat IgG2b isotype control (BioXcell, clone LTF-2) were injected into the control mice. CD4+ and CD8+ T-cell depletion was verified by flow cytometric (FACS) analysis of peripheral blood cells.
MDSCs depletion experiment.
Synthetic, complementary double-stranded oligonucleotides encoding H6 peptide (TIK), and an irrelevant control peptibody (Irr-pep) (D1) were kindly provided by Prof. Larry W Kwak17 (The University of Texas MD Anderson Cancer Center). The recombinant peptibodies used in all in vivo studies were produced by Kempbio (Frederick, MD) following an established protocol17. After LLC tumour resection, groups of C57BL/6 mice were injected via their tail veins with 50μg of peptibody (TIK) once per day from day 1 to day 14. Control mice received irrelevant control peptibody (Pep-irrel) or PBS. MDSCs depletion was verified by assessment of the MDSC population in the premetastatic lung.
CBCT guided systems.
To monitor the lung metastases, the mice were subjected to CBCT imaging (Dr. Wang’s Lab, Department of Radiation Oncology and Molecular Radiation Sciences, Johns Hopkins University) at different timepoints after primary tumour resection. The standard procedure for CBCT imaging has been described previously 32.
Drug Reagents.
Azacitidine (Sigma) was dissolved in distilled water at 500μM (in vitro) and 5 mg/mL (in vivo). Entinostat (MS-275) provided by Dr. Peter Ordentlich (Syndax, Waltham, MA) was dissolved in dimethyl sulfoxide (DMSO) to concentrations of 500μM (in vitro) and 1mg/mL (in vivo). Both azacitidine and entinostat were aliquoted and stored at −80°C and diluted to needed working concentrations before use. BMS-345541 (Selleck) was formulated as a 2 mg/ml solution in 3% Tween 80, water and stored at 4°C. RS504393 (Sigma) and RS102895 (Sigma) were first dissolved in DMSO and stored at −80°C. The stock solution was dissolved in normal saline at 2mg/ml for intraperitoneal injection. All the stored reagents were for single use only.
Cell Viability Assays (CCK8 assay).
Equal numbers of viable cells were plated in 96 well plates at the following cell seeding densities per well: LLC1 cells (2 × 10³), HNM007 cells (2 × 10³), 4T1 cells (2 × 10³), M-MDSCs (1 × 10⁴) and PMN-MDSCs (1 × 10⁴). Cells were incubated with 100μL drug supplemented media, treated with DMSO (vehicle) at 0.1% or the following drugs concentrations standardized to 0.1% DMSO final concentration. For LLC1 cells, HNM007 cells and 4T1 cells, the treatment regimens were azacitidine: 25nM, 50nM, 100nM, 200nM and 400nM; entinostat: 25nM, 50nM, 100nM, 200nM and 400nM; combined treatment: entinostat 50nM plus azacitidine 25nM, 50nM, 100nM, 200nM, 400nM, respectively. After incubation for 24h, 48h or 72h, cell viability was measured using a Cell Counting Kit-8 (CCK8) assay (Dojindo) according to the manufacturer’s instructions. The optical density at 450 nm was measured using a multi-well plate reader (Micro-plate Reader; Bio-Rad).
Apoptosis assay.
Apoptotic assays in cultured cells or transferred cells were performed using the Annexin V-FITC apoptosis detection kit (BD Pharmingen). Assays were performed according to the manufacturer’s protocol.
T-cell suppression assay.
MDSCs were isolated using the mouse MDSC isolation kit, according to the manufacturer’s protocol (Miltenyi Biotec), or by flow cytometry. CD8+ T-cells were isolated from the spleens of tumour bearing mice by magnetic separation as described previously33 and then labeled with 5 μM carboxyfluorescein succinimidyl ester (CFSE) (Invitrogen). The CFSE-labeled T-cells were incubated with CD11b+Ly6ClowLy6G+ or CD11b+Ly6ChighLy6G− cells isolated from the lung premetastatic niche (day 3) at different ratios in a 96-well plate cultured with CD3/CD28 beads (Gibco) at 37°C with 5% CO2. After 72h, the cells and supernatant were collected. Cells were stained with anti-CD8 antibody so that CD8+ T-cells can be specifically gated and examined, and the CFSE fluorescence intensity of the CD8+ T-cells was determined by flow cytometry. IFN-γ concentrations in the supernatant were determined by ELISA (R&D systems) according to the manufacturer’s instructions.
In vitro transwell migration assay.
M-MDSCs or PMN-MDSCs isolated from the bone marrow by FACS were incubated in tumour conditioned medium in the upper chamber of transwell inserts 5μm pore for M-MDSCs or 3μm pore for PMN-MDSCs) with CCL2 (5ng/mL or 10ng/mL) or CXCL1 (20ng/ml or 50ng/mL) in the lower chamber. Transmigrated M-MDSCs or PMN-MDSCs were enumerated following a 60-minute or 120-minute incubation. Fold changes was normalized to migration of the cells in the unstimulated mock group (set at 1).
FACS profiling and sorting of immune cells from murine lung, blood, spleen and bone marrow.
FACS profiling and sorting of immune cells were performed after both lungs were harvested from LLC, HNM007 and 4T1 in mock or treated groups. Tissue was then digested for 30 minutes at 37°C in digestion buffer (RPMI, FBS [5%], Collagenase Type 1 [Sigma-Aldrich, 0.2%], Collagenase Type 2 [Sigma-Aldrich, 0.2%] and DNase I [Roche, 50u/mL]), minced and strained through a 40μm cell strainer to obtain a single cell suspension14. Perfused livers were cut into small fragments and incubated (37°C, 250 rpm for 30 min) with 5 ml digestion buffer (5% FBS, 0.5 mg/ml collagenase VIII [Sigma-Aldrich], and 0.1 mg/ml DNase I in PBS). This was followed by three cycles of washings with PBS at 400 rpm from which the supernatant was taken, omitting the parenchymal cell pellet. Spleens were mechanically dissociated, and red blood cells (RBCs) were lysed in 1 × lysing buffer (BD Bioscience). Femurs and tibias from mice were dissected, and the bone marrow (BM) was flushed with RPMI 1640 medium. The cells were filtered through a 70-μm cell strainer. Blood was obtained by tail vein puncture or by heart puncture after exposing the organ. Blood was collected into tubes containing 1.0 ml of PBS with 2 mM EDTA. RBCs were then lysed with lysing buffer and the cell pellet was washed twice in PBS. Cells were counted and then blocked with rat monoclonal anti-CD16/CD32 (Fc block antibody) in PBS for 30 min at 4°C. Cells were then stained with antibodies. For intracellular antigens, cells were fixed and permeabilized in fixation/permeabilization buffer (eBioscience) for 30 minutes at 4°C, washed, and stained with intracellular antibodies for 30 minutes at 4°C. Information about all the antibodies used is provided in Supplementary Table 3.
Cell transfer experiments.
For adoptive transfer experiments, MDSCs were sorted from the bone marrows of CD45.1+ LLC pulmonary metastasis mice by FACS. A total of 5 × 10⁶ M-MDSCs or PMN-MDSCs were transferred into a CD45.2+ mouse via tail-vein injection within 24h post-resection.
Immunofluorescence analysis.
Immediately after perfusion, mice lungs were embedded in optimal cutting temperature (OCT) compound, snap-frozen, and stored at −80°C until analyzed. Five-micrometer cryosections were cut, air-dried, acetone-fixed, and blocked with 10% normal goat serum (30 min, Sigma-Aldrich). To detect MDSCs, slides were stained with rat anti-Gr-1 Ab (1:500, Biolegend). To detect T-cells, slides were stained with rabbit anti-CD4 antibody (1:200, Abcam) and rat anti-CD8a antibody (1:100, ebioscience). To detect GFP signal, slides were stained with rabbit anti-GFP (1:200, Abcam). Sections were washed in PBS three times before adding goat anti-rabbit Alexa Fluor 488 and goat anti-rat TRITC secondary antibodies in blocking solution for 45min at room temperature. All sections were mounted in ProLong® Gold Antifade Mountant with DAPI (Thermo Fisher Scientific) and imaged with a Nikon Confocal Microscope C1 and analyzed with EZ-C1 software (Nikon, Tokyo, Japan).
Gene Expression Analysis.
For genome-wide gene expression analysis, we utilized gene expression arrays at the Sidney Kimmel Comprehensive Cancer Center (SKCCC) Microarray Core at the Johns Hopkins University. MDSCs were isolated from bone marrow or lungs by FACS. RNA preparations were obtained from lung or bone marrow M-MDSCs pooled from 6–8 mice/per sample (LD-AET group) or from 1-2 mice/per sample (vehicle treatment group). After total cellular RNA was extracted using the TRIzol method (Life Technologies), RNA concentration was determined using the NanoDrop machine and software (Thermo Fisher Scientific). Around 400ng of total RNA was used to generate cDNA with the QuantiTect Reverse Transcription Kit (Quanta Biosciences). Transcriptomic profiles were obtained using Agilent 4×44K mouse Gene Expression v2 arrays following the manufacturer's instructions. Microarray data were analyzed with the R package limma as described in the manual. In brief, background signals were corrected using the ‘normexp’ method (with offset=50). Then, normalization within arrays and between arrays was performed utilizing the ‘losses’ and ‘Aquantile’ methods. The differential gene expression was defined as log2FC> absolute (0.5) and an FDR adjusted p-value <0.05. Ranked lists of log2 fold change were analyzed using Gene Set Enrichment Analysis (GSEA) by the Broad Institute developed data packages34. Significantly enriched gene sets were defined using an FDR cutoff < 0.25. p-values were defined as < 0.05 when comparing treated conditions versus controls.
DAVID analysis of median absolute deviation derived genes (KEGG Pathways).
Gene ontology and KEGG pathway enrichment analyses were conducted using the DAVID Bioinformatics resources database35,36. Only categories that were below the FDR adjusted p-value of 0.05 were considered.
Quantitative real-time PCR.
Quantitative real-time PCR (qRT-PCR) was performed with SYBR Green I detection chemistry (Bio-Rad Laboratories) using the Applied Biosystems 7500 Fast Real-Time PCR System and its software. β-actin was used as a reference gene. The specific primers used for qRT-PCR are listed in the Supplementary Table 4. The ΔΔCT method was used to calculate relative expression levels.
Immunoblotting.
Protein was extracted by RIPA buffer containing protease and phosphatase inhibitors. 6-10% Bis-Tris protein gels were equally loaded with 30μg protein, electrophoresed at 110 V, and electro-transferred to PVDF membranes. Membranes were blocked in 10% milk/TBST and immunoblotted with the following antibodies: rabbit polyclonal anti-MMP-9 (Abcam, 1:1000), rabbit monoclonal anti-TGF-β (Abcam, 1:1000), rabbit polyclonal anti-ARG1 (Abcam, 1:1000), rabbit monoclonal anti-VEGF-A (Abcam, 1:1000), rabbit monoclonal anti-S100A8 (Abcam, 1:1000), rabbit monoclonal anti-TNF-α (Abcam, 1:1000), rabbit monoclonal anti-IL-6 (Cell Signaling Technology, 1:1000), rabbit polyclonal anti-DNMT1 (Cell Signaling Technology, 1:1000), rabbit monoclonal anti-EGR1(Abcam, 1:1000), rabbit monoclonal anti-EGR2 (Abcam, 1:1000), rabbit monoclonal anti-PPAR-γ (Cell Signaling Technology, 1:1000), mouse monoclonal anti-Maf-b (Santa Cruz Biotechnology, 1:100), rabbit monoclonal anti-p50 (Cell Signaling Technology, 1:1000), rabbit monoclonal anti-p52 (Cell Signaling Technology, 1:1000), rabbit monoclonal anti-Rel-B (Cell Signaling Technology, 1:1000), rabbit monoclonal anti-p65 (Cell Signaling Technology, 1:1000), mouse monoclonal antî-Actin (Sigma Aldrich, 1:10000). The loading control antibodies (ant-β-Actin) in all cases were applied. Information about all the antibodies used is provided in Supplementary Table 3.
NF-κB DNA-binding capability assay.
To measure NF-κB activation, the TransAM NF-κB Family Transcription Factor Assay Kit (43296, Active Motif, Carlsbad, CA) was used according to manufacturer’s protocol. Briefly, bone marrow derived M-MDSCs from LLC pulmonary metastasis mice treated with vehicle or LD-AET were isolated and nuclear extracts were prepared in lysis buffer AM2. Nuclear lysates were incubated with oligonucleotides containing the NF-kB-binding consensus sequence, and specific antibodies were used to detect the different subunits within the bound complexes. Quantification was performed via colorimetric readout of absorbance at 450 nm.
H&E staining and imaging.
For histological analysis, lungs were fixed in 10% formalin overnight, and subsequently transferred into 70% ethanol, embedded in paraffin according to standard protocols. Sections (5 μm) were stained with H&E and viewed under the Nikon Eclipse NiE microscope (Nikon Instruments Inc.). Images from the whole slide were acquired by Nikon Nis Element software. For each sample, sections from 3 levels were analyzed. Number and area of metastatic sites were quantitated using Aperio Imagescope software.
Adjuvant Epigenetic Treatment Trial.
The J1037 (NCT01207726) study was a randomized phase II study that compared the low dose adjuvant epigenetic therapy (Aza plus entinostat) with standard of care (observation) in patients with stage I (T1-2aN0) NSCLC after primary tumour resection. The J1037 study was performed in full accordance with the guidelines for Good Clinical Practice and the Declaration of Helsinki, and all patients gave written informed consent. Protocol approval was obtained from the Johns Hopkins Hospital and Anne Arundel Medical Center Ethics Committee. An independent data monitoring committee reviewed the safety data. The patients from the adjuvant epigenetic treatment group received the combination of azacitidine at 40 mg/m2 on days 1-5 and 8-10 with entinostat at a 7 mg fixed dose on days 3 and 10 of each 28 days cycle. The primary end point was the effect of Aza plus entinostat on the hazard of 3 years progression-free survival in patients with resected stage I non-small cell lung cancer. Finally, thirteen patients were enrolled in the trial. Due to the difficulty in enrolling patients, the trial was prematurely terminated on May 1, 2015.
Statistical analysis.
Flow and imaging data were collected using FlowJo Version 10.0.7, or Summit Version 5.4 (Beckman Coulter). All the experiments were performed in biological and technical triplicates. Values reported in Figures are expressed as the standard error of the mean, unless otherwise indicated. Depending on the type of experiment, data were tested using two-sample two-sided t-test, two-sided log-rank test, one-way ANOVA, hypergeometric test, or Mann-Whitney U test. p values < 0.05 were considered significant. * p value < 0.05, ** p value < 0.01, *** p value < 0.001. Statistical analyses were performed with GraphPad Prism 7.0 (GraphPad Software, Inc., San Diego, CA) or R version 3.6.1 (https://www.r-project.org).
Extended Data
Extended Data Figure 1. Efficacy of low dose adjuvant epigenetic therapy on cancer recurrence in stage I (T1– 2aN0) NSCLC patients in a phase II clinical trial.
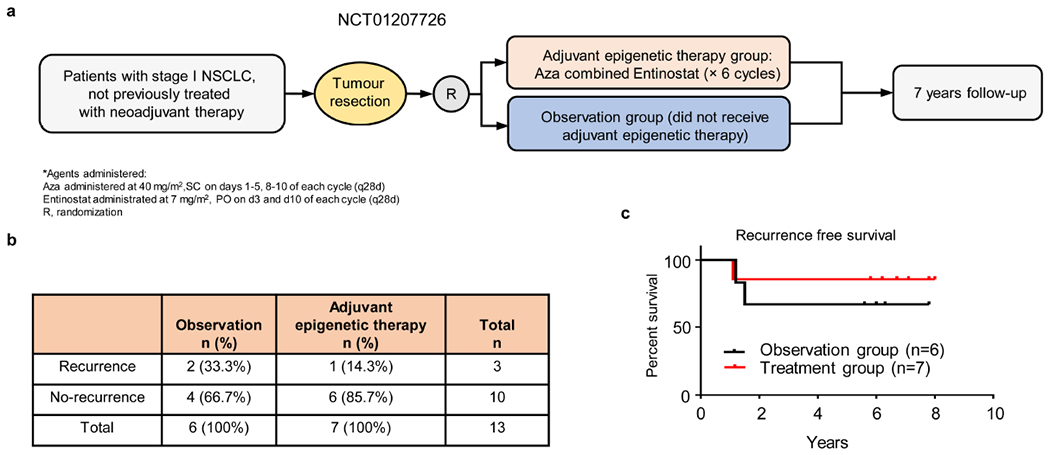
a, Schema for a randomized phase II clinical trial of adjuvant epigenetic therapy in stage I (T1–2aN0) NSCLC patients (NCT01207726). b, Postsurgical recurrence rates in the observation and adjuvant epigenetic therapy groups. c, Kaplan-Meier curves for disease-free survival in the observation and adjuvant epigenetic therapy groups. P=0.50 by two-sided log-rank test.
Extended Data Figure 2. Schema outlining the establishment and characteristics of the murine pulmonary metastasis models.
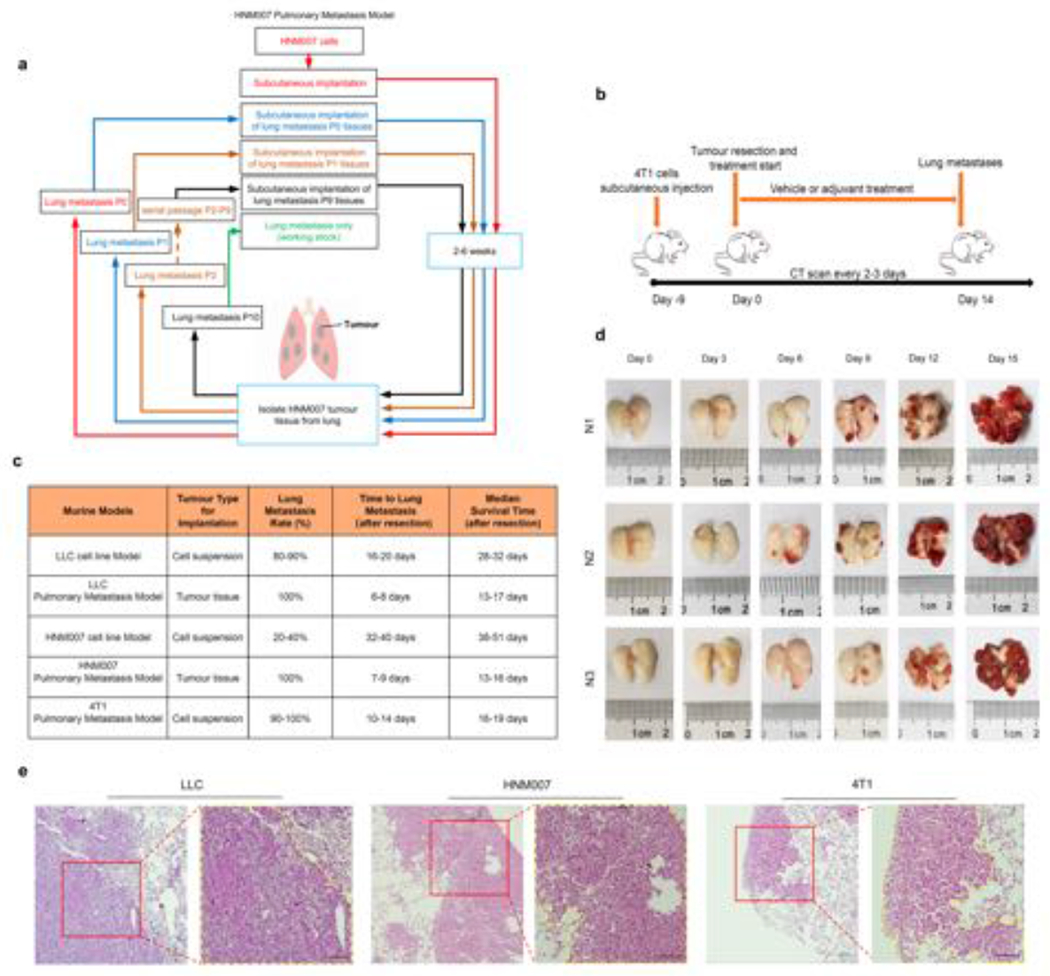
a, Schema for establishing the highly aggressive HNM007 pulmonary metastasis model. Pulmonary metastases were harvested and serially subcutaneously implanted in the right flanks of mice for 10 passages. b, Schema for establishing the 4T1 pulmonary metastasis model. c, Characteristics of murine cell line (non-selective) and spontaneous murine tissue pulmonary metastasis models (metastases harvested selectively from serial pulmonary metastases to produce a solely pulmonary metastatic phenotype). d, Longitudinal gross pathological photographs of bilateral pulmonary metastases during the natural history of the LLC pulmonary metastasis model in C57BL/6 mice from day 0 to day 15 after surgery. N1, N2, and N3 depict the experiment performed in triplicate. Two mice were sacrificed at each time point from Day 0 to Day 15 (n=36) of which 18 mice are shown here as representative photomicrographs. e, H&E staining of pulmonary metastases in LLC, HNM007 and 4T1 pulmonary metastasis mice. The histology of LLC (day 9), HNM007 (day 12) and 4T1 (day 12) pulmonary metastases were confirmed by a pathologist. Scale bar, 100μm. Representative data were repeated at least three times with similar results.
Extended Data Figure 3. CD11b+Gr-1+ cells persist as the predominant immune cells even post-resection in the lung premetastatic microenvironment as functional MDSCs.
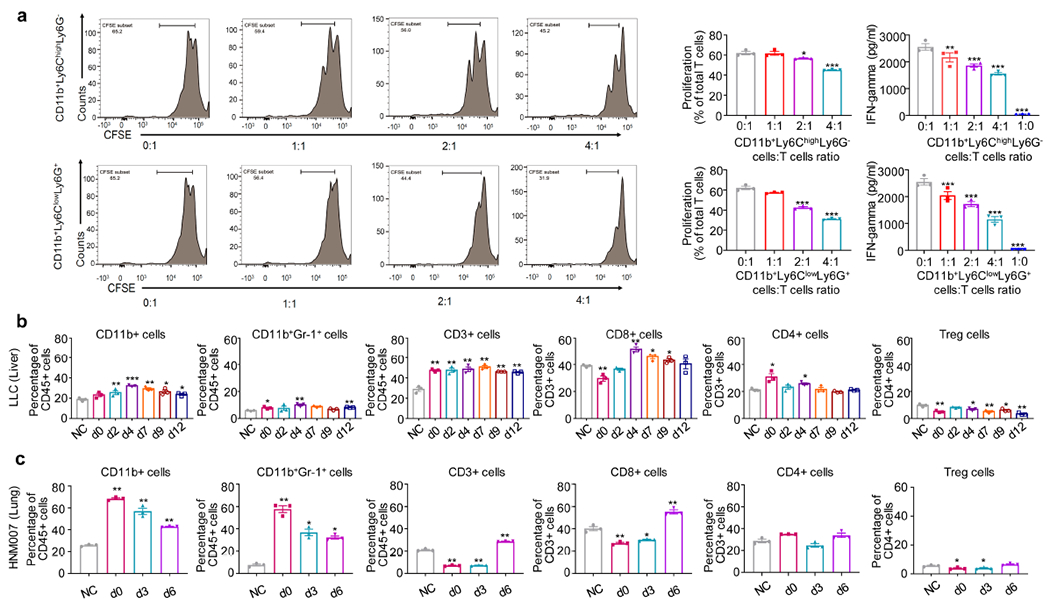
a, In LLC metastasis mice, lung CD11b+Ly6ChighLy6G− and CD11b+Ly6ClowLy6G+ cells harvested at 72 hours post-resection both have suppressive activity in vitro against CD8a T-cells. Freshly isolated CD11b+Ly6ChighLy6G− or CD11b+Ly6ClowLy6G+ cells from both lungs at day 3 post-resection were co-cultured with CD8a T-cells for 72 hours at different ratios (0:1, 1:1, 2:1, 4:1 and 1:0). T-cell proliferation and IFN-γ concentrations in the supernatant were measured by FACS (left panels) and ELISA (right panels), respectively (n=3 biological replicates). Representative data were repeated at least three times with similar results. Two-sample two-sided t-test was used in the comparison with mock (CD8a T-cells alone). b, Immune cell profiles of liver in LLC metastasis mice. Single cell suspensions from the entire liver were analyzed by FACS (n=3 mice per timepoint) at different timepoints after surgery. NC: negative control, normal liver from C57BL/6 mice. c, Immune cell profiles of both lungs in HNM007 metastasis mice at different timepoints after surgery. Single cell suspensions from both lungs were analyzed by FACS (n=3 mice per timepoint). NC: negative control, normal lungs from C57BL/6 mice. b and c, two-sample two-sided t-test was used in comparison with NC. All bars show mean ± s.e.m. *P < 0.05, **P < 0.01, ***P< 0.001.
Extended Data Figure 4. Consideration of combined adjuvant epigenetic treatment dosing based on its effect on murine models.
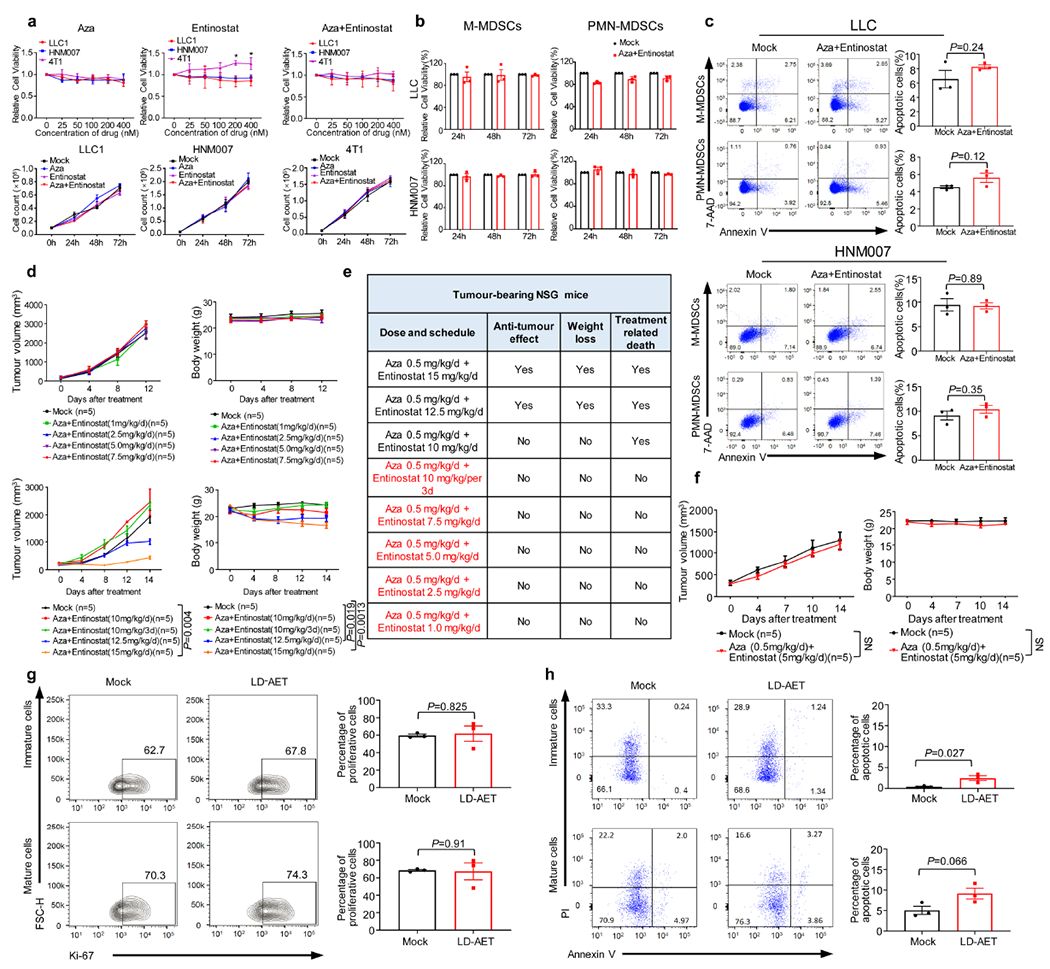
a, The upper panels show the effect of different dosages of epigenetic modifiers on the viability of LLC1, HNM007 and 4T1 cells in vitro (72 hours, Cell Counting Kit-8). Graphs show the mean of 3 independent experiments, two-sample two-sided t-tests with mock; The lower panels show the effect of low dose Aza (100nM) plus entinostat (50nM) on the proliferation of LLC1, HNM007 and 4T1 cells in vitro. A total of 1 × 10⁵ viable cells were plated per well. Cells were collected at 24, 48 and 72 hours and counted using a cell counter (Bio-Rad) after Trypan blue exclusion. Graphs show mean of 3 independent experiments, significance at 72h was determined by one-way ANOVA followed by Tukey’s test for multiple comparisons. b, The effect of low dose Aza (100nM) plus entinostat (50nM) on the viability of BM-MDSCs (day 3) from LLC (upper) and HNM007 (lower) metastasis mice in vitro (Cell Counting Kit-8). Graphs show the mean of 3 independent experiments. c, The effect of low dose Aza (100nM) plus entinostat (50nM) on the apoptosis of BM-MDSCs (day 3) from LLC and HNM007 metastasis mice in vitro. Cell apoptosis was measured by FACS at 48 hours. The lower right quadrant (Annexin-V+/7-AAD−) and upper right quadrant (Annexin-V+/7-AAD +) represent early and late apoptotic cells, respectively. Graphs show the percentage of total apoptosis (early and late apoptosis) in mock and treatment groups (n=3 biological replicates). d, Tumour growth and body weight of LLC tissue-bearing NSG mice treated with different doses of entinostat plus Aza. Significance at day 12 (upper panels) and day 14 (lower panels) was determined by one-way ANOVA followed by Tukey’s test for multiple comparisons. e, Summary Table of tumour growth, body weight, and treatment-related death of LLC tissue-bearing NSG mice. Regimens in red indicate dosages with no effect on tumour growth, weight loss or treatment-related death. f, Tumour growth and body weight of HNM007 tissue-bearing NSG mice treated with Aza 0.5mg/kg/day plus entinostat 5mg/kg/day or vehicle. Significance at day 14 was determined by two-sample two-sided t-test. The effect of LD-AET on the proliferation (g) and apoptosis (h) of donor-derived CD45.1+ BM-MDSCs in CD45.2 LLC metastasis mice. Proliferation and apoptosis of immature (MHC-II−) and mature (MHC-II+) CD45.1+ cells were measured by FACS at 36 hours after transfusion (day 2). Graphs (g) show the percentage of Ki67+ cells (n=3 mice per group). Graphs (h) show the percentage of total apoptosis (early and late apoptosis) in mock and LD-AET groups (n=3 mice per group). b, c, g, and h, two-sample two-sided t-test. All bars show mean ± s.e.m. *P < 0.05.
Extended Data Figure 5. Low dose adjuvant epigenetic therapy disrupts the lung premetastatic microenvironment mainly by affecting MDSCs.
a, The effect of LD-AET (Aza 0.5mg/kg/day plus entinostat 2.5mg/kg/day) on lung MDSCs at day 3 post-resection in 4T1 metastasis mice (n=3 per group). Immunofluorescence staining of CD4+ and CD8+ T-cells (b), or Gr-1+ cells (c) from the lung premetastatic microenvironment (day3) in LLC metastasis mice with or without LD-AET. Negative control, normal lungs from tumour-free C57BL/6 mice. Immunofluorescence staining was performed using CD4 (green) and CD8 (red) antibodies, or Gr-1 (red) antibodies. Merged images contain DAPI staining for cell nuclei (blue). Original magnification 20×. Representative data were repeated at least three times with similar results. The mRNA (d) and protein (e) levels of representative molecular factors known to promote premetastatic microenvironment formation from both lungs of normal mice, mock LLC metastasis mice (day 3), and LD-AET treated LLC metastasis mice (day 3) were measured by quantitative PCR and western blot. Two-sample two-sided t-test for quantitative PCR experiments (n=3 biological replicates). For gel source data, see Supplementary Fig.1. All the experiments were performed in triplicate and similar results were obtained. f, Graphs (upper panels) showing the percentages of donor-derived cell subsets (CD45.1+ MDSC cells) in the lungs of LLC metastasis mice or sham surgery mice (tumour-naive recipient mice) thirty-six hours after surgery; Graphs (lower panels) showing the percentages of donor-derived cell subsets (CD45.1+ MDSC cells) in the lungs of LD-AET or vehicle treated sham surgery mice (tumour-naïve recipient mice) thirty-six hours after surgery. Purified 5× 10⁶ bone marrow MDSCs from LLC tumour-bearing CD45.1+ mice (day 0) were adoptively transferred into CD45.2+ recipient mice in the sham surgery tumour-naive model or LLC metastatic model (n=3 mice per group). a, f, two-sample two-sided t-test. All bars show mean ± s.e.m. *P < 0.05, **P < 0.01, ***P < 0.001.
Extended Data Figure 6. Low dose adjuvant epigenetic therapy induces substantial changes in immune cell chemotaxis and migration in MDSCs in LLC pulmonary metastasis mice.
a, Schema (left) showing the effect of LD-AET on M-MDSCs or PMN-MDSCs transferred from CD45.1 to CD45.2 C57BL/6 mice in LLC metastasis model. CD45.1+ cells (transferred PMN-MDSCs) were identified in the lungs of the recipient mice and analyzed by flow cytometry (right, n=3 mice per group). b, Schema (left) showing trafficking ability of adoptively transferred M-MDSCs or PMN-MDSCs from LD-AET treated or untreated CD45.1 mice in LLC metastasis model. CD45.1+cells (transferred PMN-MDSCs) were identified in the lungs of the recipient CD45.2 mice and analyzed by flow cytometry at 18 hours after transfer (right, n=3 mice per group). c, Top ten upregulated gene sets from GSEA of lung M-MDSCs after 72 hours of treatment with LD-AET (left panel). Representative upregulated GSEA plots of immune cell chemotaxis and migration (right panels). NES: normalized enrichment score. FDR: false discovery rate. Colour gradation is representative of log2 fold change over mock (n=3 biologically replicates). Gene set enrichment P values, NES values and FDR values reported are calculated with 1,000 permutations in the GSEA software. FDR q-value < 0.25 was deemed significant. d, DAVID analyses of significantly downregulated genes using the KEGG gene ontology in BM-MDSCs from LLC metastasis mice treated or untreated with LD-AET. Top 20 downregulated pathways are presented (n=3 biologically replicates). Hypergeometric test (FDR adjusted p-value<0.05). e, LD-AET significantly decrease nuclear activation of p52 and Rel-B [OD450nm (Mock versus LD-AET): p52: 0.95±0.035 versus 0.721±0.011, P=0.0034; Rel-B: 0.251±0.012 versus 0.1±0.003, P=0.0002], but not p50 and p65 in BM-M-MDSCs from LLC metastasis mice in vivo. Nuclear lysates were incubated with oligonucleotides containing the NF-κB-binding consensus sequence, and specific antibodies were used to detect the different subunits within the bound complexes (n=3 biologically replicates). f, FACS shows the effect of 30mg/kg/d and 75mg/kg/d of BMS-345541 (a highly selective IKB kinase inhibitor) on CCR2 expression in BM-M-MDSCs from LLC metastasis mice on day 3 after surgery. The experiments were performed in triplicate, and similar results were obtained. g, CXCR1 and CXCR2 expression of PMN-MDSCs harvested on day 3 from the bone marrow and or lung detected by quantitative-PCR (upper) and FACS (lower) in LLC metastasis mice treated with vehicle or with 72 hours of LD-AET (n=3 biological replicates). h, Transwell migration assay of sorted BM-PMN-MDSCs from LD-AET (72 hours) or vehicle treated LLC metastasis mice induced by CXCL1 (20ng/ml and 50ng/ml) for 120 minutes (n=3 biological replicates). a-b, e, g-h, two-sample two-sided t-test. All bars show mean ± s.e.m.
Extended Data Figure 7. Low dose adjuvant epigenetic therapy promotes the differentiation of M-MDSCs towards macrophages in the LLC pulmonary metastasis model.
a, DAVID analyses of the significantly downregulated and upregulated genes using the KEGG gene ontology in LLC metastasis mice treated or untreated with LD-AET (n=3 biological replicates). Hypergeometric test (FDR adjusted p-value<0.05). The mRNA (b) and protein (c) levels of representative transcription factors were measured by quantitative PCR and western blot, respectively. In vitro, splenic M-MDSCs from LLC metastasis mice were cultured for 3 days with tumour conditioned medium (TCM). In vivo, M-MDSCs from both lungs of mock (day 3) and LD-AET treated LLC metastasis mice (day 3) were sorted for analysis. For gel source data, see Supplementary Fig. 1. Representative data were repeated at least three times with similar results. b, two-sample two-sided t-test, n=3 biological replicates. All bars show mean ± s.e.m.
Extended Data Figure 8. Low dose adjuvant epigenetic therapy promotes the differentiation of M-MDSCs towards an interstitial macrophage-like population in the lung premetastatic microenvironment.
a, Gating strategy used to identify and analyze lung interstitial macrophages in the lung premetastatic microenvironment by FACS. b, The effect of LD-AET on lung interstitial macrophages from the LLC metastasis mice. The percentage and cell counts of interstitial macrophages from both lungs in mock and LD-AET mice were analyzed by FACS at day 3 after surgery (n=3 per group). Two-sample two-sided t-test. All bars show mean ± s.e.m. c, Gating strategy used to identify and analyze CD45.1+ lung interstitial macrophages from the lungs of recipient CD45.2 mice after the transfusion of CD45.1+ M-MDSCs. d, Kaplan-Meier curves showing the disease-free and overall survival of the LLC CCR2 KO metastasis mice after transfusion of CCR2 WT M-MDSCs (5×10⁶), LD-AET treated (in vivo) CCR2 WT M-MDSCs (5× 10⁶), or vehicle at day1 and day4, respectively. e, Kaplan-Meier curves showing the disease-free and overall survival of the LLC CCR2 KO metastasis mice after transfusion of CCR2 WT PMN-MDSCs (5× 10⁶), LD-AET treated (in vivo) CCR2 WT PMN-MDSCs (5× 10⁶), or vehicle at day1 and day4, respectively. d-e, two-sided log-rank test.
Extended Data Figure 9. Low dose adjuvant epigenetic therapy inhibits pulmonary metastases and prolongs overall survival in murine models.
a, Representative photographs showing lungs treated with vehicle or LD-AET in LLC (day6) and HNM007 (day10) metastasis mice. The red arrows indicate the metastases. b, Representative cone beam computed tomography (CBCT) images of lung metastases on day 6 post-resection in LLC metastasis mice treated with vehicle or LD-AET. The red arrows indicate the metastases. c, Representative H&E-stained images of lung sections from HNM007 (upper panels) and 4T1 (lower panels) metastasis mice treated with LD-AET or vehicle at different time points after surgery. Scale bar, 2 mm. Graph shows area and numbers of metastatic nodules. At each time point, 3 mice were sacrificed for analysis. For each sample, sections from 3 levels were analyzed. Two-sample two-sided t-test. d, Kaplan-Meier curves showing the disease-free and overall survival of HNM007 and 4T1 metastasis mice treated with LD-AET (for 4T1 metastasis model, Aza 0.5mg/kg/day plus entinostat 2.5mg/kg/day) or vehicle after surgery. e, FACS showing the effect of T-cell depleting antibodies on CD4+ and CD8+ T-cells in the peripheral blood of the LLC metastasis mice. n=3 mice per group. Two-sample two-sided t-test. f, Kaplan-Meier curves showing the disease-free and overall survival of LLC metastasis mice treated with vehicle, CCR2 antagonist (RS102895, Sigma), LD-AET, and RS102895 plus LD-AET after surgery. g, Kaplan-Meier curves showing the disease-free survival and overall survival of HNM007 metastases mice treated with vehicle, CCR2 antagonist (RS504393, Sigma), LD-AET and RS504393 in combination with LD-AET. d, f-g, two-sided log-rank test. Representative data in a-b were repeated at least three times with similar results. All bars show mean ± s.e.m. *P< 0.05, **P <0.01, ***P< 0.001.
Extended Data Figure 10. Representation of the effect of low dose adjuvant epigenetic modifiers on lung metastases in the tumour pulmonary metastasis models.
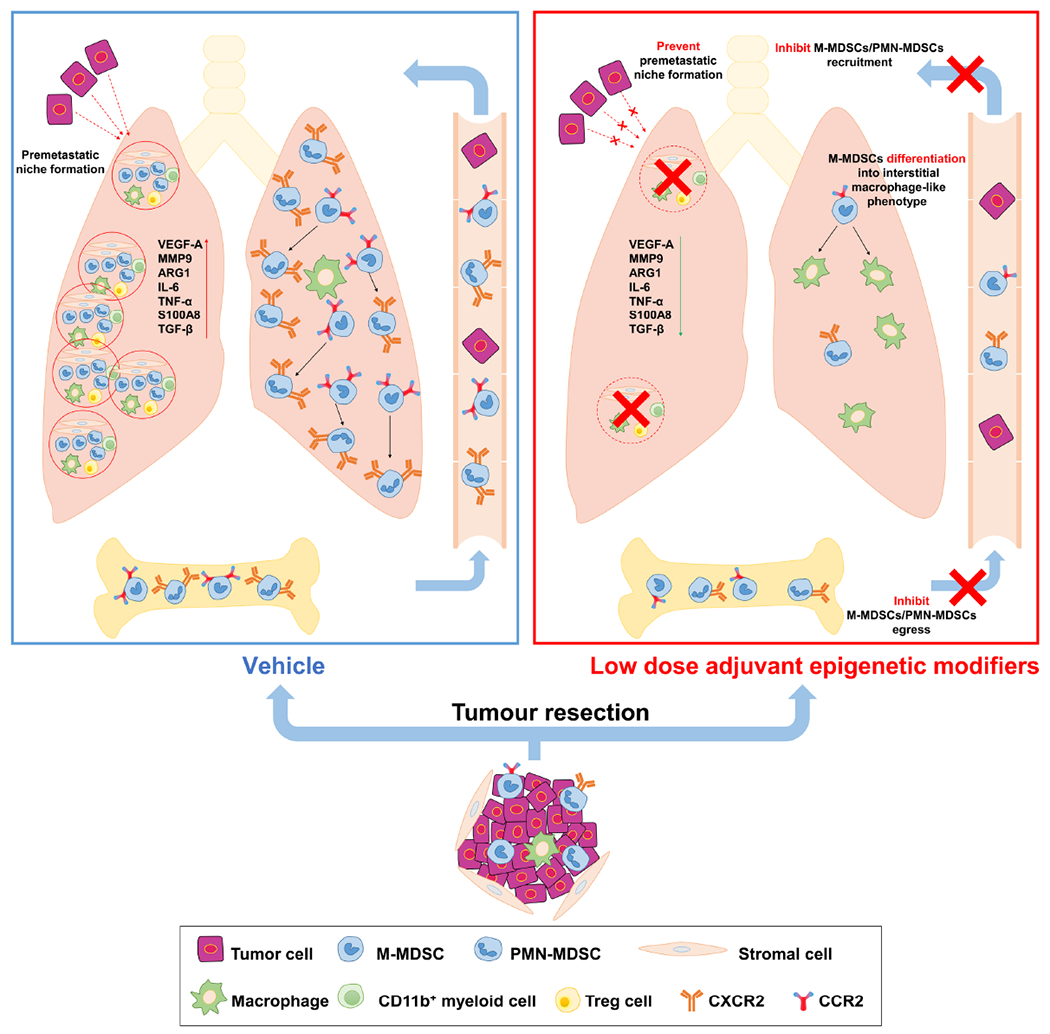
Graphic model showing the inhibition of pulmonary metastases by LD-AET via its effect on MDSCs. Firstly, LD-AET can inhibit the trafficking of M-MDSCs and PMN-MDSCs from the bone marrow to the premetastatic microenvironment by downregulating the expression of CCR2 and CXCR2, respectively. Secondly, even if MDSCs migrate to the lung, LD-AET can skew the differentiation of M-MDSCs towards an interstitial macrophage-like phenotype in the lung premetastatic microenvironment. Therefore, LD-AET can disrupt the lung premetastatic microenvironment, ultimately inhibiting pulmonary metastases.
Supplementary Material
Acknowledgements
This work was supported by grants from the Brockman Foundation, the Skalka-Kronsberg Family as well as the Banks Family Foundation, Bermuda. We acknowledge Prof. Glenn Merlino (NCI-Frederick) for providing the LLC tissue (P3 working stock). We acknowledge Prof. S Singhal (University of Pennsylvania) who kindly provided HNM007, a p53-null murine esophageal squamous cell carcinoma cell line transformed by HRASG12V. We acknowledge Prof. Sharon A. McGrath-Morrow (Johns Hopkins University) who kindly provided B6.129S4-Ccr2tm1Ifc/J mice. We acknowledge Prof. Larry W Kwak (The University of Texas MD Anderson Cancer Center) provided synthetic, complementary double-stranded oligonucleotides encoding H6 peptide (TIK), and an irrelevant control peptibody (Irr-pep) (D1). We acknowledge Ada Tam and Richard (Lee) Blosser for their help with flow cytometry and Peter Ordentlich from Syndax Pharmaceuticals for generously providing entinostat. We acknowledge Shibin Zhou for advice and consultation. We acknowledge Lauren Bois for expert technical help, Yumei Lai for histological analysis with H&E staining and Wei Zhu for data analysis.
Competing Interests
Z.L., M.B have patent applications on epigenetic therapy. J.R.B., C.M.R., P.M.F., R.A.J. serve on the advisory boards of Bristol-Meyers Squibb (BMS), AstraZeneca. J.R.B., P.M.F. R.A.J. are on the advisory board of Merck and receive grant support from BMS. J.R.B., C.M.R., R.A.J are on the advisory boards of Amgen and Genentech/Roche. Y.J.K., P.M.F., R.A.J. serve on the advisory board of Novartis. C.M.R., J.R.B are on the advisory board of Celgene, J.R.B, P.M.F. serve on the advisory boards of Eli Lilly, Jansen. C.M.R. and P.M.F. are on the advisory board of AbbVie. R.A.J., P.M.F. serve on the advisory board of Boehringer Ingelheim. R.A.J., Y.L.K. are on the advisory board of Takeda. R.A.J is on the advisory board of Pfizer. S.R.B. is a consultant to BMS. J.W. is co-founder and chief medical officer of Precision Genetics. J.R.B serves on the advisory board of Syndax, and receives honoraria from Roche/Genentech. C.M.R. is a consultant/advisory board member to Ascentage, Daiichi Sankyo, Ipsen, Loxo, Pharmamar, Vavotek, Bridge Medicines and Harpoon Therapeutics. Y.J.K. serves on the advisory boards of Dracen, Aduro, Sanofi. P.M.F. is a consultant/advisory board member of EMD Serono, lnivata, and receives grant support from Corvus, Kyowa, Novartis. S.B.B. serves on the advisory boards of Mirati Therapeutics, MDxHealth, Aminex Therapeutics. M.V.B., Y.M., J.R.B., P.M.F., R.A.J receive grant support from Astrazeneca. R.A.J., J.R.B. receive grant support from Merck. All other authors declare no competing interests.
Footnotes
Supplementary Information is available in the online version of the paper.
Data availability
All data generated are included in the published Letter and in its Supplementary information. Gene-expression data that support the findings of this study have been deposited in the Gene Expression Omnibus under accession numbers GSE124539. All data are also available from the corresponding author on reasonable request.
References
- 1.Mahvi DA, Liu R, Grinstaff MW, Colson YL & Raut CP Local cancer recurrence: The realities, challenges, and opportunities for new therapies. CA. Cancer J. Clin. 68, 488–505 (2018). [DOI] [PMC free article] [PubMed] [Google Scholar]
- 2.Arriagada R et al. Long-term results of the international adjuvant lung cancer trial evaluating adjuvant Cisplatin-based chemotherapy in resected lung cancer. J. Clin. Oncol. 28, 35–42 (2010). [DOI] [PubMed] [Google Scholar]
- 3.Pan H et al. 20-year risks of breast-cancer recurrence after stopping endocrine therapy at 5 years. N. Engl. J. Med. 377, 1836–1846 (2017). [DOI] [PMC free article] [PubMed] [Google Scholar]
- 4.Kaplan RN et al. VEGFR1-positive haematopoietic bone marrow progenitors initiate the premetastatic niche. Nature 438, 820–827 (2005). [DOI] [PMC free article] [PubMed] [Google Scholar]
- 5.Bonapace L et al. Cessation of CCL2 inhibition accelerates breast cancer metastasis by promoting angiogenesis. Nature 515, 130–133 (2014). [DOI] [PubMed] [Google Scholar]
- 6.Peinado H et al. Premetastatic niches: organ-specific homes for metastases. Nat. Rev. Cancer 17, 302–317 (2017). [DOI] [PubMed] [Google Scholar]
- 7.Steeg PS Targeting metastasis. Nat. Rev. Cancer 16, 201–218 (2016). [DOI] [PMC free article] [PubMed] [Google Scholar]
- 8.Pignon JP et al. Lung adjuvant cisplatin evaluation: a pooled analysis by the LACE Collaborative Group. J. Clin. Oncol. 26, 3552–3559 (2008). [DOI] [PubMed] [Google Scholar]
- 9.Allum WH, Stenning SP, Bancewicz J, Clark PI & Langley RE Long-term results of a randomized trial of surgery with or without preoperative chemotherapy in esophageal cancer. J. Clin. Oncol. 27, 5062–5067 (2009). [DOI] [PubMed] [Google Scholar]
- 10.Shapiro J et al. Neoadjuvant chemoradiotherapy plus surgery versus surgery alone for oesophageal or junctional cancer (CROSS): long-term results of a randomised controlled trial. Lancet Oncol. 16, 1090–1098 (2015). [DOI] [PubMed] [Google Scholar]
- 11.Kris MG et al. Adjuvant systemic therapy and adjuvant radiation therapy for stage I to IIIA completely resected non-small-cell lung cancers: American Society of Clinical Oncology/Cancer Care Ontario clinical practice guideline update. J. Clin. Oncol. 35, 2960–2974 (2017). [DOI] [PubMed] [Google Scholar]
- 12.Forde PM et al. Neoadjuvant PD-1 blockade in resectable lung cancer. N. Engl. J. Med. 378, 1976–1986 (2018). [DOI] [PMC free article] [PubMed] [Google Scholar]
- 13.Postmus P et al. Early and locally advanced non-small-cell lung cancer (NSCLC): ESMO Clinical Practice Guidelines for diagnosis, treatment and follow-up. Ann Oncol. 28, iv1–iv21 (2017). [DOI] [PubMed] [Google Scholar]
- 14.Topper MJ et al. Epigenetic therapy ties MYC depletion to reversing immune evasion and treating lung cancer. Cell 171, 1284–1300 (2017). [DOI] [PMC free article] [PubMed] [Google Scholar]
- 15.Liu Y & Cao X Characteristics and significance of the premetastatic niche. Cancer cell 30, 668–681 (2016). [DOI] [PubMed] [Google Scholar]
- 16.Kitamura T, Qian BZ & Pollard JW Immune cell promotion of metastasis. Nat Rev Immunol 15, 73–86 (2015). [DOI] [PMC free article] [PubMed] [Google Scholar]
- 17.Qin H et al. Generation of a new therapeutic peptide that depletes myeloid-derived suppressor cells in tumor-bearing mice. Nat. Med. 20, 676–681 (2014). [DOI] [PMC free article] [PubMed] [Google Scholar]
- 18.Juergens RA et al. Combination epigenetic therapy has efficacy in patients with refractory advanced non-small cell lung cancer. Cancer Discov. 1, 598–607 (2011). [DOI] [PMC free article] [PubMed] [Google Scholar]
- 19.Kim K et al. Eradication of metastatic mouse cancers resistant to immune checkpoint blockade by suppression of myeloid-derived cells. Proc. Natl Acad. Sci. USA 111, 11774–11779 (2014). [DOI] [PMC free article] [PubMed] [Google Scholar]
- 20.Youn J-I et al. Epigenetic silencing of retinoblastoma gene regulates pathologic differentiation of myeloid cells in cancer. Nat. Immunol. 14, 211–220 (2013). [DOI] [PMC free article] [PubMed] [Google Scholar]
- 21.Qian B-Z et al. CCL2 recruits inflammatory monocytes to facilitate breast-tumour metastasis. Nature 475, 222–225 (2011). [DOI] [PMC free article] [PubMed] [Google Scholar]
- 22.Sun SC The non-canonical NF-kappaB pathway in immunity and inflammation. Nat Rev Immunol 17, 545–558 (2017). [DOI] [PMC free article] [PubMed] [Google Scholar]
- 23.Highfill SL et al. Disruption of CXCR2-mediated MDSC tumor trafficking enhances anti-PD1 efficacy. Sci. Trans. Med. 6, 237ra267 (2014). [DOI] [PMC free article] [PubMed] [Google Scholar]
- 24.Di Mitri D et al. Tumour-infiltrating Gr-1+ myeloid cells antagonize senescence in cancer. Nature 515, 134–137 (2014). [DOI] [PubMed] [Google Scholar]
- 25.Saeed S et al. Epigenetic programming of monocyte-to-macrophage differentiation and trained innate immunity. Science 345, 1251086 (2014). [DOI] [PMC free article] [PubMed] [Google Scholar]
- 26.Auffray C, Sieweke MH & Geissmann F Blood monocytes: development, heterogeneity, and relationship with dendritic cells. Annu. Rev. Immunol. 27 669–692 (2009). [DOI] [PubMed] [Google Scholar]
- 27.Miller JC et al. Deciphering the transcriptional network of the dendritic cell lineage. Nat. Immunol. 13, 888–899 (2012). [DOI] [PMC free article] [PubMed] [Google Scholar]
- 28.Heng TS et al. The Immunological Genome Project: networks of gene expression in immune cells. Nat. Immunol. 9, 1091–1094 (2008). [DOI] [PubMed] [Google Scholar]
- 29.Misharin AV, Morales-Nebreda L, Mutlu GM, Budinger GS & Perlman H Flow cytometric analysis of macrophages and dendritic cell subsets in the mouse lung. Am. J. Respir. Cell Mol. Biol. 49, 503–510 (2013). [DOI] [PMC free article] [PubMed] [Google Scholar]
- 30.Phillips RJ, Lutz M & Premack B Differential signaling mechanisms regulate expression of CC chemokine receptor-2 during monocyte maturation. J. Inflamm. (Lond). 2, 14 (2005). [DOI] [PMC free article] [PubMed] [Google Scholar]
- 31.Day CP, Carter J, Bonomi C, Hollingshead M & Merlino G Preclinical therapeutic response of residual metastatic disease is distinct from its primary tumor of origin. Int. J. Cancer. 130, 190–199 (2012). [DOI] [PMC free article] [PubMed] [Google Scholar]
- 32.Yu J et al. Systematic study of target localization for bioluminescence tomography guided radiation therapy. Med. Phys. 43, 2619 (2016). [DOI] [PMC free article] [PubMed] [Google Scholar]
- 33.Dieckmann D, Plottner H, Berchtold S, Berger T & Schuler G Ex vivo isolation and characterization of CD4+ CD25+ T cells with regulatory properties from human blood. J. Exp. Med. 193, 1303–1310 (2001). [DOI] [PMC free article] [PubMed] [Google Scholar]
- 34.Subramanian A et al. Gene set enrichment analysis: a knowledge-based approach for interpreting genome-wide expression profiles. Proc. Natl Acad. Sci. USA 102, 15545–15550 (2005). [DOI] [PMC free article] [PubMed] [Google Scholar]
- 35.Huang DW, Sherman BT & Lempicki RA Bioinformatics enrichment tools: paths toward the comprehensive functional analysis of large gene lists. Nucleic Acids Res. 37, 1–13 (2009). [DOI] [PMC free article] [PubMed] [Google Scholar]
- 36.Huang da W, Sherman BT & Lempicki RA Systematic and integrative analysis of large gene lists using DAVID bioinformatics resources. Nat. Protoc. 4, 44–57 (2009). [DOI] [PubMed] [Google Scholar]
Associated Data
This section collects any data citations, data availability statements, or supplementary materials included in this article.
Supplementary Materials
Data Availability Statement
All data generated are included in the published Letter and in its Supplementary information. Gene-expression data that support the findings of this study have been deposited in the Gene Expression Omnibus under accession numbers GSE124539. All data are also available from the corresponding author on reasonable request.