



Abstract
Optical coherence tomography (OCT) is a non-invasive diagnostic method that offers real-time visualization of the layered architecture of the skin in vivo. The 1.7-micron OCT system has been applied in cardiology, gynecology and dermatology, demonstrating an improved penetration depth in contrast to conventional 1.3-micron OCT. To further extend the capability, we developed a 1.7-micron OCT/OCT angiography (OCTA) system that allows for visualization of both morphology and microvasculature in the deeper layers of the skin. Using this imaging system, we imaged human skin with different benign lesions and described the corresponding features of both structure and vasculature. The significantly improved imaging depth and additional functional information suggest that the 1.7-micron OCTA system has great potential to advance both dermatological clinical and research settings for characterization of benign and cancerous skin lesions.
Index Terms—: Optical coherence tomography, OCT angiography, Skin cancer, 1.7-micron, Dermatology, Clinical diagnosis
I. Introduction
Keratinocyte carcinomas skin cancer is the most commonly diagnosed malignancy in the United States with more than 9,500 new cases every day [1]. With early detection and prompt treatment, 99% of skin cancers are curable. In addition to visual examination, dermoscopy is routinely used to provide a magnified evaluation of skin lesions and improve diagnostic accuracy of benign and cancerous skin lesions [2]. However, only the morphology of superficial layers can be visualized, and the accuracy of diagnosis depends highly on the skills and clinical experience of the examiners. For more diagnostic certainty, a sample of the suspicious lesion is typically removed via biopsy for histopathological examination. This procedure is the gold standard for skin characterization, but it is inconveniently invasive and painful, and diagnostic results may not be known for days after the procedure.
In recent decades, many novel noninvasive biomedical imaging modalities, such as magnetic resonance imaging (MRI), ultrasonography, reflectance confocal microscopy (RCM), and optical coherence tomography (OCT) have been utilized in both clinical and research settings to aid in the diagnosis of skin cancer, permitting real-time visualization of internal structures and their functions (e.g. vascular network, flow rate, and elasticity) in the skin [3]–[7]. They also offer the advantage and convenient ability of performing repeated imaging of the same lesions without harmful adverse effects, enabling the observation of dynamic and long-term changes over time. Each imaging modality has its own features and unique trade-offs between spatial resolution, level of contrast, imaging depth, acquisition time, and field of view.
MRI has a large penetration depth and a wide field of view but a low spatial resolution (∼100 µm) and long imaging time as well as considerable associated expense, justifying its utility in detecting only advanced metastasis of skin cancers. High-frequency ultrasonography has a resolution of 30–120 µm and an imaging depth of 4–30 mm. It allows for real-time visualization of both morphological and physiological aspects of the skin and plays an important role in clinical studies, but its diagnostic accuracy and capacity to delineate tumor margins are compromised by its low contrast and spatial resolution [8]–[10]. RCM captures nuclear and cellular morphology of the skin with an axial resolution of ∼3–5 µm, which has been demonstrated to be effective in increasing the diagnostic accuracy as well as reducing the number of unnecessary biopsies. However, only the most superficial parts of the lesion can be evaluated due to its limited depth of penetration (∼150–200 µm) [11].
OCT uses low-coherence light to capture two- and three-dimensional (3D), structural images down to skin depths of ∼1– 2 mm with a spatial resolution of 3 to 15 µm, which can supplement current imaging methods. Furthermore, OCT angiography (OCTA), as a functional augmentation of OCT, allows for the visualization of cutaneous microvasculature via the detection of fluctuations in amplitude and/or phase of sequential OCT signal with high resolution and sensitivity [12]–[14]. This offers an extension to the structural rendering of the skin, providing additional information for accurate cancer diagnosis (e.g. vascular density and blood flow rate), as vascular formation and angiogenesis are key indicators of tumor development and progression [12], [13], [15]–[20]. In addition, the recent advances in spatial resolution, imaging speed, and probe design make OCT/OCTA an attractive clinical tool for skin cancer diagnostics, margin delineation, and therapy monitoring [21]–[26]. Most commercial skin imaging OCT devices, such as Vivosight®, Callisto®, and NITID®, use a light source with a wavelength centered at 1.3 µm for image acquisition, which offers the advantages of low water absorption and strong penetration capability. Studies on various skin diseases using OCT devices revealed an increased diagnostic accuracy when dermatologists apply OCT as a supplement in routine clinical work [27]–[30].
To further optimize the performance of OCT devices, several studies have reported that OCT devices with a light source centered at 1.7 µm demonstrsted improved penetration depth by up to ∼25% through ex-vivo or in-vivo tests [31]–[33]. The imaging depth of OCTA, which is based on OCT, is therefore also enhanced, allowing for mapping of vasculature in deeper layers of biological tissue. In our study, we developed a 1.7-micron OCT and OCTA system and extended its capability to characterize skin lesions by visualizing both morphology and vasculature in deeper layers of the skin. We imaged different types of non-cancerous human skin lesions in vivo as a preliminary evaluation of this technology for cutaneous imaging and describe the features of OCT and OCTA images.
II. Methods
A. System Setup
The schematic diagram of the developed OCT and OCTA system is presented in Figure 1. The system is powered by a 1.7 µm-centered wavelength swept-source laser. The output light from the laser source is split by a 90:10 optical fiber coupler where 90% of the light is propagated to the sample arm (handheld probe) and the remaining 10% to the reference arm, which consists of a collimator, lens, and mirror. The backscattered light from the sample and the back-reflected reference beam generates the interference signal in the 50:50 optical fiber coupler which is then delivered to the balanced photodetector. In the handheld probe, a dual-axis galvanometer and a scan lens were applied for 3D OCT imaging. To make sure the imaging target is placed within the depth of focus, a threaded adapter was connected to the probe where the distance between the target and the probe can be easily adjusted with rotation of the adapter. The output power from the laser source and handheld probe are ∼18 mW and ∼10 mW, respectively. The axial and lateral resolution of the system are ∼22 µm and ∼40 µm.
Fig. 1.
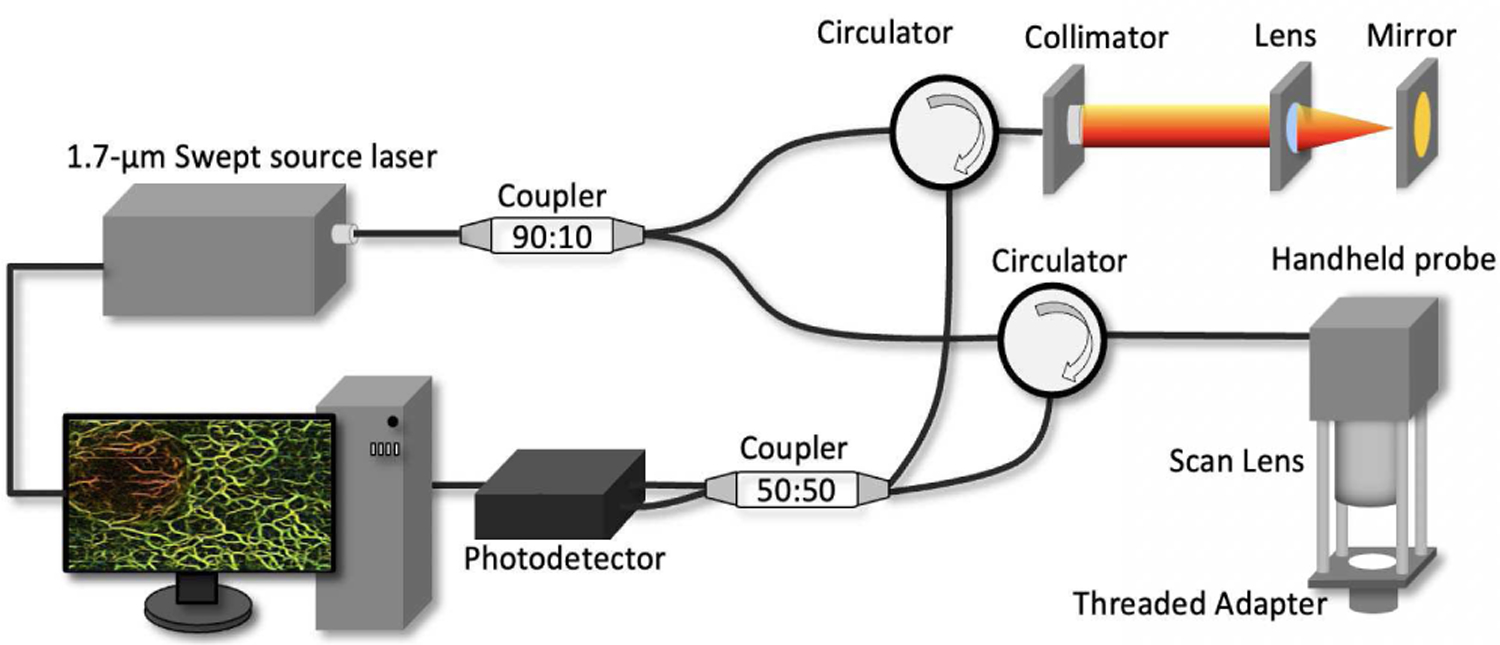
Schematic of the 1.7-micron OCTA system.
B. Scanning Protocol
OCTA requires multiple images in sequence at the same position to reveal the portion with fluctuations. Here, an inter-frame scanning protocol is applied in which consequent 6 cross-sectional B-scans (M = 6) are acquired at the same position and compared to extract vascular information, shown in Figure 2. This inter-frame protocol has a longer time interval ∆T of ∼5.6 ms as it utilizes the slow scan (Galvo Y) of the imaging apparatus which is able to provide high sensitivity for microvasculature. An intensity-based Doppler variance algorithm [16] is utilized to capture the fluctuation caused by blood flow to form Doppler OCT images. Doppler OCT images are re-sliced along depth direction to obtain en face OCTA at different depths. A 2D filter [Figure S1 in Supplementary material] was applied to remove the artifact from bulk motion. Then the OCTA was processed by Hessian based Frangi Vesselness filter [34] to enhance blood vessel networks. The entire imaging area was 5 mm × 5 mm. The step size in X/Y direction are 10 µm.
Fig. 2.
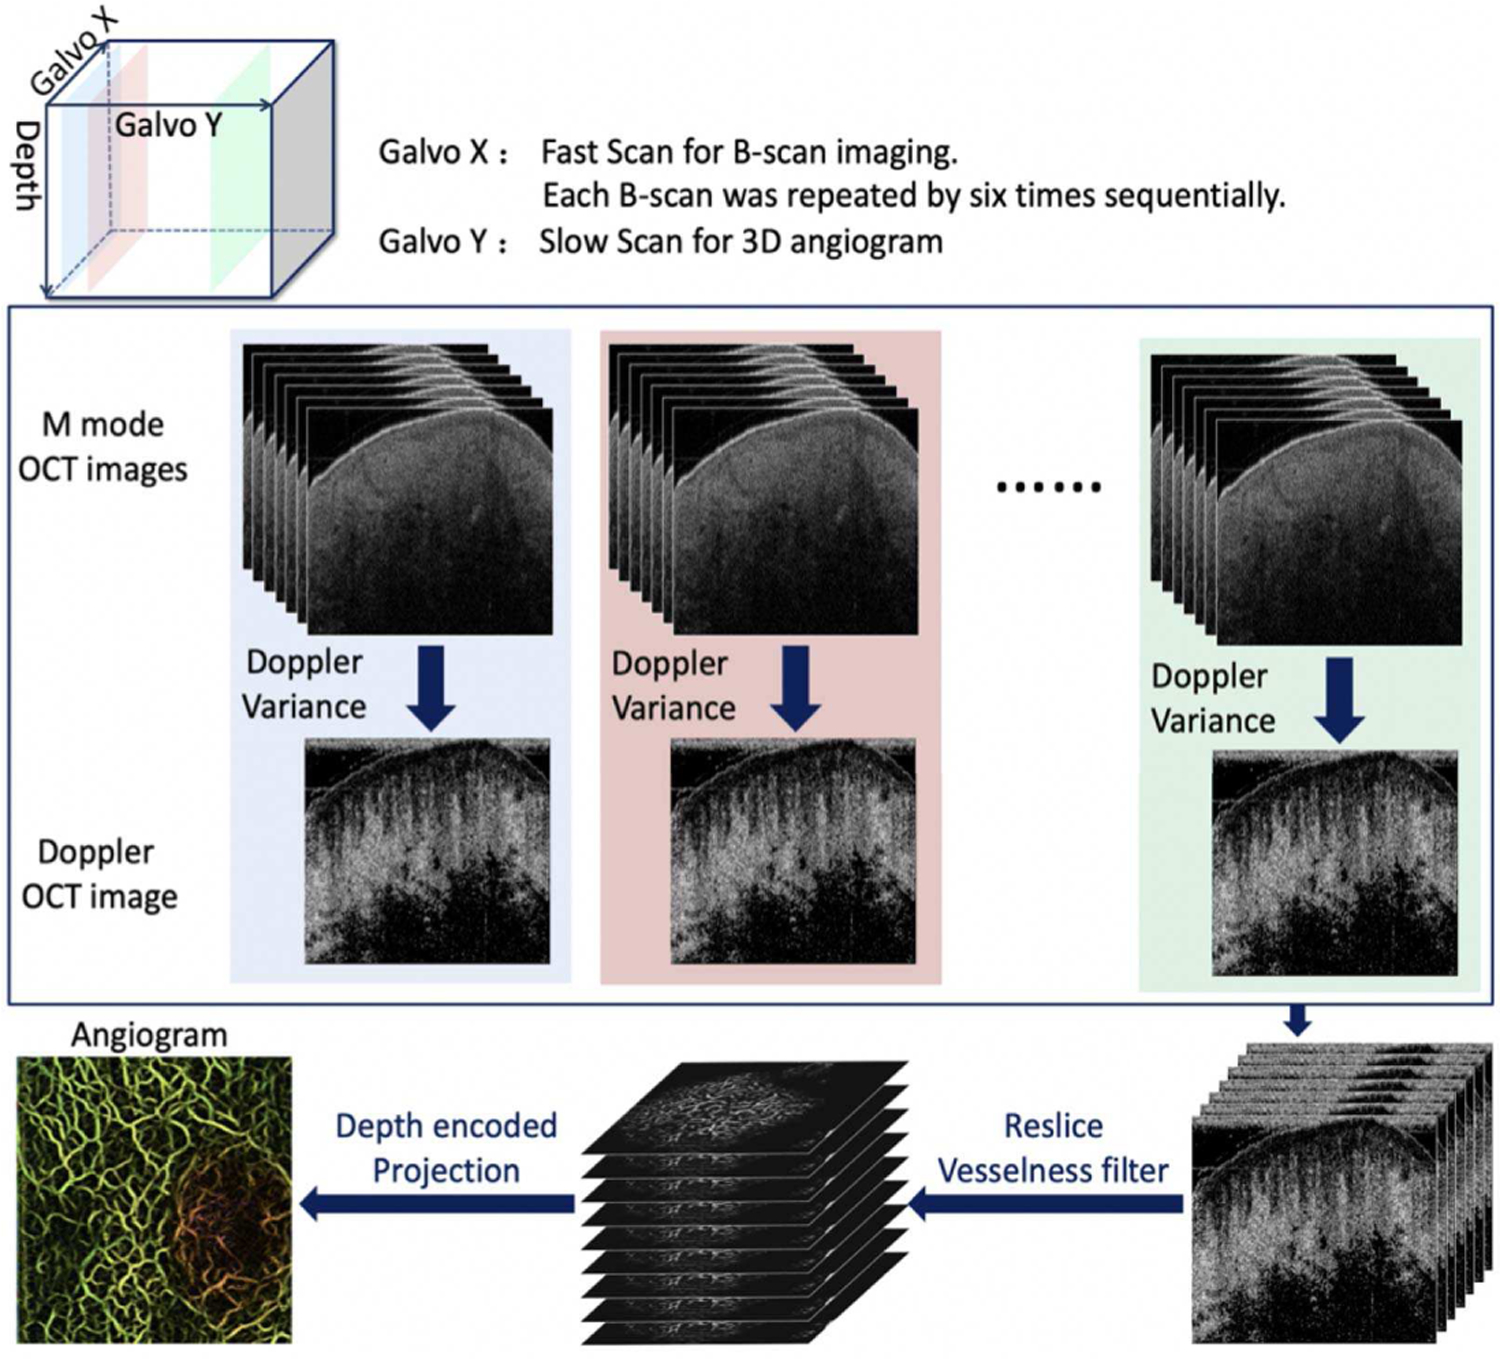
Scanning protocol.
C. In Vivo Human Experiment
This was a prospective pilot study to evaluate non-cancerous skin lesions in-vivo using 1.7-micron OCT/OCTA technology. The protocol was approved by the Institutional Review Board and patients were recruited from the Department of Dermatology at the University of California, Irvine (UCI). The handheld probe was cleaned before imaging. Patients with various types of skin lesions were diagnosed by a dermatologist based on OCT image, OCT angiogram, and direct visualization. A single operator performed all imaging to minimize operator variability. Single image acquisition took 30 seconds to complete. Scanning of approximately six volunteers was planned. For the subjects with lesions, the imaging area included lesional and adjacent normal tissue, which were separated by a white dashed line.
III. Results
Six subjects were recruited, including one healthy volunteer and five patients with various skin lesions. 3D and cross-sectional OCT images that allow for the visualization of both overall and detailed morphologies were obtained. In addition, the Doppler variance algorithm was applied to reconstruct the vasculature of the skin. To quantify morphology and vasculature, the thickness of the epidermis and the density of the vasculature were calculated.
A. Healthy Human Palm
Figures 3 (a)–(c) show representative 3D OCT images, 2D depth color encoded vasculature, and a 3D rendering of co-registered OCT and angiography (X-Y plane), respectively for healthy skin of the palm. Figures 3(d)–(k) are the cross-sectional OCT images (Y-Z plane) at different longitudinal positions along X axis. Dermal-epidermal junction (DEJ) of the skin which is determined by both OCT and Doppler OCT images is labeled by a dashed green line in Figure 3(d). Homogeneous vascular patterns and well-defined layer architecture can be visualized from the angiogram and OCT images. Healthy skin is supplied with a rich vascular network. The vessel density in this case is ∼54%, and the average epidermal thickness is ∼200 µm.
Fig. 3.
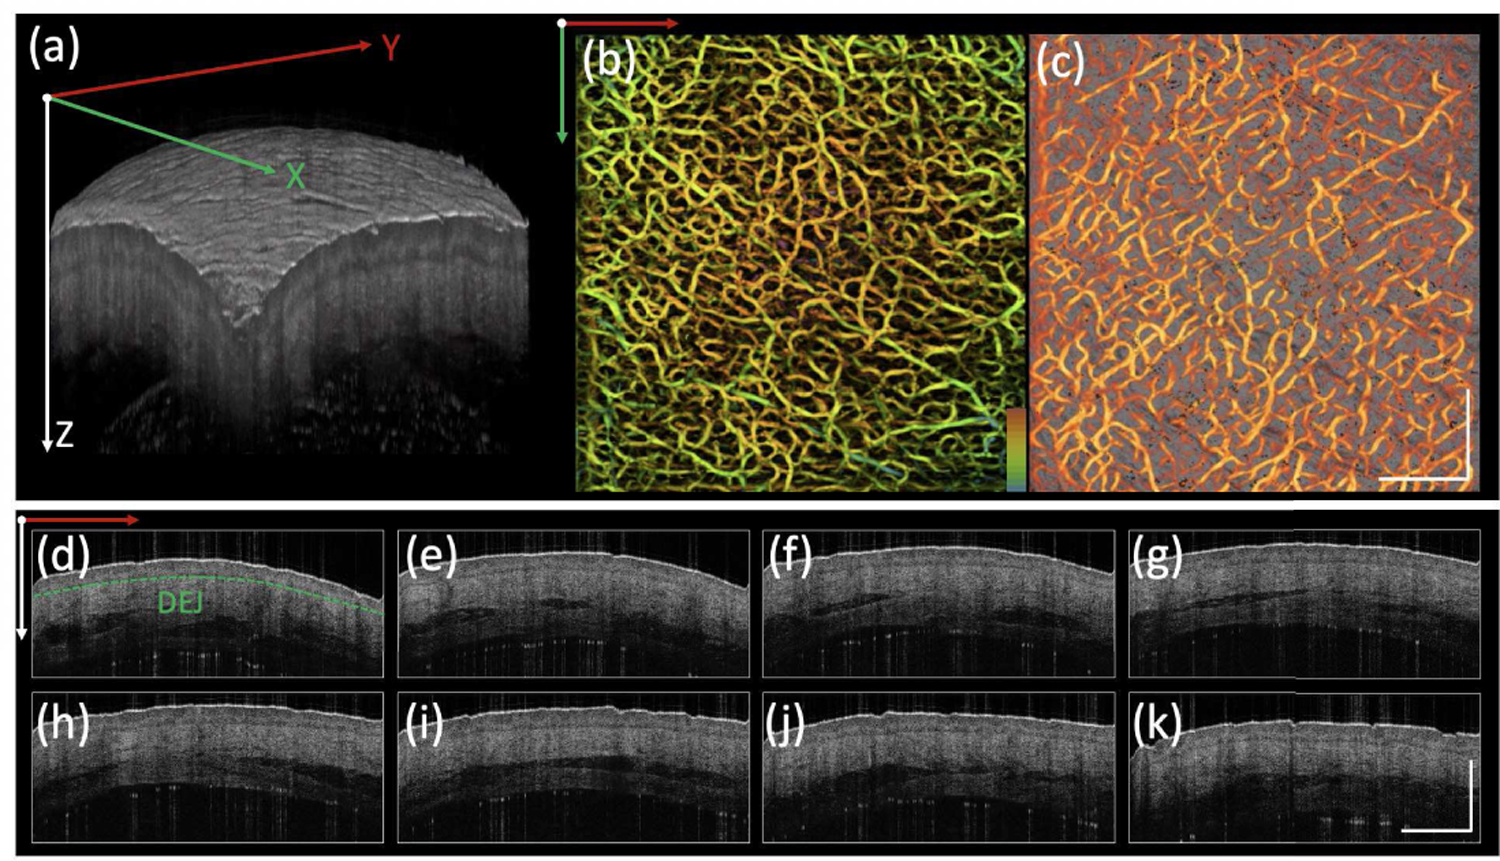
Healthy human palm. (a) 3D OCT image. (b) Depth encoded angiogram where red to green represents shallow to deep depths. (c) Co-registered OCT image and angiogram projection on Y-X plane. (d)-(k) Cross-sectional OCT images on Y-Z plane from different positions along X direction. DEJ: dermal-epidermal junction, indicated by green dashed line. Scale bar: 1mm.
B. Solar Lentigo
OCT and Doppler angiography of a solar lentigo on the back of a hand are shown in Figure 4. The DEJ can be clearly defined, indicated by the green dashed line in Figure 4 (d). The thickness of epidermis is ∼80 µm. Figures 4 (b) and (c) show 2D depth-encoded angiography and a co-registered rendering of OCT image and angiography where a homogenous vascular pattern with a density of ∼52% was identified.
Fig. 4.
Solar lentigo. (a) 3D OCT image. (b) Depth encoded angiogram where red to green represents shallow to deep depths. (c) Co-registered OCT image and angiogram projection on Y-X plane. (d)-(k) Cross-sectional OCT images on Y-Z plane from different positions along X direction. DEJ: dermal-epidermal junction, indicated by green dashed line. Scale bar: 1mm.
C. Seborrheic Keratosis
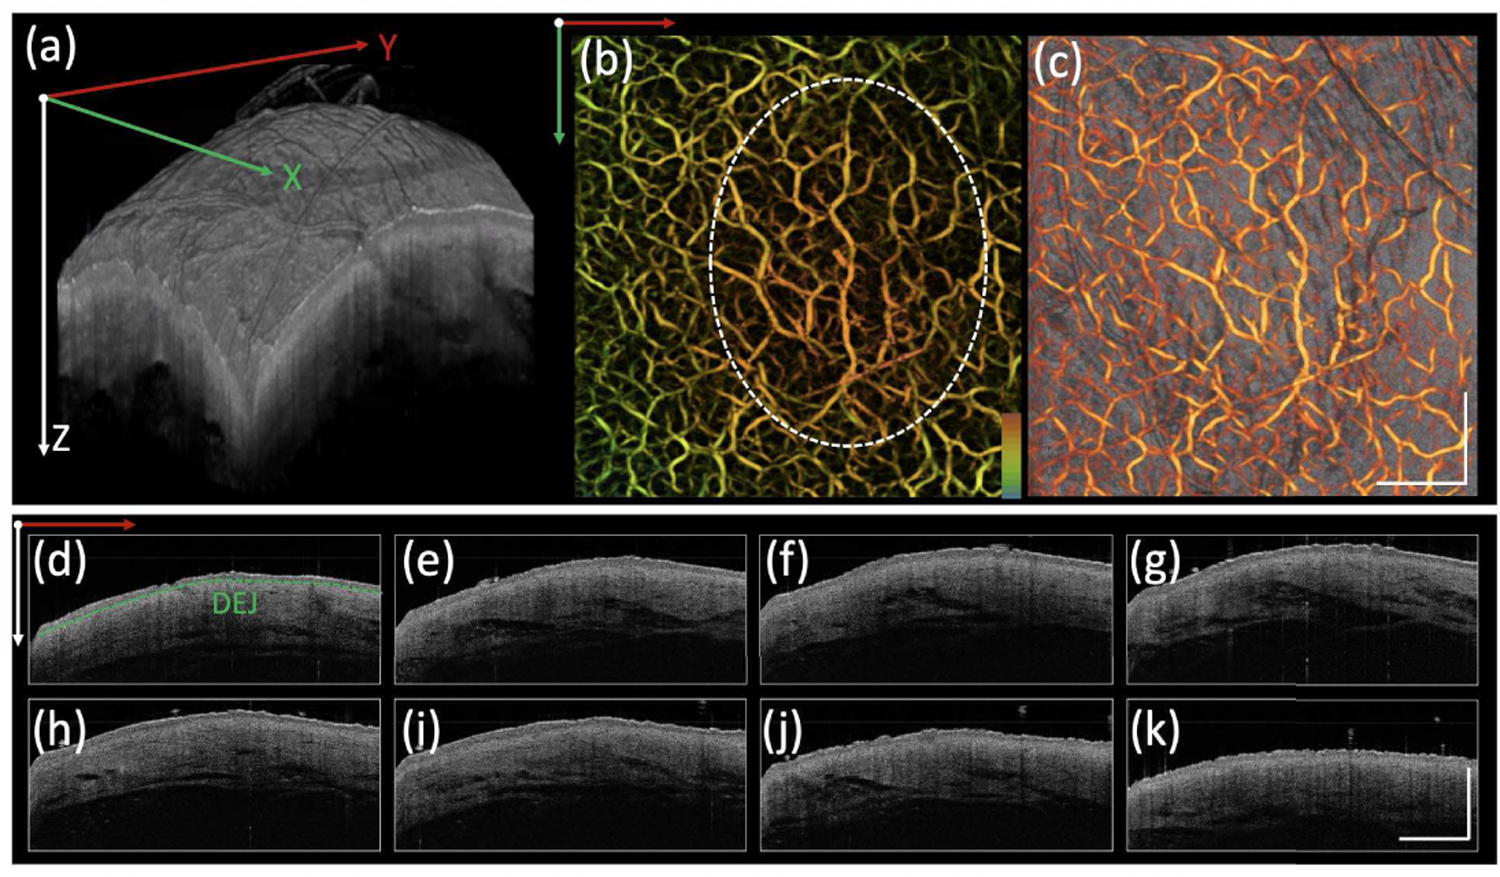
OCT and angiography of a seborrheic keratosis (SK) on the back of a hand are presented in Figure 5. The lesion [on the right of the dashed white line in Figure (5b)] has a rough, verrucous surface, which can be appreciated in the 3D rendering in Figure 5(a). OCT cross-sections exhibit decreased and nonhomogeneous signal intensity. The lesional epidermis (thickness: ∼197 µm) is thicker than that of normal skin on the back of the hand. According to the angiogram [Figure 5(b) and 5(c)], the vascular densities of the two skin profiles, the SK itself (right) and surrounding skin (left), [separated by white dashed line in Figure 5(b)], are ∼51% and ∼58%.
Fig. 5.
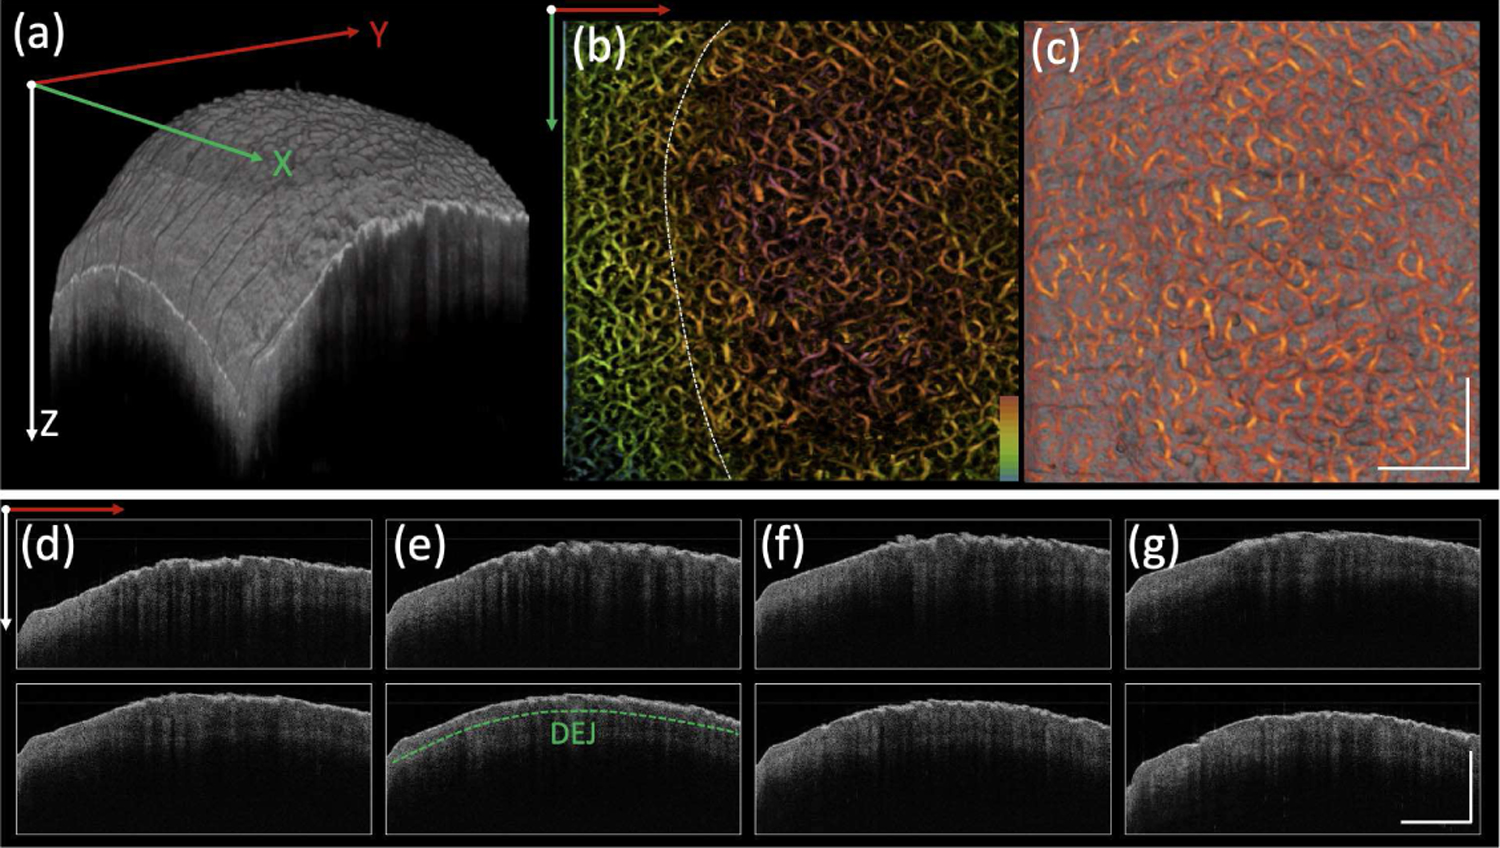
Seborrheic keratosis. (a) 3D OCT image. (b) Depth encoded angiogram where red to green represents shallow to deep depths. (c) Co-registered OCT image and angiogram projection on Y-X plane. (d)-(k) Cross-sectional OCT images on Y-Z plane from different positions along X direction. DEJ: dermal-epidermal junction, indicated by green dashed line. Scale bar: 1mm.
D. Cherry Angioma
A cherry angioma was scanned with OCT and is presented in Figure 6. In the 3D OCT rendering [Figure 6 (a)], a protruding lesion can be clearly identified. From the corresponding angiogram, it exhibits a clustered vascular pattern with a density of ∼63%, which is much higher than that of adjacent tissue (density: ∼53%). The DEJ is labeled in Figures 6 (d) and (h). The epidermis thickness of the angioma is ∼43 µm, which is thinner than that of adjacent tissue (epidermis thickness: ∼56 µm). In addition, another feature of the angioma is decreased OCT intensity in contrast to that of adjacent tissue.
Fig. 6.
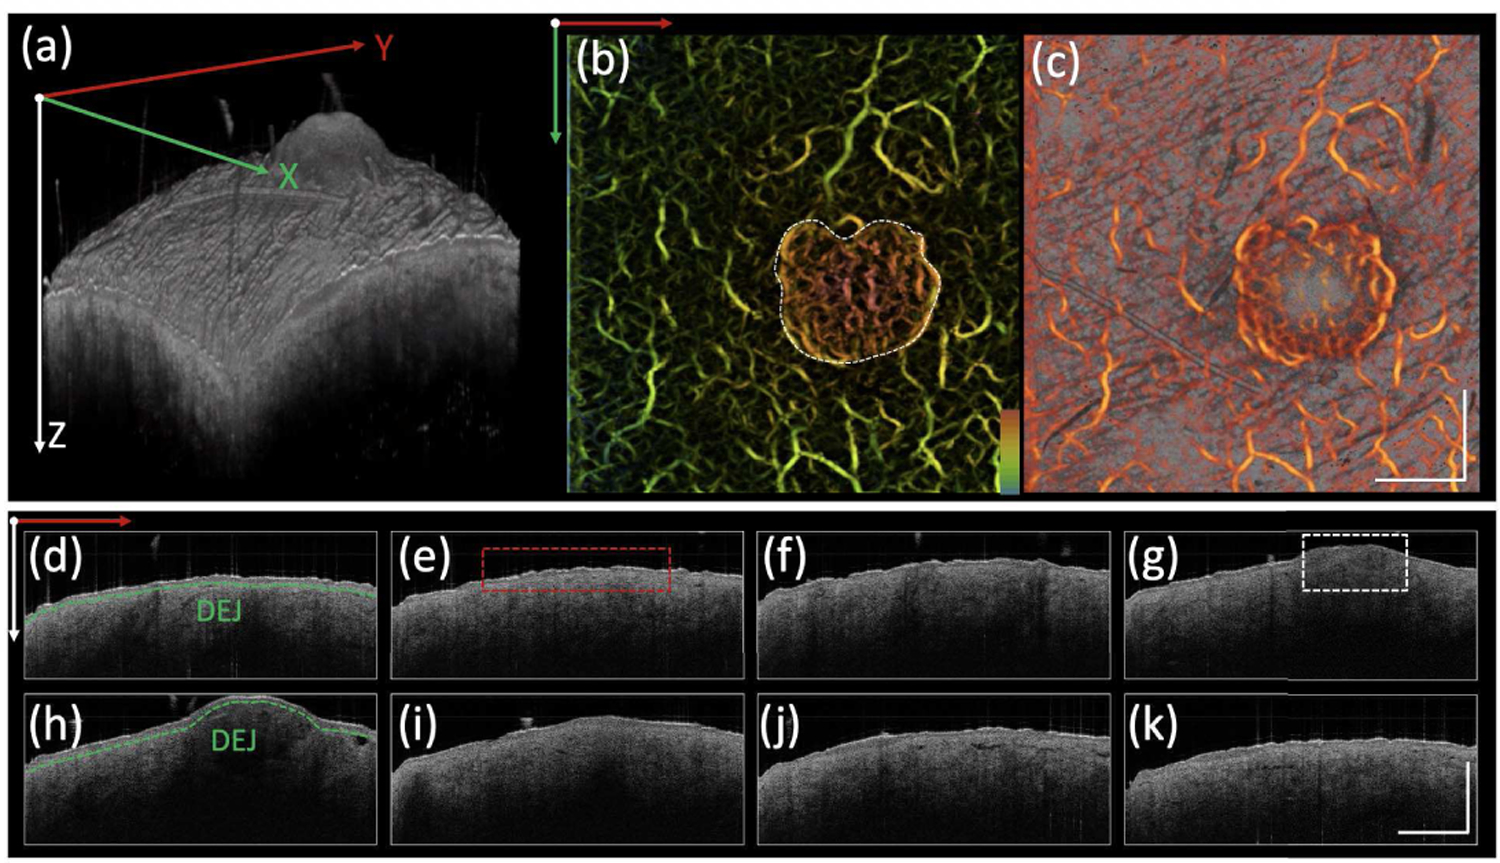
Cherry angioma. (a) 3D OCT image. (b) Depth encoded angiogram where red to green represents shallow to deep depths. (c) Co-registered OCT image and angiogram projection on Y-X plane. (d)-(k) Cross-sectional OCT images on Y-Z plane from different positions along X direction. DEJ: dermal-epidermal junction, indicated by green dashed line. White dashed box: angioma. Red dashed box: normal tissue. Scale bar: 1mm.
E. Dermal Nevus
OCT images and angiography of a dermal nevus which is a pigmented skin lesion on the back are shown in Figure 7. Similar to the gross superficial structure of an angioma, a protruding lesion is identified in the 3D OCT image [Figure 7 (a)]. Regarding the angiogram, the vessel density (∼50%) of the lesion is similar to that of the adjacent skin (density: ∼53%). The slightly decreased density may be due to the absorption of light by melanin. In the cross-sectional OCT images, the DEJ is labeled in Figures 7 (d) and (e). The epidermal thickness of this dermal nevus is found to be ∼123 µm, which is higher than that of adjacent skin (∼76 µm). In addition, another feature of a dermal nevus is slightly decreased OCT intensity from the tissue under the DEJ in contrast to that of adjacent tissue.
Fig. 7.
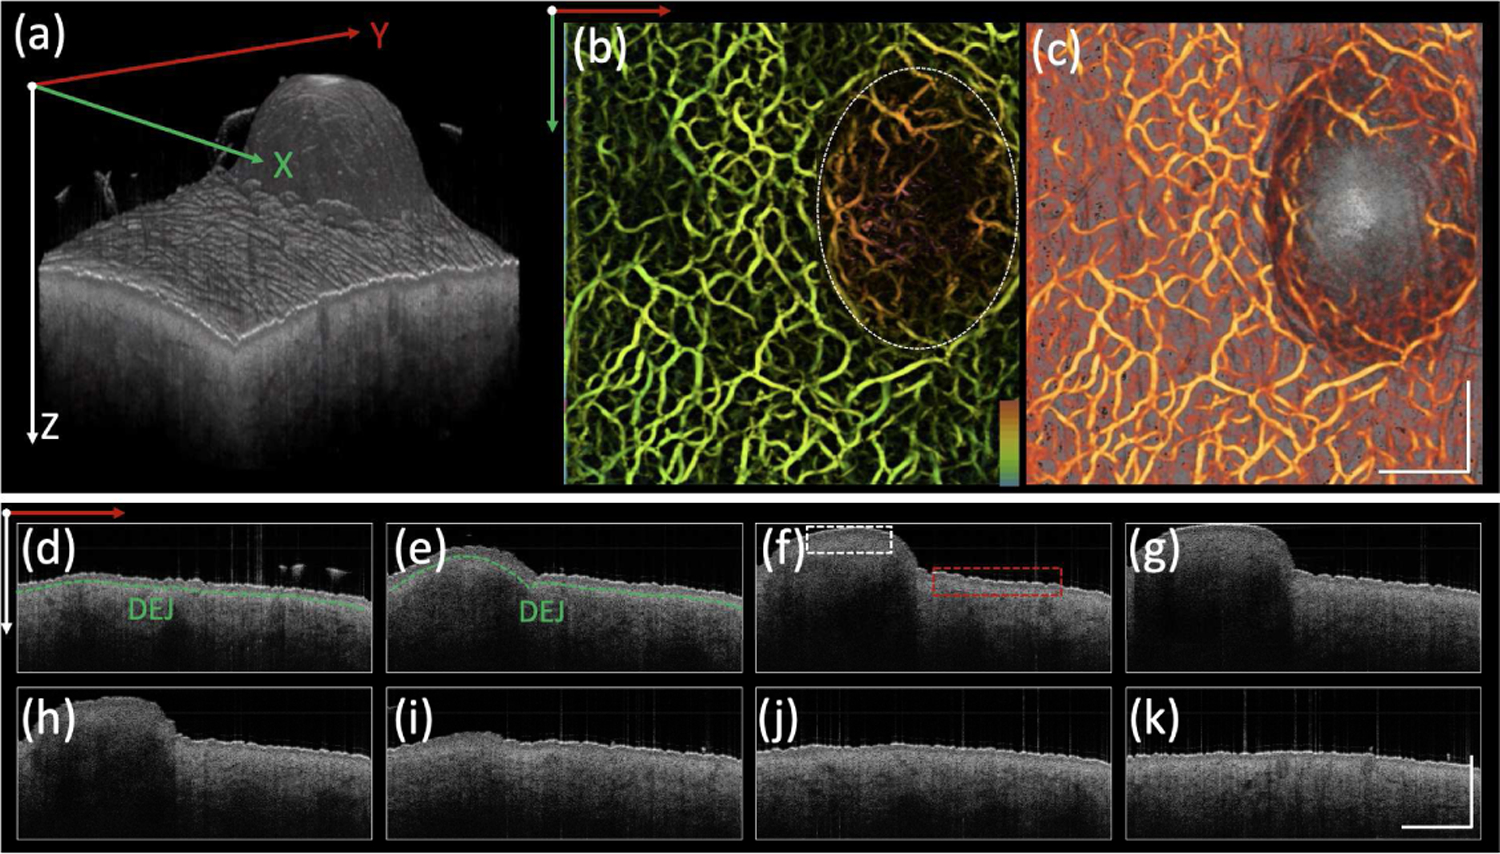
Dermal nevus. (a) 3D OCT image. (b) Depth encoded angiogram where red to green represents shallow to deep depths. (c) Co-registered OCT image and angiogram projection on Y-X plane. (d)-(k) Cross-sectional OCT images on Y-Z plane from different positions along X direction. DEJ: dermal-epidermal junction, indicated by green dashed line. Scale bar: 1mm. White dashed box: dermal nevus. Red dashed box: normal skin.
F. Actinic Keratosis
Results of OCT scans of an actinic keratosis on the back of the hand are shown in Figure 8. In the 3D rendering [Figure 8(a)], two protruding lesions can be clearly visualized, which exhibit decreased vessel density (43%) compared to that of adjacent tissue (56%), shown in Figures 8 (b) and (c). The overall angiography of the lesion exhibited a dense, tortuous, reticular vascular network. In the cross-sectional OCT images, the DEJ is indicated by a green dashed line in Figure 8 (j), which is more irregularly shaped when compared to that of previous cases with varied epidermal thicknesses in a wide range from 91 to 225 µm.
Fig. 8.
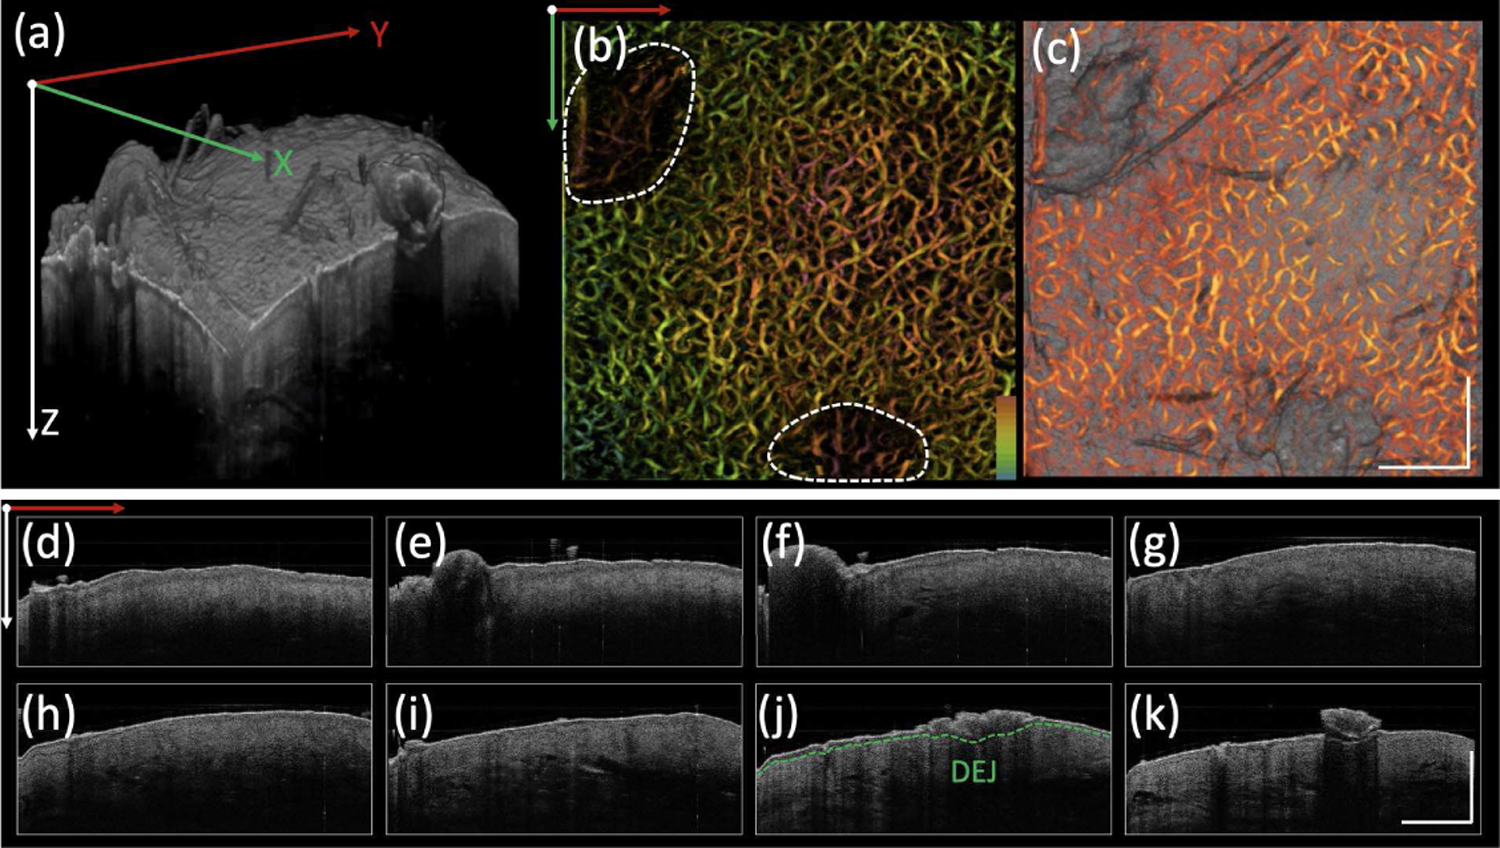
Actinic keratosis. (a) 3D OCT image. (b) Depth encoded angiogram where red to green represents shallow to deep depths. (c) Co-registered OCT image and angiogram projection on Y-X plane. (d)-(k) Cross-sectional OCT images on Y-Z plane from different positions along X direction. DEJ: dermal-epidermal junction, indicated by green dashed line. Scale bar: 1mm.
Table I shows quantitative analysis of OCTA from six subjects, including vascular density, tortuosity, fractal dimension, and average diameter. Details of the imaging processing procedure and key equations for calculations are presented in the supplementary material.
TABLE I.
Quantitative Analysis of OCTA. 1: Healthy Human Palm. 2: Solar Lentigo. 3: Seborrheic Keratosis. 4: Cherry Angioma. 5: Dermal Nevus. 6: Actinic Keratosis
| Subject | Density | Fractal dimension | Tortuosity | Averaged Diameters (μm) | ||||
|---|---|---|---|---|---|---|---|---|
| Lesion | Control | Lesion | Control | Lesion | Control | Lesion | Control | |
| 1 | ╲ | 54% | ╲ | 1.94 | ╲ | 1.11 | ╲ | 75.7±8.1 |
| 2 | 52% | 52% | 1.94 | 1.94 | 1.12 | 1.12 | 67.0±10.6 | 67±10.6 |
| 3 | 51% | 58% | 1.88 | 1.83 | 1.14 | 1.12 | 63.0±8.4 | 57.5±9.1 |
| 4 | 63% | 53% | 1.86 | 1.91 | 1.12 | 1.13 | 61.1±10.7 | 67.2±6.7 |
| 5 | 50% | 53% | 1.85 | 1.86 | 1.14 | 1.11 | 60.8±8.1 | 70.7±13.5 |
| 6 | 43% | 56% | 1.82 | 1.88 | 1.16 | 1.12 | 63.3±6.4 | 65.4±6.8 |
IV. Conclusion
OCTA, as a functional extension of OCT, provides the ability to visualize vascular morphology down to a skin depth of ∼1–2 mm with spatial resolution on the level of micrometers. Recent studies have demonstrated the utility of 1.3 µm OCT/OCTA in dermatology and its increased diagnostic accuracy [27]. In this paper, we demonstrated the first applications of 1.7-micron OCT/OCTA for diagnosis of different skin lesions in vivo.
We tested the system in vivo on six subjects with different skin conditions, including healthy skin, solar lentigo, seborrheic keratosis, cherry angioma, dermal nevus, and actinic keratosis. Each case was described in terms of structure and vascular morphology of the skin as interpreted via OCT/OCTA. 1.7-micron OCT/OCTA can provide more comprehensive information as a supplement to dermoscopy. While the proposed 1.7-micron OCT/OCTA system is a promising in vivo imaging method for characterization of skin cancer, a few challenges still need to be addressed in order to successfully translate this technology for clinical applications.
Six subjects were involved in our feasibility study. While different features were presented in each case, objective quantitative analysis was lacking. To establish diagnostic criteria (typical features in skin architecture and vascular morphology), more subjects with different conditions need to be studied and analyzed statistically. Furthermore, the influence from both intrinsic and extrinsic factors, such as different body locations and age, on the thickness of the epidermis as well as the density and morphology of blood vessels likely introduces more variability. To further improve accuracy, normal adjacent tissue should be imaged for each patient as a control, and the epidermal thickness and vessel morphology could be used as a comparison to lesional or diseased tissue.
In our study, the epidermal thickness and vessel morphology were described for the characterization of various skin lesions. To further improve the accuracy, more parameters should be investigated to quantify the changes in structure, vascular morphology, and chemical composition based on OCT and OCTA images. For example, the measurement of reflectivity and attenuation coefficient could provide a quantitative analysis of the skin’s physical alterations [35]. To provide comprehensive characterization, optical coherence elastography could be incorporated to map the biomechanical property of tissue [36]–[38].
In summary, we have reported on a 1.7-micron OCT/OCTA system for characterization of common skin lesions. The feasibility and performance of our system were tested and validated in vivo in human subjects. The proposed system has the capability of providing more structural and vascular information at increased skin depths than previous OCT systems, and we believe it has great potential to bring new insights in diagnosis as well as better management of skin cancer.
Supplementary Material
Acknowledgments
This work was supported by grant from the National Institutes of Health (R01EY-026091, R01EY-028662, R01EB-030024 R01HL-125084, R01HL-127271), and the American Heart Association (20POST35200050).
Contributor Information
Yan Li, Department of Biomedical Engineering and the Beckman Laser Institute, University of California, Irvine, CA 92697 USA.
Raksha Sreeramachandra Murthy, Department of Biomedical Engineering and the Beckman Laser Institute, University of California, Irvine, CA 92697 USA.
Yirui Zhu, Department of Biomedical Engineering and the Beckman Laser Institute, University of California, Irvine, CA 92697 USA.
Fengyi Zhang, Department of Biomedical Engineering and the Beckman Laser Institute, University of California, Irvine, CA 92697 USA.
Jianing Tang, Department of Biomedical Engineering and the Beckman Laser Institute, University of California, Irvine, CA 92697 USA.
Joseph N. Mehrabi, Department of Dermatology, University of California, Irvine, CA 92697 USA
Kristen M. Kelly, Department of Dermatology, University of California, Irvine, CA 92697 USA
Zhongping Chen, Department of Biomedical Engineering and the Beckman Laser Institute, University of California, Irvine, CA 92697 USA.
References
- [1].Rogers HW, Weinstock MA, Feldman SR, Coldiron BM, Incidence Estimate of Nonmelanoma Skin Cancer (Keratinocyte Carcinomas) in the U.S. Population, 2012, JAMA Dermatol 151(10) (2015) 1081–6. [DOI] [PubMed] [Google Scholar]
- [2].Kato J, Horimoto K, Sato S, Minowa T, Uhara H, Dermoscopy of Melanoma and Non-melanoma Skin Cancers, Front Med (Lausanne) 6 (2019) 180. [DOI] [PMC free article] [PubMed] [Google Scholar]
- [3].Altman AM, Bankson J, Matthias N, Vykoukal JV, Song YH, Alt EU, Magnetic resonance imaging as a novel method of characterization of cutaneous photoaging in a murine model, Arch Dermatol Res 300(5) (2008) 263–7. [DOI] [PubMed] [Google Scholar]
- [4].Rohrbach DJ, Muffoletto D, Huihui J, Saager R, Keymel K, Paquette A, Morgan J, Zeitouni N, Sunar U, Preoperative mapping of nonmelanoma skin cancer using spatial frequency domain and ultrasound imaging, Acad Radiol 21(2) (2014) 263–70. [DOI] [PMC free article] [PubMed] [Google Scholar]
- [5].Borsari S, Pampena R, Lallas A, Kyrgidis A, Moscarella E, Benati E, Raucci M, Pellacani G, Zalaudek I, Argenziano G, Longo C, Clinical Indications for Use of Reflectance Confocal Microscopy for Skin Cancer Diagnosis, JAMA Dermatol 152(10) (2016) 1093–1098. [DOI] [PubMed] [Google Scholar]
- [6].Zhang L, Li M, Liu Y, Zhou Q, Combining optical coherence tomography with magnetic resonance angiography and Doppler ultrasonography for clinical detection of scleroderma, Anat Rec (Hoboken) (2019). [DOI] [PubMed]
- [7].Oh BH, Kim KH, Chung KY, Skin Imaging Using Ultrasound Imaging, Optical Coherence Tomography, Confocal Microscopy, and Two-Photon Microscopy in Cutaneous Oncology, Front Med (Lausanne) 6 (2019) 274. [DOI] [PMC free article] [PubMed] [Google Scholar]
- [8].Ulrich M, Stockfleth E, Roewert-Huber J, Astner S, Noninvasive diagnostic tools for nonmelanoma skin cancer, Br J Dermatol 157 Suppl 2 (2007) 56–8. [DOI] [PubMed] [Google Scholar]
- [9].Marghoob AA, Swindle LD, Moricz CZ, Sanchez Negron FA, Slue B, Halpern AC, Kopf AW, Instruments and new technologies for the in vivo diagnosis of melanoma, J Am Acad Dermatol 49(5) (2003) 777–97; quiz 798–9. [DOI] [PubMed] [Google Scholar]
- [10].Halani S, Foster FS, Breslavets M, Shear NH, Ultrasound and Infrared-Based Imaging Modalities for Diagnosis and Management of Cutaneous Diseases, Front Med (Lausanne) 5 (2018) 115. [DOI] [PMC free article] [PubMed] [Google Scholar]
- [11].Levine A, Markowitz O, Introduction to reflectance confocal microscopy and its use in clinical practice, JAAD Case Rep 4(10) (2018) 1014–1023. [DOI] [PMC free article] [PubMed] [Google Scholar]
- [12].Liu G, Chen Z, Advances in Doppler OCT, Chinese Optics Letters 11(1) (2013). [DOI] [PMC free article] [PubMed] [Google Scholar]
- [13].Zhu J, He X, Chen Z, Current challenges and solutions of Doppler optical coherence tomography and angiography for neuroimaging, Apl Photonics 3(12) (2018). [Google Scholar]
- [14].Zhao Y, Brecke K, Ren H, Ding Z, Nelson J, Chen Z, Three-dimensional reconstruction of in vivo blood vessels in human skin using phase-resolved optical Doppler tomography, Ieee Journal of Selected Topics in Quantum Electronics 7(6) (2001) 931–935. [Google Scholar]
- [15].Zhao Y, Chen Z, Saxer C, Xiang S, de Boer JF, Nelson JS, Phase-resolved optical coherence tomography and optical Doppler tomography for imaging blood flow in human skin with fast scanning speed and high velocity sensitivity, Opt Lett 25(2) (2000) 114–6. [DOI] [PubMed] [Google Scholar]
- [16].Liu G, Chou L, Jia W, Qi W, Choi B, Chen Z, Intensity-based modified Doppler variance algorithm: application to phase instable and phase stable optical coherence tomography systems, Opt Express 19(12) (2011) 11429–40. [DOI] [PMC free article] [PubMed] [Google Scholar]
- [17].Wang Y, Huang D, Su Y, Yao XS, Two-dimensional phase unwrapping in Doppler Fourier domain optical coherence tomography, Opt Express 24(23) (2016) 26129–26145. [DOI] [PubMed] [Google Scholar]
- [18].Chen Z, Milner TE, Srinivas S, Wang X, Malekafzali A, van Gemert MJ, Nelson JS, Noninvasive imaging of in vivo blood flow velocity using optical Doppler tomography, Opt Lett 22(14) (1997) 1119–21. [DOI] [PubMed] [Google Scholar]
- [19].Lupu M, Caruntu C, Popa MI, Voiculescu VM, Zurac S, Boda D, Vascular patterns in basal cell carcinoma: Dermoscopic, confocal and histopathological perspectives, Oncol Lett 17(5) (2019) 4112–4125. [DOI] [PMC free article] [PubMed] [Google Scholar]
- [20].Li Y, Chen J, Chen Z, Advances in Doppler Optical Coherence Tomography and Angiography, Translational Biophotonics e201900005 (2019). [DOI] [PMC free article] [PubMed]
- [21].Jerjes W, Hamdoon Z, Al-Rawi N, Hopper C, Optical coherence tomography in the assessment of cutaneous cancer margins of the face: An immediate ex vivo study, Photodiagnosis Photodyn Ther 29 (2020) 101616. [DOI] [PubMed] [Google Scholar]
- [22].Jerjes W, Hamdoon Z, Al Rawi N, Hopper C, OCT in the diagnosis of head and neck pre-cancerous and cancerous cutaneous lesions: An immediate ex vivo study, Photodiagnosis Photodyn Ther 27 (2019) 481–486. [DOI] [PubMed] [Google Scholar]
- [23].Ruini C, Hartmann D, Bastian M, Ruzicka T, French LE, Berking C, von Braunmühl T, Non-invasive monitoring of subclinical and clinical actinic keratosis of face and scalp under topical treatment with ingenol mebutate gel 150 mcg/g by means of reflectance confocal microscopy and optical coherence tomography: New perspectives and comparison of diagnostic techniques, J Biophotonics 12(7) (2019) e201800391. [DOI] [PubMed] [Google Scholar]
- [24].Themstrup L, De Carvalho N, Nielsen SM, Olsen J, Ciardo S, Schuh S, Nørnberg BM, Welzel J, Ulrich M, Pellacani G, Jemec GBE, In vivo differentiation of common basal cell carcinoma subtypes by microvascular and structural imaging using dynamic optical coherence tomography, Exp Dermatol 27(2) (2018) 156–165. [DOI] [PubMed] [Google Scholar]
- [25].Welzel J, Schuh S, De Carvalho N, Themstrup L, Ulrich M, Jemec GBE, Holmes J, Pellacani G, Dynamic optical coherence tomography shows characteristic alterations of blood vessels in malignant melanoma, J Eur Acad Dermatol Venereol 35(5) (2021) 1087–1093. [DOI] [PubMed] [Google Scholar]
- [26].Lindsø Andersen P, Olsen J, Friis KBE, Themstrup L, Grandahl K, Mortensen OS, Jemec GBE, Vascular morphology in normal skin studied with dynamic optical coherence tomography, Exp Dermatol 27(9) (2018) 966–972. [DOI] [PubMed] [Google Scholar]
- [27].Ulrich M, von Braunmuehl T, Kurzen H, Dirschka T, Kellner C, Sattler E, Berking C, Welzel J, Reinhold U, The sensitivity and specificity of optical coherence tomography for the assisted diagnosis of nonpigmented basal cell carcinoma: an observational study, Br J Dermatol 173(2) (2015) 428–35. [DOI] [PubMed] [Google Scholar]
- [28].Olsen J, Themstrup L, De Carvalho N, Mogensen M, Pellacani G, Jemec GB, Diagnostic accuracy of optical coherence tomography in actinic keratosis and basal cell carcinoma, Photodiagnosis Photodyn Ther 16 (2016) 44–49. [DOI] [PubMed] [Google Scholar]
- [29].Markowitz O, Schwartz M, Feldman E, Bienenfeld A, Bieber AK, Ellis J, Alapati U, Lebwohl M, Siegel DM, Evaluation of Optical Coherence Tomography as a Means of Identifying Earlier Stage Basal Cell Carcinomas while Reducing the Use of Diagnostic Biopsy, J Clin Aesthet Dermatol 8(10) (2015) 14–20. [PMC free article] [PubMed] [Google Scholar]
- [30].Mogensen M, Joergensen TM, Nürnberg BM, Morsy HA, Thomsen JB, Thrane L, Jemec GB, Assessment of optical coherence tomography imaging in the diagnosis of non-melanoma skin cancer and benign lesions versus normal skin: observer-blinded evaluation by dermatologists and pathologists, Dermatol Surg 35(6) (2009) 965–72. [DOI] [PubMed] [Google Scholar]
- [31].Li Y, Sudol NT, Miao Y, Jing JC, Zhu J, Lane F, Chen Z, 1.7 micron optical coherence tomography for vaginal tissue characterization in vivo, Lasers Surg Med 51(2) (2019) 120–126. [DOI] [PMC free article] [PubMed] [Google Scholar]
- [32].Li Y, Jing J, Heidari E, Zhu J, Qu Y, Chen Z, Intravascular Optical Coherence Tomography for Characterization of Atherosclerosis with a 1.7 Micron Swept-Source Laser, Sci Rep 7(1) (2017) 14525. [DOI] [PMC free article] [PubMed] [Google Scholar]
- [33].Sharma U, Chang EW, Yun SH, Long-wavelength optical coherence tomography at 1.7 microm for enhanced imaging depth, Opt Express 16(24) (2008) 19712–23. [DOI] [PMC free article] [PubMed] [Google Scholar]
- [34].Kroon D-J, Hessian based Frangi Vesselness filter 2020. https://www.mathworks.com/matlabcentral/fileexchange/24409-hessian-based-frangi-vesselness-filter. [DOI] [PMC free article] [PubMed]
- [35].Gong P, Almasian M, van Soest G, de Bruin D, van Leeuwen T, Sampson D, Faber D, Parametric imaging of attenuation by optical coherence tomography: review of models, methods, and clinical translation, J Biomed Opt 25(4) (2020) 1–34. [DOI] [PMC free article] [PubMed] [Google Scholar]
- [36].Li Y, Moon S, Chen JJ, Zhu Z, Chen Z, Ultrahigh-sensitive optical coherence elastography, Light Sci Appl 9 (2020) 58. [DOI] [PMC free article] [PubMed] [Google Scholar]
- [37].Li Y, Zhu J, Chen J, Yu J, Jin Z, Miao Y, Browne A, Zhou Q, Chen Z, Simultaneously imaging and quantifying in vivo mechanical properties of crystalline lens and cornea using optical coherence elastography with acoustic radiation force excitation, APL Photonics 4(10) (2019) 106104. [DOI] [PMC free article] [PubMed] [Google Scholar]
- [38].Du Y, Liu CH, Lei L, Singh M, Li J, Hicks MJ, Larin KV, Mohan C, Rapid, noninvasive quantitation of skin disease in systemic sclerosis using optical coherence elastography, J Biomed Opt 21(4) (2016) 46002. [DOI] [PMC free article] [PubMed] [Google Scholar]
Associated Data
This section collects any data citations, data availability statements, or supplementary materials included in this article.