

Summary
COVID-19, caused by SARS-CoV-2, can result in acute respiratory distress syndrome and multiple-organ failure1–4, but little is known about its pathophysiology. Here, we generated single-cell atlases of 23 lung, 16 kidney, 16 liver and 19 heart COVID-19 autopsy donor tissue samples, and spatial atlases of 14 lung donors. Integrated computational analysis uncovered substantial remodeling in the lung epithelial, immune and stromal compartments, with evidence of multiple paths of failed tissue regeneration, including defective alveolar type 2 differentiation and expansion of fibroblasts and putative TP63+ intrapulmonary basal-like progenitor cells. Viral RNAs were enriched in mononuclear phagocytic and endothelial lung cells which induced specific host programs. Spatial analysis in lung distinguished inflammatory host responses in lung regions with and without viral RNA. Analysis of the other tissue atlases showed transcriptional alterations in multiple cell types in COVID-19 donor heart tissue, and mapped cell types and genes implicated with disease severity based on COVID-19 GWAS. Our foundational dataset elucidates the biological impact of severe SARS-CoV-2 infection across the body, a key step towards new treatments.
Introduction
The host response to severe acute respiratory syndrome coronavirus 2 (SARS-CoV-2) infection ranges from asymptomatic infection to severe coronavirus disease 2019 (COVID-19) and death. The leading cause of mortality is acute lung injury and acute respiratory distress syndrome (ARDS), or direct complications with multiple organ failure1–4. Clinical deterioration in acute illness leads to ineffective viral clearance and collateral tissue damage1–5. Severe COVID-19 is also accompanied by an inappropriate pro-inflammatory host immune response and a diminished antiviral interferon response6–8.
Many molecular and cellular questions related to COVID-19 pathophysiology remain unanswered, including: how cell compositions and gene programs shift; which cells are infected; and, how associated genetic loci drive disease. Autopsies are critical to understanding severe COVID-19 pathophysiology9–12, but comprehensive genomic studies are challenged by long post mortem intervals (PMI).
Here, we developed a large cross-body COVID-19 autopsy biobank of 420 autopsy specimens, spanning 11 organs and used it to generate a single cell atlas of COVID-19 lung, kidney, liver and heart and a lung spatial atlas, in a subset of 14-18 donors per organ. Our atlases provide critical insights into the pathogenesis of severe COVID-19.
RESULTS
A COVID-19 autopsy cohort and biobank
We assembled an autopsy cohort of eleven male and six female donors, of different ages (>30->89yo), racial/ethnic backgrounds, intermittent mandatory ventilation (IMV; 0-24 days) periods and days from symptom start (S/s) to death (Fig. 1a, Supplementary Information Table 1). From most donors, we collected at least lung, heart, and liver tissue (Fig. 1a, Extended Data Fig. 1a, Methods), preserving specimens for single cell and spatial analysis. We optimized single cell and single nucleus RNA-seq (sc/snRNA-Seq) protocols for Biosafety Level 3, and NanoString GeoMx workflows to spatially profile RNA from different tissue compartment by cell composition or viral RNA (Methods).
Figure 1. Experimental and computational pipeline for a COVID-19 autopsy atlas.
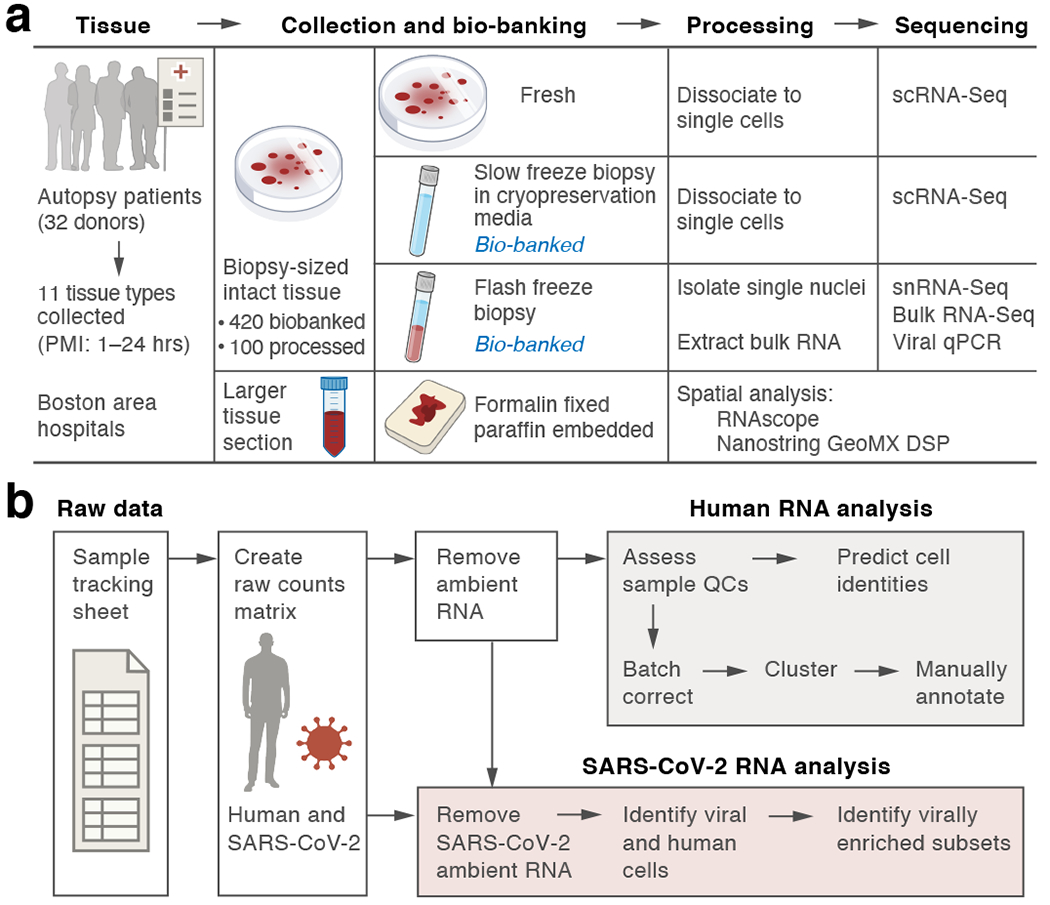
a. Sample processing pipeline. Up to 11 tissue types from 32 donors were collected. PMI: post-mortem interval. b. sc/snRNA-Seq analysis pipeline.
COVID-19 cell atlases
We generated sc/snRNA-Seq atlases of lung (n=16 donors, k=106,792 cells/nuclei, m=23 specimens; Donors D1-8,10-17), heart (n=18, k=40,880, m=19, D1-8,10-11,14-17, 27-28,31-32), liver (n=15, k=47,001, m=16; D1-7,10-17) and kidney (n=16, k= 33,872, m=16; D4-8,10-12,14-15,17,25-26,28-30). While initial tests showed some differences in cell type proportions between snRNA-Seq and scRNA-Seq, snRNA-Seq performed better overall13 (Extended Data Fig. 1b–d and data not shown) and was used for the remaining samples.
We developed a computational pipeline (Fig. 1b) to tackle unique technical challenges. We used CellBender remove-background14 to remove ambient RNA, enhancing cell distinction and marker specificity (Extended Data Fig. 1e–h; Methods); we rapidly quality controlled, pre-processed, and batch corrected data with cloud-based Cumulus15 (Extended Data Fig. 2a–g, Methods); and we automatically annotated cells/nuclei by transferring labels from previous atlases (Fig. 2a, Extended Data Fig. 2h, Methods). We refined these labels with manual annotation of sub-clusters in each main lineage (Fig. 2b, Extended Data Fig. 2i–2n, Methods). The former allowed us to compare to other data resources (without clustering or batch correction); the latter to refine cell identity assignments with detailed domain knowledge.
Figure 2. A single cell and single nucleus atlas of COVID-19 lung.
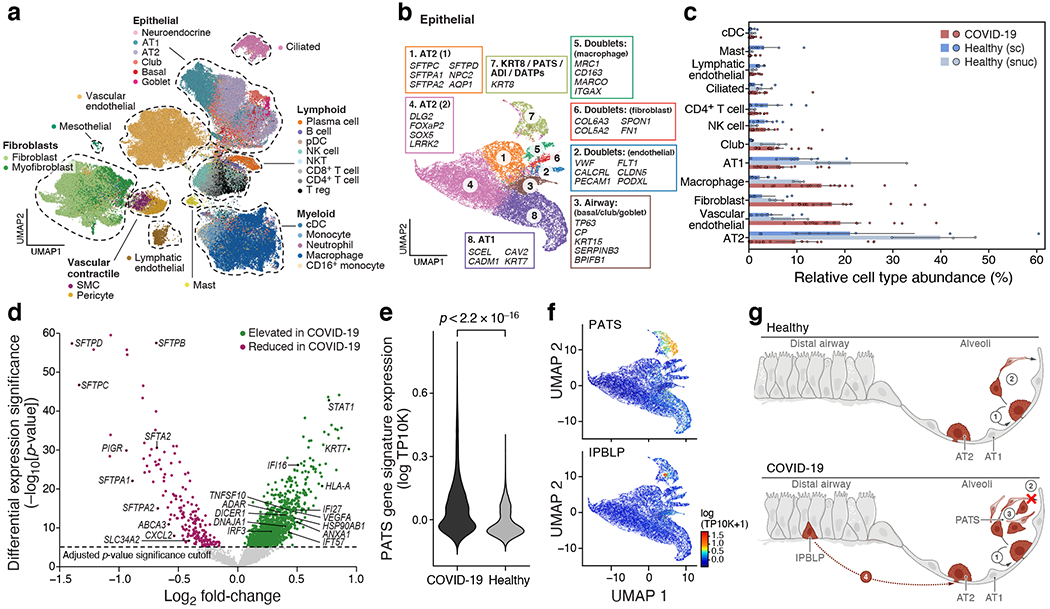
a. Automatic prediction identifies 28 cell subsets across compartments. UMAP embedding of 106,792 harmonized sc/snRNA-Seq profiles (dots) from 24 tissue samples of 16 COVID-19 lung donors, colored by automatic annotations (legend). b. Epithelial cell subsets. UMAP embedding of 21,661 epithelial cells/nuclei profiles, colored by manual annotations, with highly expressed marker genes (boxes). c,d. Cell composition and expression differences between COVID-19 and healthy lung. c. Cell proportions (x axis, mean: bar, and 95% confidence intervals: line) in each automatically annotated subset (y axis) in COVID-19 snRNA-Seq (red, n=16), healthy snRNA-Seq (grey, n=3), and healthy scRNA-seq (n=8, blue). Cell types shown have a COVID-19 vs. healthy snRNA-Seq FDR < 0.05 (Dirichlet-multinomial regression). d. Significance (−Log10(P-value), y axis) vs. magnitude (log2(fold-change), x axis) of differential expression of each gene (dots; horizontal dashed line: FDR < 0.05) between COVID-19 and healthy lung from a total of 2,000 AT2 cells and 14 studies (2 sided test, Methods). e,f. An increased PATS20–22 program in pneumocytes in COVID-19 vs. healthy lung. e. Distribution of PATS signature scores (y axis) for 17,655 cells from COVID-19 and 24,000 cells from healthy lung pneumocytes (x axis) p-value< 2.2*10−16 (one-sided Mann–Whitney U test). f. UMAP embedding of 21,661 epithelial cell profiles (dots) colored by signature level (color legend, lower right) for the PATS (top) or IPBLP (bottom) programs. g. Model of epithelial cell regeneration in healthy and COVID-19 lung. In healthy alveoli (top), AT2 cells self-renew (1) and differentiate into AT1 cells (2). In COVID-19 alveoli (bottom), AT2 cell self-renewal (1) and AT1 differentiation (2) are inhibited, resulting in PATS accumulation (3) and recruitment of airway-derived IPBLP progenitors to alveoli (4).
A cell census of the COVID-19 lung
Automatic annotation defined 28 subsets of parenchymal, endothelial and immune cells (Fig. 2a, Supplementary Information Table 2, Methods), with further manual annotation within subgroupings (Fig. 2b, Extended Data Fig. 2,4, Methods). Deconvolution of bulk RNA-Seq from the same samples largely agreed (Extended Data Fig. 3a,b, Methods), and our two annotation strategies had 94% agreement (Extended Data Fig. 3c–e).
Among immune cells we distinguished: six cell myeloid subsets: CD14highCD16high inflammatory monocytes with antimicrobial properties, and five macrophage subsets (Extended Data Fig. 2j, 4b) enriched for scavenger receptors, toll-like receptor ligands, inflammatory transcriptional regulators, or metabolism genes; four B and plasma cell subsets: BLIMP-1high plasma cells16,17; BLIMP-1intermediate plasma cells; B cells; and, JCHAIN-expressing plasmablasts (Extended Data Fig. 2k, 4b); five T and NK subsets: two CD4+ subsets, including Tregs and a metabolically active subset; one CD8+ subset; and two T/NK cell subsets (Extended Data Fig. 2l, 4b), including one with cytotoxic effector genes. The dearth of neutrophils (Fig. 2a, 419 cells) is likely due to freezing or limitations of droplet-based sc/snRNA-seq13.
We identified seven endothelial subsets (Extended Data Fig. 2m, 4b)18,19: arterial; venous and lymphatic; capillary aerocytes; capillary EC-1; and capillary EC-2 and a mixed subset (Methods), and three stromal subsets: fibroblasts; proliferative fibroblasts; and myofibroblasts19 (Extended Data Fig. 2n, Supplementary Information Table 3).
There were eight epithelial subsets including: club/secretory cells; AT1 cells; AT2 cells; and proliferative AT2 cells (Fig. 2b). One subset corresponded to a previously described AT2 to AT1 transitional cell state (KRT8+ pre-alveolar type (PATS) 1 transitional cell state (PATS/ADI/DATP)20–22 (Fig. 2b).
Changes in lung cell composition
Compared to normal lung from a matching region (Fig. 2c, Methods), AT2 cells were significantly decreased (FDR=2.8*10−15, Dirichlet multinomial regression, Methods), possibly reflecting virally-induced cell death23–25. Dendritic cells (FDR=0.004), macrophages (FDR=3.6*10−10), NK cells (FDR=0.018), fibroblasts (FDR=0.013), lymphatic endothelial cells (FDR=0.00058), and vascular endothelial cells (FDR=0.00011) all increased.
Cell proportions varied between donors (Extended Data Fig. 5a–b). While variation was not significantly correlated to PMI, age, or sex, IMV was positively correlated with epithelial cell fraction (FDR = 0.007; Spearman ρ=0.765) and negatively with T and NK cell fraction (FDR=0.041; ρ=−0.62). Fewer days on a ventilator may indicate a rapidly deteriorating condition. This is corroborated by the nominally significant positive correlation between epithelial cell fraction and S/s to death (ρ=0.671, p-value=0.004, but FDR=0.053).
Induced programs in epithelial cells
There were widespread, cell type specific, transcriptional changes in lung cell types in COVID-19 (Extended Data Fig. 5c, Methods), most notably in CD16+ monocytes (1,580 upregulated genes), lymphatic endothelial (578), vascular endothelial (317), AT2 (309), and AT1 (307) cells. Within AT2 cells, there was higher expression (p<0.0004) of genes associated with host viral response (Fig. 2d), including programmed cell death (STAT1), inflammation and adaptive immune response (Supplementary Information Table 4). Lung surfactant genes were downregulated, consistent with in vitro reports21.
Failed paths for AT1 cell regeneration
The PATS program signature was increased in COVID-19 pneumocytes (p-value< 2.2*10−16, one-sided Mann–Whitney U test) (Fig. 2e, Extended Data Fig. 5d). This progenitor program is induced during lung injury20–22 (e.g., idiopathic pulmonary fibrosis), consistent with fibrosis in severe COVID-1926,27. These studies also highlight fibroblast expansion, which we also observe (Fig. 2c).
A subset of PATS program cells, distinct from KRT5+/TP63+ airway basal cells, expressed canonical (KRT8/CLDN4/CDKN1A) and non-canonical (KRT5/TP63/KRT17) PATS markers (Fig. 2f, Extended Data Fig. 5d, Supplementary Information Table 3). These may be TP63+ intrapulmonary basal-like progenitor cells (IPBLP), identified in H1N1 influenza mouse models28 and act as an emergency cellular reserve for severely damaged alveoli29. The putative IPBLP cells express interferon viral-defense and progenitor cell differentiation genes (Supplementary Information Table 3). Thus, multiple emergency pathways for alveolar cell regeneration are activated in lung (Fig. 2g, Discussion).
Changed cell composition with viral load
To determine viral load and associated host responses, we analyzed donor and cell type-specific distributions of SARS-CoV-2 reads (Fig. 3a,b, Extended Data Fig. 6a–d, Methods). Reads spanned the entire SARS-CoV-2 genome, with bias toward positive-sense alignments. A few cells had reads aligning to all viral segments, including the negative strand (Extended Data Fig. 6e), potentially indicating productive infection. Viral detection was not technically driven (Extended Data Fig. 6f–i), and inter-donor variation was consistent with SARS-CoV-2 qRT-PCR on bulk RNA (Extended Data Fig. 6j–l, Methods). Viral load was negatively correlated with S/s to death (Fig. 3c), as previously reported30,31. Bulk RNA-Seq yielded nine unique complete viral genomes from nine donors with high viral loads (Extended Data Fig. 6m, Methods); all genomes carried the D614G allele. We identified no other common respiratory viral co-infections (Extended Data Fig. 6n). Total viral burden per sample (including ambient RNA, Methods) positively correlated with proportions of mast cells, specific macrophage subsets, venular endothelial cells, and capillary aerocytes’ endothelial cells (Extended Data Fig. 6o–u).
Figure 3. SARS-CoV-2 RNA+ single cells are enriched for phagocytic and endothelial cells.
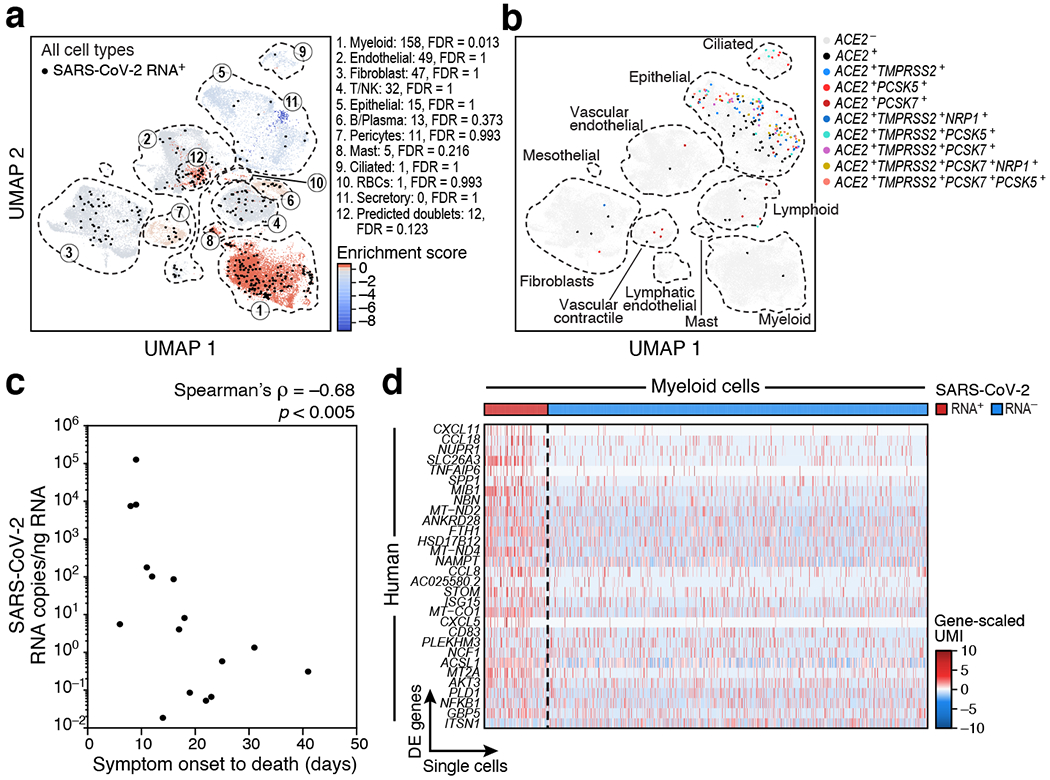
a,b. Many SARS-CoV-2 RNA+ single cells do not express known SARS-CoV-2 entry factors. UMAP embedding of all 106,792 lung cells/nuclei (as in Fig. 2a), showing either a. only the 40,581 cells from seven donors containing any SARS-CoV-2 RNA+ cell, colored by viral enrichment score (Methods, red: stronger enrichment) and by SARS-CoV-2 RNA+ cells (black points), and marked by annotation and FDR of enrichment (legend) or b. all 106,792 cells/nuclei, colored by expression of SARS-CoV-2 entry factors (co-expression combinations with at least 10 cells are shown). Dashed lines: major cell types. c. Reduction in SARS-CoV-2 RNA with prolonged S/s to death interval (Spearman ρ = −0.68, p <0.005, two-sided test). S/s to death (x axis, days) and lung SARS-CoV-2 copies/ng input RNA (y axis) for each donor (n=16). d. Expression changes in SARS-CoV-2 RNA+ myeloid cells. Significantly differentially expressed host genes (log-normalized and scaled digital gene expression, rows; cutoff: FDR < 0.05 and log2fold change > 0.5) across SARS-CoV-2 RNA+ (n=158) and SARS-CoV-2 RNA− myeloid cells (n=790) (columns).
Genes upregulated in biopsies with high vs. low/no viral load (Methods) included viral response and innate immune processes (log2FC >1.4, Wald test, FDR-corrected p-value <0.05, Extended Data Fig. 6v, Supplementary Information Table 4) and significantly overlapped with those in bulk RNA-Seq of other studies of post-mortem COVID-19 lungs (FDR=3.12*10−6, Kolmogorov-Smirnov test)32. Downregulated genes (log2FC <1.4, Wald test, FDR-corrected p-value <0.05) were involved in surfactant metabolism dysfunction and lamellar bodies (secretory vesicles in AT2 cells33).
Lung cells enriched for SARS-CoV-2 RNA
Myeloid cells were the cell category most enriched for SARS-CoV-2 RNA (158 cells following correction for ambient RNA, FDR<0.012, Fig. 3a, Extended Data Fig. 6w–y, Methods), with particular enrichment in CD14highCD16high inflammatory monocytes (FDR<0.005) and LDB2highOSMRhighYAP1high macrophages (FDR<0.02, Extended Data Fig. 6x, 7a,b), although enrichment scores in individual donors varied. There was elevated, but non-significantly enriched, viral RNA in endothelial cells, with the capillary 2 endothelial cells (cluster 3, FDR <0.017) and lymphatic endothelial cells (cluster 7, FDR<0.006) enriched compared to other endothelial subsets (Fig. 3a, Extended Data Fig. 6w,y, 7c,d). There were also SARS-CoV-2+ cells among mast cells, and B and plasma cells, and viral RNA reads in multiple other cell types (Fig. 3a, Extended Data Fig. 6w). Notably, SARS-CoV-2+ cells did not co-express the entry factors ACE2 and TMPRSS2, or other hypothesized entry cofactors (Fig. 3b, Extended Data Fig. 7e–h).
Immune programs in SARS-CoV-2+ cells
SARS-CoV-2+ cells had distinct transcriptional programs compared to RNA− counterparts, with differentially expressed genes (FDR<0.05; Methods) in epithelial and myeloid cells, including PPARGhighCD15Lhigh macrophages and CD14highCD16high inflammatory monocytes (Supplementary Information Table 5). Genes upregulated in epithelial SARS-CoV-2+ cells were enriched for TNF, API and chemokine/cytokine signaling, SARS-CoV-2 driven cell responses in vitro32, and keratinization pathways, which may reflect injury response (Extended Data Fig. 7i). Genes upregulated in myeloid SARS-CoV-2+ cells were enriched for chemokine and cytokine signaling, and responses to interferon, TNF, intracellular pathogens, and viruses (Fig. 3d Extended Data Fig. 7j–m, Supplementary Information Table 5), as previously described34,35. Cytokines and viral host response genes were upregulated in both CD14highCD16high inflammatory monocytes and PPARGhighCD15Lhigh macrophages (Extended Data Fig. 7m, Supplementary Information Table 5), including CXCL10 and CXCL11, which were upregulated in NP swabs35 and bronchoalveolar lavages34.
A spatial atlas of COVID-19 lung
To provide tissue context, we used Nanostring GeoMx Digital Spatial Profiling (DSP) for transcriptomic profiling from regions of interest (ROIs) (Methods) in 14 donors, including three healthy donors (Extended Data Fig. 1a). ROIs spanned a range of anatomical structures and viral abundance based on SARS-CoV-2 RNA hybridization signals; when possible, we segmented them to PanCK+ and PanCK−, and inflamed and normal-appearing alveoli areas of illumination (AOIs) to capture RNA (Fig. 4a, Extended Data Fig. 8a, Extended Data Fig. 9a, Methods). We acquired high quality profiles (Extended Data Fig. 8b) from matched AOIs based on distance to morphological landmarks (Methods). SARS-CoV-2 RNA expression varied by donor, with elevated levels in four donors (Extended Data Fig. 8c,d, Methods), consistent with viral qRT-PCR and sc/snRNA-Seq. Given the good agreement between a targeted 1,811 gene panel and a whole transcriptome (WTA) panel (18,335 genes) (Extended Data Fig. 8e–g, Supplementary Information Table 6), we focused our analyses on WTA data. For D8-12, 18-24, we contrasted COVID-19 and healthy donors and COVID-19 epithelial and non-epithelial AOIs; for D13-17, we focused on distinct anatomical regions and inflamed vs. normal-appearing regions within donors.
Figure 4. Composition and expression differences between COVID-19 and healthy lungs and between infected and uninfected regions within COVID-19 lungs.
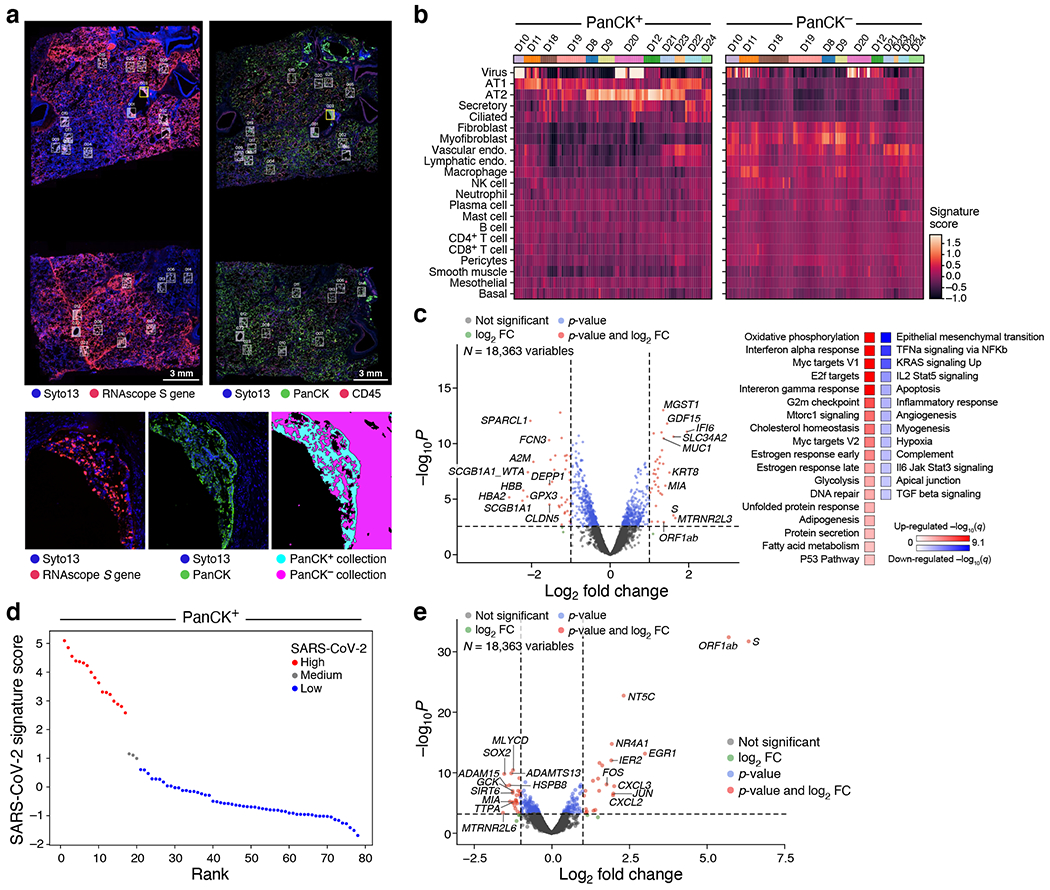
a. Example of analyzed regions. Top: RNAscope (left) and immunofluorescent staining (right) of donor D20 with collection ROIs and matched areas in white rectangles. Bottom: One ROI (yellow rectangle) from each scan (left and middle), and the segmented collection AOIs (right). b. Cell composition differences between PanCK+ and PanCK− alveolar AOIs and between AOIs from COVID-19 (n=9, 190 AOIs) and healthy (D22-24, 38 AOIs) lungs. Expression scores (color bar) of cell type signatures (rows) in PanCK+ (left) and PanCK− (right) alveolar AOIs (columns) in WTA data from different donors (top color bar).c. Differential gene expression in COVID-19 vs. healthy lung. Left: Significance (−log10(p-value), y axis) and magnitude (log2(fold-change), x axis) of differential expression of each gene (dots) in WTA data between PanCK+ alveoli AOIs from COVID-19 (n=78) vs. healthy (n=18) lung . Right: Significance (−log10(q-value)) of enrichment (permutation test) of different pathways (rows). d,e. Changes in gene expression in SARS-CoV-2 high vs. low AOIs within COVID-19 lungs in WTA data. d. SARS-CoV-2 high and low alveolar AOIs. PanCK+ alveolar AOIs (dots) rank ordered by their SARS-CoV-2 signature scores (y axis) in WTA data, and partitioned to high (red), medium (grey) and low (blue) SARS-CoV-2 AOIs. e. Significance (−log10(p-value), y axis) and magnitude (log2(fold-change), x axis) of differential expression of each gene (dots) in WTA data between SARS-CoV-2 high and low AOIs for PanCK+ alveoli (AOIs: 17 high, 3 medium, 58 low). Horizontal dashed line: FDR = 0.05. Vertical dashed lines: |log2(fold-change)| = 2. Top 10 DE genes by fold change marked.
Inflammatory activation in alveoli
Deconvolution of major cell type composition (Fig. 4b, Extended Data Fig. 8h, Supplementary Information Table 7–8, Methods) showed inferred AT1 and AT2 cells dominating the PanCK+ compartments and greater cellular diversity in the PanCK− compartment. COVID-19 PanCK− AOIs had increased fibroblast and myofibroblast scores compared to controls, in line with parallel spatial studies36,37.
Comparing COVID-19 alveolar AOIs vs. control lungs from deceased healthy donors (“healthy”‘), there was up-regulation of interferon-ɑ and γ response genes and oxidative phosphorylation pathways (Fig. 4c, Extended Data Fig. 8i–k, Supplementary Information Table 6), similar to bulk RNA-Seq of highly infected tissue (IFIT1,IFIT3,IDO1,GZMB,LAG3,NKG7,PRF1) and to SARS-CoV-2+ myeloid cells (TNFAIP6,CXCL11,CCL8,ISG1,GBP5), and consistent with PANoptosis in a COVID-19 model38. Conversely, TNFα, IL2-STAT5, and TGFβ signaling as well as apical junction and hypoxia were downregulated. Decreased TNF α signaling expression in PanCK+ alveoli contrasts with its increase in SARS-CoV-2+ epithelial cells in snRNA-seq and with reported38 synergy between TNF α and IFNγ in COVID-19 mouse models.
Comparing inflamed and normal-appearing AOIs within the same alveolar biopsies of COVID-19 lungs (Extended Data Fig. 9, Supplementary Information Table 9, D13-D17), upregulated genes were enriched for innate immune and inflammatory pathways39,40, including neutrophil degranulation (FDR=5.2*10−17) and IFNγ (FDR=3.4*10−15) and interleukin (FDR=1.4*10−13) signaling. TNF pathway expression was elevated in inflamed tissue albeit not significantly (FDR=0.097). Claudins and tight junction pathways were downregulated, corroborating a disrupted alveolar barrier, as in influenza41,42. Cilium assembly genes were enriched when comparing bronchial epithelial AOIs and matched normal-appearing alveoli (Extended Data Fig. 9d, Supplementary Information Table 9).
Comparing SARS-CoV-2 high and low AOIs (Fig. 4d,e, Extended Data Fig. 8l,m, Methods) revealed induction of the viral ORF1ab and S genes and upregulation of chemokines (CXCL2,CXCL3) and immediate early genes in the PanCK+ compartment, consistent with snRNA-Seq (Supplementary Information Table 9, Extended Data Fig. 7i). NT5C, encoding a nucleotidase with a preference for 5’-dNTPs, is consistently upregulated in SARS-CoV-2 high AOIs (Fig. 4e, Extended Data Fig. 8m, Supplementary Information Table 9). This gene is not known to play a role in lung injury and should be further studied.
COVID-19 impact on heart, kidney, liver
We next profiled liver, heart, and kidney by snRNA-Seq with automated and manual annotation of parenchymal, endothelial and immune cells (Methods, Extended Data Fig. 10, 11). Although other studies have reported viral reads in COVID-19 non-lung tissues43, we detected very few viral RNA reads in all three tissues, most of which could not be assigned to nuclei (Extended Data Fig. 11l); this absence was confirmed by NanoString DSP and RNAscope (data not shown).
Focusing on heart, both cell composition and gene programs changed between COVID-19 and healthy heart. There was a significant reduction in the proportion of cardiomyocytes and pericytes, and an increase in vascular endothelial cells (Extended Data Fig. 11e). Genes upregulated (FDR <0.01) in cardiomyocytes, pericytes, or fibroblasts (Extended Data Fig. 11g–i, Supplementary Information Table 10) included PLCG2, whose cardiac role is unknown but was induced in all major heart cell subtypes (Extended Data Fig. 11j), and AFDN, upregulated in endothelial cells (Extended Data Fig. 11k), which encodes a junction adherens complex component44 necessary for endothelial barrier function. Upregulated pathways include oxidative stress-induced apoptosis in pericytes, cell adhesion and immune pathways in cardiomyocytes, and cell differentiation processes in fibroblasts (Supplementary Information Table 10).
COVID-19 cell types related through GWAS
Finally, we aimed to identify genes and cell types associated with COVID-19 risk by integrating our atlas data with GWAS45 for common46 variants associated with COVID-19 (Methods). Among 26 genes proximal to six COVID-19 GWAS regions (Supplementary Information Table 11, Methods), 14 genes had higher average expression in the lung (p-value<0.05, t-test; Extended Data Fig. 12a–d), 21 had significant (FDR < 0.05) expression specificity in at least one lung cell type, including FOXP4 (chr 6, AT1 and AT2 cells), and CCR1 and CCRL2 (chr 3, macrophages) (Extended Data Fig. 12e, Supplementary Information Table 11), and 18 were differentially expressed (FDR<0.05) in COVID-19 vs. healthy lung (e.g., SLC6A20 in goblet cells, CCR5 in CD8 T cells and Tregs, and CCR1 in macrophage and CD16 monocytes, (Extended Data Fig. 12f, Supplementary Information Table 11).
We related heritability from GWAS of COVID-19 severity traits to either cell type programs (genes enriched in a cell type in each tissue) or disease progression programs (genes differentially expressed between COVID-19 and controls in a cell type) in each tissue using sc-linker47 (Methods). AT2 (4.8x heritability enrichment, p-value=0.04), CD8 T (4.4x, p-value=0.009), and ciliated cell programs in the lung, proximal convoluted tubule and connecting tubule programs in kidney, and cholangiocyte programs in liver attained nominal (but not Bonferroni-corrected) significance (Extended Data Fig. 12g–h, Supplementary Information Table 11). Of all disease progression programs, only the club cell program (single-cell level model) had nominally significant heritability enrichment (10.5x, p-value=0.04 for severe COVID-19) (Extended Fig. 12g, Supplementary Information Table 11).
The highest number of driving genes was observed for lung AT2 cells and spanned several loci, hinting at a polygenic architecture linking AT2 cells with severe COVID-19 (Methods, Supplementary Information Table 11). Implicated GWAS proximity genes include OAS3 in lung AT2 and club cells and SLC4A7 in lung CD8 T cells (Supplementary Information Table 11), as well genes at unresolved significantly associated GWAS loci (Extended Data Fig. 12i), such as FYCO1 (AT2, ciliated, club; chr3p), NFKBIZ (AT2; chr3q), and DPP9 (AT2; chr 19) (Supplementary Information Table 11).
Discussion
We built a biobank of severe COVID-19 autopsy tissue and atlases of COVID-19 lung, heart, liver, and kidney (Extended Data Fig. 12j), complementing a sister lung atlas (Melms et al., companion manuscript).
Among the changes in lung cell composition in COVID-19, is a reduction in AT2 cells and the presence of PATS and IPBLP-like cells, suggesting that multiple regenerative strategies are invoked to re-establish alveolar epithelial cells lost to infection. A serial failure of epithelial progenitors to regenerate at a sufficient rate, first by secretory progenitor cells in the nasal passages and large and small airways, followed by alveolar AT2 cells, PATS, and IPBLP cells, may eventually lead to lung failure.
Viral RNA in the lung varied significantly, was negatively correlated with S/s to death, and primarily detected in myeloid and endothelial cells (as in nonhuman primates48); spatial analysis supports high viral levels at the earlier stages of infection36,37,49. Epithelial cells were not enriched in high viral RNA samples or in SARS-CoV-2+ cells, consistent with their excessive death. Cell-associated SARS-CoV-2 UMIs may represent a mix of replicating virus, immune cell engulfment, and virions or virally-infected cells attached to the cell surface. We did not detect viral RNA in the heart, liver or kidney, but observed other changes, including broad upregulation of PLCG2 in heart, a target of Bruton’s tyrosine kinase (BTK)50.
Combining our profiles with GWAS of COVID-19, we related specific cell types to heritable risk, especially AT2, ciliated, and CD8+ T cells and macrophages, as well as genes in multi gene regions underlying the association. This analysis can improve as GWAS grows and atlases expand.
Our study was limited by a modest number of donors without pre-selection of features, the terminal time point, limited distinction between viral RNA and true infection, and technical confounders such as PMI. Nevertheless, our methods would enable studies in diverse diseased or damaged tissues, future meta-analyses will further enhance its power, and provide critical resources for the community studying host-SARS-CoV-2 biology.
Extended Data
Extended Data Figure 1. A COVID-19 autopsy cohort, data quality and ambient RNA removal for a single cell/nucleus lung atlas.
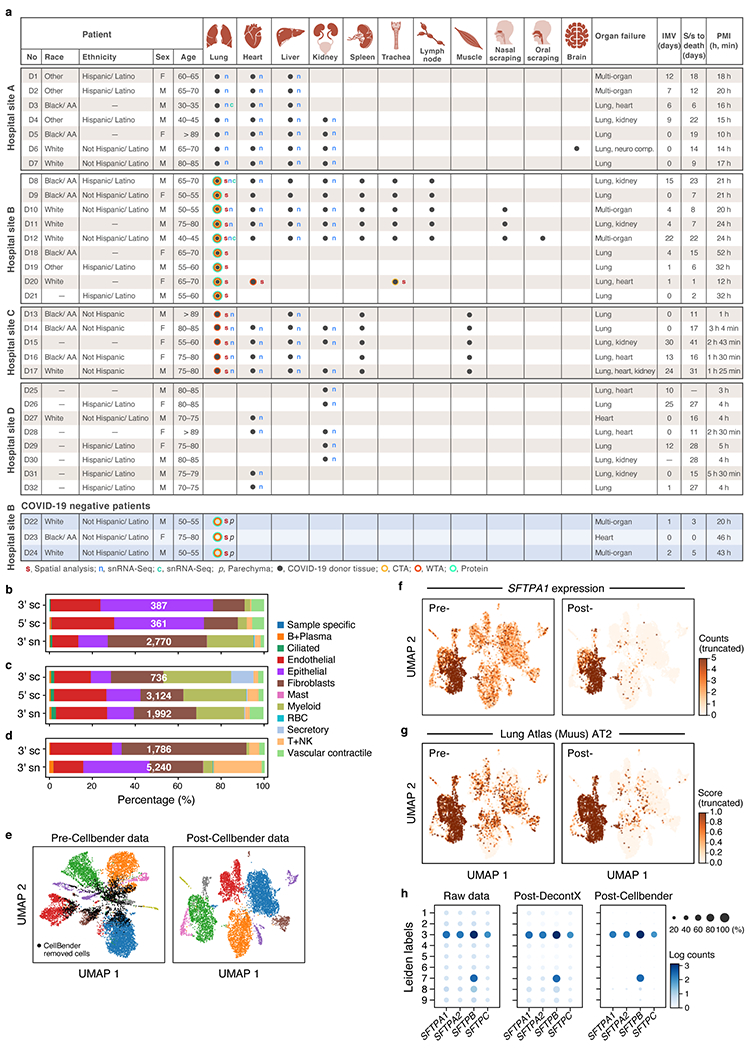
a. COVID-19 cohort overview. IMV: intermittent mandatory ventilation days, S/s: time from symptom onset to death in days; PMI: post-mortem interval. b-d. Comparison of cell composition by scRNA-seq and snRNA-seq in matched samples. Proportion of cells (x axis) of each type (color code) in sc/snRNA-seq samples from the same three donors (D3, D8, D12). e-h. Cellbender ‘remove-background’ on a single sample (D1). e. CellBender improves cell clustering and expression specificity by removing ambient RNA and empty (non-cell) droplets. UMAP plot of snRNA-seq profiles (dots) either before (left) or after (right) CellBender processing, colored by clusters, with CellBender-determined empty droplets in black (k=2,508 droplets removed, k=10,687 cells remaining). f,g. CellBender improves specificity of individual genes and cell type signatures. UMAP embedding of single nucleus profiles pre-CellBender (left) and post-CellBender (right) processing, colored by expression of the surfactant protein SFTPA1 (f) or signature score (Scanpy’s63 score_genes function, color bar) for genes sets specific to lung AT2 (g) cells. Color bar saturation chosen to emphasize low expression. h. Improved specificity of surfactant gene expression with CellBender (same sample). Expression level (log(average UMI count per cell), color) and percent of cells with nonzero expression (dot size) of surfactant genes (columns) across cell clusters (rows) before (left) and after (right) CellBender processing. Also shown, for comparison, are the results of an alternative method, DecontX (middle).
Extended Data Figure 2. Quality control and annotation in the COVID-19 lung cell atlas.
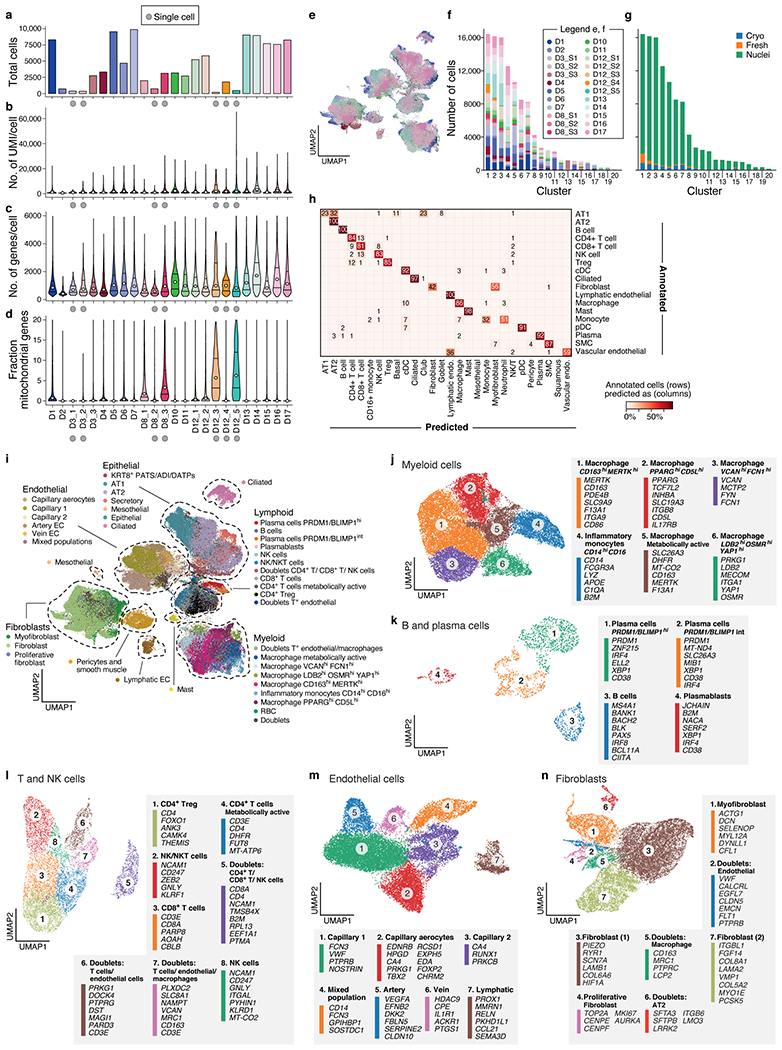
a-d. QC metrics for 24 lung samples (n=16 donors). Number of cells/nuclei (a, y axis) and distributions (median and first and third quartiles) of number of UMI per cell/nucleus (b, y axis), number of genes per cell/nucleus (c, y axis) and fraction of mitochondrial genes per cell/nucleus (d, y axis) across the samples (x axis) in the lung atlas. ScRNA-Seq samples are labeled by a grey circle. e-g. Cross-sample integration corrects batch effects. e. UMAP (as in Fig. 2a) of 106,792 sc/snRNA-Seq profiles post-Harmony65 correction (Methods) colored by sample ID. f,g. Donors and processing protocols across clusters. Number of cells (y axis) from different donors (f) or processing protocols (g) in each Leiden cluster (x axis). h. Cross validation of automatic annotation. Percent of cells (color bar) annotated in a class by Schiller et al.73 that we predict for each class (columns). i. Identification of main lineage annotations by manual annotation. UMAP of 106,792 sc/snRNA-Seq profiles post-Harmony65 correction (as in Fig. 2a) colored by manual annotation done in sub-clustering of each lineage. Dashed lines: chosen compartments for sub-clustering. j-n. Refined annotation of cell subsets within lineages. UMAP embeddings of each selected cell lineages with cells colored by manually annotated sub-clusters. Color legends highlight highly expressed marker genes for select subsets. j. myeloid cells (k=24,417 cells/nuclei); k. B and plasma cells (k=1,693); l. T and NK cells (k=9,950); m. endothelial cells (k=20,366); and n. fibroblast (k=20,925).
Extended Data Figure 3. Bulk RNA-Seq deconvolution and comparison of automatic and manual annotations in the COVID-19 lung cell atlas.
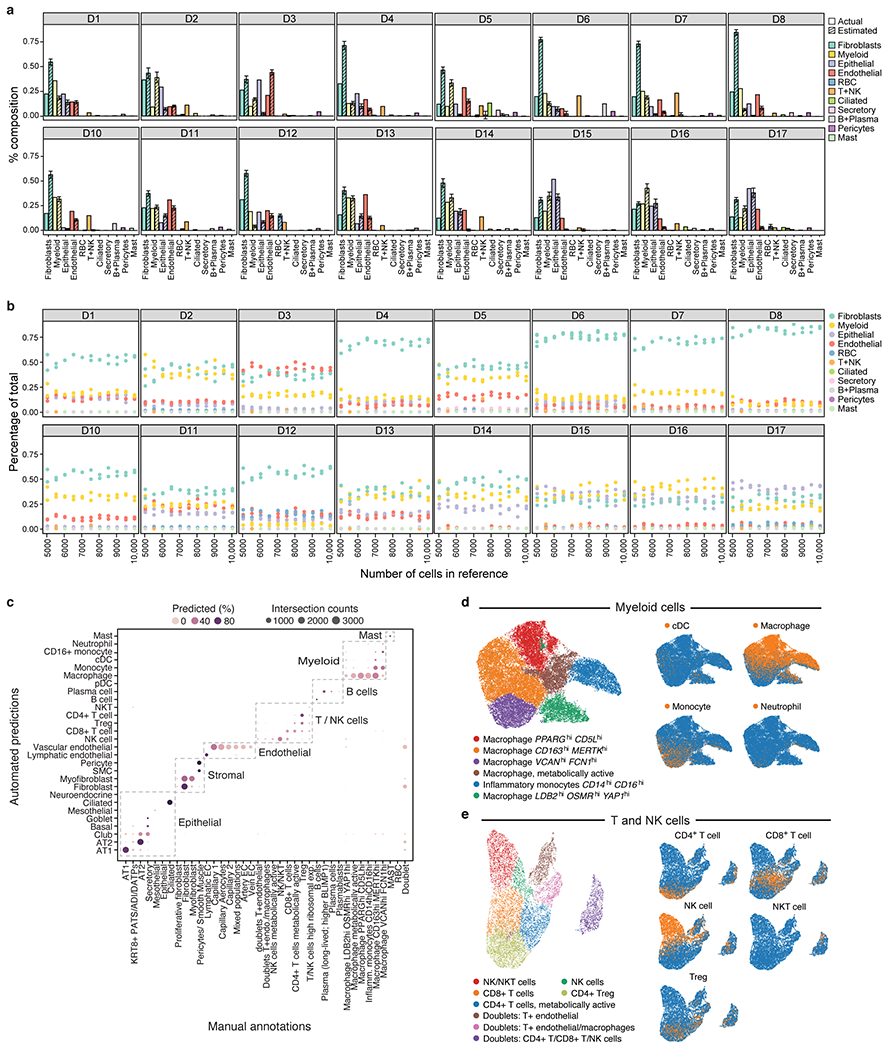
a,b. Deconvolution of bulk RNA-Seq libraries from adjacent lung tissue. a. Mean proportion (y axis, error bars = SD estimates from bulk RNA-Seq deconvolution (hatched bars; from MuSiC86) and from sc/snRNA-seq (filled bars) for each of 11 cell subsets (x axis) in each of 16 bulk RNA-Seq lung samples (panels) from 10 random samples of 10,000 cells each. b. Robustness of cell proportion estimates to the number of single cells sampled for the reference data. Mean proportion (y axis, from MuSiC) estimates for each of 11 cell subsets (color dots) in each of 16 bulk RNA-Seq lung samples (panels) when using three independent samples of 1,000 to 10,000 cells from the single cell reference (x axis). c-e. Agreement between automated and manual annotations. c. High consistency between automatic and manual annotations. The proportion (color intensity) and number (dot size) of cells with a given predicted annotation (rows) in each manual annotation category (columns). d,e. UMAP embedding of myeloid (k=24,417 cells/nuclei) (d) and T and NK (k=9,950 cells), (e) cell profiles colored by manually annotated subclusters (left) or automated predictions (right).
Extended Data Figure 4. Manual annotation in the COVID-19 lung cell atlas.
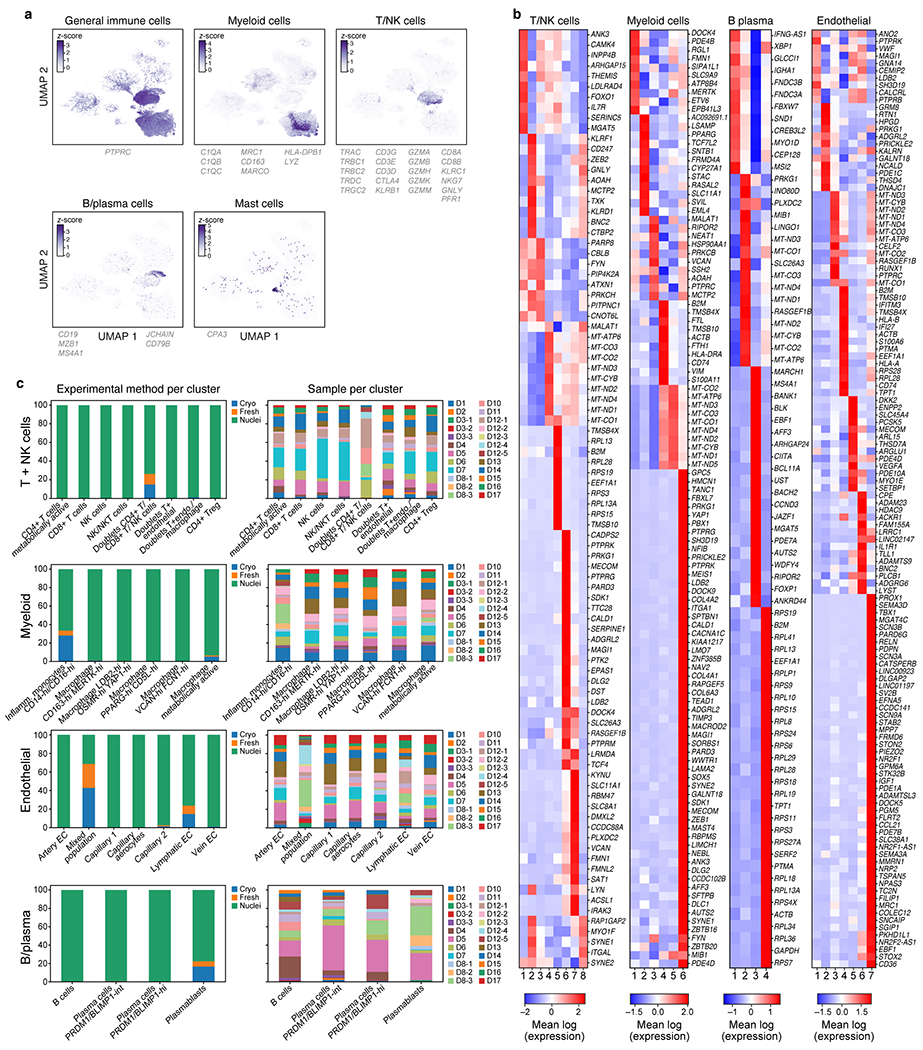
a,b. Identification of main immune lineage annotations. a. UMAP of 106,792 sc/snRNA-Seq profiles post- Harmony correction (as in Fig. 2a) colored by expression of genes (color bar, genes listed below) used to separate immune cell sub-lineages (Methods). b. Differentially expressed genes between sub-clusters within each lineage. Expression (color bar) of genes (rows) that are differentially expressed (Methods) across the sub-clusters (columns) within each compartment. DE genes shown are a union of the following: (i) top 10 DE genes between clusters, (ii) DE genes above an AUC of 0.8 and 0.75 for B/Plasma cells, (iii) pseudo-bulk DE genes above a log(fold change) threshold (thresholds: endothelial=4.2, T/NK=3, myeloid= 4, B/plasma=2) (label on top). c. Batch correction within lineage. Fraction of cells/nuclei (y axis) from different processing protocols (left) or different donors (right, n=17) in each sub-cluster (x axis) after batch correction with Harmony65 within each lineage.
Extended Data Figure 5. Cell intrinsic programs and epithelial regenerative cell states in the COVID-19 lung cell atlas.
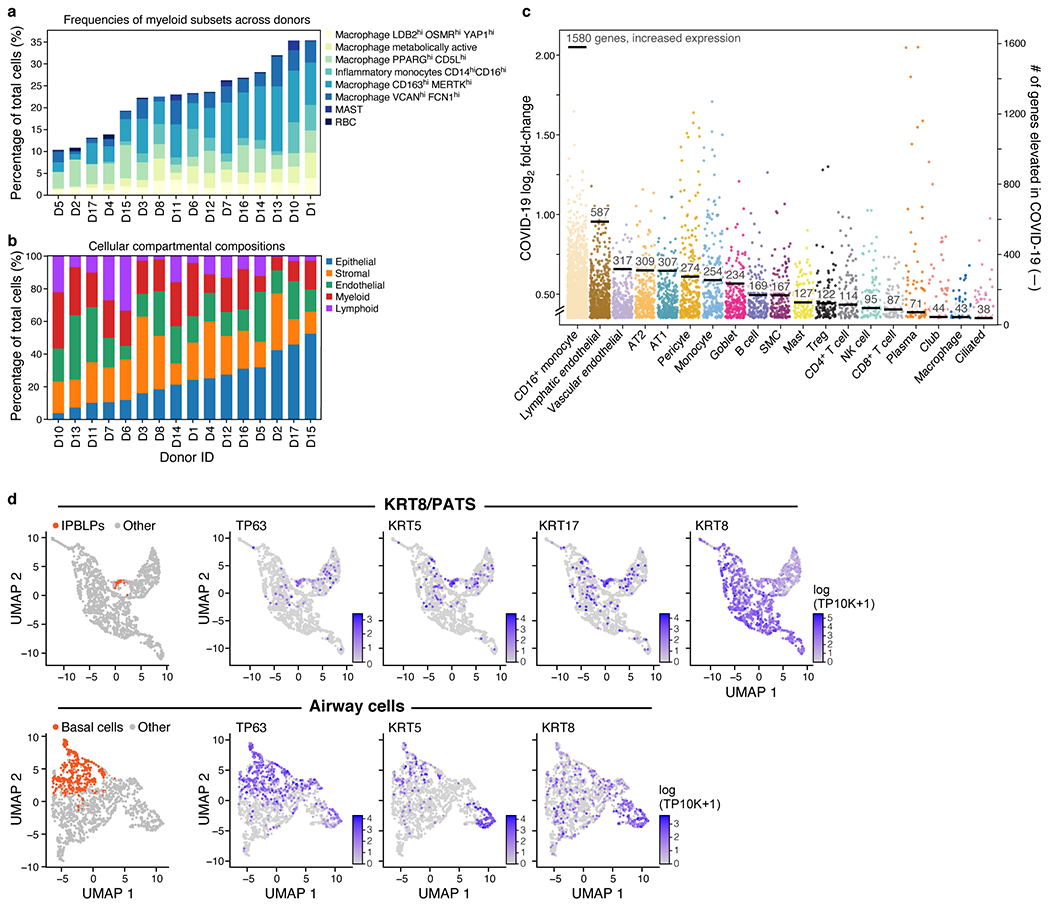
a,b. Differences in cell composition across donors. Percent of cells (y axis) from each myeloid subset (legend) in each donor (x axis). b. Percent of cells (y axis) from each main lineage (legend) in each donor (x axis), rank ordered by proportion of epithelial cells (blue). c. Myeloid, endothelial and pneumocyte cells show substantial changes in cell intrinsic expression profiles in COVID-19 lung. Log2(fold change) (y axis) between COVID-19 and healthy lung for each elevated gene (dot) in each cell subset (x axis, by automatic annotation). Black bars: number of genes with significantly increased expression (adjusted p-value <7.5*10−6). Computed using a single cell based differential expression model applied to a meta-differential expression analysis between COVID-19 and healthy samples across 14 studies (see Methods). d. PATS and IBPLP cells in COVID-19 lung. UMAP embeddings of 1,550 KRT8+PATS-expressing cells (top) or of 1,394 airway epithelial cells (bottom) colored by IPBLPs or basal cells (orange, leftmost panels) or characteristic markers (purple, remaining panels).
Extended Data Figure 6. SARS-CoV-2-RNA+ cells distinguished by sc/snRNA-Seq.
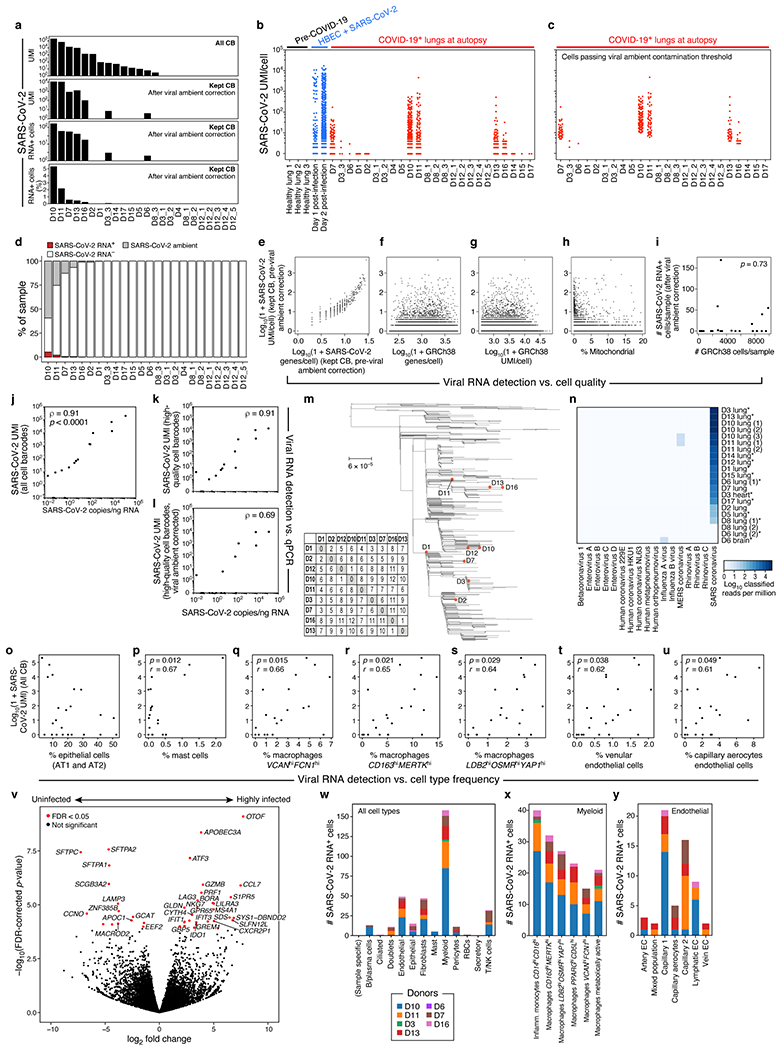
a. Detection of SARS-CoV-2 UMIs from sc/snRNA-Seq data. SARS-CoV-2 UMIs from all cell barcodes (top), and after ambient correction (second from top). Number (second from bottom) and percent (bottom) of SARS-CoV-2 RNA+ cells after ambient correction (m=24 specimens). b,c. Impact of ambient RNA on SARS-CoV-2 RNA+ detection. Number of SARS-CoV-2 aligning UMI per Cell Barcode (CB) (y axis) in healthy lung (b, black), in vitro SARS-CoV-2 infected human bronchial epithelial cells (HBEC)110 (b, blue) or lung samples from COVID-19 donors at autopsy either with CB with high-quality capture of human mRNA (b, red) or after removal of cells whose viral alignments were attributed to ambient contamination (c, Methods). d. Variation in SARS-CoV-RNA+ cells across donors. Percent of cells (y axis) assigned as SARS-CoV-2 RNA−(white), SARS-CoV-2 RNA+(red), or SARS-CoV-2 ambient (grey, Methods) across the donors (x axis), sorted by proportion of SARS-CoV-RNA+ cells. e-i. Viral RNA detection does not correlate with cell quality metrics. e-h. Number of SARS-CoV-2 UMIs (prior to ambient viral correction) for each cell (y axis) vs. either number of SARS-CoV-2 genes for that cell (e, x axis), number of human (GRCh38) genes per cell (f, x axis), number of human (GRCh38) UMI per cell (g, x axis), or % of human (GRCh38) mitochondrial UMIs per cell (h, x axis). i. Number of retained high-quality cells (x axis) and number of SARS-CoV-2 RNA+ cells (y axis) in each sample (dots) following correction for ambient viral reads. Pearson’s r = 0.07, two-sided p = 0.73. j-l. Agreement in viral RNA detection between qPCR and sn/scRNA-Seq. Number of SARS-CoV-2 copies measured by CDC N1 qPCR on bulk RNA extracted from matched tissue samples (x axis) and the number of SARS-CoV-2 aligning UMI (y axis) for each sample (dot) from all reads (j, p < 0.0001, two-sided), all reads from high-quality cell barcodes (k, p < 0.0001), and after viral ambient RNA correction (l, p = 0.0042). Spearman’s ⍴ reported, two-sided test. m. Genetic diversity of SARS-CoV-2. Maximum likelihood phylogenetic tree of 772 SARS-CoV-2 genomes from cases in Massachusetts between January-May 2020. Orange points: donors in this cohort. n. Specificity of SARS-CoV-2 infection. log10(1+reads) in each donor (columns) assigned to different viruses (rows) by metagenomic classification using Kraken2 from bulk RNA-Seq. Asterisks denote targeted capture. o-u. Relation between SARS-CoV-2 RNA and different cell types. Number of SARS-CoV-2 aligning UMIs in each (including all CB) and the proportion of epithelial (o), mast (p), macrophage VCANhighFCN1high (q), macrophages CD163highMERTKhigh (r), macrophages LDB2highOSMRhighYAP1high (s), venular endothelial (t) or capillary aerocytes (u) cells in these samples (x axes). Pearson’s r denoted in the upper left corner with significance following Bonferroni correction (p). v. Impact of viral load on bulk RNA profiles. Significance (−log10(P-value), yaxis) and magnitude (log2(fold-change), xaxis) of differential expression of each gene (dots) between three donors with highest viral load and six donors with lowest/undetectable viral load profiled by bulk RNA-Seq. Red points: FDR < 0.05. w-y. Distribution of SARS-CoV-2 RNA+ cells across cell types and subsets. Number of SARS-CoV-2 RNA+ cells (y axis) from each donor (color) across major categories (w, x axis), myeloid subsets (x, inflammatory monocytes: 40 cells, 5 donors; LDB2highOSMRhighYAP1high macrophages: 27 cells, 5 donors; x axis), or endothelial subsets (y, capillary endothelial cells: 16 cells, 4 donors; lymphatic endothelial cells: 9 cells, 3 donors; 16 cells, 4 donors, x axis).
Extended Data Figure 7. Donor-specific enrichment of SARS-CoV-2 RNA+ cells and host responses to viral RNA.
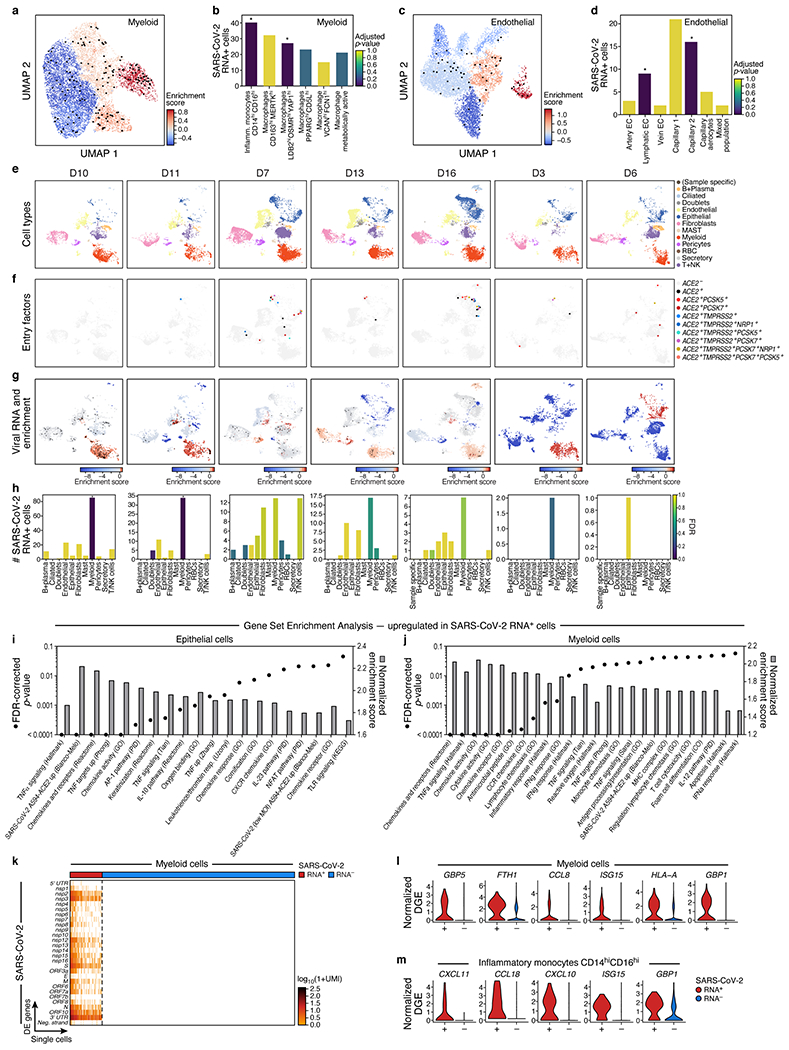
a-d. SARS-CoV-2 RNA+ cells are enriched in specific lineages and sub-types. a,c. UMAP embeddings of either myeloid cells (a), or endothelial cells (c) from seven donors containing any SARS-CoV-2 RNA+ cell, and colored by viral enrichment score (color bar; red: stronger enrichment) and by SARS-CoV-2 RNA+ cells (black points). b,d. Number of SARS-CoV-2 RNA+ cells (y axis) per cell type/subset (x axis) in myeloid (b) or endothelial (d) subsets. Bar color: FDR ( dark blue: higher significance, Methods; * FDR < 0.05. ). b. e-h. Variation across donors. e-g. UMAP embeddings of sc/snRNA-seq profiles from each of seven donors containing any SARS-CoV-2 RNA+ cell (columns), colored by major cell categories (e), expression of SARS-CoV-2 entry factors (f), or SARS-CoV-2 RNA enrichment per cluster (g, red/blue colorbar; red: high enrichment; black points: SARS-CoV-2 RNA+ cells). h. Number of SARS-CoV-2 RNA+ cells (y axis) across major cell types (x axis) from each of seven donors containing any SARS-CoV-2 RNA+ cell (columns). Bar color: FDR (dark blue: higher significance). * FDR < 0.05. i,j. Normalized enrichment score (bars, right y axis) and significance (points, FDR, left y axis) (by GSEA39,40, Methods) of different functional gene sets (x axis) in genes upregulated in SARS-CoV-2 RNA+ epithelial (i) or myeloid (j) cells. k. Expression of SARS-CoV-2 genomic features (log-normalized UMI counts; rows) across SARS-CoV-2 RNA+ (k=158 cells) and SARS-CoV-2 RNA− (k=790) myeloid cells (columns). l,m. Distribution of normalized expression levels (y axis) for select significantly differentially expressed genes between SARS-CoV-2 RNA− and SARS-CoV-2 RNA+ cells from all myeloid cells or Inflammatory monocytes CD14highCD16highcells.
Extended Data Figure 8. NanoString GeoMx experiment design and analysis.
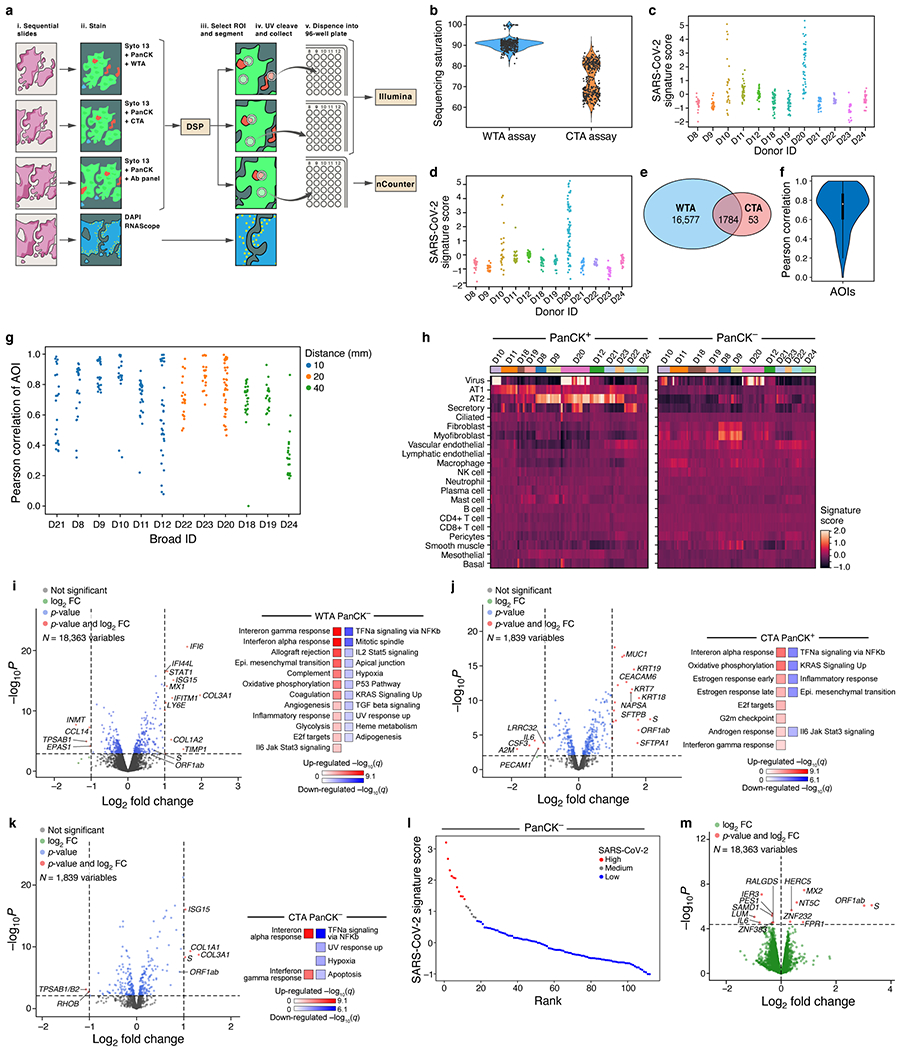
a. Overview of spatial profiling experiments. b. Distribution of sequencing saturation (y axis, %) for WTA and CTA AOIs (x axis). c,d. SARS-CoV-2 signature score (y axis) for each WTA (c) and CTA (d) AOI (dots) from each donor (x axis). e. Overlap of WTA and CTA genes. f,g. Agreement between WTA and CTA. f. Distribution (box: interquartile range, white point: median, violin range: min-max) of Pearson correlation coefficients (y axis) between WTA and CTA profiles (for common genes across 296 AOIs). g. Pearson correlation coefficient (y axis) of WTA and CTA common genes for each AOI pair (dot) from each donor (x axis), sorted by distance between WTA and CTA sections (blue, 10 mm; orange, 20 mm; green, 40 mm). h. Cell composition differences between PanCK+ and PanCK− alveolar AOIs and between AOIs from COVID-19 (n=9, 161 AOIs) and healthy (D22-24, 40 AOIs) lungs. Expression scores (color bar) of cell type signatures (rows) in PanCK+ (left) and PanCK− (right) alveolar AOIs (columns) in CTA data from different donors (top color bar). i-k. Differential gene expression in COVID-19 vs. healthy lung. Left: Significance (−log10(p-value), y axis) and magnitude (log2(fold-change), x axis) of differential expression of each gene (dots) in WTA for PanCK− (i, 112 COVID-19 vs. 20 healthy), and in CTA for PanCK+ (j, 69 COVID-19 vs. 18 healthy) and PanCK− (k, 92 COVID-19 vs. 22 healthy) alveoli. Horizontal dashed line: FDR = 0.05, vertical dashed lines: |log2(fold-change)| = 2. Right: Significance (−log10(q-value)) of enrichment (permutation test) of different pathways (rows). l,m. Changes in gene expression in SARS-CoV-2 high vs. low AOIs within COVID-19 lungs in WTA data. l. PanCK- alveolar AOIs (dots) rank ordered by their SARS-CoV-2 signature score (y axis) in WTA data, and partitioned to high (red), medium (grey) and low (blue) SARS-CoV-2 AOIs. m. Significance (−log10(p-value), y axis) and magnitude (log2(fold-change), x axis) of differential expression of each gene (dots) in WTA data between SARS-CoV-2 high and low AOIs for PanCK- alveoli (ROIs: 11 high, 6 medium, 95 low). Horizontal dashed line: FDR = 0.05.
Extended Data Figure 9. GeoMx WTA DSP analysis of lung biopsies reveals region- and inflammation-specific expression programs.
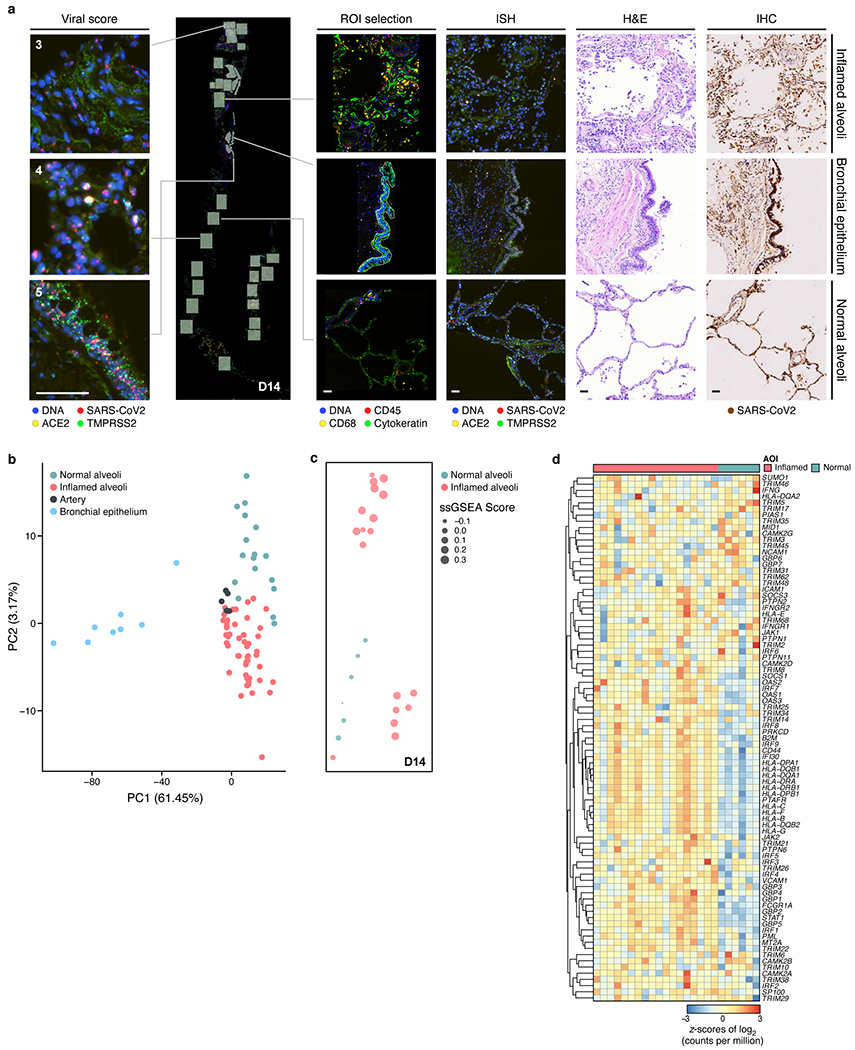
a. Region selection. Serial sections of lung biopsies (five donors, D13-17; image depicts serial sections of D14) processed with GeoMx WTA-DSP with 4-color staining (DNA, CD45, CD68, PanCK), RNAscope with probes against (SARS-CoV-2 S-gene (utilized to derive semi-quantitative viral load scores), ACE2, TMPRSS2), H&E staining, and immunohistochemistry with anti-SARS-CoV-2 S-protein. Scale bar: 100 μm. b-d. Regions and inflammation specific expression programs. b. The first two principal components (PCs, x and y axes) from lung ROI gene expression profiles from donors D13-17, spanning normal-appearing alveoli (green; D14=6 AOIs, D15=2 AOIs, D16=5 AOIs, D17=4 AOIs); inflamed alveoli (magenta; D13=14 AOIs, D14=18 AOIs, D15=7 AOIs, D16=3 AOIs ,D17=8 AOIs); bronchial epithelium (blue; D14 =2 AOIs, D15 =1 AOI, D16 =2 AOIs, D17 =3 AOIs), and arterial blood vessels (black; D13=2 AOIs, D15=3 AOIs). c. GSEA score (circle size, legend) of the enrichment of the interferon-γ pathway in each normal-appearing (green; 6 AOIs) and inflamed (magenta; 18 AOIs) alveolar AOIs (dot) from the section of donor D14 (in a), placed in their respective physical coordinates on the tissue section (as in a). d. Expression (color bar, log2(counts per million)) of IFNγ pathway genes (rows) from normal-appearing (green, n=6) and inflamed alveoli (magenta, n=18) AOIs (columns) from D14 lung biopsy.
Extended Data Figure 10. A single nucleus atlas of heart, kidney, and liver COVID-19 tissues.
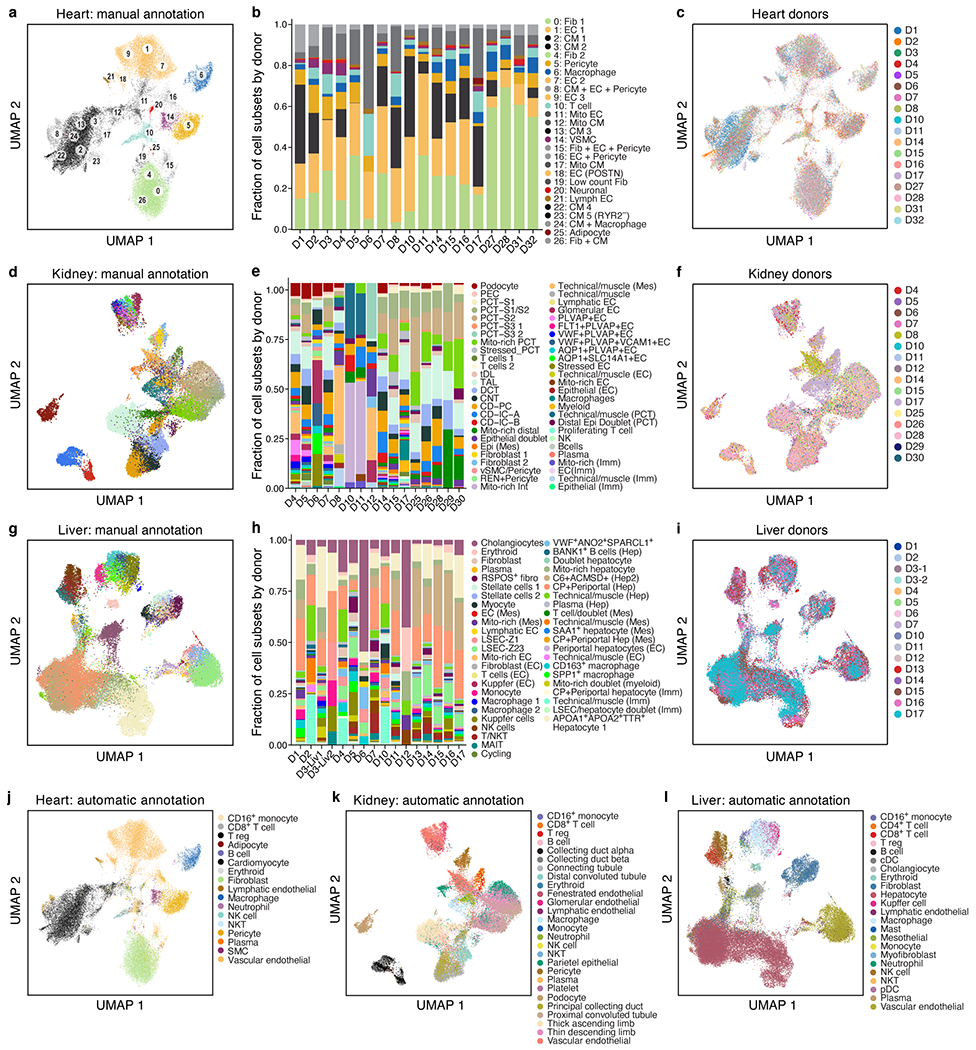
a-c. COVID-19 heart cell atlas. UMAP embedding of 40,880 heart nuclei (dots) (n=18 donors, m=19 specimens) colored by Leiden resolution 1.5 clustering with manual post hoc annotations (a) or donors (c). b. Proportions of cells (y axis) in each sample. d-f. COVID-19 kidney cell atlas. UMAP embedding of 33,872 kidney nuclei (dots) (n=16, m=16) colored by clustering with manual post hoc annotations (d) or donors (f). e. Proportion of cells (y axis) in each sample. g-i. COVID-19 liver cell atlas. g,i. UMAP embedding of 47,001 liver nuclei (dots) (n=15, m=16), colored by clustering with manual post hoc annotations (g) or donors (i). h. Proportion of cells (y-axis) in each sample. j-l. Automatic annotations. UMAP embeddings, colored by predicted cell type labels by automatic annotation for heart (j), kidney (k) and liver (l).
Extended Data Figure 11. Entry factors in heart, kidney and liver COVID-19 tissues and differential gene expression in heart cell atlas.
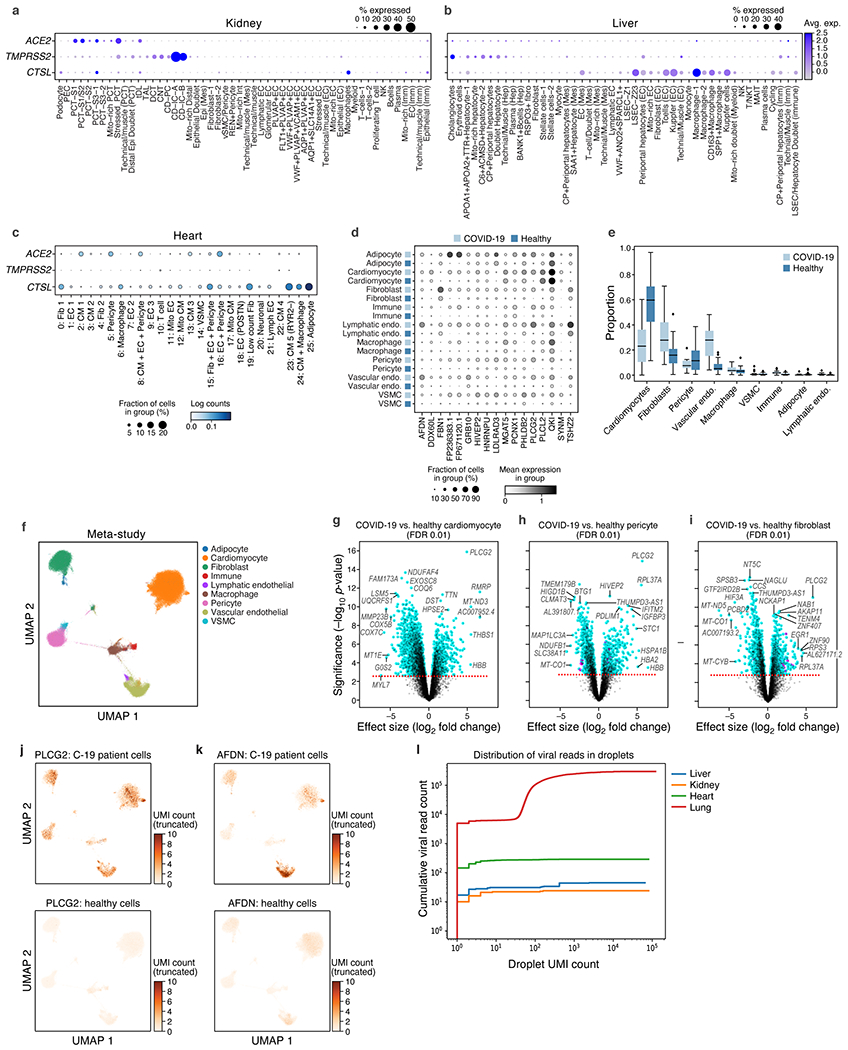
a-c. SARS-CoV-2 entry factors are expressed in kidney, liver, and heart cells. Average expression (dot color) and fraction of expressing cells (color, size) of SARS-CoV-2 entry factors (rows) across cell subsets (columns) in the kidney (a), liver (b), and heart (c). d-k. Genes and pathways differentially expressed between COVID-19 and healthy heart cells. d. Log mean expression per cell (dot color) and fraction of expressing cells (dot size) across cell types from healthy or COVID-19 heart (rows) for select genes (columns) that are differentially expressed between COVID-19 and healthy cells e. Proportions of each cell type for COVID-19 (n=15) and healthy (n=28, 2 studies) samples (boxplots: middle line=mean, box bounds=first and third quartiles,whiskers=1.5x the interquartile range, minima=smallest observed proportion, maxima=highest observed proportion). f. UMAP embedding of integrated COVID-19 and healthy snRNA-seq profiles (dots) colored by major cell types. Plot limited to a subset of 151,373 high-quality cells for visualization purposes. g-i. Cell type specific differentially expressed genes in COVID-19 vs. healthy nuclei. Differential expression (log2(fold change), x axis), and associated significance (−log10(P-value), y axis, Methods) for each gene (dot) between COVID-19 vs. healthy nuclei of cardiomyocytes (g), pericytes (h), and fibroblasts (i). Dashed line: FDR=0.01. j,k. UMAP embedding of the meta-analysis atlas (as in f) but showing only COVID-19 (top) or healthy (bottom) nuclei profiles (dots) colored by expression of PLCG2 (j) or AFDN (k). l. Low levels of viral UMIs in heart, liver and kidney, compared to lung. Cumulative viral read counts as a function of droplet UMI count. In lung (red) most viral-positive droplets are empty droplets (total UMI count ~ 100) with some viral-positive droplets which contain nuclei (UMI count > ~1,000), but in heart (green), liver (blue), and kidney (orange), most of the “viral-positive” droplets have fewer than 10 total UMI counts, suggesting these reads are not trustworthy.
Extended Data Figure 12. Expression of GWAS curated genes across lung, heart, liver and kidney atlases.
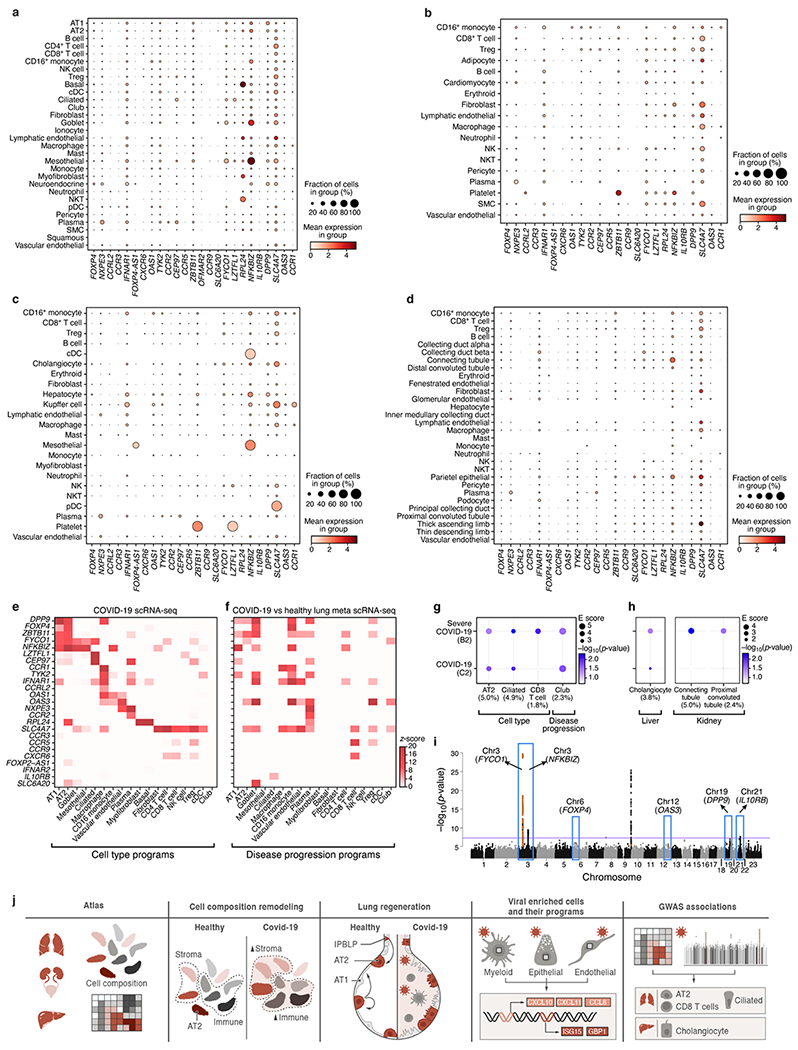
a-d. Mean expression (dot color, log(TP10K + 1)) and proportion of expressing cells (dot size) for each of 26 curated GWAS implicated genes (columns) in each cell subset (rows) for lung (a), heart (b), liver (c) and kidney (d) COVID-19 autopsy atlases. Results only reported for genes with expression in at least one cell subset in the underlying tissue. Some GWAS genes have higher expression in the lung compared to the other three tissues. e,f. Mean expression (e, z-score relative to all other cell types, color bar) or differential expression (f, z-score of DE analysis of expression in COVID-19 vs. healthy cells of the same type) of 25 out of 26 GWAS implicated genes (rows) from 6 genomic loci associated with COVID-19 (based on summary statistics data from COVID-19 HGI meta analysis45 across lung cell types (columns). ABO was not considered as it was not reliably recovered in scRNA-seq data. g-h. Cell type and disease progression gene programs in the lung (g), liver, and kidney (h) that contribute to heritability of COVID-19 severity. Magnitude (circle size, E score) and significance (color, −log10(P-value)) of the enrichment of cell type programs and cell-types specific disease programs (columns) that were significantly enriched for COVID-19 or severe COVID-19 phenotypes (rows). All results are conditional on 86 baseline-LDv2.1 model annotations. i. Nomination of single best candidate genes at unresolved GWAS significant loci by aggregating gene level information across program classes and cell types. Significance (−log10(P-value), y-axis) of GWAS association signal at locus (x-axis). Blue boxes: Significantly associated loci45 at a genome-wide significance level (purple horizontal bar). j. Schematic summarizing the key findings and contributions of this study.
Supplementary Material
Acknowledgements
We are deeply grateful to all donors and their families. This paper is part of the Human Cell Atlas (https://www.humancellatlas.org/publications/). We acknowledge the contribution of Casey Kania, Emmaline Kounaves, Nichole Lemelin, Justin Susterich, Jessica Teixeira, Claudia Bernal, Max Berstein, Allison Morris, Jordan N. Ray, Amanda Awley, Amanda Araujo and Erika Figueroa who all assisted in performing the autopsies at the Massachusetts General Hospital. We thank Ania Hupalowska and Leslie Gaffney for help with figure preparation. We thank Molly Veregge, Zachary Kramer, and Christopher Jacobs for their contributions in the execution of experimental procedures, and Dimitra Pouli who supported the creation of tissue annotation resources. We thank 10x Genomics, Illumina, BD Biosciences, and NanoString for help and support with instruments and/or lab reagents and technical advice. Portions of this research were conducted on the Ithaca High Performance Computing system, Department of Pathology, BIDMC, and the O2 High Performance Compute Cluster at Harvard Medical School. This project has been funded in part with funds from the Manton Foundation, Klarman Family Foundation, HHMI, the Chan Zuckerberg Initiative, and the Human Tumor Atlas Network trans-network projects SARDANA (Shared Repositories, Data, Analysis and Access). A.R. was an Investigator of the Howard Hughes Medical Institute. This project was also funded by DARPA grant HR0011-20-2-0040 (to D.E.I.) and the US Food and Drug Administration grant HHSF223201810172C (to P.C.S. and A.K.S.). A.-C.V. acknowledges funding support from the National Institute of Health Director’s New Innovator Award (DP2CA247831), the Massachusetts General Hospital (MGH) Transformative Scholar in Medicine Award, a COVID-19 Clinical Trials Pilot grant from the Executive Committee on Research at MGH, and the Damon Runyon-Rachleff Innovation Award. G.S. acknowledges support from the NIH R01AA0207440 and U01AA026933 research grants. A.P. acknowledges funding from the following sources U01 HG009379, R01 MH101244, R37 MH107649. We thank all members of the Department of Pathology and Cell Biology at Columbia University Irving Medical Center who led the procurement of autopsy tissues used in this work. This work was supported by National Institute of Health (NIH) grants K08CA222663 (B.I.), R37CA258829 (B.I.), U54CA225088 (B.I.), FastGrants (B.I.), and the Burroughs Wellcome Fund Career Award for Medical Scientists (B.I.). This research was funded in part through the NIH/NCI Cancer Center Support Grant P30CA013696 at Columbia University and utilized the Molecular Pathology Shared Resource and its Tissue Bank.
Competing Interests
A.R. is a co-founder and equity holder of Celsius Therapeutics, an equity holder in Immunitas, and was an SAB member of ThermoFisher Scientific, Syros Pharmaceuticals, Neogene Therapeutics and Asimov until July 31, 2020. From August 1, 2020, A.R. is an employee of Genentech. O.R.-R is an employee of Genentech as of October 19, 2020. P.Di., R.F., E.M.M., M.Ro., E.H.R., L.P., T.He., J.R., J.B., and S.W. are employees and stockholders at Nanostring Technologies Inc. D.R.Z. is a former employee and stockholder at NanoString Technologies. N.H., holds equity in BioNTech and Related Sciences. T.H. is an employee and stockholder of Prime Medicine as of Oct. 13, 2020. G.H. is an employee of Genentech as of Nov 16, 2020. R.N. is a founder, shareholder, and member of the board at Rhinostics Inc. P.C.S is a co-founder and shareholder of Sherlock Biosciences, and a Board member and shareholder of Danaher Corporation. A.K.S. reports compensation for consulting and/or SAB membership from Honeycomb Biotechnologies, Cellarity, Repertoire Immune Medicines, Ochre Bio, and Dahlia Biosciences. Z.G.J. reports grant support from Gilead Science, Pfizer, compensation for consulting from Olix Pharmaceuticals. Y.V.P. reports grant support from Enanta Pharmaceuticals, CymaBay Therapeutics, Morphic Therapeutic; consulting and/or SAB in Ambys Medicines, Morphic Therapeutics, Enveda Therapeutics, BridgeBio Pharma, as well as being an Editor – American Journal of Physiology-Gastrointestinal and Liver Physiology. G.S. reports consultant service in Alnylam Pharmaceuticals, Merck, Generon, Glympse Bio, Inc., Mayday Foundation, Novartis Pharmaceuticals, Quest Diagnostics, Surrozen, Terra Firma, Zomagen Bioscience, Pandion Therapeutics, Inc. Durect Corporation; royalty from UpToDate Inc., and Editor service in Hepatology Communications. P.R.T. receives consulting fees from Cellarity Inc., and Surrozen Inc., for work not related to this manuscript. P.T.E. is supported by a grant from Bayer AG to the Broad Institute focused on the genetics and therapeutics of cardiovascular diseases. P.T.E. has also served on advisory boards or consulted for Bayer AG, Quest Diagnostics, MyoKardia and Novartis. B.I. is a consultant for Merck and Volastra Therapeutics. All other authors declare no competing interests.
Footnotes
Code availability
All samples were initially processed using Cumulus (https://github.com/klarman-cell-observatory/cumulus), which we ran on the Terra Cloud platform (https://app.terra.bio/). Code for all other analyses is available on GitHub (https://github.com/klarman-cell-observatory/covid19-autopsy).
Supplementary Information is available for this paper.
Data availability
Processed sequencing data (sc/snRNA-Seq and bulk) are available in the Gene Expression Omnibus (GEO, https://www.ncbi.nlm.nih.gov/geo/) under accession no. GSE171668 and raw human sequencing data is available in the controlled access repository DUOS (https://duos.broadinstitute.org/), under Dataset IDs DUOS-000126, DUOS-000127, DUOS-000128 and DUOS-000129. Viral genome assemblies and short-read sequencing data are publicly available on NCBI’s Genbank and SRA databases, respectively, under BioProject PRJNA720544. GenBank accessions for SARS-CoV-2 genomes are MW885875-MW885883. Data for other tissues in the biobank will be released as they are acquired.
The processed data is available on the Single Cell Portal:
Lung - https://singlecell.broadinstitute.org/single_cell/study/SCP1052/
Heart - https://singlecell.broadinstitute.org/single_cell/study/SCP1216/
Kidney - https://singlecell.broadinstitute.org/single_cell/study/SCP1214/
Liver - https://singlecell.broadinstitute.org/single_cell/study/SCP1213/
Nanostring GeoMx raw and normalized count matrices are available on GEO under accession no. GSE163530. Raw images will be available upon request.
References
- 1.Guan W-J et al. Clinical Characteristics of Coronavirus Disease 2019 in China. N. Engl. J. Med 382, 1708–1720 (2020). [DOI] [PMC free article] [PubMed] [Google Scholar]
- 2.Puelles VG et al. Multiorgan and Renal Tropism of SARS-CoV-2. N. Engl. J. Med 383, 590–592 (2020). [DOI] [PMC free article] [PubMed] [Google Scholar]
- 3.Huang C et al. Clinical features of patients infected with 2019 novel coronavirus in Wuhan, China. Lancet 395, 497–506 (2020). [DOI] [PMC free article] [PubMed] [Google Scholar]
- 4.Xu Z et al. Pathological findings of COVID-19 associated with acute respiratory distress syndrome. Lancet Respir Med 8, 420–422 (2020). [DOI] [PMC free article] [PubMed] [Google Scholar]
- 5.Varga Z et al. Endothelial cell infection and endotheliitis in COVID-19. Lancet 395, 1417–1418 (2020). [DOI] [PMC free article] [PubMed] [Google Scholar]
- 6.Chen G et al. Clinical and immunological features of severe and moderate coronavirus disease 2019. J. Clin. Invest 130, 2620–2629 (2020). [DOI] [PMC free article] [PubMed] [Google Scholar]
- 7.Qin C et al. Dysregulation of Immune Response in Patients With Coronavirus 2019 (COVID-19) in Wuhan, China. Clinical Infectious Diseases vol. 71 762–768 (2020). [DOI] [PMC free article] [PubMed] [Google Scholar]
- 8.Hadjadj J et al. Impaired type I interferon activity and exacerbated inflammatory responses in severe Covid-19 patients. doi: 10.1101/2020.04.19.20068015. [DOI] [PMC free article] [PubMed] [Google Scholar]
- 9.Bian X-W et al. Autopsy of COVID-19 patients in China. Natl Sci Rev 7, 1414–1418 (2020). [DOI] [PMC free article] [PubMed] [Google Scholar]
- 10.Menter T et al. Postmortem examination of COVID-19 patients reveals diffuse alveolar damage with severe capillary congestion and variegated findings in lungs and other organs suggesting vascular dysfunction. Histopathology 77, 198–209 (2020). [DOI] [PMC free article] [PubMed] [Google Scholar]
- 11.Wichmann D et al. Autopsy Findings and Venous Thromboembolism in Patients With COVID-19: A Prospective Cohort Study. Ann. Intern. Med 173, 268–277 (2020). [DOI] [PMC free article] [PubMed] [Google Scholar]
- 12.Bösmüller H et al. The evolution of pulmonary pathology in fatal COVID-19 disease: an autopsy study with clinical correlation. Virchows Arch. 477, 349–357 (2020). [DOI] [PMC free article] [PubMed] [Google Scholar]
- 13.Slyper M et al. A single-cell and single-nucleus RNA-Seq toolbox for fresh and frozen human tumors. Nat. Med 26, 1307 (2020). [DOI] [PMC free article] [PubMed] [Google Scholar]
- 14.Fleming SJ, Marioni JC & Babadi M CellBender remove-background: a deep generative model for unsupervised removal of background noise from scRNA-seq datasets. bioRxiv (2019). [Google Scholar]
- 15.Li B et al. Cumulus provides cloud-based data analysis for large-scale single-cell and single-nucleus RNA-seq. Nat. Methods 17, 793–798 (2020). [DOI] [PMC free article] [PubMed] [Google Scholar]
- 16.Shaffer AL et al. Blimp-1 orchestrates plasma cell differentiation by extinguishing the mature B cell gene expression program. Immunity 17, 51–62 (2002). [DOI] [PubMed] [Google Scholar]
- 17.Martins G & Calame K Regulation and functions of Blimp-1 in T and B lymphocytes. Annu. Rev. Immunol 26, 133–169 (2008). [DOI] [PubMed] [Google Scholar]
- 18.Schupp JC et al. Integrated Single Cell Atlas of Endothelial Cells of the Human Lung. Cold Spring Harbor Laboratory 2020.10.21.347914 (2020) doi: 10.1101/2020.10.21.347914. [DOI] [Google Scholar]
- 19.Travaglini KJ et al. A molecular cell atlas of the human lung from single-cell RNA sequencing. Nature (2020) doi: 10.1038/s41586-020-2922-4. [DOI] [PMC free article] [PubMed] [Google Scholar]
- 20.Strunz M et al. Alveolar regeneration through a Krt8+ transitional stem cell state that persists in human lung fibrosis. Nat. Commun 11, 3559 (2020). [DOI] [PMC free article] [PubMed] [Google Scholar]
- 21.Kobayashi Y et al. Persistence of a regeneration-associated, transitional alveolar epithelial cell state in pulmonary fibrosis. Nat. Cell Biol 22, 934–946 (2020). [DOI] [PMC free article] [PubMed] [Google Scholar]
- 22.Choi J et al. Inflammatory Signals Induce AT2 Cell-Derived Damage-Associated Transient Progenitors that Mediate Alveolar Regeneration. Cell Stem Cell 27, 366–382.e7 (2020). [DOI] [PMC free article] [PubMed] [Google Scholar]
- 23.Ziegler CGK et al. SARS-CoV-2 Receptor ACE2 Is an Interferon-Stimulated Gene in Human Airway Epithelial Cells and Is Detected in Specific Cell Subsets across Tissues. Cell 181, 1016–1035.e19 (2020). [DOI] [PMC free article] [PubMed] [Google Scholar]
- 24.Sungnak W et al. SARS-CoV-2 entry factors are highly expressed in nasal epithelial cells together with innate immune genes. Nat. Med 26, 681–687 (2020). [DOI] [PMC free article] [PubMed] [Google Scholar]
- 25.Muus C et al. Single-cell meta-analysis of SARS-CoV-2 entry genes across tissues and demographics. Nat. Med 27, 546–559 (2021). [DOI] [PMC free article] [PubMed] [Google Scholar]
- 26.Xu J et al. SARS-CoV-2 induces transcriptional signatures in human lung epithelial cells that promote lung fibrosis. Respir. Res 21, 182 (2020). [DOI] [PMC free article] [PubMed] [Google Scholar]
- 27.Grillo F, Barisione E, Ball L, Mastracci L & Fiocca R Lung fibrosis: an undervalued finding in COVID-19 pathological series. Lancet Infect. Dis (2020) doi: 10.1016/S1473-3099(20)30582-X. [DOI] [PMC free article] [PubMed] [Google Scholar]
- 28.Vaughan AE et al. Lineage-negative progenitors mobilize to regenerate lung epithelium after major injury. Nature 517, 621–625 (2015). [DOI] [PMC free article] [PubMed] [Google Scholar]
- 29.Fernanda de Mello Costa M, Weiner AI & Vaughan AE Basal-like Progenitor Cells: A Review of Dysplastic Alveolar Regeneration and Remodeling in Lung Repair. Stem Cell Reports 15, 1015–1025 (2020). [DOI] [PMC free article] [PubMed] [Google Scholar]
- 30.Wölfel R et al. Virological assessment of hospitalized patients with COVID-2019. Nature 581, 465–469 (2020). [DOI] [PubMed] [Google Scholar]
- 31.Walsh KA et al. SARS-CoV-2 detection, viral load and infectivity over the course of an infection. J. Infect 81, 357–371 (2020). [DOI] [PMC free article] [PubMed] [Google Scholar]
- 32.Blanco-Melo D et al. Imbalanced Host Response to SARS-CoV-2 Drives Development of COVID-19. Cell 181, 1036–1045.e9 (2020). [DOI] [PMC free article] [PubMed] [Google Scholar]
- 33.Johnson NF Release of lamellar bodies from alveolar type 2 cells. Thorax 35, 192–197 (1980). [DOI] [PMC free article] [PubMed] [Google Scholar]
- 34.Grant RA et al. Circuits between infected macrophages and T cells in SARS-CoV-2 pneumonia. Nature (2021) doi: 10.1038/s41586-020-03148-w. [DOI] [PMC free article] [PubMed] [Google Scholar]
- 35.Butler D et al. Shotgun transcriptome, spatial omics, and isothermal profiling of SARS-CoV-2 infection reveals unique host responses, viral diversification, and drug interactions. Nat. Commun 12, 1660 (2021). [DOI] [PMC free article] [PubMed] [Google Scholar]
- 36.Park J et al. Systemic Tissue and Cellular Disruption from SARS-CoV-2 Infection revealed in COVID-19 Autopsies and Spatial Omics Tissue Maps. Cold Spring Harbor Laboratory 2021.03.08.434433 (2021) doi: 10.1101/2021.03.08.434433. [DOI] [Google Scholar]
- 37.Rendeiro AF et al. The spatio-temporal landscape of lung pathology in SARS-CoV-2 infection. medRxiv (2020) doi: 10.1101/2020.10.26.20219584. [DOI] [Google Scholar]
- 38.Karki R et al. Synergism of TNF-α and IFN-γ Triggers Inflammatory Cell Death, Tissue Damage, and Mortality in SARS-CoV-2 Infection and Cytokine Shock Syndromes. Cell 184, 149–168.e17 (2021). [DOI] [PMC free article] [PubMed] [Google Scholar]
- 39.Subramanian A et al. Gene set enrichment analysis: a knowledge-based approach for interpreting genome-wide expression profiles. Proc. Natl. Acad. Sci. U. S. A 102, 15545–15550 (2005). [DOI] [PMC free article] [PubMed] [Google Scholar]
- 40.Mootha VK et al. PGC-1α-responsive genes involved in oxidative phosphorylation are coordinately downregulated in human diabetes. Nat. Genet 34, 267–273 (2003). [DOI] [PubMed] [Google Scholar]
- 41.van de Sandt CE et al. Human CD8+ T Cells Damage Noninfected Epithelial Cells during Influenza Virus Infection In Vitro. Am. J. Respir. Cell Mol. Biol 57, 536–546 (2017). [DOI] [PubMed] [Google Scholar]
- 42.Short KR et al. Influenza virus damages the alveolar barrier by disrupting epithelial cell tight junctions. Eur. Respir. J 47, 954–966 (2016). [DOI] [PubMed] [Google Scholar]
- 43.Lemieux JE et al. Phylogenetic analysis of SARS-CoV-2 in Boston highlights the impact of superspreading events. Science 371, (2021). [DOI] [PMC free article] [PubMed] [Google Scholar]
- 44.Yu HH & Zallen JA Abl and Canoe/Afadin mediate mechanotransduction at tricellular junctions. Science 370, (2020). [DOI] [PMC free article] [PubMed] [Google Scholar]
- 45.COVID-19 Host Genetics Initiative. The COVID-19 Host Genetics Initiative, a global initiative to elucidate the role of host genetic factors in susceptibility and severity of the SARS-CoV-2 virus pandemic. Eur. J. Hum. Genet 28, 715–718 (2020). [DOI] [PMC free article] [PubMed] [Google Scholar]
- 46.Severe Covid-19 GWAS Group et al. Genomewide Association Study of Severe Covid-19 with Respiratory Failure. N. Engl. J. Med 383, 1522–1534 (2020). [DOI] [PMC free article] [PubMed] [Google Scholar]
- 47.Jagadeesh KA et al. Identifying disease-critical cell types and cellular processes across the human body by integration of single-cell profiles and human genetics. Cold Spring Harbor Laboratory 2021.03.19.436212 (2021) doi: 10.1101/2021.03.19.436212. [DOI] [Google Scholar]
- 48.Speranza E et al. SARS-CoV-2 infection dynamics in lungs of African green monkeys. Cold Spring Harbor Laboratory 2020.08.20.258087 (2020) doi: 10.1101/2020.08.20.258087. [DOI] [Google Scholar]
- 49.Desai N et al. Temporal and Spatial Heterogeneity of Host Response to SARS-CoV-2 Pulmonary Infection. medRxiv (2020) doi: 10.1101/2020.07.30.20165241. [DOI] [PMC free article] [PubMed] [Google Scholar]
- 50.Liu T-M et al. Hypermorphic mutation of phospholipase C, γ2 acquired in ibrutinib-resistant CLL confers BTK independency upon B-cell receptor activation. Blood 126, 61–68 (2015). [DOI] [PMC free article] [PubMed] [Google Scholar]
Associated Data
This section collects any data citations, data availability statements, or supplementary materials included in this article.
Supplementary Materials
Data Availability Statement
Processed sequencing data (sc/snRNA-Seq and bulk) are available in the Gene Expression Omnibus (GEO, https://www.ncbi.nlm.nih.gov/geo/) under accession no. GSE171668 and raw human sequencing data is available in the controlled access repository DUOS (https://duos.broadinstitute.org/), under Dataset IDs DUOS-000126, DUOS-000127, DUOS-000128 and DUOS-000129. Viral genome assemblies and short-read sequencing data are publicly available on NCBI’s Genbank and SRA databases, respectively, under BioProject PRJNA720544. GenBank accessions for SARS-CoV-2 genomes are MW885875-MW885883. Data for other tissues in the biobank will be released as they are acquired.
The processed data is available on the Single Cell Portal:
Lung - https://singlecell.broadinstitute.org/single_cell/study/SCP1052/
Heart - https://singlecell.broadinstitute.org/single_cell/study/SCP1216/
Kidney - https://singlecell.broadinstitute.org/single_cell/study/SCP1214/
Liver - https://singlecell.broadinstitute.org/single_cell/study/SCP1213/
Nanostring GeoMx raw and normalized count matrices are available on GEO under accession no. GSE163530. Raw images will be available upon request.