

Abstract
UTX/KDM6A encodes a histone H3K27 demethylase and is an important tumor suppressor frequently mutated in human cancers1. However, as the demethylase activity of UTX is often dispensable in mediating tumor suppression and developmental regulation2–8, the underlying molecular activity of UTX remains elusive. Here we show that phase separation of UTX underlies its chromatin regulatory activity in tumor suppression. A core intrinsically disordered region (cIDR) of UTX forms phase-separated liquid condensates, and cIDR loss by the most frequent cancer mutation of UTX is mainly responsible for abolishing tumor suppression. IDR deletion, mutagenesis, and replacement assays demonstrate a critical role of UTX condensation in tumor suppression and embryonic stem cell differentiation. As shown by reconstitution in vitro and engineered systems in cells, UTX recruits MLL4/KMT2D into the same condensates and enriches the H3K4 methylation activity of MLL4. Moreover, UTX regulates genome-wide histone modifications and high-order chromatin interactions in a condensation-dependent manner. We also found that UTY, the Y chromosome homolog of UTX with weaker tumor-suppressive activity, forms condensates with reduced molecular dynamics. These studies demonstrate a crucial biological function of liquid condensates with proper material states in enabling the tumor suppressive activity of a chromatin regulator.
UTX condensation suppresses cancer
The most frequent mutation of UTX in human cancers, 555* (a nonsense mutation), expresses UTX (1-554) containing the tetratricopeptide repeat domains (TPR). Moreover, 501-600 has a relatively high rate of non-synonymous mutations in cancer patients (Fig. 1a, Extended Data Fig. 1a, b). Consistent with the high disorder of the central region, our screening of UTX regions showed that 549-848, a region largely lost in 555*, had the strongest condensation propensity in vitro (Fig. 1a, Extended Data Fig. 1c). Further characterizations of 549-848 and 419-848 (to include more IDR) (Fig. 1a–c, Extended Data Fig. 1d–l, Supplementary Video 1) suggest that they formed condensates by liquid-liquid phase separation9, because (1) they formed micron-sized liquid-like droplets that exhibited spherical morphology, freely moved in solution, wet the coverslip surface, and could fuse, (2) condensation was promoted by high protein concentration and inhibited by high salt concentration, and (3) some droplets experienced “maturation” or “aging” over time9. We thus named 549-848 core IDR (cIDR). UTX formed dynamic nuclear foci as shown in Fluorescence Recovery After Photobleaching (FRAP) assays (Supplementary Video 2). The foci formation ability was lost in 1-554 and the cIDR-deleted mutant (ΔcIDR), but recovered in 1-848 (Fig. 1d, Extended Data Fig. 1m). When expressed on the same order of magnitude as the endogenous level, UTX also formed nuclear foci (Extended Data Fig. 1n, o).
Figure 1. cIDR-dependent UTX phase separation is critical for tumor suppression.

a. Top, distribution of all UTX mutations of indicated types. From cBioPortal. Bottom, disorder plot of UTX predicted by IUPred. The bottom bar indicates UTX (549-848) as cIDR.
b. Fluorescence (upper) and DIC (bottom) microscopy images of 30 μM EGFP-cIDR. Scale bar, 5 μm.
c. Fusion of three droplets formed by 30 μM EGFP-cIDR. Scale bar, 1 μm.
d. Fluorescence microscopy images of 293T cells transfected with indicated UTX constructs fused to EGFP.
e, f. Growth curves of THP-1 cells electroporated with indicated UTX constructs, shown as mean ± SD. n = 3 independent experiments.
g. FRAP recovery curves of transfected UTX (WT or HY)-mEGFP in 293T cells, as mean ± SD (n = 7 cells each).
h. THP-1 cells transduced with indicated constructs were grafted into immune-deficient mice. Bioluminescence images (inset) and signals at the indicated days are presented as mean ± SD. n = 6, 8, 7, 8, 8 mice for Vector, WT, ΔcIDR, ΔTPR, UTX-eIF(IDR), respectively.
i. A diagram summarizing the structure, nuclear foci, and tumor suppressive activity (TS) of the indicated UTX proteins.
j. Heatmap for expression of 1,271 genes significantly changed by WT from vector in THP-1 cells transduced with indicated constructs (two samples each).
Statistical analyses are for the last time point. P values by two-sided t-test for all.
THP-1 cells are an acute myeloid leukemia (AML) cell line in which UTX was deleted and UTY expression was silenced2. Introduction of UTX WT, but not 1-554, formed nuclear foci in THP-1 cells and potently suppressed their growth. Strikingly, 1-848 and 1-1086, which regained cIDR, also regained the foci and tumor suppressive activity, indicating that cIDR loss is largely responsible for inactivation of UTX 555* in those patients. UTX ΔcIDR failed to show significant suppression, and inactivation of the demethylase activity (MT2 mutant) did not have any effect (Fig. 1e, Extended Data Fig. 2a,b). Similar results were obtained in MiaPaca2 cells, a UTX-deleted pancreatic cancer cell line3 (Extended Data Fig. 3g). UTX with cIDR mutations of cIDR-enriched to -depleted amino acids, including all 47 Ser to Tyr (SY) or Ile (SI), or all 27 Asn to Tyr (NY), all failed to form nuclear foci and largely lost the tumor suppressive activity (Fig. 1f, Extended Data Fig. 2d–g). Mutation of all 16 His to Tyr (HY) partially but significantly weakened the tumor suppressive activity. HY formed brighter foci than WT, but recovered slower and less completely in FRAP assays (Fig. 1f,g, Extended Data Fig. 2f–h). Purified cIDR (HY) had remarkably enhanced condensation propensity, but also significantly reduced molecular dynamics and diffusion rate as measured by FRAP and Line Raster Image Correlation Spectroscopy (RICS) assays, respectively (Extended Data Fig. 2i–n). These results are consistent with the notion that reduced dynamicity impairs molecular activity of a phase-separated gene regulator10. We then replaced UTX cIDR with unrelated IDRs known to form liquid-like condensates (from AKAP95IDR, FUSIDR, and eIF4GIIIDR, shortened as eIFIDR) or fiber-like aggregates (from Lsm4IDR)10,11. Compared to UTX ΔcIDR, all of these chimeras restored the nuclear foci formation, and AKAP95IDR and eIF4GIIIDR largely restored the leukemia suppressive activity ability (Fig. 1h,i, Extended Data Fig. 3a–f). UTX-FUSIDR had little effect on leukemia but strongly suppressed growth and in vivo tumorigenicity of pancreatic cancer (Extended Data Fig. 3e,g,h). cIDR deletion did not affect interaction of UTX and the MLL3/4 complexes (known to be mediated by TPR7) (Extended Data Fig. 3i, 7d). RNA-seq analysis (Supplementary Table 1) showed that UTX WT expression in THP-1 cells induced genes enriched in immune and inflammatory response pathways known to be cancer-inhibitory, and repressed genes in pro-tumorigenic glycolysis (also a major target suppressed by MLL412) and signaling pathways (Fig. 1j, Extended Data Fig. 3j,k). ΔcIDR failed to efficiently induce or repress many of those genes, which was rescued by UTX-eIFIDR. The catalytically inactive mutant (MT2) had nearly full capacity in eliciting expression changes seen in WT (Fig. 1j, Extended Data Fig. 3l–o). UTX mutant lacking TPR (ΔTPR) was completely inactive in suppressing leukemia and pancreatic cancers and in mediating a tumor suppressive gene program (Fig. 1h,j, Extended Data Fig. 3a,b,e,f–h,l). Taken together (Fig. 1i), our results establish an essential role of UTX condensation and TPR domain for orchestrating the tumor suppressive gene expression program.
UTX condensation regulates stem cells
To determine if endogenous UTX forms condensates that play a physiological role, we turned to mouse embryonic stem cells (ESCs), a physiologically relevant model given the role of UTX in many developmental pathways including stem cell fate transitions and its causative mutations in Kabuki syndrome4,5,7,13. mEGFP-tagged endogenous UTX showed discrete and dynamic nuclear puncta (Fig. 2a, b, Extended Data Fig. 4a–c), indicating that the endogenous UTX forms liquid-like condensates in live cells. We then generated Utx knockout (KO) clones and two Utx ΔcIDR clones, in which Utx was in-frame rejoined after cIDR deletion, and further tagged the endogenous Utx ΔcIDR with mEGFP (Extended Data Fig. 4d–m). Compared to WT, the endogenous UTX ΔcIDR appeared to be more fuzzy or diffuse and less granular, with less focal enrichment (Extended Data Fig. 4n,o), suggesting that cIDR of the endogenous UTX facilitates UTX condensation. UTX is dispensable for ESC maintenance but required for differentiation (especially for mesoderm)4,5,14. Indeed, our KO and ΔcIDR clones showed similar morphology and self-renewal as WT ESCs. However, later in the embryoid body (EB) differentiation assays, while the WT EBs spread out to adopt more differentiated morphology, the KO and ΔcIDR EBs largely retained the tight EB morphology (Fig. 2c). RNA-seq (Supplementary Table 2) showed that, in ESCs and late EBs, the KO and ΔcIDR clones had significantly overlapped genes that were down-or up-regulated, as compared to the corresponding WT ESCs or EBs. The downregulated genes by KO and ΔcIDR were enriched in stem cell differentiation, especially for mesoderm pathways (Fig. 2d, Extended Data Fig. 4p,q). Our data show that the endogenous UTX condensation plays an important role in a physiologically relevant process.
Figure 2. Endogenous UTX condensation regulates ESC differentiation.

a. Representative confocal images of endogenous mEGFP-UTX in live ESCs.
b. Normalized fluorescence recovery of mEGFP-UTX signals in ESCs by FRAP assays, as mean ± SD of n = 13 cells. Photobleaching at t = 0.
c. WT and genomically edited Utx KO and ΔcIDR ESCs in EB differentiation assays.
d. Venn diagrams for genes down (↓)- or up (↑)-regulated by KO or ΔcIDR (two clones) compared to WT ESCs. From RNA-seq of two 2 independent differentiation assays. P values by two-sided Fisher’s exact test.
Co-condensates enrich enzyme activities
Upon light-activated Cry2 self-association in the OptoDroplet system15, the UTX-binding MLL4 (4507-4996)16 [MLL4C(N), Extended Data Fig. 5a] fused to mCherry-Cry2 formed weak condensates, but formed strong co-condensates with co-transfected UTX-GFP. However, when the co-transfected UTX missed cIDR or TPR, neither UTX nor MLL4C(N) formed condensates upon light. On the other hand, light-activated UTX-mCherry-Cry2 formed foci, and co-foci with the co-transfected MLL4C(N), but not if UTX missed cIDR or TPR (Fig. 3a, Extended Data Fig. 5b–d, Supplementary Videos 3–5). We then used a cell line harboring a genomic Lac operator (LacO) array, which can directly recruit many copies of LacI-fused protein17. We constructed mCherry linked to MLL4fusion (MLL4f), which contains MLL4 PHD4-6 and 4507-5537 (Extended Data Fig. 5a)18. GFP-LacI, UTX ΔcIDR-, and UTX ΔTPR-LacI were diffuse in nucleus but formed a hub at the LacO array. UTX WT-LacI formed numerous nuclear foci and a large and bright LacO hub. MLL4f was diffuse when co-transfected with GFP-LacI or ΔcIDR/ΔTPR-LacI, but formed LacO-unrelated co-foci with WT-LacI. WT- and ΔcIDR-LacI, but not GFP/ΔTPR-LacI, recruited MLL4f to the LacO hub. However, ΔcIDR-LacI was significantly less efficient than WT-LacI in recruiting MLL4f to the hub after normalization to the UTX level in the hub (Fig. 3b). We also performed this assay for the ZF1 domain-containing p300 (251-550), as UTX regulates chromatin transcription by coordinating both MLL4 and the H3K27 acetylase p3002,3,18, and the ZF1 domain of p300 directly binds to TPR of UTX19. We saw very similar, albeit weaker, effects as compared to MLL4f with UTX (Extended Data Fig. 5e). These results suggest that UTX facilitates local enrichment of its interacting proteins to chromatin sites by co-condensation. When purified MLL4C(N) at a non-condensing concentration was mixed with UTX (1-848) or (419-848), it formed well-overlapped co-condensates with 1-848, but not 419-848 (Extended Data Fig. 6a–c). At elevated concentrations, while the 419-848 condensates largely co-localized with the MLL4C(N) condensates, they occupied separate domains within each condensate. When 1-848 was further added, these proteins formed nearly completely merged co-condensates through interactions among specific regions (Extended Data Fig. 6d–f). Similarly, p300 (251-550) at a non-condensing concentration formed completely overlapped co-condensates with UTX (1-848). It formed patchy co-condensates with UTX (419-848), until further addition of UTX (1-848) made all proteins completely overlap in the co-condensates (Extended Data Fig. 6g,h). Together with the cell-based assays above, these results suggest that UTX and its key interaction proteins form co-condensates through the specific and direct interaction through TPR of UTX.
Figure 3. Co-condensation of UTX and MLL4 enriches histone modification activities.
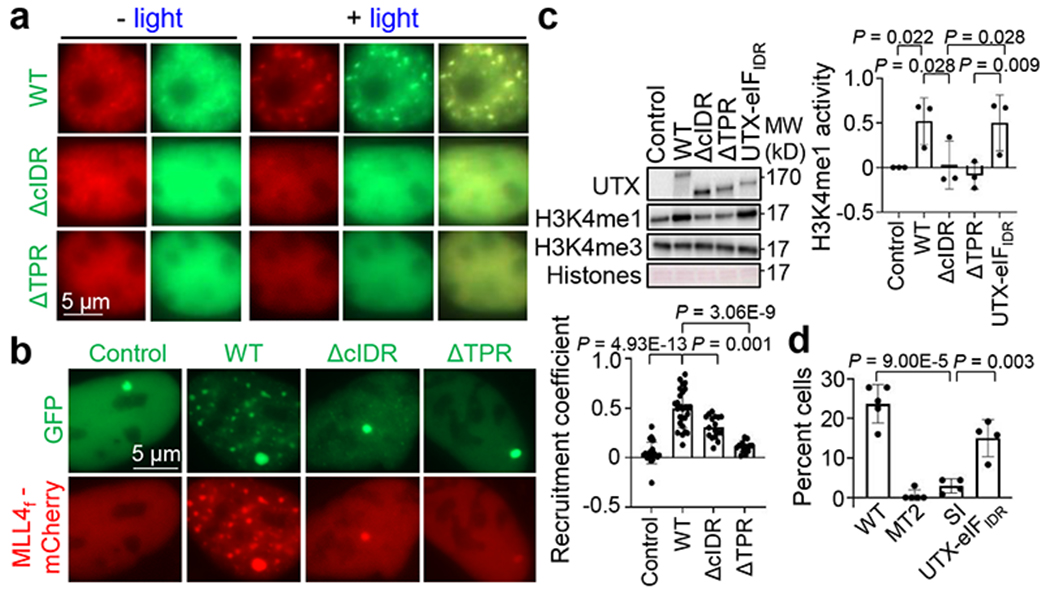
a. Confocal images of 293T cells expressing both MLL4C(N)-mCherry-Cry2 and UTX (WT or indicated mutant)-EGFP, before and after light activation.
b. Fluorescence microscopy images of LacO-cells co-transfected with MLL4f-mCherry and EGFP-LacI (control) or UTX (WT or mutant)-EGFP-LacI. Right, normalized recruitment coefficients of MLL4f, as mean ± SD. n = 22, 27, 17, 15 cells for control, WT, ΔcIDR, and ΔTPR, respectively.
c. Representative results of in vitro HMT assays using the indicated UTX WT or mutant pulldowns. Left, immunoblotting by indicated antibodies. Right, normalized H3K4me1 activity, as mean ± SD. n = 3 independent experiments.
d. Quantification of percentage of cells showing H3K27me3 decrease after transfection of indicated UTX constructs, as mean ± SD. n = 4 independent experiments for WT and MT2, and 5 for the others each.
P values by one-way ANOVA followed by Tukey’s post hoc test for all.
To study the biochemical impact of UTX condensation, we affinity pulled down FLAG-UTX (WT, 555*, or ΔcIDR)-GFP from mammalian cell nuclear extracts. Containing a sub-endogenous UTX concentration, the WT, but not the ΔcIDR, pulldown formed condensates (Extended Data Fig. 7a–c). Compared to WT, the 555* and ΔcIDR pulldowns contained similar amount of UTX and MLL3/4 complexes. However, WT and UTX-eIFIDR, but not 555* and ΔcIDR, pulldown exhibited robust activity in mono-methylating H3K4 in vitro (Fig. 3c, Extended Data Fig. 7e–f). While the nuclear extract-derived mCherry-MLL4f at a low concentration did not show condensation on its own, it formed co-condensates with the UTX condensates when mixed with UTX WT but not ΔcIDR pulldown (Extended Data Fig. 7g,h). These results suggest that MLL4 was incorporated into the UTX condensates and drove robust histone methylation. Cells overexpressing UTX WT, but not the catalytic dead mutant (MT2), frequently showed reduced global H3K27me3 level in cells. UTX SI was ineffective in reducing cellular H3K27me3, which could be rescued by UTX-eIFIDR (Fig. 3d, Extended Data Fig. 7i,j). Therefore, UTX condensation facilitate H3K27 demethylation in cells.
Condensates control chromatin activities
We next studied how UTX condensates regulate genomic histone modifications in THP-1 cells expressing various UTX constructs. We identified 15,554 UTX WT-binding sites, which were mostly in intergenic and intronic regions and highly overlapped with active chromatin modifications. UTX ΔcIDR had reduced total number of binding sites and reduced signal intensities at the normal UTX (WT)-binding sites, but also bound to many aberrant sites unoccupied by WT (Extended Data Fig. 8a–d, Supplementary Table 3). UTX condensation thus governs the efficient and correct binding of UTX to the genome. Compared to cells with vector, WT restored the normal chromatin states by both enhancing histone modifications including H3K4me1, me2, me3, H3K27ac, H3K27me3, and MLL4 binding at many loci, and also suppressing them in other loci. Importantly, both sides of these WT-elicited effects tended to be abolished or diminished by ΔcIDR, and partially restored by the catalytic inactive mutant (MT2) (Fig. 4a,b, Extended Data Fig. 8e–k). PRO-seq analysis showed that UTX increased and decreased association of elongation-competent RNA polymerase at different subsets of UTX-bound enhancers, and ΔcIDR tended to reduce or rescind these changes in enhancer bidirectional transcription (Extended Data Fig. 8l,m). These results support a critical role of UTX condensation in mediating its activity in regulating genome-wide chromatin modifications and transcriptional activities.
Figure 4. UTX condensates regulate genome-wide chromatin activities.

a, b. Left, scatter plot for H3K4me1 (a) or H3K27ac (b) signal level change in cells indicated on the x and y axes for all 15,554 UTX-binding sites. Black dashed line indicates the linear fit with correlation coefficient (r) labeled. Right, composite plot for indicated histone modification signals centered at UTX binding sites in indicated cells.
c. Scatter plots for DCI scores at promoters of all 26,237 genes from H3K4me3 HiChIP comparing cells indicated on the x and y axes. Red and blue dots represent 936 and 866 genes with DCI of WT over vector > 5 and < −5, respectively. Details in Supplementary Table 5.
d. Box plots for DCI scores comparing cells indicated on x axis for genes represented by the red (left) and blue (right) dots from (c). Data are median (horizontal line), 25–75th percentiles (box) and 1.5 times the interquartile range recorded (whiskers). P values are shown for data significantly greater or less than 0 by two-sided one sample t-test. Left, n = 936 genes, right, n = 866 genes.
We then performed H3K4me3 and H3K27ac HiChIP20,21 in THP-1 cells expressing various UTX constructs, and generated long-range interaction (loop) maps with high-resolution around the active and poised transcription start sites (TSSs) and active enhancers (Extended Data Fig. 9a,b, Supplementary Table 4). Loss of UTX or cIDR resulted in partial loss of normal loops found in WT-expressing cells, but also gain of aberrant loops not found in WT. Compared to the WT-expressing cells, the normalized reads per loop were significantly lower in cells expressing empty vector, ΔcIDR, or ΔTPR, but largely similar to UTX-eIFIDR, suggesting that the cIDR-dependent UTX condensation and TPR are important for maintaining the chromatin interaction intensity (Extended Data Fig. 9c,d). In other words, the diffused UTX ΔcIDR mutant appeared to cause more dispersed chromatin interactions. We then calculated the Differential Chromatin Interaction (DCI) scores to quantitatively determine how a specific genomic region differs between two samples for its collective interactions with other regions on the chromatin22. Compared to the vector, WT expression in THP-1 cells both enhanced and reduced chromatin interactions at different genomic sites. Importantly, expression of ΔcIDR or ΔTPR tended to reduce these chromatin interaction changes, and UTX-eIFIDR could partially remedy these changes (Fig. 4c,d, and Extended Data Fig. 9e,f). Genes upregulated by WT had significantly higher chromatin interactions with its surrounding genomic regions, a trend also true for genes altered by ΔcIDR or ΔTPR compared to WT, and for genes altered by UTX-eIFIDR compared to ΔcIDR (Extended Data Fig. 9g, Supplementary Table 5). Genes with enhanced promoter chromatin interactions in WT over vector-expressing cells were enriched with stress response and immune response genes known to be cancer-inhibitory. Genes with reduced chromatin interactions in WT were enriched with ribosomal biogenesis and cell division genes (Extended Data Fig. 9h). BART3D analysis22 showed that sites with increased chromatin interactions in WT cells were likely to be bound by key hematopoietic/immune transcription factors, and that sites with decreased interactions bound by transcriptional co-repressors (Extended Data Fig. 9i,j). UTX thus may coordinate with immune cell transcription factors to enhance, and with transcriptional co-repressors to reduce, chromatin interactions. As ΔcIDR was inefficient to achieve these chromatin interaction changes, these data support that UTX condensates regulate dynamic changes of chromatin interactions, including promoting looping and expression of tumor-suppressive genes while suppressing looping and expression of oncogenic genes.
We also show integrated analysis for a number of example genes, many of which are interferon-mediated anti-survival or immune response genes that were upregulated by UTX WT but less efficiently by ΔcIDR and ΔTPR in THP-1 cells (Extended Data Fig. 10a). Lack of UTX or expression of the UTX ΔcIDR or ΔTPR mutant often not only reduced or abolished normal chromatin loops seen in WT or UTX-eIFIDR-expressing cells, but also caused aberrant loop formation (Extended Data Fig. 10b). The chromatin interactions within MX2-1 and OAS1-3-2 clusters may allow their coordinated regulation by UTX condensates. HK2, on the other hand, is a key glycolysis gene repressed by WT but not by ΔcIDR or ΔTPR (Extended Data Fig. 10a). UTX WT normally repressed chromatin interactions between its TSS and upstream distal enhancers (and favor intragenic enhancer looping), such repression was lost in cells lacking UTX or expressing ΔcIDR or ΔTPR (Extended Data Fig. 10b). These results indicate an important role of UTX condensation in instructing efficient chromatin interactions at the correct genomic sites.
UTY alters condensate properties
UTX is one of a few tumor suppressors that escape X-inactivation and substantially contribute to the male predominance in cancer23. UTY is less tumor-suppressive than UTX24, based on genetic analyses of human cancer23 and experimental data2,3,25. We showed that UTY indeed had substantially weaker leukemia-suppressive activity than UTX, and deletion of the UTY cIDR (498-795) also reduced its activity. Replacing the cIDR of UTX with that of UTY, resulting in UTX-UTYIDR, significantly reduced the activity. Reciprocally, replacing the cIDR of UTY with that of UTX significantly albeit modestly improved its activity compared to UTY (Fig. 5a, Extended Data Fig. 11a). Therefore, cIDR is an important determinant of the tumor suppressive activity of UTX/Y, with possible contributions from other regions. In addition to having more aromatic residues, the UTY, but not UTX, cIDR has abundant blocks of oppositely charged residues known to promote phase separation9 (Extended Data Fig. 11b,c). UTY cIDR thus may have a stronger phase separation ability, as initially hinted by the coagulation tendency of UTY, but not UTX, cIDR-bound resins. Indeed, purified UTY cIDR exhibited much higher turbidity, higher ability to pellet after centrifuge, and formed condensates at a lower protein concentration and higher salt concentration. Moreover, UTX-UTYIDR displayed brighter foci with significantly higher partition coefficient than UTX in cells (Fig. 5b–d, Extended Data Fig. 11d–h). UTY cIDR condensates had markedly reduced dynamics in vitro (Fig. 5e, Supplementary Video 6). UTX cIDR displayed largely constant diffusion coefficient over time of phase separation, whereas UTY cIDR significantly reduced the diffusion coefficient. Hence, UTY cIDR exhibited significantly slower diffusion than UTX cIDR at all times, with more substantial difference at later time of phase separation (Fig. 5f, Extended Data Fig. 11i,j). UTX-UTYIDR also had slower dynamics than UTX in cells (Fig. 5g, Extended Data Fig. 11k). UTY cIDR thus adopts a more solid-like material state with reduced dynamics, which may contribute to its weakened tumor suppressive activity. Moreover, our attempts in studying missense mutations in UTX cIDR found that condensation was modestly enhanced by certain cancer patient-derived missense mutations, S781Y and S814F individually, and greatly enhanced by a compound missense mutation (5M). S781Y and 5M also exhibited “aged” (hardened) morphologies compared to WT, and all of these three mutations significantly reduced condensate dynamics and diffusion rates at later times of phase separation (Extended Data Fig. 12).
Figure 5. UTY is a weaker tumor suppressor with altered condensate properties.

a. Growth curves of THP-1 cells electroporated with indicated constructs, shown as mean ± SD. n = 4 independent experiments. Statistical analyses for the last time point.
b. Turbidity, as shown by pictures and OD600, of 30 μM mEGFP, mEGFP-UTX cIDR, or-UTY cIDR. OD600 is presented as mean ± SD. n = 3 independent experiments.
c, d. Representative fluorescence images of 293T cells transfected with UTX or UTX-UTYIDR fused to EGFP (c). d. Partition coefficient for the top 3 brightest GFP foci in each randomly selected cell. n = 10 cells for UTX, and 17 cells for UTX-UTYIDR.
e. FRAP of 50 μM mEGFP-UTX cIDR or -UTY cIDR, at early (5’-40’) and late (120’-160’) times in condensation. Left, representative images of early droplets at indicated time points (photobleaching at 0). Right, recovery curves as mean ± SD. n = 5 UTX droplets and 6 UTY droplets. Scale bar, 2 μm.
f. Left, scatter plot of mEGFP-UTX or UTY cIDR diffusion coefficients in droplets in vitro by Line RICS assays, over time in condensation. Right, bar plot for mean ± SD of the diffusion coefficients at early (< or = 100 min) or late (> 170 min) times. n = 8 UTX droplets and 9 UTY droplets.
g. FRAP of transfected UTX or UTX-UTYIDR fused to EGFP in 293T cells. Recovery curves as mean ± SD. Statistics between the two samples at different time points. The half time of recovery is shown as mean ± SD. n = 8 cells for UTX, and 9 cells for UTX-UTYIDR.
h. A diagram showing the impact of condensation and the different material properties of the UTX WT, cancer mutant, and UTY on the activities in tumor suppression.
*P<0.05, **P<0.01, by two-sided t-test for all.
Discussion
Our data here unveil phase separation as a crucial property of UTX for its activity in tumor suppression and ESC differentiation. UTX cIDR is required for tumor suppression, but other regions may regulate UTX condensation, and properties other than condensation may also contribute to the full activity of UTX. Our data suggest that UTX critically enhances the catalytic activity of the associated MLL4 by condensing MLL4 into micro-compartments on chromatin. This provides a biophysical basis for the intimate link of UTX and MLL3/4 in cancer and developmental disorders26, and for the genetic requirement of UTX for enhancing H3K4me11,18,27. Regions of MLL4 and p300 achieve more efficient partition into the co-condensates together with UTX through the direct interaction of UTX TPR. It is likely that the full-length MLL3/4 and p300 as well as transcription factors, all with intrinsic condensation ability28–30, closely coordinate with UTX in forming robust and liquid-like micro-compartments on chromatin to ensure optimal activity. The importance of condensation for intracellular H3K27 demethylation by UTX suggests that UTX condensation likely also plays a role in biological processes that require its catalytic activity, including promoting certain leukemia31 and epigenetic reprogramming in cell fate transitions13,32,33. UTX both promotes and represses various histone modifications and long-range chromatin interactions at different genomic regions, all in a manner that requires cIDR-mediated condensation and the TPR domain. UTX condensation thus ensures efficient and correct chromatin modifications and interactions to orchestrate a proper tumor suppressive transcriptional program.
In addition to being less tumor-suppressive than UTX, UTY may be less active in regulating development as well, as no UTY mutations has been reported in Kabuki syndrome, and males are more severely affected than females in Kabuki syndrome with UTX heterozygous mutations24,34. Our data indicate that cIDR is an important determinant of the differential tumor suppressive activity. The slower diffusion of UTY cIDR, UTX cIDR (HY), and cancer-associated UTX cIDR missense mutants (to aromatics) in the condensates may reduce the interaction efficiency of molecules in chromatin modifications and ultimately lead to an inefficient tumor suppressive gene program (Fig. 5h). UTX thus seems to have evolved a proper sequence feature for a balanced condensation ability and material state to ensure its optimal physiological activities. These findings echo our previous studies showing that perturbing the condensate properties of a gene regulator impairs its activity in tumorigenesis10.
Methods
Cells
THP-1 cells were previously described35. MiaPaca2, COS-7, and LacO array-containing U2OS (U2OS-LacO-TRE) cells were kind gifts from Kimberly Kelly, Jung-Bun Shin, Todd Stukenburg, respectively, all at the University of Virginia. THP-1 cells were cultured in RPMI1640 (ThermoFisher Scientific) supplemented with 10% fetal bovine serum (FBS, Thermo Fisher Scientific). MiaPaca2, HeLa (ATCC CCL-2), HEK 293 (ATCC CRL-1573), 239T (ATCC CRL-3216), COS-7, Flp-In T-REx 293 (ThermoFisher Scientific) cells were cultured in DMEM (ThermoFisher Scientific) supplemented with 10% FBS. U2OS-LacO-TRE cells were cultured in DMEM Glutamax medium (ThermoFisher Scientific) with 10% FBS. Certificate of Analysis of these cell lines were provided by the vendors. We froze down stocks upon receiving the cell lines, and experiments were conducted on cells that have been passaged no more than 10 times. Cells were examined every half-1 year for possible mycoplasma contamination using the Universal Mycoplasma Detection Kit from ATCC (ATCC® 30-1012K™) and were found negative.
The mouse ES cell E14TG2A was previously described36, and cultured on 0.1% gelatin-coated tissue-culture plates in complete ES growth medium (knockout DMEM [ThermoFisher Scientific] supplemented with 15% ES-certified FBS [Omega Scientific], 2 mM L-glutamine, 0.1 mM nonessential amino acids, 0.1 mM 2-mercaptoethanol, and recombinant LIF) without irradiated murine embryonic fibroblasts.
Utx-KO and ΔcIDR clones were generated by CRISPR-Cas9 technology. Briefly, The CRISPR RNA (crRNA) target sequences were selected and synthesized using the Alt-R CRISPR-Cas9 System by IDT (https://www.idtdna.com/pages/products/crispr-genome-editing/alt-r-crispr-cas9-system). All CRISPR-related oligo information is in Supplementary Table 6. 1 μM crRNA was hybridized with 1 μM Alt-R CRISPR-Cas9 tracrRNA in 95°C for 5 minutes to form crRNA-tracrRNA duplex. The duplex (one for Utx-knockout and two flanking mouse cIDR genomic regions for Utx-ΔcIDR) and 1 μM Cas9 nuclease were then introduced into 105 mouse ES cells through electroporation using Lonza 4d Nucleofector electroporator. Electroporated cells were cultured for 48 hours, then cells were trypsin treated and single cell were cultured in 96-well plate for colony formation. DNA of each clone was extracted. PCR assays were then performed and sequenced. For Utx-KO clones, frameshifted clones were selected and further validated. For Utx-ΔcIDR clones, cIDR-deleted and Utx in-frame rejoined clones were selected and further validated.
To tag the endogenous Utx with mEGFP, oligos coding for gRNA targeting the N-terminus of UTX-coding region were cloned into pU6-(BbsI)_CBh-Cas9-T2A-mCherry (Addgene #64324). Fragment composed of FLAG-tagged mEGFP flanked by 800 bp homology arms on each side was inserted into pUC19 vector as donor plasmid. Two million ES cells were electroporated with 2 μg gRNA plasmid and 2 μg linearized donor plasmid using Lonza nucleofector. Four days after transfection, cells were sorted on GFP signals. About 8000 to 11000 GFP-positive cells were serially diluted in 6-well plates and colonies were picked 4 days later and transferred to 96-well plates. Colonies were then expanded and harvested for validation.
For ES cell differentiation, cells were diluted to 30000 cells/ml in differentiation medium (complete growth medium without LIF) and 20 μl drops were arranged at the inner surface of the lid of a Petri dish for hanging drop culture for 2 days. EB aggregates were then transferred to non-tissue culture plate for further culture in differentiation medium. The morphology of EBs was checked every day. At indicated time points, cells were harvested for RNA-seq.
Constructs
We initially designed primers to clone different regions of UTX, 300 amino acids each (designated regions 1-5) from the beginning of the largest isoform of UTX (isoform 1, 1453 amino acids). However, our cloning efforts using multiple mammalian cell cDNAs consistently ended up with isoform 3 (NM_021140, encoding NP_066963), which has the total length of 1401 amino acids and differs from isoform 1 in lacking 52 residues of region 2. Hence UTX regions 1-5 as residues 1-300, 301-548, 549-848, 849-1148, and 1149-1401 were cloned and sequenced to be identical to reference sequence NM_021140.3. Since this is major isoform of UTX37, we thereafter only studied this isoform in our work.
Some UTX expressing plasmids were purchased from Addgene (#17438, pCS2-UTX-F; #40619, pCS2-UTX-F-MT2, catalytic inactive with Histidine 1146 and Glutamic Acid 1148 to Alanine; #40617, pCDH-UTY-F,). All pCS2-based constructs in this study have N-terminal SV40 nuclear localization signal (NLS) and 6xMyc tag as well as a C-terminal FLAG tag. UTX was also cloned into pcDNA5/FRT/TO (pcDNA5, ThermoFisher Scientific) with an N-terminal FLAG-HA-(FH-) tag. Some constructs have EGFP (Enhanced Green Fluorescent Protein), mEGFP (monomeric EGFP, with A206K mutation of EGFP), or mCherry fused at the C-terminus as indicated. Truncation mutants were generated by PCR cloning. Mutants of the cIDR were synthesized (Biomatik USA, LLC, Delaware, USA). To generate chimeric constructs, human FUS (1-237), AKAP95 (101-210), and UTY (498-795), and yeast eIF4GII (13-97) and Lsm4 (91-187) sequences were cloned from the cDNAs of human HEK 293 cells and yeast Saccharomyces cerevisiae, respectively, and inserted at the KpnI site in the UTX ΔcIDR construct. For viral transduction, UTX WT and mutants were cloned into Tet-inducible lentiviral vector pInducer20 (Addgene # 44012). To generate mCherry-MLL4fusion, cDNAs encoding MLL4 (1358-1572) and (4507-5537) regions were PCR amplified from HEK293 cells, and cloned into pcDNA5/FRT/TO with mCherry and a c-MYC NLS. For protein expression in bacteria, different UTX regions were cloned into pET28-MBP-TEV vector (Addgene: #69929) as MBP-fusion downstream of the TEV cleavage site, and were used only for the initial screening of regions undergoing phase separation. For all other protein expression studies in this paper, the corresponding cDNAs were cloned into pET28a with N-terminal tags of 6xHis and EGFP, mEGFP, or mCherry as indicated, and also with additional C-terminal FLAG tag for UTX (1-848) and MLL4C(N) to allow two-tag sequential purification. For OptoDroplet assay, mCherry-Cry2 cDNA was amplified from pcDNA5-borealin-mcherry-Cry2 vector (a gift from Todd Stukenberg) and inserted after UTX or MLL4C(N) in pcDNA5/FRT/TO. For LacO array assay, LacI cDNA was amplified from pDF287 vector (a gift from Todd Stukenburg) and inserted after UTX-EGFP in pcDNA5/FRT/TO. The sequences of all plasmids were confirmed by Sanger sequencing.
Antibodies
Rabbit monoclonal anti-UTX, Cell Signaling 33510, vendor information indicates that the immunogen is a recombinant protein surrounding Ala490 of human UTX, and our data confirmed that it reacts with the UTX region between 419 and 548. Rabbit polyclonal anti-MLL4, Sigma HPA035977 (immunoblotting); Santa Cruz Biotec. sc-293217 (ChIP); Rabbit polyclonal anti-MLL3, a gift from Kai Ge; Mouse monoclonal anti-GAPDH, Millipore MAB374; Rabbit monoclonal anti-H3K4me3, Millipore 05-745R; Rabbit polyclonal anti-H3K27me3, Millipore 07-449; anti-H3K27ac, Abcam ab4729; anti-H3K4me2, Millipore 07-030; anti-H3K4me1, Abcam ab8895; Rabbit polyclonal anti-RBBP5 and -WDR5, Bethyl Laboratory A300-109A and A302-429A, respectively; Mouse monoclonal anti-c-Myc (9E10), ThermoFisher Scientific, 132500; Mouse monoclonal anti-FLAG M2 Affinity agarose, Sigma, A2220; Alexa Fluor 555 conjugated goat anti-rabbit IgG, ThermoFisher Scientific A-21428; Alexa Fluor 488 conjugated goat anti-mouse IgG, ThermoFisher Scientific A-11001.
Virus preparation and transduction
The pInducer20-based lentiviral vectors or a control plasmid pCDH-CMV-MCS-EF1α-Neo (System Biosciences, Cat# CD514B-1, Palo Alto, CA) together with psPAX2 and pMD2.G envelope plasmid at a ratio 4:3:1 were transfected into 293T cells using Lipofectamine 3000 (Thermo Fisher). Six to eight hours later, cells were washed once with PBS and fresh growth medium was added. The viral supernatant from 36-hour post-transfection was 30-fold concentrated by PEG6000 precipitation, then aliquot and stored at −80°C.
For THP-1 cell transduction, 1 × 10⁶ THP-1 cells were transduced with 500 μl of 30-fold concentrated lentivirus through spin-inoculation at 25°C at 2200 rpm for 2 hours each for 3 times with 24 hours interval, and were cultured with 500 μg/ml of G418 (Invivogen) for selection for 12-14 days. For MiaPaca2 cell transduction, 500 μL 30-fold concentrated lentivirus with 500 μl fresh medium were added to 2 × 10⁵ MiaPaca2 cells cultured in 6-well plates for 24 hours. Another two infections were conducted 24 hours and 48 hours after the initial transduction. Cells were cultured with 800 μg/ml G418 for selection for 8-10 days.
Cell growth, colony formation assays
THP-1 cells (4 × 10⁵) were transfected with pCS2-based plasmids via electroporation as indicated using a Lonza 4D-Nucleofector. 24 hours post electroporation, 5 × 10⁴ or 1 × 10⁵ live THP-1 cells were sub-cultured in 24 well plate. Cell number was manually counted at indicated days after electroporation.
For THP-1 cell colony formation assay, 3000 transduced THP-1 cells were plated in 6-well soft-agar plate. Fresh media with 100 ng/ml of doxycycline was added on top of the agar every other day. Twenty days later, colonies were imaged under microscope with 2x lens. Colony number was counted manually, and colony size was measured by ImageJ.
For MiaPaca2 colony formation assays, 2000 transduced MiaPaca2 cells were cultured in the presence (or absence when indicated) of 100 ng/ml doxycycline in a 12-well plate. After 7 days of culture, cells were fixed with 4% formaldehyde and stained with 0.1% crystal violet solution. 300 μl of 10% acetic acid was add to each well to elude crystal violet. Optical density of crystal violet elutes was measured at 570 nm (OD570) with a Biotek plate reader.
Tumor assays in mice
All animal procedures were approved by the Institutional Animal Care and Use Committee at the University of Virginia. Mice were housed in AAALAC-accredited facilities, and maintained on a 12 hour light/12 hour dark light cycle with room temperatures of 21-23 °C with 40-60% humidity. Mice were housed separated by sex (n = 4 per cage) in corncob bedding cages with filter-top lids. The maximal tumor measurement permitted by IACUC is 20 mm of the largest diameter. Tumor volumes and other endpoints did not exceed the limits permitted by IACUC. All mice were maintained under specific pathogen-free conditions and housed in individually ventilated cages. Immune-deficient NSG mice (NOD.Cg-Prkdcscid Il2rgtm1Wjl/SzJ) were purchased from The Jackson Laboratory (stock No. 005557). No statistical method was used to determine size of cohorts, with investigators blinded to allocation during assays.
THP-1 cells (2 × 10⁶) transduced with the UTX constructs and pLent-Luc V5 (expressing the luciferase gene) were resuspended in 100 μl of PBS and injected into tail vein of 8-week-old NSG mice. Mice were continuously provided with drinking water containing 2 mg/ml of doxycycline (Sigma, D9891) and chow containing 200 mg/kg of doxycycline (Envigo, TD.00502). Recipient mice were injected D-luciferin (BioVision; 3 mg/20 g) intraperitoneally and anesthetized with isoflurane. luminescent images were taken within 20 minutes after D-luciferin intake using a IVIS Spectrum bioluminescence and fluorescence scanner (Caliper Life Sciences, Inc.) at the Molecular Imaging Core at the University of Virginia. Bioluminescence signals were quantified using Living Images software. Survival of recipient mice was analyzed using GraphPad Prism.
Transduced MiaPaca2 cells (2 × 10⁶) resuspended in 100 μl of PBS were subcutaneously injected into left and right flanks of 8-week-old female NSG mice. Mice were continuously provided with drinking water containing 2 mg/ml of doxycycline (Sigma, D9891) and chow containing 200 mg/kg doxycycline. Tumor size was measured in the 2 longest dimensions using a Vernier caliper. Tumor volume (V) was calculated with the formula V = D1(D2)2/2, where D1 is the long dimension and D2 is the short dimension. 20 days after transplantation, mice were humanely sacrificed for collecting tumors. The tumors were also weighed.
Cancer database analysis for mutations
UTX mutation status and expression of the 555* mutant in human cancer were analyzed by cBioPortal (http://www.cbioportal.org/). Distribution of Number of mutations was analyzed by TCGA database.
To study the effects of UTX IDR missense mutations on its phase separation, the missense mutations listed in cBioPortal were selected for screening mainly based on: (i) mutation frequency -- we started with missense mutations in cBioportal that are in >=3 cases and in IDR, (ii) known roles of amino acids in phase separation, especially mutation from/to aromatic or charged residues, and Gly, Ser, and Arg38,39, and (iii) sometimes with the aid of International Cancer Genome Consortium (ICGC) Mutation function impact prediction (https://docs.icgc.org/portal/methods/#mutation-function-impact-prediction).
Analyses for protein disorder and amino acid sequence features
Disordered regions were identified using IUPred and IUPred3 (http://iupred.elte.hu/). Amino acid composition was analyzed by Composition Profiler (http://www.cprofiler.org/cgi-bin/profiler.cgi). Net Charge Per Residue was analyzed by CIDER40 (http://pappulab.wustl.edu/CIDER/analysis/).
Co-immunoprecipitation assays
293T cells were transfected with indicated constructs. Twenty-four hours later, cells were lysed in BC300 (50 mM Tris-HCl pH 7.4, 300 mM KCl, 20% glycerol, 0.2 mM EDTA) with 0.1% NP40, 1mM DTT, and protease inhibitor cocktail (Roche, Cat# 4693159001). Lysates were incubated with the anti-FLAG M2 antibody (Sigma, A2220) and washed by the lysis buffer. Bead-bound proteins were resolved by SDS-PAGE and detected by immunoblotting.
Protein expression and purification
The pET28-based constructs were transformed into BL21 Star (DE3) (ThermoFisher Scientific, Cat# C601003) E. coli. Bacteria culture at OD600 of 0.6 were induced with 0.4 mM of Isopropyl β-D-1-thiogalactopyranoside (IPTG) for 5 hours at 25°C. Purification of MBP-fusion proteins, which were used only for the initial identification of the UTX regions for phase separation, were previously described10. For purifications of 6xHis-tagged proteins, bacterial pellets from 500 ml IPTG-induced culture were resuspended in 6 ml of Lysis Buffer [50 mM Tris-HCl pH 7.3, 450 mM NaCl, 10 mM imidazole, 1 X protease inhibitors (Roche, Cat# 11836170001)] and lysed by sonication. After centrifugation, the supernatant was incubated with 1 ml of pre-equilibrated Ni-NTA Agarose (Qiagen, Cat# 30210) for 1-2 hr at 4°C, washed with the Wash Buffer (50 mM Tris-HCl pH 7.3, 450 mM NaCl, 20 mM imidazole), and eluted with 0.5 ml of Elution Buffer (50 mM Tris-HCl pH 7.3, 450 mM NaCl, 250 mM imidazole) 5 times. Eluates containing proteins were combined and concentrated in Buffer 450 (50 mM Tris-HCl pH 7.3, 450 mM NaCl, 10% Glycerol, 1mM DTT) using Amicon Ultra-4 centrifugal filter units (Millipore, 30K MWCO, Cat# UFC803008; 50K MWCO, Cat# UFC805008) following manufacturer’s instructions. For sequential purification of 6xHis- and FLAG-double tagged proteins, the eluates off the Ni-NTA Agarose from the procedure above were further incubated with M2 agarose beads (Sigma Cat# A2220) in BC150 (50 mM Tris-HCl pH 7.4, 150 mM KCl, 20% glycerol, 0.2 mM EDTA) with 0.1% NP-40 at 4 °C for 6 h and extensively washed with BC150 with 0.1% NP-40, then by 10 mM Tris pH 8.0. Proteins were then eluted with 0.15 mg/ml 3xFLAG peptide (Sigma, Cat # F4799) in 10 mM Tris-HCl pH 8.0. Proteins were dialyzed to remove the peptide but this was found to have minimal effect on phase separation. Purified proteins were examined by SDS-PAGE followed by coomassie blue staining. Protein concentration was determined by Nanodrop measurement for OD280 and calculation using extinction coefficient provided by ExPASy ProtParam (https://web.expasy.org/protparam/), and also validated by comparing with coomassie blue staining of known concentration of BSA as well.
To affinity pull down UTX WT or mutants and MLL4fusion from mammalian cells, Flp-In T-REx 293 cell lines (Thermo Fisher Scientific, R78007) with different constructs in pcDNA5/FRT/TO vector were generated using the Flp-In system according to the manufacturer’s instructions. Protein expression was induced with doxycycline for 48 hrs. Nuclear extracts were made from the harvested cells by the Dignam procedure41, incubated with M2 agarose beads (Sigma Cat# A2220) in BC150 with 0.1% NP-40 at 4 °C for 6 h and extensively washed with BC150 with 0.1% NP-40, then by 10 mM Tris-HCl pH 8.0. The associated proteins were eluted with 0.15 mg/ml 3xFLAG peptide (Sigma, Cat # F4799) in 10 mM Tris-HCl pH 8.0.
Estimation of nuclear concentration of UTX
By immunoblotting of lysates from known number of cells alone with the purified and quantified UTX protein fragment, and based on nuclear volume as 220 fl of HeLa cells42, we calculated the nuclear concentration of endogenous UTX to be ~153 nM in 293T cells and ~383 nM in mouse ES cells.
In vitro phase separation assay
Two methods were used to initiate in vitro phase separation assays. The first method10 was used only for the initial identification of the UTX regions for phase separation, which were expressed as a fusion with MBP-tag. The MBP-tag was cleaved off the fusion proteins by ProTEV Plus (Promega, Cat# V6102). The second method was used for all other data in this paper. In this method, purified fluorescent protein-fused UTX proteins were stored in high salt concentration and without PEG (or just without PEG for proteins purified from mammalian cell nuclear extracts), and were diluted (or adjusted) using a “condensation buffer” into a final condition of indicated protein concentration, 150 mM NaCl (or otherwise indicated) and 10% PEG6000, 50mM Tris-HCl, pH = 7.3, 10% Glycerol, 1mM DTT. Phase separation was assessed by 3 ways:
(1) Measurement of the optical density at wavelength of 600 nm (OD600) for turbidity by Nanodrop.
(2) Separation of the condensates from the aqueous phase by centrifugation at 5000 rpm for 10 min, followed by SDS-PAGE and Coomassie blue staining of the supernatant and mixed samples. Band intensities were quantified and used to calculate Partition Percentage, which is the percentage of protein in the pellet [100% x pellet/(pellet + supernatant)]. Fluorescence protein alone signal in the pellet reflects “contaminating” residual supernatant fraction as the pellets could not be washed, and such “contaminating” percentage was subtracted from other samples. Our centrifugation protocol probably did not completely spin down all condensates so that the supernatant may also have substantial portion of condensates. Moreover, the size cutoff of condensates is also arbitrary, as protein assemblies may take a continuum of size distribution43.
(3) Microscopy-based method. After TEV protease treatment or dilution of indicated time (or immediately if not specified), protein was added into a homemade flow chamber comprised of a glass slide sandwiched by a coverslip with one layer of double-sided tape as a spacer. Images were taken on Zeiss Axio Observer Z1 microscope or Zeiss LSM780 confocal microscope with 63X oil lens. Fluorescent and Differential interference contrast (DIC) microscopy images were taken.
Line RICS assays
For the line RICS assays, phase separation was initiated by the dilution from high salt method described above. In detail, 1 μl of proteins (stored in 50mM Tris-HCl buffer, pH 7.3, 450mM NaCl, 10% Glycerol, 1mM DTT) was diluted into 2 μl of condensation buffer (15%PEG6000, 50mM Tris-HCl, pH 7.3, 10% Glycerol, 1mM DTT) and mixed into a final condition containing indicated protein concentrations and 150 mM NaCl. Immediately after mixing, 2 μl of this mixture was placed onto a slide chambers (diameter 2 mm, thickness 0.5 mm, silicon) between a glass slide and a coverslip glass. Finally, the chamber was placed on the sample holder for imaging.
Line RICS was performed on Zeiss LSM 710 QUASAR laser scanning microscope using a Zeiss Plan Apochromat 63x, 1.4 NA DIC M27 (Zeiss, Germany), oil-immersion objective. mEGFP-UTX cIDR and mEGFP-UTY cIDR were excited at 488 nm using an Argon laser (Melles-Griot, Carlsbad, CA, USA). Line RICS acquisition was carried out by selecting a line scan option within a region of 6 μm across the condensate. The line was consecutively acquired by scanning 104 lines with a pixel dwell time of 177 μs and a line scan time of 0.101 ms over 128 pixels with a pixel size of 50 nm. Then the collected lines as a function of time were organized into frames of 128 pixels x 128 lines. A total of ~64 frames were analyzed with Global for Images SimFCS software (Version 4, Laboratory for Fluorescence Dynamics, Irvine, CA, USA). We used the line RICS algorithm with a moving average of 10 frames to correct for photobleaching and particle movement as reported previously44. Line RICS autocorrelation curves were then fitted with single population Brownian diffusing model to get the diffusion coefficient as already described previously45.
Immunofluorescence and live cell imaging, including OptoDroplet and LacO array assays
For immunofluorescence, cells were washed with PBS and fixed with ice cold methanol for 15 min. The fixed cells were incubated with 1:250 rabbit antibodies overnight at 4°C, and developed with 1: 300 Alexa Fluor 555 conjugated goat anti-rabbit secondary antibody for 1 hr at room temperature. The slides were further counterstained with DAPI. For immunofluorescence for UTX-mediated H3K27 demethylation in cells, COS-7 cells on 35mm glass-bottom dishes (MatTek) were transfected using Lipofectamine 3000 (ThermoFisher Scientific, Cat# L3000015). After about 40 hr, cells were washed with PBS, fixed in 4% formaldehyde in PBS, permeabilized in 0.5% Triton X-100 in PBS, and blocked in 1% BSA in PBST. The fixed cells were incubated with the mixture of two primary antibodies [Mouse anti-c-Myc (ThermoFisher Scientific, 132500), 1:250; Rabbit anti-H3K27me3 (Millipore, 07-449), 1:500] overnight at 4°C, and developed with the mixture of Alexa Fluor 555 conjugated goat anti-rabbit secondary antibody (1:1000) (ThermoFisher Scientific, A-21428) and Alexa Fluor 488 conjugated goat anti-mouse secondary antibody (1:1000) (ThermoFisher Scientific, A-11001) for 1 hr at room temperature. Cells were further counterstained with DAPI. Images were acquired on Zeiss fluorescence microscope with 63X oil lens.
For live cell imaging, cells were cultured in 35 mm glass-bottom dishes (MatTek), and used for imaging on Zeiss LSM780 confocal microscope supported with a Chamlide TC temperature, humidity and CO2 chamber. Images were collected by either 40X or 60X oil lens. ES cell foci imaging was performed on Zeiss LSM980 confocal microscope with the Airyscan detector. To determine partition coefficient, the fluorescence intensity inside GFP foci (Iin) and the intensity outside the foci (in the diffused area in the nucleus) (Iout) of a randomly selected cell was determined by ZEN2.6 software (Carl Zeiss), and partition coefficient was calculated as Iin/(Iin + Iout).
For OptoDroplet assays, 293T cells were cultured in 35 mm glass-bottom dishes (MatTek) and transfected with indicated plasmids. Twenty-four hours after transfection, cells were imaged using a Zeiss Observer-Z1 microscope in a 37°C humidified chamber with 5% CO2. Cells were exposed to 488 nm wavelength light for 0.5 s for both Cry2 activation and imaging of GFP signal, then by 568 nm wavelength light for 0.5 s for imaging mCherry signal to complete a cycle. Images were recorded for 30 cycles. Cells with similar expression levels of exogenous proteins selected on the basis of mCherry and GFP intensity were chosen for analysis.
For LacO array assay, LacO array-containing U2OS cells were co-transfected with indicated constructs. Twenty-four hours after transfection, images were on Zeiss Axio Observer Z1 microscope with 63X oil lens. Fluorescence intensity for either mCherry or GFP was normalized as (LacO focus center intensity – background intensity)/background intensity. Relative recruitment coefficient was calculated as normalized mCherry intensity/normalized GFP intensity.
Fluorescence recovery after photo-bleaching (FRAP) assays
FRAP assays were performed on Zeiss LSM780 confocal microscope, and, for live ES cell FRAP assays, on Zeiss LSM980 Airyscan confocal microscope. Live cell FRAP assays were performed at 37°C, and the fluorescence signal was bleached using 40% of maximum laser power of a 488-nm laser for approximately 8 sec. Samples were transferred to homemade chambered slides. In vitro condensates were bleached at the center with 100% of maximum laser power of a 488-nm laser for approximately 5 sec. For both in vitro and in vivo FRAP, bleaching area was 1-2 μm in diameter. Condensates of similar size between samples were used in the same experiments. After subtraction of background signal, intensities were normalized for global photobleaching (from a neighboring unbleached droplet) during image acquisition46. Percent recovery for each time point was calculated as [I-Imin]/[I0-Imin] x 100%, in which I, Imin, and I0 are the normalized intensity for each time point, minimum (0 sec after bleaching), and initial (before bleaching) intensities, respectively. FRAP recovery curves were fitted to generate half time of recovery for each bleached condensate, which was used to calculate mean and SD of the half time.
In vitro histone methylation (HMT) assays
In vitro HMT assays were performed as previously described36. Briefly, each reaction contained 1 μg of calf type II-A histone (Sigma), 64 μM S-adenosyl-methionine (SAM), 5 mM MgCl2, 10 mM Tris-HCl pH 8.0, indicated UTX WT or mutant complex (or protein-less buffer as control), in a final volume of 20 μl. Reactions were carried out at 30°C for 1 hr or indicated time, resolved by SDS-PAGE and subjected to immunoblotting. Signal intensity was determined by ImageJ. H3K4me1 activity was determined as relative H3K4me1 increase from preexisting methylation (in control).
RNA-seq assays
For RNA-seq, total RNA quality was assessed with an Agilent 2100 Bioanalyzer. Samples with RNA integrity number greater than 9 were further processed to library preparation and sequencing. For RNA-seq, 2 rounds of polyA+ selection were performed and followed by conversion of mRNA to cDNA. Illumina sequencing adapters and barcodes were then added to the cDNA via PCR amplification. Indexed libraries were then normalized and pooled. 1 x 75 bp single end sequencing was performed using the Next-seq (Illumina) with recommended protocol.
PRO-seq assays
For PRO-seq analysis47, Pro-seq library construction was performed as previously described with some minor modifications48. Briefly, THP1 cells were washed once with ice-cold PBS and resuspended in ice cold permeabilization buffer (10 mM Tris-HCl pH 7.4, 300 mM sucrose, 10 mM KCl, 5 mM MgCl2, 1 mM EDTA, 0.5 mM DTT, 0.05% Tween-20, 0.1% NP40, protease inhibitors cocktail (Roche), and 4 u/mL RNase inhibitor (SUPERaseIN, Ambion)) at the cell density of 1 × 10⁶ cells/ml. Cells were then centrifuged and washed twice with permeabilization buffer and resuspended in storage buffer (10 mM Tris-HCl pH 8.0, 25% glycerol, 5 mM MgCl2, 0.1 mM EDTA and 5 mM DTT) at the density of 5× 10⁷ cells/mL. 5× 10⁶ permeabilized cells were added to the same volume of 2x Nuclear Run-On reaction mixture (10 mM Tris-HCl pH 8.0, 300 mM KCl, 1% Sarkosyl, 5 mM MgCl2, 1 mM DTT, 200 μM biotin-11-A/C/G/UTP (Perkin-Elmer), 0.8 u/μL SUPERaseIN inhibitor) and incubated at 30°C for 5 min. Nascent RNA was extracted using Trizol LS followed by ethanol precipitation. Extracted nascent RNA was fragmented by base hydrolysis in 0.2 N NaOH for 10 min on ice and immediately neutralized with 1x volume of 1 M Tris-HCl pH 6.8. Fragmented nascent RNA was bound to 30 μl of Streptavidin M-280 magnetic beads (Invitrogen) in Binding Buffer (10 mM Tris-HCl pH 7.4, 300 mM NaCl, 0.1% Triton X-100). The streptavidin beads were washed twice in High salt buffer (50 mM Tris-HCl pH 7.4, 2 M NaCl, 0.5% Triton X-100), twice in Binding buffer, and twice in Low salt buffer (5 mM Tris-HCl pH 7.4, 0.1% Triton X-100). Bound RNA was extracted from the beads using Trizol (Invitrogen) followed by ethanol precipitation. Fragmented nascent RNA was dissolved in H2O and incubated with 10 pmol of reverse 3′ RNA adaptor (/5Phos/rNrN rNrNrN rNrNrN rGrArU rCrGrU rCrGrG rArCrU rGrUrA rGrArA rCrUrC rUrGrA rArC/3InvdT/) and treated with T4 RNA ligase I (NEB) followed recommended instruction for 2 h at 20°C. Ligated RNA was enriched by another round of Streptavidin bead binding and washed with two washes each of High salt buffer, Binding buffer and Low salt buffer and one wash of 1x Thermo Pol Buffer (NEB). For nascent RNA 5’ decapping, the RNA products were treated with RNA 5′ Pyrophosphohydrolase (RppH, NEB) at 37°C for 30 min followed by one wash of High salt buffer, Low salt buffer and T4 PNK Buffer. The RNA products were treated with Polynucleotide Kinase (PNK, NEB) at 37°C for 30 min for 5’ hydroxyl repair. 5′ repaired RNA was ligated to reverse 5′ RNA adaptor (5′-rCrCrUrUrGrGrCrArCrCrCrGrArGrArArUrUrCrCrA-3′) with T4 RNA ligase I (NEB) under manufacturer’s conditions for 2 h at 20°C. Adaptor ligated nascent RNA was enriched with biotin-labeled products by another round of Streptavidin bead binding and two washes each of High salt buffer, Binding buffer and Low salt buffers and one wash of 1x SuperScript IV Buffer [Thermo Fisher Scientific]), and on-bead reverse transcription were performed with SuperScript IV using 25 pmol RT primer (5′-AATGATACGGCGACCACCGAGATCTACACGTTCAGAGTTCTACAGTCCGA-3′). For the final amplification, 12.5 pmol of RPI-index primers was added to the RT product with NEBNext Ultra II Q5 Master Mix. Products was amplified 11 cycles and beads size selected before being sequenced in NextSeq 500 machines in a high-output 75-bp cycle run.
ChIP-seq assays
For ChIP-seq, cells were crosslinked in 1% formaldehyde at room temperature for 10 min and quenched with glycine to a final concentration of 125 mM for 5 min at room temperature. The cell pellets were washed sequentially with PBS, Buffer I (10 mM HEPES, pH 6.5 ,0.25% Triton X-100, 10 mM EDTA, pH 8.0, 0.5 mM EGTA, pH 8.0), and Buffer II (10 mM HEPES, pH 6.5, 200 mMNaCl, 10 mM EDTA, pH 8.0, 0.5 mM EGTA, pH 8.0). Cells were resuspended in lysis buffer (50 mM Tris-HCl, pH 8.0, 10 mM EDTA, 1% SDS, and 1× protease inhibitors) on ice for 10 min. Cells were sonicated using a Bioruptor device (45 cycles of 30 s on/off; high setting) and spun down at the maximum speed for 10min at 4 °C. The supernatants were diluted 10 times with dilution buffer (0.01% SDS, 1.1% Triton X-100, 1.2 mM EDTA, 16.7mM Tris-HCl pH 8.0 and 167mM NaCl) and incubated overnight with the respective antibody with rotation at 4°C. Protein A sepharose beads (GE Healthcare) were added (20 μl beads per 10×106 cells) the following day and incubated for 2-3 h at 4°C. Remaining steps in ChIP were performed following the protocol in the ChIP Assay Kit (Millipore Cat# 17-295). DNA was then eluted from the beads by incubating with 150 μl elution buffer (1% SDS and 100 mM NaHCO3) for 20 min at 65°C (vortexing every 10min). The supernatants were collected and reverse crosslinked by incubation overnight at 65°C in the presence of proteinase K. DNA was then ethanol precipitated with glycogen. The immunoprecipitated DNA (6-10 ng) was used for ChIP-seq library preparation using the NEBNext® Ultra™ II DNA Library Prep Kit for Illumina® (New England Biolabs, E7645). Libraries were sequenced using the Next-seq sequencer (Illumina) on single-end 75 bp mode.
HiChIP assays
HiChIP experiments were performed with transduced THP-1 cells using the Arima-HiC+ kit (Arima Genomics, P/N A101020) according to its recommended protocol. Briefly, 2.5 × 10⁶ crosslinked cells (with the same condition as ChIP) were resuspended in 20 μl Lysis Buffer and rotated at 4°C for 20 min. 24 μl Conditioning Solution was then added to the lysis solution and incubated at 62°C for 10 min. 20 μl Stop Solution was then added to the mixture, incubated at 37 °C for 15 min. 7 μl Buffer A, 1 μl Enzyme A1 and 1 μl Enzyme A2 restriction enzymes were then added, samples were incubated at 37°C for 1 h. Samples were then pelleted at 2,500 G at RT for 5 min. Samples were washed three times with 75 μl NWR buffer (Tris-HCl, pH8.0, NEBuffer 3.1) and resuspended in 75 μl NWR buffer. 12 μl Buffer B and 4 μl Enzyme B were added and incubated at RT for 45 min. 70 μl Buffer C and 4 μl Enzyme C were added to each sample, mixed well and incubated at RT for 15 min. Samples were then pelleted and resuspended in 110 μl R1 Buffer (10 mM Tris-HCl, pH8.0, 140 mM NaCl, 1 mM EDTA, 1% Triton X-100, 0.1% SDS, 0.1% Sodium Deoxycholate) and incubated at 4°C for 20 min. Chromatin were then sheared using the Diagenode Bioruptor using 30S on/30S off cycling condition for 20 cycles total. 900 μl R1 Buffer was add to each sheared sample. 2.5 μg H3K4Me3 antibody was added to each sample and incubated at 4°C overnight on a rotator. The next day, 30 μl Protein A beads were added to the samples and rotated at 4°C for 4 h. After incubation, the beads were washed twice sequentially with R1 buffer, R3 buffer (0.1% SDS, 1% Triton X-100, 2 mM EDTA, 20 mM Tris–HCl pH 8.5, 0.1% Sodium Deoxycholate and 300 mM NaCl), LC buffer (1 mM EDTA, 10 mM Tris–HCl pH 8.5, 0.1% Sodium Deoxycholate and 150 mM Lithium Chloride, 0.5% IGEPAL CO-630) and LTE wash buffer (10 mM Tris–HCl pH 8.0, and 0.1 mM EDTA). Samples were resuspended with 174 μl Elution buffer. 10.5 μl Buffer D, 25 μl Enzyme D and 20 μl Buffer E were add to each sample and incubated at 55°C for 30 min, 68°C for 90 min and 25 °C for 10 min. Hi-ChIP DNA from each sample were purified with 230 μl DNA Purification Beads (MagBio) and washed with 80% ethanol twice. After DNA purification, 100 μl Biotin Enrichment Beads were added to the Hi-ChIP DNA and incubated at RT for 15 min. Beads were then washed twice with 200 μl Wash Buffer once with 100 μl Elution Buffer. 40 μl Elution Buffer was added to resuspend beads which contain enriched Hi-ChIP DNA. The biotin enriched DNA (6–10ng) was used for library preparation using the NEBNext® Ultra™ II DNA Library Prep Kit for Illumina® (New England Biolabs) according to its recommended protocol. The HiCHIP libraries were sequenced using the Next-seq sequencer (Illumina) on pair-end 2×75 bp mode.
Genomic data processing and statistical analysis
RNA-seq data analysis
RNA-seq reads were aligned to the human genome assembly GRCH38/hg38 or mouse genome assembly GRCm38/mm10 using STAR49. RNA-seq counts were annotated using RSEM50. Read counts were normalized to TPM (Transcripts Per Million reads). Differentially expressed genes were calculated using DESeq251. Significant differentially expressed genes (DEGs) were selected at the thresholds of adjusted p-value <0.05 and |log2 fold change| > log2(1.25). Gene ontology and pathway analysis was conducted by DAVID v6.852 (https://david.ncifcrf.gov/summary.jsp) or Metascape53 (https://metascape.org/gp/index.html#/main/step1).
PRO-seq data analysis
Trim Galore (https://github.com/FelixKrueger/TrimGalore) was used to trim the raw sequencing reads. Sequence reads were aligned to the human genome assembly GRCH38/hg38 using BWA54. Sam files were converted into bam files using Samtools55. MACS256 was used to call peaks under the FDR threshold of 0.01. To generate the coverage of the aligned sequence reads, the bam files were converted to BEDPE files using BEDtools57. Only the 5’ end of mate1 reads were kept into a bed file and converted into bedGraph files using ‘bedtools genomecov-bg-strand’. The raw read counts in bigWig coverage tracks were normalized by sequencing depth (reads per million). The plus and minus strand were swapped for the correct orientation.
ChIP-seq data analysis
Trim Galore (https://github.com/FelixKrueger/TrimGalore) was used to trim the raw sequencing reads. Sequence reads were aligned to the human genome assembly GRCH38/hg38 using BWA54. Sam files were converted into bam files using Samtools55. MACS256 was used to call peaks under the FDR threshold of 0.01. For H3K4me1, 2, 3 and H3K27ac ChIP-seq data, SICER2 58 was applied to call broad peaks (islands) with default parameters.
In scatter plots for histone modifications and MLL4 binding, the signal level change was determined as log2 fold change of normalized read counts in 4kb regions centered at 15,554 UTX-binding sites, in cells indicated on the x and y axes. The heatmaps and composite plots show histone modifications and MLL4 binding levels per 20bp non-overlapped bins covering 4kb regions centered at UTX-binding sites.
HiChIP data analysis
Quantification of genomic long-range chromatin interactions from H3K4me3/H3K27ac HiChIP data were performed with MAPS59 at a resolution of 5kb. The merged SICER islands called from the matched H3K4me3/H3K27ac ChIP-seq data across all cell samples were used as the list of protein binding sites as MAPS input. Arc plots of loops called from MAPS were visualized on the WashU EpiGenome Browser60 (http://epigenomegateway.wustl.edu/browser/). The loop anchors (5kb bin pairs) were overlapped with gene promoter regions (TSS ± 2kb) or enhancer regions to infer the types of chromatin interactions, where the enhancer regions were defined as non-promoter overlapped union DNase I hypersensitive sites61. To compare read counts in loops across cell samples, raw read counts were normalized to per 100 million mapped pairs after duplicate removal (from MAPS QC file) within each dataset (Supplementary Table 4).
Identification of differential chromatin interactions
To determine the differential chromatin interactions (DCIs) between cell samples, HiChIP data from each cell sample was first processed using HiC-Pro62. Contact maps were generated at a resolution of 5kb. BART3D22 was applied on raw count matrices between cell samples to generate genome-wide normalized DCI profiles. Positive or negative DCI scores represent increased or decreased chromatin interactions, respectively, in one sample over the other at each 5kb bin. DCI score at each bin was then mapped to the gene TSS to infer differential chromatin interactions at genes (Supplementary Table 5).
Determination of UTX-bound enhancers
A union of H3K4me1 and H3K27ac islands across all cell samples were collected as the repertoire of potential enhancer regions, from which the promoter (TSS ± 2kb) non-overlapped, UTX WT peaks overlapped regions were selected as UTX-bound enhancers. The PRO-seq signals were shown centered at RPO-seq peaks that overlapped with UTX-bound enhancers.
Statistics and reproducibility
Experimental data are presented as the mean ± SD of three independent experiments unless otherwise noted. Statistical analysis was carried out by two-sided unpaired Student’s t-test (for two-sample comparison and certain pair-wise comparisons to a specific sample in a multiple sample group), log-rank test (for survival analysis), one-way ANOVA with Tukey’s post hoc test (for multi-sample groups), or Fisher’s exact test (for gene overlap), as indicated in Figure Legends. Statistical analysis was performed by Prism, SPSS (IBM), Excel, or Python. A P value of less than 0.05 was considered significant. Statistical significance levels are denoted as follows: *P < 0.05, **P < 0.01, ***P < 0.001, and ****P < 0.0001.
Sample numbers are indicated in the figure legends. Results of images, staining, or gels (shown in Figs. 1b–d, 2a, c, 3a, b and Extended Data Figs. 1c–o, 2b, c, e–h, j, 3a–c, i, 4b, c, f, h, j, l, m, 5b–e, 6a–e, h, 7g, h, 11a, e–I, k) were reproducible with at least three independent experiments or prepared samples, with the representative ones shown in the figures.
Extended Data
Extended Data Figure 1. UTX undergoes cIDR-dependent phase separation.

a. Relative expression of UTX 555* mutant in 10 cancer patient samples that harbor this mutation and for which the mRNA level data are available. From cBioportal. Each bar is a patient sample. z-score indicates the number of standard deviations away from the mean of expression in the reference. It shows that 3 samples showed increase in mRNA level, and 4 samples showed reduction within 1 standard deviation of expression in reference samples, suggesting that this nonsense mutation does not usually lead to transcript decay and should express a truncated UTX (1-554)
b. Top, a schematic of the full-length UTX. Bottom, a plot for number of non-synonymous mutations (type indicated in legend) within each 100 amino acids-long region on UTX, from 394 patients in TCGA. The plot is aligned with the top schematic
c. Top, a schematic showing division of the full-length UTX into 5 regions that were individually purified as fusion with Maltose-binding protein (MBP, to enhance solubility). See Constructs in Methods for rationale for region division. Bottom, phase contrast images of 50 μM MBP-UTX fragments corresponding to each indicated UTX region in 30 mM NaCl after treatment with TEV protease for 1 hr to remove the MBP tag
d. Coomassie blue staining image of purified EGFP and EGFP-cIDR
e. Fluorescence (left) and DIC (right) microscopy images of 30 μM EGFP-cIDR at increasing concentrations of NaCl at indicated times after dilution in the condensation buffer. Note the increase of droplet size and the occasional appearance of irregular shape at 45 min, suggesting growth and aging phenomena that are typical for phase separation
f. Fluorescence (left) and DIC (right) images showing wetting of 30 μM EGFP-cIDR at the surface of the coverslip immediately after dilution.
g. Coomassie blue staining image of purified EGFP-UTX (419-848)
h. Fluorescence (up) and DIC (bottom) images of EGFP-UTX (419-848) at indicated concentrations
i. Coomassie blue staining image of purified mEGFP and mEGFP-UTX (419-848)
j. Fluorescence (up) and DIC (bottom) images of mEGFP and mEGFP-UTX (419-848) at indicated concentrations and time points after dilution in condensation buffer.
k. Coomassie blue staining image of purified mCherry and mCherry-UTX (419-848). Note that, throughout this manuscript, a band of unknown identity, indicated by the asterisk, always appeared at ~15kD smaller than the purified mCherry or mCherry-tagged protein of interest, regardless of the identity of the protein of interest. We thus speculate that it is either a degradation product of mCherry or an unrelated protein tightly associated with mCherry
l. Fluorescence (up) and DIC (bottom) images of 40 μM mCherry and mCherry-UTX (419-848) at indicated time points after dilution
m. Immunoblotting by indicated antibody of total lysates from untransfected control or 293T cells transfected with indicated constructs that are fused to EGFP
n. Quantification of nuclear UTX concentration by anti-UTX immunoblotting. Total lysates from indicated number of 293T and mouse ES cells were loaded, along with indicated ng of purified EGFP-UTX (1-848). We determined that the nuclear concentration of endogenous UTX to be ~153 nM in 293T cancer cells and ~383 nM in mouse ESCs
o. Transfected UTX forms nuclear foci at a concentration that is on the same order of magnitude as the endogenous level. Left, immunoblotting (top, by anti-UTX antibody) and Ponceau S staining (bottom) of total lysates from untransfected control or 293T cells transfected with a very low dose of plasmid for UTX-EGFP, with a transfection efficiency of ~30% as examined under microscope. Three different amounts (1:2 serial dilution) of the lysates and purified EGFP-UTX (1-848) were loaded as indicated. UTX-EGFP amount was roughly 2 times that of the endogenous UTX, and estimated to be < 1 μM in the transfected cells, assuming that the negative cell under microscope had little contribution to the UTX-EGFP immunoblotting signal. The fluorescence image of the corresponding cells is shown on the right.
Extended Data Figure 2. UTX cIDR and the key residues in cIDR are important for forming condensates and its tumor suppressive activity.

a. Growth curves of THP-1 cells electroporated with indicated constructs, shown as mean ± SD. n = 3 independent experiments. P value is between MT2 and ΔcIDR at the last time point .
b. Immunoblotting by indicated antibody of total lysates from THP-1 cells electroporated with empty vector or indicated UTX WT or mutants.
c. Fluorescence and bright field images of THP-1 cells electroporated with indicated UTX constructs fused to EGFP.
d. Analysis of amino acid enrichment for UTX cIDR. By Composition Profiler, using indicated background sample.
e. Fluorescence images of 293T cells transfected with the corresponding UTX WT or mutants fused with EGFP.
f. Immunoblotting by indicated antibody of total lysates from 293T cells transfected with empty vector or indicated UTX WT or mutants fused to EGFP.
g. Immunoblotting by indicated antibody of total lysates from THP-1 cells electroporated with empty vector or indicated UTX WT or mutants.
h. Representative fluorescence microscopy images of foci in FRAP assays for full-length UTX WT and HY fused to mEGFP in nuclei following transfection into 293T cells. The photobleached focus is indicated by the dashed box and its images at indicated time points are amplified.
i-n all used 20 μM mEGFP, mEGFP-UTX (419-848) WT or HY as indicated.
i. Pictures and OD600 plotted as mean ± SD. n = 3 independent experiments.
j. Representative fluorescence microscopy and DIC images at indicated times in condensation. Scale bar, 10 μm.
k. FRAP recovery curves as mean ± SD at indicated early and late times in condensation. n = 13 and 12 droplets each for WT and HY, respectively, for early times, and n = 8 and 12 droplets each for WT and HY, respectively, for late times.
l-n. Line RICS assays for WT (n = 32 droplets) and HY (n = 12) over the time range of 0-100 min in condensation.
l. Fluorescence Images and line carpets.
m. Line RICS autocorrelation curves.
n. Plot showing the mean ± SD of the diffusion coefficients.
*P<0.05, ***P<0.001, and ****P<0.0001, by two-sided t-test for all.
Extended Data Figure 3. Tumor suppressive activity of UTX can be maintained by replacing its cIDR with unrelated protein IDRs.

a. Immunoblotting by anti-UTX or GAPDH of total lysates from THP-1 cells electroporated with empty vector or indicated UTX WT or mutants.
b. Immunoblotting by anti-UTX (top) or GAPDH (bottom) of total lysates from THP-1 or MiaPaca2 cells that were transduced with empty vector or indicated UTX WT or mutants and induced with doxycycline.
c. Confocal images of 293T cells transfected with indicated UTX chimeric constructs all fused to EGFP.
d. Growth curves of THP-1 cells electroporated with indicated vector or UTX constructs, shown as average ± SD. n = 3 independent experiments.
e. Representative results of colony formation assay of THP-1 cells transduced with indicated UTX WT or mutant construct. Bottom left, the number of colonies are plotted as mean ± SD (n = 3 independent experiments). Bottom right, the size of colonies are plotted as mean ± SD. n = 100 colonies for each except 73 colonies for UTX-eIFIDR.
f. Kaplan Meier Curves for survival of the animals grafted with THP-1 cells stably transduced with indicated vector or UTX constructs. P = 0.0024 for WT vs. ΔcIDR, and 0.015 for ΔcIDR vs. UTX-eIFIDR. n = 8 mice each, except n = 10 for Vector.
g. Representative crystal violet staining images of MiaPaca2 cells transduced with indicated UTX WT or mutant construct. Two thousand cells were seeded and cultured for 7 days in the absence or presence of doxycycline (to induce transgene expression) before staining. Right, staining absorbance for cells with doxycycline are plotted as mean ± SD from n = 3 independent repeats.
h. MiaPaca2 cells stably transduced with indicated vector or UTX constructs were grafted into immune-deficient mice. Tumors from day 20 were imaged and their weights are plotted as average ± SD. n = 5 mice each for Vector and UTX-FUS(IDR), or 6 mice each for the others.
i. Immunoblotting of total lysates (Input) and anti-FLAG antibody-mediated immunoprecipitation (IP) from 293T cells transfected with empty vector, or FLAG-tagged UTX WT or ΔcIDR, using indicated antibodies.
j-o. RNA-seq analysis for gene expression in the THP-1 cells transduced with indicated UTX constructs (two samples each).
j. Volcano plot. Blue and red dots represent genes that were significantly (adj. P<0.05) up-or down-regulated (over 1.25 fold), respectively, by WT versus vector control. The adjusted P values on y axis were from DESeq2. The detailed gene information is in Supplementary Table 1.
k. Gene ontology analysis for the indicated gene clusters from the heat map in Fig. 1j. Red plot shows the significantly enriched gene functions for the 300 genes in the red bracket in Fig. 1j, which were strongly induced by WT and UTX-eIFIDR, but not as strongly by ΔcIDR, and not affected by ΔTPR. Blue shows the significantly enriched gene functions for the 200 genes in the blue bracket in Fig. 1j, which were markedly repressed by WT and UTX-eIFIDR, but not ΔcIDR and ΔTPR.
l. Principal component analysis of quantile normalized gene expression (log2 of TPM, pseudo-count=1) using 1,271 DEGs in WT versus vector control.
m. Scatter plots for gene expression changes between indicated samples. Black dashed line indicates the linear fit with correlation coefficient (r) labeled. Red and blue dots are genes significantly up-or down-regulated (over 1.25 fold) in WT over vector, respectively, as in j.
n. Box plots for gene expression changes between indicated samples for the up- and down-regulated genes (defined in m) in WT over vector. Data are median (horizontal line), 25–75th percentiles (box) and 1.5 times the interquartile range recorded (whiskers). P values are shown for data significantly greater or less than 0 by two-sided one sample t-test. Left, n = 675 genes each; right, n = 596 genes each.
o. Heatmap showing relative expression levels of genes that were significantly (adj. P<0.05) up-or down-regulated (1.25 fold each) by WT compared to vector control in the THP-1 cells transduced with vector control, UTX WT or catalytically inactive (MT2) mutant (two samples each). Each row represents a gene.
P values by one-way ANOVA followed by Tukey’s post hoc test for all analyses except by two-sided log-rank test for g, two-sided modified Fisher’s exact test for k, and two-sided one sample t-test for n.
Extended Data Figure 4. Condensation of the endogenous Utx is important for ESC differentiation.

a. Schematic of FLAG-mEGFP Knock-in (KI) at Utx in ESCs.
b. Genomic PCR products by indicated primers for different clones. The predicted sizes are 961 bp (by F1+R1) and 954 bp (by F2+R2) for the KI clones.
c. Immunoblotting for KI clones by green circles (neighboring lanes are clones of mixed population).
d. Schematic for generating a Utx KO ESC clone.
e. Sequencing results showing the 4 bp loss in Utx in the KO clone.
f. Immunoblotting for the Utx KO clone.
g. Schematic for generating Utx ΔcIDR ESC clones.
h. Genomic PCR products for different clones. The bottom right gel used the primer pair in yellow shown in g, with predicted size of 205 bp for ΔcIDR. The other gels used the primer pair in black in g, with predicted size of 1040 bp for ΔcIDR.
i. Sequencing of the indicated ΔcIDR clones. The in-frame deleted genomic regions are shown in the square brackets. The deletion of amino acids additional to the cIDR was due to the design of the gRNAs to ensure efficient recognition of CRISPR/Cas9. These residues are all in the disordered region. A phenylalanine was also added (in red) by the repair process in clone #72
j. Immunoblotting for the Utx ΔcIDR clones.
k. Schematic of FLAG-mEGFP KI at Utx in the Utx ΔcIDR ESC clones.
l. Genomic PCR products for different clones using the F2 and R2 primer pair shown in a.
m. Immunoblotting for mEGFP-tagged WT and UtxΔ cIDR clones.
n. Representative confocal microscopic images of ESCs that did not have mEGFP KI (Negative) or had mEGFP KI in the Utx WT or ΔcIDR clones. Two different samples of ΔcIDR clone #25 that had relatively high and low mEGFP signal levels are here to show that the signal levels did not affect the fuzziness or how dispersed UTX was.
o. Granularity of the mEGFP signal was plotted as mean ± SD. n = 28 Utx WT and 38 ΔcIDR cells, each containing two different clones shown in panel n. Granularity, or mEGFP signal fluctuation, was calculated as SD of the relative signal intensity of a line plot (normalized to the mean signal intensity of the entire line) at each pixel on the line through an individual cell. P value by two-sided t-test. The line plot was generated by ImageJ, and an example is shown as the yellow line on a mEGFP-ΔcIDR clone in n.
p. Venn diagrams for genes that, compared to the corresponding WT EBs, were downregulated (left) or upregulated (right) by KO (cyan) or ΔcIDR (salmon, two clones) in late EBs (day 8 or 9 in differentiation). Fold changes are indicated. From RNA-seq of two 2 independent differentiation assays. P values by two-sided Fisher’s exact test.
q. Significantly enriched Biological Processes in embryonic development for genes downregulated (↓) or upregulated (↑) over 2 fold by Utx KO or ΔcIDR in EBs late in differentiation, compared to the corresponding WT EBs. By Metascape. P values by two-sided hypergeometric test.
Extended Data Figure 5. UTX co-condenses with and enhance chromatin recruitment of MLL4 and p300 in cells.

a. A schematic showing the domain compositions of MLL4, MLL4f, and MLL4C(N).
b. Left, a schematic showing the optoDroplet system used for the right, which are confocal images of 293T cells expressing MLL4C(N)-mCherry-Cry2, before and after light activation.
c. Left, a schematic showing the optoDroplet system used for the right, which are confocal images of 293T cells expressing UTX-mCherry-Cry2, before and after light activation.
d. Left, a schematic showing the optoDroplet system used for the right, which are confocal images of 293T cells expressing both UTX (WT or indicated mutant)-mCherry-Cry2 and MLL4C(N)-EGFP, before and after light activation.
e. Left, a schematic showing the LacO-array system. Middle, fluorescence microscopy images of LacO-cells transfected with EGFP-LacI (control) or UTX (WT or mutant)-EGFP-LacI, each together with p300(251-550)-mCherry. Right, recruitment coefficients of p300(251-550) relative to the LacO-bound control or UTX (WT or mutant) are determined as described in Methods and plotted as average ± SD. n = 11, 19, 17, 24 cells for control, WT, ΔcIDR, and ΔTPR, respectively. P values by one-way ANOVA followed by Tukey’s post hoc test.
Extended Data Figure 6. Purified UTX and MLL4 or p300 regions form co-condensates through specific interaction mediated by TPR.

a. Coomassie blue staining image of purified EGFP-UTX (419-848), EGFP-UTX (1-848), and mCherry-MLL4C(N).
b. Fluorescence images of purified proteins individually diluted to indicated concentrations.
c. Fluorescence images of purified proteins mixed and diluted to the final concentration as indicated, equal to the concentrations in b.
d. Fluorescence images of purified proteins individually diluted to indicated concentrations.
e. Fluorescence images of purified proteins mixed and diluted to the final concentration equal to that of the corresponding protein in d. The exposure time for GFP in the top row was longer than those in the other two rows to adjust the GFP brightness due to the much lower concentration of the GFP-fused proteins in the top row.
f. Recruitment coefficient for MLL4C(N) was determined as the relative ratio of the mCherry signal amount inside the GFP condensates over that inside the mCherry condensates, and plotted as mean ± SD. n = 3 independent fields each. Note that each field had ~100 total droplets. **P<0.01 by one-way ANOVA followed by Tukey’s post hoc test.
g. Domain schematic of p300. P300 (251-550) containing ZF1 domain is labeled.
h. luorescence images of purified proteins mixed to the indicated final concentrations.
Extended Data Figure 7. UTX condensates enrich histone modification activities.

a. Schematic of the procedures to isolate the UTX (WT or ΔcIDR) and MLL4f proteins for in vitro histone methylation (HMT) and imaging analyses. Note that all HMT assays involved endogenous MLL3/4 associated with isolated UTX.
b. Immunoblotting for UTX in the UTX (WT or ΔcIDR) pulldowns, along with indicated ng of purified EGFP-UTX (1-848). This allowed an estimate of the concentration of WT-GFP or ΔcIDR-GFP to be ~40 nM in the pulldowns.
c. Fluorescence images of the UTX (WT or ΔcIDR) pulldowns in the condensation buffer, with ~25 nM UTX protein and 150 mM NaCl.
d. Immunoblotting for the indicated proteins in the isolated UTX (WT or ΔcIDR) complexes.
e. Representative results of in vitro HMT assays using the UTX (WT or ΔcIDR)-GFP pulldown. UTX and indicated histone modifications at indicated time points of HMT assay were determined by Immunoblotting. Total Histones are shown by Ponceau S staining. Right, Relative H3K4me1 increase (from time 0) is plotted as mean from 2 independent experiments.
f. Representative results of in vitro HMT assays using the UTX (WT or 555*) pulldown. Top, immunoblotting by indicated antibodies and Ponceaus S staining for total histones in HMT assay. Bottom, H3K4me1 activity was determined as relative H3K4me1 increase from preexisting methylation (in control) and plotted as mean ± SD. n = 3 independent experiments. P values by two-sided t-test.
g. Immunoblotting using anti-FLAG antibody for the isolated UTX (WT or ΔcIDR) complexes, MLL4f-mCherry, or their mixture as indicated. UTX (WT or ΔcIDR) and MLL4f all had FLAG tag.
h. Fluorescence microscopy images of indicated protein complex, either as individual protein (top row) or mixed as indicated (bottom two rows) in the condensation buffer. The concentration of each protein in the mixture was the same as that of the corresponding individual protein shown on top row.
i. Immunostaining for Myc (for Myc-tagged UTX), H3K27me3, and DAPI in COS-7 cells transfected with indicated UTX WT or mutant construct. Cells with UTX overexpression (indicated by arrows) were scored for the signal intensity of H3K27me3 and quantified in j.
j. Quantification of the cells showing Decrease (↓), no change (−), or increase (↑) of H3K27me3. Shown are the percentage of cells showing the indicated changes in one out of a total of five biological repeats. In parenthesis is the number of cells showing the changes/total number of cells scored. In each repeat, around 100 cells were scored for each sample.
Extended Data Figure 8. UTX condensates regulate genomic histone modifications and enhancer transcription.

a. A Venn diagram for genomic sites bound by UTX WT and ΔcIDR. The overlap number refers to the number of WT peaks that overlapped with ΔcIDR peaks.
b. Genomic features of all 15,554 UTX WT-bound sites. The number of sites for each feature is shown in the parenthesis.
c. Number and percentage of the genomic sites bound by either UTX WT (normal) or specifically by ΔcIDR (aberrant, not bound by WT) that overlap (within indicated distance) with any of the activating histone marks (H3K4me1, 2, 3, and H3K27ac) merged across all cell samples.
d. Heatmap (left) and composite plot (right) for all 15,554 UTX WT-binding peaks in indicated cells. Heatmap rows were ranked by UTX peak levels (MACS2 peaks q-value, high to low). UTX ChIP-seq signals per 20bp non-overlapped bins covering 4kb regions centered at UTX peaks were shown. Details in Supplementary Table 3.
e, f. Heatmap (left) and composite plot (right) for H3K4me1 (e) or H3K27ac (f) peaks in indicated cells at the UTX-binding sites (number indicated) with higher H3K4me1 (e) or H3K27ac (f) intensity in WT than vector expressing cells. Heatmap rows were ranked by UTX peak significance (MACS2 q-value, high to low). ChIP-seq signals from indicated histone modification per 20bp non-overlapped bins covering 4kb regions centered at UTX peaks were shown.
g-j. Left, scatter plot using the indicated H3K4me3 (g), H3K4me2 (h), H3K27me3 (i), and MLL4 binding (j) signal level change in cells indicated on the x and y axes, for all 15,554 UTX WT-bound sites. Black dashed line indicates the linear fit with correlation coefficient (r) labeled. Right, composite plot for indicated modification or binding signals centered at UTX peaks in indicated cells.
k. Scatter plots using the indicated histone modification signal level change in cells indicated on the x and y axes, for all 15,554 UTX WT-bound sites. Black dashed line indicates the linear fit with correlation coefficient (r) labeled.
l. Top, scatter plot for PRO-seq signal change at all 4,806 UTX WT-bound enhancers in indicated cells. Black dashed line indicates the linear fit with correlation coefficient (r) labeled. Bottom, composite plot for the PRO-seq signals centered at PRO-seq peaks in indicated cells.
m. Heatmap (left) and composite plot (right) for PRO-seq signals at UTX WT-bound enhancers that had increased (top row) or decreased (bottom row) PRO-seq signals over 1.2 fold in WT compared to vector expressing cells, in indicated cells. PRO-seq signals centered at PRO-seq peaks were shown.
Extended Data Figure 9. UTX condensates regulate long-range chromatin interactions.

a. Distribution of types of genomic interactions. P, promoter (TSS ± 2kb); E, enhancer (promoter non-overlapped, union DNase I hypersensitive sites); Desert: all other interactions, <1% in all.
b. Distribution of the chromatin loop size in indicated cells. A loop is the connection of two different 5 kb chromatin regions by high-confidence contact reads.
c. Number of chromatin loops identified in indicated cells. For simplicity, Venn diagrams for only Vector, WT, and ΔcIDR cells are shown.
d. Box plots for the number of normalized HiChIP reads per loop for identified loops in indicated cells. The normalized read counts in a loop represents the relative intensity of the interaction. For H3K4me3 HiChIP (left), n = 57632, 67755, 88993, 95696, 90566 loops in Vector, WT, ΔcIDR, UTX-eIFIDR, ΔcTPR samples, respectively. For H3K27ac HiChIP (right), n = 20912, 27794, 37811, 31232, 26556 loops in Vector, WT, ΔcIDR, UTX-eIFIDR, ΔcTPR samples, respectively.
e. Scatter plots for all 26,237 genes using the promoter H3K27ac HiChIP DCI of cells indicated on the x and y axes. Dashed line shows the linear fit with indicated correlation coefficient (r). Red and blue dots represent 479 and 112 genes with DCI of WT over vector > 5 and < −5, respectively.
f. Box plots for DCI scores comparing cells indicated on x axis for genes represented by the red (left) and blue (right) dots from e. P values are shown for data significantly greater or less than 0 by two-sided one sample t-test. Left, n = 479 genes each; right, n = 112 genes each.
g. Box plots for DCI scores at promoter (TSS ± 2kb) of cell samples (indicated on top of each plot) for genes whose expression was up-or downregulated (indicated on x axis) in the corresponding cells (indicated on top of each plot). Genes were selected as those both have expression and DCI data. The trend of change and the P value between indicated two groups of genes are shown. n = indicated number on x axis.
h. Gene pathway analysis using DCI scores from indicated HiChIP data. Red shows pathways relevant to cancer or leukemia inhibition among the top 20 significantly enriched Biological Processes for genes with promoter chromatin interactions substantially increased in WT over vector expressing cells. Blue shows pathways particularly relevant to cell growth and survival among the top 20 significantly enriched Biological Processes for genes with promoter chromatin interactions substantially decreased in WT over vector expressing cells. All by Metascape. Details in Supplementary Table 5.
i, j. BART3D results showing transcriptional regulators that were likely to be associated with genomic regions that had increased (i) or decreased (j) chromatin interactions in WT over vector expressing cells from indicated HiChIP datasets. Top 10 ranked transcriptional regulators are labeled in red and their names are shown.
For all box plots, data are median (horizontal line), 25-75th percentiles (box) and 1.5 times the interquartile range recorded (whiskers). P values by two-sided t-test for all except by hypergeometric test for h, and from BART3D for i, j.
Extended Data Figure 10. Integrated genomic analysis for example genes.

a. Normalized RNA-seq reads of indicated genes that are shown for integrated genomic analysis, in Vector (V), WT (W), ΔcIDR (c), UTX-eIFIDR (e), ΔcTPR (T) samples. One repeat of the Vector sample was set to 1. HK2 gene (boxed) differs from the other genes in that it was repressed by UTX WT but not ΔcIDR.
b. Integrated genomic analysis for MX2-MX1 cluster, OAS1-3-2 cluster, OASL, UBE2W-LY96 cluster, KCNJ2, and HK2. as examples for UTX condensates-regulated gene expression associated with chromatin interactions. Top, PRO-seq 3′ end coverage tracks (red, + strand; blue, – strand), with the same scale for all samples. A higher MX2 transcriptional activity in WT than ΔcIDR cells is shown by the denser WT PRO-seq signals when IGV-zoomed in in the dashed box on top. Also note the higher transcriptional activity of LY96 in UTX WT than vector and ΔcIDR cells, as shown by the PRO-seq signal density and the - strand eRNA (in green oval) at both LY96 promoter and gene-downstream enhancer. Green arrows show the higher H3K4me1 or H3K27ac signal in WT than the other two cell samples at OASL promoter. PRO-seq confirmed transcriptional changes and, together with the H3K4me1 and H3K27ac peaks, revealed actively and bi-directionally transcribing enhancers. Note that H3K27ac and/or H3K4me1 were increased at MX2, OASL, and KCNJ2 promoters or enhancers upon WT but not ΔcIDR expression. Bottom, H3K27ac HiChIP arc plots of loops are shown on WashU EpiGenome Browser. All arc plots have the same scale for statistical significance (arc darkness) of the loop calls. Black arrows indicate normal loops in WT-expressing cells that were lost in vector, ΔcIDR, or ΔTPR cells. Cyan arrows indicate loops normally suppressed by UTX WT but aberrantly formed in vector, ΔcIDR, or ΔTPR cells.
Extended Data Figure 11. UTY is a weaker tumor suppressor than UTX due to its altered physical property of condensates.
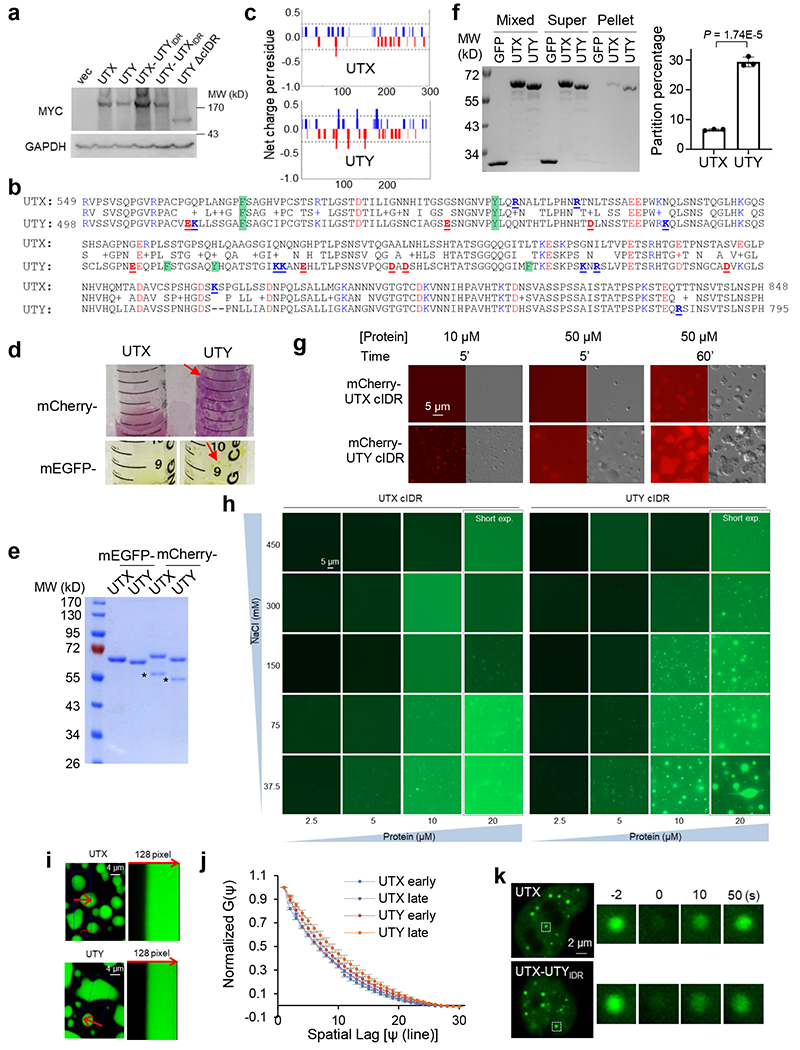
a. Immunoblotting by indicated antibody of total lysates from THP-1 cells electroporated with empty vector or indicated Myc-tagged UTX WT or mutants.
b. Amino acid sequence alignment of UTX and UTY cIDR. Middle row shows identical residues (by letter) and conservative mutations (by “+”). Y and F are labeled with green box. Negatively charged residues (E and D) are in red font, and positively charged residues (R and K) are in blue font. Charged residues that are unique in UTX or UTY cIDR are bold and underlined.
c. Net charge per residue for cIDR of UTX and UTY, determined by CIDER.
d. Images of Ni resin after binding with bacterial lysates during purification of indicated proteins. Red arrows point to the unusual aggregation of the resin bound to UTY cIDR.
e. Coomassie blue staining image of purified UTX cIDR and UTY cIDR with indicated fluorescence tag. A non-specific band is indicated by the asterisk.
f. Indicated proteins all at 30 μM protein and in 150 mM NaCl were subjected to centrifugation. The unspun mixture (“mixed”), supernatant (“super”), and pellets were resolved on SDS-PAGE gel followed with coomassie blue staining. Partition Percentage is plotted (right) as described in Methods as mean ± SD of 3 repeats. ***P<0.001 by two-sided t-test.
g. Fluorescence and DIC images of mCherry-UTX cIDR or mCherry-UTY cIDR at indicated concentrations and time points after dilution into the condensation buffer.
h. Fluorescence microscopy images of mEGFP-UTX cIDR or mEGFP-UTY cIDR at increasing concentrations of protein and NaCl. A shorter exposure time was used for all images of 20 μM protein.
i. Fluorescence Image and line carpet of mEGFP-UTX cIDR and mEGFP-UTY cIDR droplets.
j. Line RICS autocorrelation curves of 50 μM mEGFP-UTX cIDR and mEGFP-UTY cIDR at early (< or = 100 min) or late (> 170 min) time of phase separation after dilution into the condensation buffer, shown as mean ± SD. n UTX early = 8, n UTY early = 9, n UTX late = 8, n UTY late = 9 droplets.
k. Representative fluorescence microscopy images for FRAP assays of UTX or UTX-UTYIDR fused to EGFP in nuclei following transfection into 293T cells. The photobleached focus was boxed and also amplified in the images on the right. Photobleached at time 0.
Extended Data Figure 12. UTX cancer-associated missense mutations alter condensate properties.

All panels in this figure used 20 μM (unless otherwise indicated in a) mEGFP-UTX (419-848) WT or mutants as indicated. S781Y and S814F mutation was found in one and two patients, respectively, and both were predicted by ICGC to have high functional impact. 5M is a compound missense mutation containing S674Y, S781Y, H808Y, S814F, and S818L, all found in one cancer patient. See Methods “Cancer database analysis for mutations” for details.
a. Pictures and relative turbidity as OD600 normalized to the value of WT and plotted as mean ± SD. n = 3 independent experiments. Bottom, coomassie blue staining of the corresponding proteins, sometimes with finely adjusted (10%) different concentrations (for S814F) to ensure fair comparison with WT.
b. Representative fluorescence microscopy and DIC images at indicated times in condensation. Scale bar, 10 μm.
c. FRAP recovery curves as mean ± SD at indicated early and late times in condensation. Top two panels, n = 13 droplets for WT and S781Y each at early times, and n = 9 for each of them at late times. Bottom two panels, n = 9, 10, 10 for WT, 5M, S814F, respectively, at early times, and n = 8 for each of them at late times. The statistics is for the last time points, but, for WT and S814F at late condensation times, is for 0-143 seconds after photobleaching.
d-f. Line RICS assays for WT (n = 21 droplets), S781Y (n = 12), S814F (n = 10), and 5M (n = 11) over the time range of 0-100 min in condensation.
d. Fluorescence Images and line carpets.
e. Line RICS autocorrelation curves.
f. Plot showing the mean ± SD of the diffusion coefficients.
***P<0.001, and ****P<0.0001 by two-sided t-test for all.
Supplementary Material
Acknowledgments:
We thank Kimberly Kelly for MiaPaca2 cells, Jung-Bun Shin for COS-7 cells, Todd Stukenberg for LacO array-containing cells, Marty Mayo for the luciferase plasmid, and Todd Stukenberg and Cliff Brangwynne for the Cry2-containing plasmid. We thank Bing Ren for advice on HiChIP assays, Michael Guertin and Kizhakke Mattada Sathyan on PRO-seq assays, and Kai Ge on immunoblotting for MLL3 and MLL4 and providing MLL3 antibody. We thank Yongde Bao and UVa Genome Analysis and Technology Core for excellent deep sequencing services. We thank Karsten Siller, Gladys Andino Bautista, Jacalyn Huband, Ruoshi Sun, and Edward Hall at the University of Virginia Research Computing Center for excellence technical support. H.J. was supported by NIH grant 1 R21 CA257936-01 and start-up funds from the University of Virginia. The Confocal microscopy system at the Keck Center of University of Virginia was supported by a grant from NIH (OD016446). Sequencing in this research was supported by NCI Cancer Center Support Grant 5P30CA044579. H.J. is a recipient of the American Cancer Society Research Scholar Award (RSG-15-166-01-DMC) and the Leukemia & Lymphoma Society Scholar Award (1354-19). C.Z. was supported by NIH grant R35 GM133712. Z.W. was supported by the Farrow Fellowship and by the NCI Cancer Center Support Grant P30 CA44579. F.P. and M.A.D. were supported in part by a grant from the NSF (MCB-1615701). M.A.D. and E.G. were funded by NIH grant number P41-GM103540.
Footnotes
Competing interests
The authors declare no competing interests.
Code availability
The scripts used to analyze the data from this study are freely available at: https://github.com/zanglab/utx_code.
Data availability
The high-throughput sequencing data, including RNA-seq, ChIP-seq, PRO-seq, and HiChIP, have been deposited in Gene Expression Omnibus database with the accession number GSE149420. The source code is available at GitHub: https://github.com/zanglab/utx_code. Cancer mutation data are available from cBioPortal (http://www.cbioportal.org/) and TCGA database.
References
- 1.Wang L & Shilatifard A UTX Mutations in Human Cancer. Cancer cell 35, 168–176, doi: 10.1016/j.ccell.2019.01.001 (2019). [DOI] [PMC free article] [PubMed] [Google Scholar]
- 2.Gozdecka M et al. UTX-mediated enhancer and chromatin remodeling suppresses myeloid leukemogenesis through noncatalytic inverse regulation of ETS and GATA programs. Nature genetics 50, 883–894, doi: 10.1038/s41588-018-0114-z (2018). [DOI] [PMC free article] [PubMed] [Google Scholar]
- 3.Andricovich J et al. Loss of KDM6A Activates Super-Enhancers to Induce Gender-Specific Squamous-like Pancreatic Cancer and Confers Sensitivity to BET Inhibitors. Cancer cell 33, 512–526.e518, doi: 10.1016/j.ccell.2018.02.003 (2018). [DOI] [PMC free article] [PubMed] [Google Scholar]
- 4.Morales Torres C, Laugesen A & Helin K Utx is required for proper induction of ectoderm and mesoderm during differentiation of embryonic stem cells. PloS one 8, e60020, doi: 10.1371/journal.pone.0060020 (2013). [DOI] [PMC free article] [PubMed] [Google Scholar]
- 5.Wang C et al. UTX regulates mesoderm differentiation of embryonic stem cells independent of H3K27 demethylase activity. Proceedings of the National Academy of Sciences of the United States of America 109, 15324–15329, doi: 10.1073/pnas.1204166109 (2012). [DOI] [PMC free article] [PubMed] [Google Scholar]
- 6.Shpargel KB, Sengoku T, Yokoyama S & Magnuson T UTX and UTY demonstrate histone demethylase-independent function in mouse embryonic development. PLoS genetics 8, e1002964, doi: 10.1371/journal.pgen.1002964 (2012). [DOI] [PMC free article] [PubMed] [Google Scholar]
- 7.Shpargel KB, Starmer J, Wang C, Ge K & Magnuson T UTX-guided neural crest function underlies craniofacial features of Kabuki syndrome. Proceedings of the National Academy of Sciences of the United States of America 114, E9046–e9055, doi: 10.1073/pnas.1705011114 (2017). [DOI] [PMC free article] [PubMed] [Google Scholar]
- 8.Miller SA, Mohn SE & Weinmann AS Jmjd3 and UTX play a demethylase-independent role in chromatin remodeling to regulate T-box family member-dependent gene expression. Molecular cell 40, 594–605, doi: 10.1016/j.molcel.2010.10.028 (2010). [DOI] [PMC free article] [PubMed] [Google Scholar]
- 9.Banani SF, Lee HO, Hyman AA & Rosen MK Biomolecular condensates: organizers of cellular biochemistry. Nature reviews. Molecular cell biology 18, 285–298, doi: 10.1038/nrm.2017.7 (2017). [DOI] [PMC free article] [PubMed] [Google Scholar]
- 10.Li W et al. Biophysical properties of AKAP95 protein condensates regulate splicing and tumorigenesis. Nature cell biology 22, 960–972, doi: 10.1038/s41556-020-0550-8 (2020). [DOI] [PMC free article] [PubMed] [Google Scholar]
- 11.Lin Y, Protter DS, Rosen MK & Parker R Formation and Maturation of Phase-Separated Liquid Droplets by RNA-Binding Proteins. Molecular cell 60, 208–219, doi: 10.1016/j.molcel.2015.08.018 (2015). [DOI] [PMC free article] [PubMed] [Google Scholar]
- 12.Alam H et al. KMT2D Deficiency Impairs Super-Enhancers to Confer a Glycolytic Vulnerability in Lung Cancer. Cancer cell 37, 599–617, doi: 10.1016/j.ccell.2020.03.005 (2020). [DOI] [PMC free article] [PubMed] [Google Scholar]
- 13.Mansour AA et al. The H3K27 demethylase Utx regulates somatic and germ cell epigenetic reprogramming. Nature 488, 409–413, doi: 10.1038/nature11272 (2012). [DOI] [PubMed] [Google Scholar]
- 14.Tran N, Broun A & Ge K Lysine Demethylase KDM6A in Differentiation, Development, and Cancer. Molecular and cellular biology 40, doi: 10.1128/mcb.00341-20 (2020). [DOI] [PMC free article] [PubMed] [Google Scholar]
- 15.Shin Y et al. Spatiotemporal Control of Intracellular Phase Transitions Using Light-Activated optoDroplets. Cell 168, 159–171.e114, doi: 10.1016/j.cell.2016.11.054 (2017). [DOI] [PMC free article] [PubMed] [Google Scholar]
- 16.Kim JH et al. UTX and MLL4 coordinately regulate transcriptional programs for cell proliferation and invasiveness in breast cancer cells. Cancer research 74, 1705–1717, doi: 10.1158/0008-5472.can-13-1896 (2014). [DOI] [PMC free article] [PubMed] [Google Scholar]
- 17.Janicki SM et al. From silencing to gene expression: real-time analysis in single cells. Cell 116, 683–698, doi: 10.1016/s0092-8674(04)00171-0 (2004). [DOI] [PMC free article] [PubMed] [Google Scholar]
- 18.Wang SP et al. A UTX-MLL4-p300 Transcriptional Regulatory Network Coordinately Shapes Active Enhancer Landscapes for Eliciting Transcription. Molecular cell 67, 308–321.e306, doi: 10.1016/j.molcel.2017.06.028 (2017). [DOI] [PMC free article] [PubMed] [Google Scholar]
- 19.Tie F, Banerjee R, Conrad PA, Scacheri PC & Harte PJ Histone demethylase UTX and chromatin remodeler BRM bind directly to CBP and modulate acetylation of histone H3 lysine 27. Molecular and cellular biology 32, 2323–2334, doi: 10.1128/mcb.06392-11 (2012). [DOI] [PMC free article] [PubMed] [Google Scholar]
- 20.Mumbach MR et al. HiChIP: efficient and sensitive analysis of protein-directed genome architecture. Nature methods 13, 919–922, doi: 10.1038/nmeth.3999 (2016). [DOI] [PMC free article] [PubMed] [Google Scholar]
- 21.Fang R et al. Mapping of long-range chromatin interactions by proximity ligation-assisted ChIP-seq. Cell research 26, 1345–1348, doi: 10.1038/cr.2016.137 (2016). [DOI] [PMC free article] [PubMed] [Google Scholar]
- 22.Wang Z, Zhang Y & Zang C BART3D: Inferring transcriptional regulators associated with differential chromatin interactions from Hi-C data. Bioinformatics (Oxford, England), doi: 10.1093/bioinformatics/btab173 (2021). [DOI] [PMC free article] [PubMed] [Google Scholar]
- 23.Dunford A et al. Tumor-suppressor genes that escape from X-inactivation contribute to cancer sex bias. Nature genetics 49, 10–16, doi: 10.1038/ng.3726 (2017). [DOI] [PMC free article] [PubMed] [Google Scholar]
- 24.Gazova I, Lengeling A & Summers KM Lysine demethylases KDM6A and UTY: The X and Y of histone demethylation. Molecular genetics and metabolism 127, 31–44, doi: 10.1016/j.ymgme.2019.04.012 (2019). [DOI] [PubMed] [Google Scholar]
- 25.Li X et al. UTX is an escape from X-inactivation tumor-suppressor in B cell lymphoma. Nature communications 9, 2720, doi: 10.1038/s41467-018-05084-w (2018). [DOI] [PMC free article] [PubMed] [Google Scholar]
- 26.Sze CC & Shilatifard A MLL3/MLL4/COMPASS Family on Epigenetic Regulation of Enhancer Function and Cancer. Cold Spring Harbor perspectives in medicine 6, doi: 10.1101/cshperspect.a026427 (2016). [DOI] [PMC free article] [PubMed] [Google Scholar]
- 27.Herz HM et al. The H3K27me3 demethylase dUTX is a suppressor of Notch- and Rb-dependent tumors in Drosophila. Molecular and cellular biology 30, 2485–2497, doi: 10.1128/mcb.01633-09 (2010). [DOI] [PMC free article] [PubMed] [Google Scholar]
- 28.Ma L et al. Co-condensation between transcription factor and coactivator p300 modulates transcriptional bursting kinetics. Molecular cell 81, 1682–1697 e1687, doi: 10.1016/j.molcel.2021.01.031 (2021). [DOI] [PubMed] [Google Scholar]
- 29.Fasciani A et al. MLL4-associated condensates counterbalance Polycomb-mediated nuclear mechanical stress in Kabuki syndrome. Nature genetics 52, 1397–1411, doi: 10.1038/s41588-020-00724-8 (2020). [DOI] [PMC free article] [PubMed] [Google Scholar]
- 30.Boija A et al. Transcription Factors Activate Genes through the Phase-Separation Capacity of Their Activation Domains. Cell 175, 1842–1855.e1816, doi: 10.1016/j.cell.2018.10.042 (2018). [DOI] [PMC free article] [PubMed] [Google Scholar]
- 31.Benyoucef A et al. UTX inhibition as selective epigenetic therapy against TAL1-driven T-cell acute lymphoblastic leukemia. Genes & development 30, 508–521, doi: 10.1101/gad.276790.115 (2016). [DOI] [PMC free article] [PubMed] [Google Scholar]
- 32.Faralli H et al. UTX demethylase activity is required for satellite cell-mediated muscle regeneration. The Journal of clinical investigation 126, 1555–1565, doi: 10.1172/jci83239 (2016). [DOI] [PMC free article] [PubMed] [Google Scholar]
- 33.Beyaz S et al. The histone demethylase UTX regulates the lineage-specific epigenetic program of invariant natural killer T cells. Nature immunology 18, 184–195, doi: 10.1038/ni.3644 (2017). [DOI] [PMC free article] [PubMed] [Google Scholar]
- 34.Bogershausen N et al. Mutation Update for Kabuki Syndrome Genes KMT2D and KDM6A and Further Delineation of X-Linked Kabuki Syndrome Subtype 2. Human mutation 37, 847–864, doi: 10.1002/humu.23026 (2016). [DOI] [PubMed] [Google Scholar]
- 35.Yang Z et al. The DPY30 subunit in SET1/MLL complexes regulates the proliferation and differentiation of hematopoietic progenitor cells. Blood 124, 2025–2033, doi: 10.1182/blood-2014-01-549220 (2014). [DOI] [PMC free article] [PubMed] [Google Scholar]
- 36.Jiang H et al. Role for Dpy-30 in ES cell-fate specification by regulation of H3K4 methylation within bivalent domains. Cell 144, 513–525, doi: 10.1016/j.cell.2011.01.020 (2011). [DOI] [PMC free article] [PubMed] [Google Scholar]
- 37.Schulz WA, Lang A, Koch J & Greife A The histone demethylase UTX/KDM6A in cancer: Progress and puzzles. International journal of cancer 145, 614–620, doi: 10.1002/ijc.32116 (2019). [DOI] [PubMed] [Google Scholar]
- 38.Wang J et al. A Molecular Grammar Governing the Driving Forces for Phase Separation of Prion-like RNA Binding Proteins. Cell 174, 688–699.e616, doi: 10.1016/j.cell.2018.06.006 (2018). [DOI] [PMC free article] [PubMed] [Google Scholar]
- 39.Niaki AG et al. Loss of Dynamic RNA Interaction and Aberrant Phase Separation Induced by Two Distinct Types of ALS/FTD-Linked FUS Mutations. Molecular cell 77, 82–94.e84, doi: 10.1016/j.molcel.2019.09.022 (2020). [DOI] [PMC free article] [PubMed] [Google Scholar]
- 40.Holehouse AS, Das RK, Ahad JN, Richardson MO & Pappu RV CIDER: Resources to Analyze Sequence-Ensemble Relationships of Intrinsically Disordered Proteins. Biophysical journal 112, 16–21, doi: 10.1016/j.bpj.2016.11.3200 (2017). [DOI] [PMC free article] [PubMed] [Google Scholar]
- 41.Dignam JD, Lebovitz RM & Roeder RG Accurate transcription initiation by RNA polymerase II in a soluble extract from isolated mammalian nuclei. Nucleic acids research 11, 1475–1489, doi: 10.1093/nar/11.5.1475 (1983). [DOI] [PMC free article] [PubMed] [Google Scholar]
- 42.Fujioka A et al. Dynamics of the Ras/ERK MAPK cascade as monitored by fluorescent probes. The Journal of biological chemistry 281, 8917–8926, doi: 10.1074/jbc.M509344200 (2006). [DOI] [PubMed] [Google Scholar]
- 43.Illuminating the Dark Proteome. Cell 166, 1074–1077, doi: 10.1016/j.cell.2016.08.012 (2016). [DOI] [PubMed] [Google Scholar]
- 44.Rossow MJ, Sasaki JM, Digman MA & Gratton E Raster image correlation spectroscopy in live cells. Nature protocols 5, 1761–1774, doi: 10.1038/nprot.2010.122 (2010). [DOI] [PMC free article] [PubMed] [Google Scholar]
- 45.Digman MA & Gratton E Analysis of diffusion and binding in cells using the RICS approach. Microscopy research and technique 72, 323–332, doi: 10.1002/jemt.20655 (2009). [DOI] [PMC free article] [PubMed] [Google Scholar]
- 46.Day CA, Kraft LJ, Kang M & Kenworthy AK Analysis of protein and lipid dynamics using confocal fluorescence recovery after photobleaching (FRAP). Current protocols in cytometry Chapter 2, Unit2.19, doi: 10.1002/0471142956.cy0219s62 (2012). [DOI] [PMC free article] [PubMed] [Google Scholar]
- 47.Kwak H, Fuda NJ, Core LJ & Lis JT Precise maps of RNA polymerase reveal how promoters direct initiation and pausing. Science (New York, N.Y.) 339, 950–953, doi: 10.1126/science.1229386 (2013). [DOI] [PMC free article] [PubMed] [Google Scholar]
- 48.Judd J et al. A rapid, sensitive, scalable method for Precision Run-On sequencing (PRO-seq). bioRxiv, 2020.2005.2018.102277, doi: 10.1101/2020.05.18.102277 (2020). [DOI] [Google Scholar]
- 49.Dobin A et al. STAR: ultrafast universal RNA-seq aligner. Bioinformatics (Oxford, England) 29, 15–21, doi: 10.1093/bioinformatics/bts635 (2013). [DOI] [PMC free article] [PubMed] [Google Scholar]
- 50.Li B & Dewey CN RSEM: accurate transcript quantification from RNA-Seq data with or without a reference genome. BMC bioinformatics 12, 323, doi: 10.1186/1471-2105-12-323 (2011). [DOI] [PMC free article] [PubMed] [Google Scholar]
- 51.Love MI, Huber W & Anders S Moderated estimation of fold change and dispersion for RNA-seq data with DESeq2. Genome biology 15, 550, doi: 10.1186/s13059-014-0550-8 (2014). [DOI] [PMC free article] [PubMed] [Google Scholar]
- 52.Huang da W, Sherman BT & Lempicki RA Systematic and integrative analysis of large gene lists using DAVID bioinformatics resources. Nature protocols 4, 44–57, doi: 10.1038/nprot.2008.211 (2009). [DOI] [PubMed] [Google Scholar]
- 53.Zhou Y et al. Metascape provides a biologist-oriented resource for the analysis of systems-level datasets. Nature communications 10, 1523, doi: 10.1038/s41467-019-09234-6 (2019). [DOI] [PMC free article] [PubMed] [Google Scholar]
- 54.Li H & Durbin R Fast and accurate short read alignment with Burrows-Wheeler transform. Bioinformatics (Oxford, England) 25, 1754–1760, doi: 10.1093/bioinformatics/btp324 (2009). [DOI] [PMC free article] [PubMed] [Google Scholar]
- 55.Li H et al. The Sequence Alignment/Map format and SAMtools. Bioinformatics (Oxford, England) 25, 2078–2079, doi: 10.1093/bioinformatics/btp352 (2009). [DOI] [PMC free article] [PubMed] [Google Scholar]
- 56.Zhang Y et al. Model-based analysis of ChIP-Seq (MACS). Genome biology 9, R137, doi: 10.1186/gb-2008-9-9-r137 (2008). [DOI] [PMC free article] [PubMed] [Google Scholar]
- 57.Quinlan AR & Hall IM BEDTools: a flexible suite of utilities for comparing genomic features. Bioinformatics (Oxford, England) 26, 841–842, doi: 10.1093/bioinformatics/btq033 (2010). [DOI] [PMC free article] [PubMed] [Google Scholar]
- 58.Zang C et al. A clustering approach for identification of enriched domains from histone modification ChIP-Seq data. Bioinformatics (Oxford, England) 25, 1952–1958, doi: 10.1093/bioinformatics/btp340 (2009). [DOI] [PMC free article] [PubMed] [Google Scholar]
- 59.Juric I et al. MAPS: Model-based analysis of long-range chromatin interactions from PLAC-seq and HiChIP experiments. PLoS computational biology 15, e1006982, doi: 10.1371/journal.pcbi.1006982 (2019). [DOI] [PMC free article] [PubMed] [Google Scholar]
- 60.Li D, Hsu S, Purushotham D, Sears RL & Wang T WashU Epigenome Browser update 2019. Nucleic acids research 47, W158–w165, doi: 10.1093/nar/gkz348 (2019). [DOI] [PMC free article] [PubMed] [Google Scholar]
- 61.Wang S et al. Modeling cis-regulation with a compendium of genome-wide histone H3K27ac profiles. Genome research 26, 1417–1429, doi: 10.1101/gr.201574.115 (2016). [DOI] [PMC free article] [PubMed] [Google Scholar]
- 62.Servant N et al. HiC-Pro: an optimized and flexible pipeline for Hi-C data processing. Genome biology 16, 259, doi: 10.1186/s13059-015-0831-x (2015). [DOI] [PMC free article] [PubMed] [Google Scholar]
Associated Data
This section collects any data citations, data availability statements, or supplementary materials included in this article.
Supplementary Materials
Data Availability Statement
The high-throughput sequencing data, including RNA-seq, ChIP-seq, PRO-seq, and HiChIP, have been deposited in Gene Expression Omnibus database with the accession number GSE149420. The source code is available at GitHub: https://github.com/zanglab/utx_code. Cancer mutation data are available from cBioPortal (http://www.cbioportal.org/) and TCGA database.