

Abstract
Introduction
Bibliometric analyses are a method of evaluating the quality of research output in a certain domain. Robotic surgery has made vast leaps during the past 20 years and this paper aimed to assess some of the main areas of research using this method.
Methods
A search was undertaken for documents published between 2001 and 2021 from the World of Science database, using the keywords ‘robotic surgery’, ‘robotic assisted surgery’ and ‘robotic-assisted surgery. Results were compared using numerous bibliometric methodologies, and stratified by source-specific metrics, author-specific metrics and country-specific metrics.
Results
The search yielded 3839 documents, from 879 different sources. Only 2% of sources were found to be within Bradford’s Zone 1 of research and the most relevant sources were from the field of urology. The Journal of Urology and Surgical Endoscopy and other Techniques ranked highly among metrics such as H, G, M index and total citations. The top-rated authors had a H index of 15 in the field of robotic surgery and the total citations reached a peak at 1342. The USA, Japan and Italy were the most productive nations and increased collaborative research is leading to a greater number of multiple-centre publications.
Conclusion
Research into robotic surgery is still in its infancy with further reviews of the literature and greater output through large randomised controlled trials in multiple centres through collaborative research needed.
Introduction
Robotic surgery has advanced significantly in the last 20 years. Whilst beginning as stereotaxic systems in the late 1980s, for example the PUMA 200 [1], surgical robots have adapted to not only enable surgery with fewer cuts, but with better precision, accuracy, degrees of freedom and even magnification. A steady movement towards a fifth generation of autonomous robot is being made [2].
Specialties such as urology and gynaecology have long been trailblazers in robotic application and research with some expansion into general surgery and cardiothoracic surgery. The future frontiers of robotic surgery and its full capability are yet to be realised.
Research in robotic surgery was led with the publication of seminal works, such as Nix et al.’s randomised clinical trial on radical cystectomy [3]; however, the research field is young with higher levels of evidence required to prove equivalence or benefit over standard laparoscopic or open techniques.
Bibliometric analyses are defined as efforts to evaluate the quality of research through the measurement of various parameters of scholarly output. This enables a reader to gauge not only the volume of an author’s output or the rate, but an objective demonstration of the number of citations and relationships between authors and articles, not limited to peer-reviewed manuscripts. This then allows analysis of the impact and popularity of publications, authors, institutions and collaborative links.
This analysis can be used with numerous applications, including grant allocations, and by policymakers to set standards for research and direct suitable funding. This study aims to use bibliometric techniques to identify the research trends and patterns of robotic research output from the last 20 years (2001–2021).
Materials and methods
A comprehensive search of the literature was completed. This was taken from the ‘Web of Science Collection’, a subset of the ‘Web of Science’ database, which includes the Science Citation Index Expanded (SCIE), the Social Sciences Citation Index (SSCI) and the Arts and Humanities Citation Index (A&HCI). This database was chosen due to its standing in the academic world as one of the premier citation search platforms [4] and has been proved to be more accurate than rivals such as Scopus in fields such as its journal classification system [5, 6].
A search using the keywords, ‘robotic surgery’, ‘robotic assisted surgery’ and ‘robotic-assisted surgery’ was performed between January 2001 and January 2021.
After completing this search source-specific metrics, author-specific metrics and country-specific metrics were found. A keyword analysis of all the sources was also performed.
Source-specific metrics
The relevance of a source was measured using the total number of documents drawn from a source and were then clustered, using Bradford’s Law into zones. Zones as shown by Bradford’s Law as are indicative of their utility in a certain field [7, 8]. In this case, journals or sources in Zone 1 would be those with the highest productivity within robotic surgery and would represent “the core” of the literature. Total citations (TC) and the number of documents drawn per year per source were also included.
Author-specific metrics
The impact and relevance of authors were considered by drawing their number of documents with an absolute and a fractionalised value, used to understand their contributions in the context of both individual and collaborative research. Fractionalised counting allocates the credit of publication to co-authors in a fractional way, thus by comparing the total and fractional number of articles, one can analyse both participation and contribution to the field of robotic surgery, respectively [9, 10]. Total citations per author were also considered, along with the h, g and m index values. The h-index is a value that combines both publication and citation count to form a sole value. If an author publishes five articles, each with five citations, his/her h index would be 5. This would only increase if he/she published a sixth article and their total articles managed a minimum of six citations each. This begins to quantify both the quality and quantity of an author’s productivity [11]. The g index of an author is another metric of output, which is defined as an author’s top g articles that have been cited an average of g times or at least g2 times. The M index is an author’s H index/the years since their first publication. This tries to compare the output levels of author over time and takes into account early researchers.
Country-specific metrics
The number of documents per country, the number of single country publications (SCP) and their involvement in multiple country publications (MCP) was considered. An MCP ratio was calculated, which indicates the level of international collaboration in an evidence base. The number of countries involved is calculated as a ratio of the total number of publications with the first author being from that country.
Statistics
Data were collected and collated on Excel (Microsoft, United States). Statistical analysis was completed using IBM SPSS Statistics (IBM, United States).
Results
Demographics of the literature
A total of 3839 documents were found and analysed, from 879 different sources. A summary of this data is shown in Table 1. 13,378 different authors were involved in this research, 99.1% (13,258) of which were part of multi-authored documents. On average, there were 3.48 and 5.05 authors and co-authors, respectively, per document, with a mean of 0.287 documents per author. The mean Collaboration Index was 3.58. Furthermore, 68.1% (n = 2613) of all studies were articles, with the rest of the documents spread between book reviews, editorial materials, letters, proceedings papers, abstracts, news items, reprints and reviews.
Table 1.
Collection of overarching information regarding the collection
| Main information about the collection | Description | Results |
|---|---|---|
| Main information about data | Timespan | 2001–2021 |
| Sources (Journals, Books, etc.) | 879 | |
| Documents | 3839 | |
| Average years from publication | 5.9 | |
| Average citations per documents | 13.75 | |
| Average citations per year per doc | 1.735 | |
| References | 1 | |
| Document Types | Article | 2613 |
| Article; proceedings paper | 144 | |
| Book review | 1 | |
| Correction | 4 | |
| Editorial material | 126 | |
| Letter | 30 | |
| Meeting abstract | 171 | |
| News item | 1 | |
| Proceedings paper | 195 | |
| Reprint | 1 | |
| Review | 552 | |
| Review; book chapter | 1 | |
| DocumenT Contents | ||
| Keywords Plus (ID) | 4170 | |
| Author's keywords (DE) | 5436 | |
| Authors | Authors | 13,378 |
| Author appearances | 19,401 | |
| Authors of single-authored documents | 120 | |
| Authors of multi-authored documents | 13,258 | |
| Authors collaboration | Single-authored documents | 131 |
| Documents per author | 0.287 | |
| Authors per document | 3.48 | |
| Co-Authors per documents | 5.05 | |
| Collaboration index | 3.58 |
As shown in Fig. 1 and Table 2, productivity has greatly increased over the last 20 years. Over the past 5 years, 52.6% (n = 2018) of the literature over the course of the past 20 years has been produced. The greatest proportional increase was between 2001–2005 and 2006–2010, with a 5.4 × increase in the number of documents created.
Table 3.
Table showing the resources in Zone 1
| Source | Rank | Frequency | Cumulative frequency | Zone |
|---|---|---|---|---|
| Journal of Robotic Surgery | 1 | 241 | 241 | Zone 1 |
| Surgical Endoscopy and Other Interventional Techniques | 2 | 127 | 368 | Zone 1 |
| Urology | 3 | 91 | 459 | Zone 1 |
| International Journal of Medical Robotics and Computer Assisted Surgery | 4 | 87 | 546 | Zone 1 |
| Journal of Minimally Invasive Gynecology | 5 | 77 | 623 | Zone 1 |
| Journal of Urology | 6 | 66 | 689 | Zone 1 |
| Journal of Thoracic Disease | 7 | 55 | 744 | Zone 1 |
| JSLS-Journal Of The Society Of Laparoendoscopic Surgeons | 8 | 54 | 798 | Zone 1 |
| Gynecologic Oncology | 9 | 53 | 851 | Zone 1 |
| Current Opinion In Urology | 10 | 44 | 895 | Zone 1 |
| Journal Of Laparoendoscopic & Advanced Surgical Techniques | 11 | 43 | 938 | Zone 1 |
| Innovations-Technology And Techniques In Cardiothoracic And Vascular Surgery | 12 | 41 | 979 | Zone 1 |
| BJU International | 13 | 40 | 1019 | Zone 1 |
| International Journal Of Gynecological Cancer | 14 | 39 | 1058 | Zone 1 |
| World Journal Of Urology | 15 | 36 | 1094 | Zone 1 |
| Annals Of Thoracic Surgery | 16 | 35 | 1129 | Zone 1 |
| Journal Of Pediatric Urology | 17 | 32 | 1161 | Zone 1 |
| Obesity Surgery | 18 | 30 | 1191 | Zone 1 |
| European Urology | 19 | 29 | 1220 | Zone 1 |
| Female Pelvic Medicine And Reconstructive Surgery | 20 | 27 | 1247 | Zone 1 |
| Canadian Journal Of Urology | 21 | 26 | 1273 | Zone 1 |
Fig. 1.

Graph showing the annual scientific production
Table 2.
Annual scientific productivity on robotic surgery
| Year | Articles |
|---|---|
| 2001–2005 | 88 |
| 2006–2010 | 476 |
| 2011–2015 | 1257 |
| 2016–2021 | 2018 |
Source analysis
Sources were ranked by relevance to the topic with the total number of documents per source. The Journal of Robotic Surgery housed the greatest number of documents (n = 241), followed by Surgical Endoscopy and Other Interventional Techniques (n = 127) and Urology (n = 91) as the next most relevant. The top 25 most relevant sources are charted in Fig. 2. Building on this, 40% of the 25 most relevant sources were related to the specialty of urology, with gynaecology, thoracic surgery followed by general surgery.
Fig. 3.
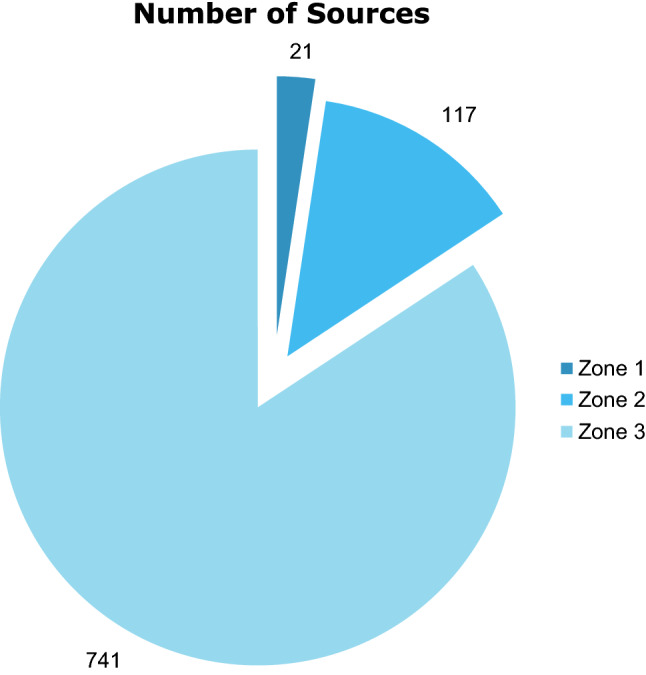
Pie Chart showing Bradford's Law
Fig. 2.

Graph showing the distribution of the Top 25 most relevant sources
When sources were clustered using Bradford’s Law, only 2.39% (n = 21) sources were in Zone 1 this being the core of the literature, 1.33% (n = 117) were in Zone 2 and 84.3% (n = 741) were in Zone 3. 33.3% (n = 7) of the sources in Zone 1 were related to the field of urology.
Subsequently, sources were stratified by their h index, g index, m index and total citations, as shown in Fig. 4. The Journal of Urology was well represented in all three measures, with the top-ranked h index, the second g and m index and total citations. This indicates that there was not only a large amount of data from this journal, but it was influential in the field. Surgical Endoscopy and other Interventional Techniques had the highest number of total citations and, g index and third greatest m index ranking. This had the greatest impact using this variable, followed by Surgical Endoscopy and other Interventional Techniques. The greatest number of total citations was in Surgical Endoscopy and Other Interventional Techniques, again followed by the Journal of Urology. 28% (n = 7) of the sources with the highest number of total citations were in the field of urology.
Fig. 4.

Graph showing the h index, g index, m index and total citations of the top 25 most productive sources
Author-specific analysis
Table 4 shows author-specific results for the top 20 most productive authors. All the top 20 authors had a h index of at least 5 with a median (IQR) of 9.5 (398), and the number of total citations ranged from 71 to 1342, with a median (IQR) of 341.5(5.75). The median (IQR) g index was 15 (3.5) and scores ranged from 7 to 26. Furthermore, the median (IQR) m index was 0.61(0.27) with a range from 0.375 to 1.14.
Table 5.
Table showing statistics regarding the country of origin of the research
| Country | Articles | Frequency | SCP | MCP | MCP/SCP Ratio |
|---|---|---|---|---|---|
| USA | 1745 | 0.473028 | 1579 | 166 | 0.0951 |
| China | 275 | 0.074546 | 245 | 30 | 0.1091 |
| Italy | 209 | 0.056655 | 170 | 39 | 0.1866 |
| Germany | 180 | 0.048794 | 140 | 40 | 0.2222 |
| United Kingdom | 177 | 0.047980 | 133 | 44 | 0.2486 |
| France | 167 | 0.045270 | 138 | 29 | 0.1737 |
| Canada | 123 | 0.033342 | 95 | 28 | 0.2276 |
| Japan | 86 | 0.023313 | 77 | 9 | 0.1047 |
| Australia | 74 | 0.020060 | 61 | 13 | 0.1757 |
| Korea | 72 | 0.019517 | 59 | 13 | 0.1806 |
| Turkey | 67 | 0.018162 | 61 | 6 | 0.0896 |
| India | 56 | 0.015180 | 53 | 3 | 0.0536 |
| Spain | 56 | 0.015180 | 33 | 23 | 0.4107 |
| Brazil | 34 | 0.009217 | 23 | 11 | 0.3235 |
| Belgium | 30 | 0.008132 | 20 | 10 | 0.3333 |
| Singapore | 28 | 0.007590 | 20 | 8 | 0.2857 |
| Switzerland | 28 | 0.007590 | 20 | 8 | 0.2857 |
| Israel | 24 | 0.006506 | 16 | 8 | 0.3333 |
| Denmark | 23 | 0.006235 | 20 | 3 | 0.1304 |
| Sweden | 23 | 0.006235 | 17 | 6 | 0.2609 |
| Romania | 22 | 0.005964 | 20 | 2 | 0.0909 |
| Greece | 20 | 0.005422 | 16 | 4 | 0.2000 |
| Netherlands | 19 | 0.005150 | 13 | 6 | 0.3158 |
| Austria | 16 | 0.004337 | 13 | 3 | 0.1875 |
| Iran | 14 | 0.003795 | 13 | 1 | 0.0714 |
| Saudi Arabia | 14 | 0.003795 | 9 | 5 | 0.3571 |
| Finland | 12 | 0.003253 | 10 | 2 | 0.1667 |
| Portugal | 12 | 0.003253 | 7 | 5 | 0.4167 |
| Ireland | 11 | 0.002982 | 7 | 4 | 0.3636 |
| Norway | 11 | 0.002982 | 8 | 3 | 0.2727 |
| Mexico | 7 | 0.001898 | 6 | 1 | 0.1429 |
| Egypt | 6 | 0.001626 | 5 | 1 | 0.1667 |
| Argentina | 5 | 0.001355 | 4 | 1 | 0.2000 |
| Chile | 5 | 0.001355 | 4 | 1 | 0.2000 |
| New Zealand | 5 | 0.001355 | 5 | 0 | 0.0000 |
| Thailand | 5 | 0.001355 | 4 | 1 | 0.2000 |
| United Arab Emirates | 4 | 0.001084 | 3 | 1 | 0.2500 |
| Colombia | 3 | 0.000813 | 2 | 1 | 0.3333 |
| Malaysia | 3 | 0.000813 | 3 | 0 | 0.0000 |
| Poland | 3 | 0.000813 | 3 | 0 | 0.0000 |
| Qatar | 3 | 0.000813 | 1 | 2 | 0.6667 |
| Czech Republic | 2 | 0.000542 | 1 | 1 | 0.5000 |
| Kuwait | 2 | 0.000542 | 1 | 1 | 0.5000 |
| Venezuela | 2 | 0.000542 | 1 | 1 | 0.5000 |
| Vietnam | 2 | 0.000542 | 0 | 2 | 1.0000 |
| Bulgaria | 1 | 0.000271 | 1 | 0 | 0.0000 |
| Indonesia | 1 | 0.000271 | 0 | 1 | 1.0000 |
| Luxembourg | 1 | 0.000271 | 1 | 0 | 0.0000 |
| South Africa | 1 | 0.000271 | 1 | 0 | 0.0000 |
Table 6.
Table showing number of occurrences of keywords
| Words | Occurrences |
|---|---|
| Surgery | 823 |
| Outcomes | 552 |
| Experience | 414 |
| Cancer | 304 |
| Resection | 271 |
| Complications | 231 |
| Management | 211 |
| Learning-curve | 192 |
| Meta-analysis | 138 |
| Impact | 133 |
| System | 118 |
| Hysterectomy | 117 |
| Feasibility | 104 |
| Radical prostatectomy | 104 |
| Survival | 103 |
| Carcinoma | 101 |
| Lymphadenectomy | 95 |
| Children | 91 |
| Endometrial cancer | 88 |
| Trial | 87 |
| Laparotomy | 86 |
| Quality-of-life | 86 |
| Total mesorectal excision | 82 |
| Perioperative outcomes | 75 |
| Risk | 74 |
| Women | 74 |
| Initial experience | 73 |
| Accuracy | 70 |
| Laparoscopic surgery | 69 |
| Follow-up | 67 |
| Lymph-node dissection | 67 |
| Morbidity | 67 |
| Mortality | 62 |
| Tumours | 62 |
| Laparoscopy | 60 |
| Multicentre | 59 |
| Prostatectomy | 59 |
| Short-term outcomes | 58 |
| Replacement | 57 |
| Retropubic prostatectomy | 57 |
| Safety | 57 |
| Cost | 55 |
| Laparoscopic partial nephrectomy | 54 |
| Minimally invasive surgery | 54 |
| Repair | 54 |
| Performance | 53 |
| Rectal-cancer | 50 |
| Thoracic-surgery | 49 |
| Classification | 47 |
| Risk-factors | 47 |
Table 4.
Author-specific results
| Author | h Index | g Index | m Index | Total citations (TC) |
|---|---|---|---|---|
| Yang GZ | 15 | 24 | 0.833 | 594 |
| Stoyanov D | 15 | 26 | 0.833 | 748 |
| Kiaii B | 10 | 14 | 0.588 | 233 |
| Li J | 5 | 9 | 0.385 | 96 |
| Patel RV | 9 | 18 | 0.600 | 328 |
| Ahmad S | 13 | 18 | 0.929 | 746 |
| Holloway RW | 15 | 18 | 1.071 | 810 |
| Dasgupta P | 7 | 16 | 0.412 | 275 |
| Hubert J | 8 | 17 | 0.421 | 355 |
| Pigazzi A | 11 | 17 | 0.688 | 1342 |
| Wang Y | 8 | 14 | 1.143 | 210 |
| Kandil E | 4 | 8 | 0.364 | 76 |
| Patel VR | 10 | 16 | 0.625 | 389 |
| Darzi A | 11 | 15 | 0.550 | 453 |
| Fader AN | 10 | 15 | 0.769 | 592 |
| Gundeti MS | 9 | 14 | 0.692 | 203 |
| Kaouk JH | 11 | 15 | 0.550 | 447 |
| Kim S | 5 | 13 | 0.556 | 169 |
| Poignet P | 6 | 10 | 0.375 | 119 |
| Toloza EM | 5 | 7 | 0.625 | 71 |
Country-specific analysis
Figure 5 shows the spread of corresponding authors by country. As demonstrated, the USA had the highest number of articles (n = 1745), followed by China (n = 275) and Italy (n = 209). Table 4 then splits the data, including the SCP and MCP values.
Fig. 6.

Diagram showing distribution of the top 50 keywords, based on their total number of occurrences
Fig. 5.

Graph showing the corresponding authors by countries
The median (IQR) number of articles per nation was 14 (51.25). When the documents were stratified by SCP and MCP, the median (IQR), respectively, was as follows: 13(29.25) and 3(8). The median (IQR) ratio of the two was 0.2 (0.208). Indonesia and Vietnam had the greatest international collaboration with an MCP/SCP of 1, followed by Qatar with 0.67, and Kuwait and Venezuela with 0.5 (Fig. 6).
Keywords analysis
The most used word, as expected, was surgery with 823 occurrences. Outcomes (552) and experience (414) were the next two.
Twelve of the top 50 keywords were based on specific procedures: resection, hysterectomy, radical prostatectomy, lymphadenectomy, laparotomy, total mesorectal excision, laparoscopic surgery, lymph-node dissection, laparoscopy, prostatectomy, retropubic prostatectomy and laparoscopic partial nephrectomy. Other common themes were those relating to patient outcomes, such experience and quality-of-life.
Figure 7 shows how keyword frequency has changed from 2008 to 2021. Earlier publications focus on specific surgical techniques, such as conduit urinary diversion; however, overtime, keywords became more generalised with examples such as outcomes and accuracy in 2019–2020. Furthermore, as time moved towards the end of the decade, patient populations such as paediatrics came into consideration, along with different specialties, such as even Trauma and Orthopaedics, with the involvement of ‘spine’ as a keyword.
Fig. 7.

Graph showing the evolution of keywords from 2008 to 2021
Discussion
Research into robotic surgery is in its infancy but also changing and increasing. Over the past 20 years, over 3800 documents on the topic of robotic surgery have been compiled, gathering steam, especially from 2018 to 2020.
Despite this recent expansion, very few sources have fallen in the core of the literature, as shown by Bradford’s Law. Much of this research was in journals such as Urology, the Journal of Urology and the Journal of Minimally Invasive Gynecology, is related to urology or gynaecology, which has dominated the early stages of robotic research [12]. However, there has been a movement towards other specialties and subspecialties, such as general surgery and spinal surgery as shown by the keyword analysis.
Keyword analysis allows the reader to understand future frontiers of robotic surgery. The majority of research mentions surgical outcomes, complications and the importance of experience. If trends over time are considered, thoracic surgery and upper GI surgery are being increasingly mentioned in recent years, with keywords such as fundoplication and lobectomy cropping up during the final years of analysis.
When considering journal impact, the Journal of Robotic Surgery is the top-rated source through numerous metrics, such as relevance, Bradford Index, however, has only been active since 2007 and does not have an official impact factor, nor is it PubMed indexed.
Hirsch [13] hypothesised that after 20 years of research, a H index of 20 indicated a successful scientist, 40 indicated an outstanding scientist and 60 indicated extraordinary research output. As robotic research is still in its infancy, with few reaching even 20 years of research experience, thus the lack of any authors with a H index over 20 indicates the room for future research and growth in this field. The m index is a similar figure of the rate of productivity and shows a similar trend [14].
The most productive nations were the USA, China and Italy. This is expected, with the origins of robotic surgery beginning with Kwoh et al. [1] in California and market being dominated by the Da Vinci robotic system (Intuitive Surgical Inc, Sunnyvale, USA), originating in the United States, since 2000. Furthermore, The Business Research Company published a report in early 2020, indicating the North America was the largest region in the robotic surgical devices market in 2019, with Asia–Pacific growing at the greatest rate [15] (The Business Research Company, 2020). However, international collaboration levels remain low in these nations. Higher collaboration is present in nations with lower productivity. International collaboration has recently been realised with research such as the ROLARR trial [16], a product of collaboration between the United Kingdom, USA, Finland, Denmark, Italy and New Zealand.
What does the future hold?
As mentioned earlier, collaboration may prove to be key. Using the vast potential of centres worldwide could lead to increased numbers of large-scale RCTs, allowing surgeons to explore different populations. Furthermore, there is a niche for further systematic reviews of the literature. As time passes, authors will be able to increase their productivity, with increased funding, leading to greater metrics, such as H index’s moving towards 20 + etc. Other areas of research, such as bariatric surgery, resectional surgery and spinal surgery also provide new frontiers.
Footnotes
Publisher's Note
Springer Nature remains neutral with regard to jurisdictional claims in published maps and institutional affiliations.
References
- 1.Kwoh YS, Hou J, Jonckheere EA, Hayati S. A robot with improved absolute positioning accuracy for CT guided stereotactic brain surgery. IEEE Trans Biomed Eng. 1988;35(2):153–160. doi: 10.1109/10.1354. [DOI] [PubMed] [Google Scholar]
- 2.Ashrafian H, Clancy O, Grover V, Darzi A. The evolution of robotic surgery: surgical and anaesthetic aspects. BJA Br J Anaesth [Internet]. 2017;119(suppl_1):i72–84. Available from: 10.1093/bja/aex383 [DOI] [PubMed]
- 3.Nix J, Smith A, Kurpad R, Nielsen ME, Wallen EM, Pruthi RS. Prospective randomized controlled trial of robotic versus open radical cystectomy for bladder cancer: perioperative and pathologic results. Eur Urol [Internet]. 2010;57(2):196–201. Available from: https://www.sciencedirect.com/science/article/pii/S0302283809010288 [DOI] [PubMed]
- 4.Li K, Rollins J, Yan E. Web of Science use in published research and review papers 1997–2017: a selective, dynamic, cross-domain, content-based analysis. Scientometrics [Internet]. 2017/12/18. 2018;115(1):1–20. Available from: https://pubmed.ncbi.nlm.nih.gov/29527070 [DOI] [PMC free article] [PubMed]
- 5.Wang Q, Waltman L. Large-scale analysis of the accuracy of the journal classification systems of Web of Science and Scopus. J Informetr [Internet]. 2016;10(2):347–64. Available from: https://www.sciencedirect.com/science/article/pii/S1751157715301930
- 6.Mongeon P, Paul-Hus A. The journal coverage of Web of Science and Scopus: a comparative analysis. Scientometrics [Internet]. 2016;106(1):213–28. Available from: 10.1007/s11192-015-1765-5
- 7.Bradford SC. Sources of information on specific subjects. Engineering. 1934;137:85–86. [Google Scholar]
- 8.Venable GT, Shepherd BA, Roberts ML, Taylor DR, Khan NR, Klimo P. An application of Bradford’s law: identification of the core journals of pediatric neurosurgery and a regional comparison of citation density. Child’s Nerv Syst [Internet]. 2014;30(10):1717–27. Available from: 10.1007/s00381-014-2481-9 [DOI] [PubMed]
- 9.Moed HF. Citation analysis in research evaluation. Vol. 9. Springer Science & Business Media; 2006.
- 10.Sivertsen G, Rousseau R, Zhang L. Measuring scientific contributions with modified fractional counting. J Informetr [Internet]. 2019;13(2):679–94. Available from: https://www.sciencedirect.com/science/article/pii/S175115771830350X
- 11.Choudhri AF, Siddiqui A, Khan NR, Cohen HL. Understanding bibliometric parameters and analysis. RadioGraphics [Internet]. 2015;35(3):736–46. Available from: 10.1148/rg.2015140036 [DOI] [PubMed]
- 12.Hussain A, Malik A, Halim MU, Ali AM. The use of robotics in surgery: a review. Int J Clin Pract [Internet]. 2014 Nov 1;68(11):1376–82. Available from: 10.1111/ijcp.12492 [DOI] [PubMed]
- 13.Hirsch JE. An index to quantify an individual’s scientific research output. Proc Natl Acad Sci U S A [Internet]. 2005 Nov 15;102(46):16569 LP–16572. Available from: http://www.pnas.org/content/102/46/16569.abstract [DOI] [PMC free article] [PubMed]
- 14.Egghe L. Theory and practise of the g-index. Scientometrics [Internet]. 2006;69(1):131–52. Available from: 10.1007/s11192-006-0144-7
- 15.Company TBR. Robotic Surgery Devices Global Market Report 2020–30: COVID-19 Growth and Change. Global: The Business Research Company; 2020 p. 1–300.
- 16.Jayne D, Pigazzi A, Marshall H, Croft J, Corrigan N, Copeland J, et al. Effect of Robotic-Assisted vs Conventional Laparoscopic Surgery on Risk of Conversion to Open Laparotomy Among Patients Undergoing Resection for Rectal Cancer: The ROLARR Randomized Clinical Trial. JAMA [Internet]. 2017 Oct 24;318(16):1569–80. Available from: 10.1001/jama.2017.7219 [DOI] [PMC free article] [PubMed]