

Abstract
Background
The global burden of pancreatic cancer has steadily increased, while the prognosis after pancreatic cancer diagnosis remains poor. This study aims to compare the stage- and age-specific pancreatic cancer net survival (NS) for seven high-income countries: Australia, Canada, Denmark, Ireland, New Zealand, Norway, and United Kingdom.
Methods
The study included over 35,000 pancreatic cancer cases diagnosed during 2012–2014, followed through 31 December 2015. The stage- and age-specific NS were calculated using the Pohar-Perme estimator.
Results
Pancreatic cancer survival estimates were low across all 7 countries, with 1-year NS ranging from 21.1% in New Zealand to 30.9% in Australia, and 3-year NS from 6.6% in the UK to 10.9% in Australia. Most pancreatic cancers were diagnosed with distant stage, ranging from 53.9% in Ireland to 83.3% in New Zealand. While survival differences were evident between countries across all stage categories at one year after diagnosis, this survival advantage diminished, particularly in cases with distant stage.
Conclusion
This study demonstrated the importance of stage and age at diagnosis in pancreatic cancer survival. Although progress has been made in improving pancreatic cancer prognosis, the disease is highly fatal and will remain so without major breakthroughs in the early diagnosis and management.
Subject terms: Pancreatic cancer, Pancreatic cancer
Introduction
Pancreatic cancer was the sixth leading cause of cancer death in 2020 among high-income countries with an estimated 333,580 deaths [1]. Incidence and mortality rates are elevated in Europe, North America, and Australia/New Zealand [2]. An increasing burden is expected in the future, mainly due to ageing and growth of the population, as well as a shifting prevalence of various risk factors, such as smoking, obesity, diabetes, diet, inactivity, and chronic pancreatitis [2–4].
The disease is commonly diagnosed at a late stage and associated with a poor prognosis [4]. Recent data showed age-adjusted net survival (NS) for pancreatic cancer in most countries is consistently low, with estimates below 15% at five years after cancer diagnosis [5, 6]. Improvements in pancreatic cancer survival have been reported previously, however, prognosis after a pancreatic cancer diagnosis remains poor despite survival increases in the last two decades [5]. Recent changes in the management of pancreatic cancer through multimodality therapies including administration of neoadjuvant and adjuvant therapies [7–9], changes in health system management, and improved staging methods were identified as possibly contributing to the reported improvements in survival [10–12]. As a result, further assessment of international variations in pancreatic cancer survival has become more relevant, especially with the rising incidence rates of the disease.
There are only a few international studies examining pancreatic cancer survival by stage. For instance, a recent population-based survival study, which included the United States and four European countries (the Netherlands, Belgium, Norway, and Slovenia), illustrated limited improvement in pancreatic cancer survival [13]. Our study aimed to address this gap in the literature by describing the overall, stage-specific, and age-specific NS for pancreatic cancer in the seven high-income countries participating in the International Cancer Benchmarking Partnership Cancer Survival in High-Income Countries (ICBP SURVMARK-2) project. The ICBP is a collaboration of clinicians, policymakers, researchers, and cancer data experts, which was established to explain cancer survival differences between high-income countries with universal access to healthcare, comprehensive cancer registry coverage, and similar national health system expenditure.
Methods
Data sources
The methods used to clean and process the data in ICBP SURVMARK-2 have been described in detail previously [5]. Individual record-level data were obtained from 21 population-based cancer registries, also referred to as jurisdictions, from 7 high-income countries, namely, Australia (3 jurisdictional registries: New South Wales, Western Australia, and Victoria), Canada (10 jurisdictional registries: Alberta, British Columbia, Manitoba, New Brunswick, Newfoundland, Nova Scotia, Québec, Ontario, Prince Edward Island, and Saskatchewan), Denmark (1 national registry), Ireland (1 national registry), New Zealand (1 national registry), Norway (1 national registry), and the UK (4 jurisdictional registries: England, Northern Ireland, Scotland, and Wales). Initially, the study included all primary malignant pancreatic cancer (International Classification of Disease Tenth edition, ICD-10: C25) cases (n = 53,701) diagnosed in 2012–2014, except for Ireland where data up to 2013 were available when requested (Supplementary Information Fig. 1). Cases were followed up until 31 December 2015, except for 2 Canadian cancer registries (Ontario and Newfoundland), where follow-up was until 31 December 2014.
Exclusion criteria
Cancer registries with missing stage information for more than 50% of cases were excluded from the study (Victoria, Western Australia, British Columbia, New Brunswick, Québec, Ontario, and Scotland). The literature on the choice of cut-offs for the proportion with missing data remains ambiguous. Some studies have opposed the use of cut-offs for the proportion with missing data, instead of focusing on the availability of variables needed to predict the missing data [14]. In our study, we were cautious and assumed that the missingness was difficult to predict for jurisdictions with >50% of stage data missing due to the limited auxiliary variables, and the mechanism for the missing data in these jurisdictions could not be clearly identified due to the sparsity of data.
Additionally, neuroendocrine tumours (C25.4 and/or tumours with morphology codes: 8013, 8041, 8043, 8044, 8150, 8151, 8152, 8153, 8154, 8155, 8156, 8240, 8241, 8243, 8244, 8246, 8248, 8249, 8360, and 8574) were also excluded since the etiologies of these tumours are different and should be considered a separate disease from non-neuroendocrine pancreatic cancer [15]. The study was limited to cases whose age at diagnosis was 15–99 years. In addition, death certificate only (n = 1388) and autopsy only cases (n = 85), and cases with date discrepancies (such as death dates earlier than the recorded diagnosis date) were excluded in the study. The final sample included 36,852 out of the initial 53,701 pancreatic cancer cases.
Stage harmonisation
The stage data collected from registries were captured using different classification systems. The two main systems were Surveillance, Epidemiology, and End Results (SEER) Summary Stage 2000 (SS2000) and TNM staging used by the American Joint Committee on Cancer (AJCC) and the Union for International Cancer Control (UICC) to describe tumour, nodes, and metastasis categories. The SS2000 stages can be collapsed into three major stage groups (i.e. localised, regional, and distant), and TNM stage groups are Stage I, II, III, and IV. Several registries provided multiple-stage variables, although the proportion of variables with missing information varied substantially between jurisdictions, including those within the same country (e.g. Canada).
Supplementary Information Table 1 illustrates the proportion of missing stage information across various stage variables by jurisdiction prior to stage harmonisation. The SS2000 stage is the only stage information provided to the study by Australian and New Zealand cancer registries. Canadian registries had SS2000 stage data and TNM stage data derived from the Collaborative Staging System. The dataset provided by the Norwegian cancer registry included individual condensed TNM complemented with a separate SS2000 variable that was based on the extent of the disease or metastasis obtained from clinical and pathological records. The registries in Ireland (clinical, pathological, and condensed TNM) and Denmark both provided TNM stage data. Cancer registries in the UK also provided TNM stage from varying sources; Northern Ireland cancer registry included clinical, pathological, grouped, and condensed TNM; and the majority of cases in England and Wales had registry-derived TNM data based on multiple sources in addition to TNM stage. For cancer registries with both pathological and clinical TNM data, pathological T and N data were prioritised over clinical data, whereas clinical M was prioritised over pathological M.
The code “NX” was assumed to be N0, and “MX” was assumed to be M0. In addition, most of the cancer registries with TNM stage data used the seventh edition, the registry in Ireland used TNM fifth edition, and for over 95% of the cases in the UK the TNM edition used was unknown. As a result, this needs to be considered when comparing NS estimates by TNM stage between countries, although this does not impact the TNM to SS2000 stage conversion algorithm described below.
To enable comparisons of survival across stage groups for all seven countries, the TNM stage information was converted to SS2000. Details on the conversion algorithm used are described in Cabasag and colleagues [16]. When SS2000 stage was not available individual T, N, and M data were used. A systematic approach was applied when mapping TNM to SEER stage working backwards by considering M, followed by N, then T. A summary of the conversion algorithm is illustrated in Supplementary Information Table 2. Briefly, all tumours with M1 were converted to distant, tumours with N1, T3, or T4 were converted to regional, and T1 or T2 tumours were converted to localised stage. If only the grouped TNM stage data (Stage I–IV) were available, stage IV was mapped to distant, stage III and II were mapped to regional, and stage I was mapped to localised stage.
When data from two different stage systems were available, such as in Canada, SS2000 data were prioritised, then the TNM-derived SS2000 were utilised for the remaining cases with missing stage, when possible (Supplementary Information Fig. 2). In England and Wales, the registry-derived TNM stage information was prioritised. For simplicity SS2000 and TNM-derived SS2000 will be subsequently referred to as SEER stage. All stage-specific survival estimates are presented by SEER stage in the main results, and survival estimates by TNM stage are presented in Supplementary Information Tables 3 and 4.
Statistical analysis
NS was calculated using the Pohar-Perme estimator. NS estimates the probability of surviving from pancreatic cancer in the absence of competing causes of death. The background mortality of the general population was estimated using life tables from each individual cancer registry. The life tables contained all-cause death rates by sex, age, and calendar year from 2012 to 2015. In addition, the study used the period analysis approach for 2012–2014 apart from Ireland, which included data for 2012–2013 only. The period analysis approach requires that all living cases at any point in the 3-year study period contribute to the survival analysis, including cases diagnosed before the start of the period. The International Cancer Survival Standard weights with three age categories (15–54, 55–74, and 75–99 years) were used for age standardisation. The 1- and 3-year NS are presented for all ages combined and by age group. NS estimates for cancer registries with <100 cases are not presented in registry-specific analyses and stage categories with fewer than 30 cases are not presented in the stage-specific analyses.
Multinomial logistic regression was used to impute the stage where it was missing. The model included age fitted with splines, sex, vital status, and the Nelson–Aalen estimator of cumulative hazard. NS and the 95% confidence interval were estimated from 30 different imputations and combined using Rubin’s rule. Pohar-Perme estimator used stnet command in Stata. All analyses in the study were performed using Stata/IC version 14.2.
Results
Characteristics of pancreatic cancer cases
There were minor differences in age at pancreatic cancer diagnosis between countries with the median age ranging between 71 and 74 years for all stages combined, although there were larger differences when stratified by stage (Table 1). There was approximately the same number of men and women diagnosed with pancreatic cancers across all countries in the study. After combining and harmonising all available stage information, the proportion with missing stage ranged between 4.0% in Canada and 41.0% in the UK. Most cases were diagnosed with distant stage ranging from 53.9% in Ireland to 83.3% in New Zealand after stage imputation with a median proportion of 64.0% across the 7 countries with small differences in stage distributions across age groups (Supplementary Information Fig. 3).
Table 1.
Descriptive summary of cases diagnosed with pancreatic cancer by stage and country, 2012–2014.
| Country | M:F ratio | SEER stage | Median age (P25–P75) | Number of cases (%) | After imputation (%) |
|---|---|---|---|---|---|
| Australiaa | 1.1 | All | 72 (64–80) | 2713 | |
| Localised | 75 (67–82) | 386 (18.9) | 21.2 | ||
| Regional | 72 (64–80) | 273 (13.4) | 14.8 | ||
| Distant | 71 (63–80) | 1382 (67.7) | 64.0 | ||
| Missing | 73 (64–81) | 672 (24.8) | — | ||
| Canadaa | 1.0 | All | 71 (62–81) | 2772 | |
| Localised | 81 (71–86) | 248 (9.3) | 9.5 | ||
| Regional | 70 (62–79) | 768 (28.9) | 28.8 | ||
| Distant | 70 (61–79) | 1644 (61.8) | 61.7 | ||
| Missing | 82 (73–86) | 112 (4.0) | — | ||
| Denmark | 1.0 | All | 71 (64–78) | 2741 | |
| Localised | 70 (62–79) | 141 (6.5) | 6.6 | ||
| Regional | 70 (64–76) | 728 (33.7) | 32.8 | ||
| Distant | 70 (63–77) | 1294 (59.8) | 60.5 | ||
| Missing | 74 (67–81) | 578 (21.1) | — | ||
| Irelandb | 1.0 | All | 73 (64–81) | 919 | |
| Localised | 77 (67–86) | 67 (8.2) | 8.6 | ||
| Regional | 72 (64–78) | 303 (37.3) | 37.5 | ||
| Distant | 72 (64–80) | 443 (54.5) | 53.9 | ||
| Missing | 78 (70–86) | 106 (11.5) | — | ||
| New Zealand | 1.0 | All | 73 (64–81) | 1528 | |
| Localised | 63 (47–69) | 18 (1.8) | 2.2 | ||
| Regional | 68 (61–75) | 121 (12.3) | 14.5 | ||
| Distant | 72 (63–81) | 843 (85.8) | 83.3 | ||
| Missing | 76 (66–85) | 546 (35.7) | — | ||
| Norway | 0.9 | All | 72 (64–81) | 2070 | |
| Localised | 75 (65–82) | 227 (14.0) | 13.9 | ||
| Regional | 72 (65–79) | 312 (19.2) | 18.7 | ||
| Distant | 71 (63–78) | 1088 (66.9) | 67.4 | ||
| Missing | 77 (67–84) | 443 (21.4) | — | ||
| United Kingdoma | 1.0 | All | 74 (65–81) | 24109 | |
| Localised | 76 (67–84) | 776 (5.5) | 5.7 | ||
| Regional | 70 (63–78) | 3972 (27.9) | 26.7 | ||
| Distant | 72 (64–80) | 9472 (66.6) | 67.6 | ||
| Missing | 77 (68–84) | 9889 (41.0) | — |
M:F male:female, P25–P75 25th and 75th percentile, SEER Surveillance, Epidemiology, and End Results, TNM tumour, nodes, metastases.
aAustralia includes New South Wales; Canada includes Alberta, Manitoba, Newfoundland and Labrador, Nova Scotia, Prince Edward Island, and Saskatchewan; United Kingdom includes England, Northern Ireland, and Wales.
bIreland, cases diagnosed in 2012–2013.
NS among patients with pancreatic cancers for all cases combined
In general, the 1-year age-standardised NS for all ages combined ranged from 21.1% in New Zealand to 30.9% in Australia (Table 2 and Fig. 1). Differences in NS estimates for Australia, Canada, and the UK before and after excluding jurisdictions with >50% missing stage were very minimal (Supplementary Information Fig. 4). The absolute survival differences between countries became markedly smaller three years after diagnosis ranging between 6.6% in the UK and 10.9% in Australia. Also, pancreatic cancer survival decreased with an increase in age across all seven countries in the study. Among cases ages 15–54 years, NS ranged from 31.1% in New Zealand to 46.2% in Australia, while a substantial decline in 1-year NS was observed in cases ages 75–99 years ranging between 11.0% in New Zealand and 17.7% in Australia.
Table 2.
Age-standardised 1- and 3-year net survival for cases diagnosed with pancreatic cancer by stage, age, and country, 2012–2014.
| Australiab | Canadab | Denmark | Irelandc | New Zealand | Norway | United Kingdomb | ||
|---|---|---|---|---|---|---|---|---|
| 1-year net survivala (95% CI) | ||||||||
| All cases combined | ||||||||
| All ages | 30.9 (29.2–32.7) | 23.1 (21.5–24.7) | 28.8 (27.1–30.6) | 26.5 (24.1–28.9) | 21.1 (19.1–23.2) | 25.0 (23.0–27.1) | 22.5 (21.9–23.0) | |
| 15–54 | 46.2 (40.3–52.0) | 31.5 (26.6–36.5) | 41.6 (35.2–47.9) | 39.9 (31.8–47.9) | 31.1 (24.5–38.0) | 38.0 (30.6–45.3) | 34.0 (31.9–36.1) | |
| 55–74 | 32.8 (30.4–35.1) | 25.7 (23.5–28.0) | 31.3 (29.2–33.5) | 27.7 (24.6–31.0) | 23.2 (20.3–26.3) | 27.6 (25.1–30.2) | 24.0 (23.2–24.7) | |
| 75–99 | 17.7 (15.6–19.9) | 12.8 (11.0–14.7) | 16.2 (14.0–18.5) | 15.0 (12.4–17.9) | 11.0 (8.9–13.4) | 11.9 (9.9–14.0) | 12.2 (11.7–12.8) | |
| SEER stage | ||||||||
| Localised | All ages | 54.9 (50.2–59.7) | 43.0 (35.7–50.3) | 58.9 (51.3–66.6) | 58.0 (47.7–68.3) | — | 57.0 (50.8–63.1) | 52.7 (48.2–57.1) |
| 15–54 | 80.8 (68.7–93.0) | 58.3 (32.9–83.8) | 85.4 (66.1–104.7) | 83.9 (54.2–113.7) | — | 82.6 (67.4–97.9) | 74.0 (60.8–87.1) | |
| 55–74 | 56.6 (49.6–63.5) | 51.0 (39.5–62.4) | 61.8 (51.2–72.3) | 66.0 (50.0–81.9) | — | 62.2 (53.4–71.0) | 57.9 (52.5–63.3) | |
| 75–99 | 35.5 (29.0–42.0) | 19.6 (13.9–25.2) | 37.4 (24.7–50.1) | 28.6 (18.1–39.1) | — | 30.1 (22.5–37.7) | 29.6 (25.7–33.4) | |
| Regional | All ages | 52.0 (46.4–57.7) | 43.5 (40.1–46.9) | 51.9 (48.5–55.2) | 42.6 (38.3–46.8) | 55.8 (48.5–63.2) | 49.6 (43.7–55.5) | 49.1 (47.7–50.5) |
| 15–54 | 59.0 (40.7–77.3) | 56.7 (46.6–66.8) | 71.1 (60.6–81.5) | 63.2 (51.1–75.3) | 63.3 (44.6–81.9) | 58.1 (39.3–76.9) | 67.3 (63.0–71.6) | |
| 55–74 | 60.2 (52.9–67.6) | 49.4 (44.8–54.1) | 56.4 (52.3–60.5) | 44.4 (38.9–50.0) | 62.8 (53.7–71.9) | 57.7 (51.1–64.3) | 52.7 (51.0–54.4) | |
| 75–99 | 32.6 (24.1–41.0) | 24.3 (19.7–29.0) | 31.6 (26.0–37.2) | 24.4 (18.0–30.8) | 39.6 (25.5–53.8) | 29.0 (21.8–36.2) | 30.9 (28.9–32.8) | |
| Distant | All ages | 18.7 (16.7–20.8) | 12.1 (10.6–13.6) | 13.1 (11.3–14.9) | 11.2 (8.6–13.7) | 12.1 (10.0–14.1) | 12.1 (10.1–14.0) | 9.0 (8.4–9.5) |
| 15–54 | 33.8 (26.8–40.8) | 19.3 (14.2–24.5) | 20.5 (13.8–27.3) | 18.2 (9.2–27.1) | 19.7 (12.7–26.7) | 23.4 (15.4–31.4) | 15.7 (13.6–7.9) | |
| 55–74 | 19.8 (16.9–22.7) | 13.2 (11.1–15.3) | 14.7 (12.6–16.8) | 11.4 (8.2–14.6) | 12.5 (9.5–15.5) | 13.3 (11.0–15.7) | 9.4 (8.8–10.1) | |
| 75–99 | 7.1 (5.1–9.1) | 5.2 (3.5–6.9) | 5.5 (3.2–7.8) | 5.9 (3.3–8.5) | 6.5 (4.1–8.9) | 2.5 (1.2–3.8) | 3.8 (3.3–4.3) | |
| 3-year net survivala (95% CI) | ||||||||
| All cases combined | ||||||||
| All ages | 10.9 (9.7–12.2) | 7.5 (6.5–8.5) | 9.9 (8.8–11.1) | 8.8 (7.4–10.4) | 6.7 (5.4–8.0) | 7.3 (6.1–8.7) | 6.6 (6.2–6.9) | |
| 15–54 | 18.5 (14.2–23.3) | 11.8 (8.7–15.5) | 18.1 (13.6–23.2) | 14.1 (9.4–19.8) | 11.3 (7.2–16.4) | 12.8 (8.4–18.1) | 11.7 (10.4–13.2) | |
| 55–74 | 11.2 (9.6–12.9) | 8.0 (6.7–9.4) | 10.0 (8.7–11.4) | 9.0 (7.2–11.0) | 7.7 (6.0–9.7) | 7.5 (6.1–9.2) | 6.5 (6.1–6.9) | |
| 75–99 | 5.5 (4.3–6.9) | 3.7 (2.7–4.9) | 4.3 (3.1–5.9) | 4.6 (3.2–6.4) | 1.9 (1.0–3.1) | 3.3 (2.3–4.6) | 3.4 (3.1–3.8) | |
| SEER stage | ||||||||
| Localised | All ages | 27.3 (22.5–32.1) | 23.5 (16.6–30.3) | 40.0 (32.7–47.3) | 36.5 (26.3–46.6) | — | 25.8 (19.7–31.8) | 27.1 (22.6–31.6) |
| 15–54 | 53.5 (38.7–68.3) | 37.7 (14.5–61.0) | 72.7 (51.3–94.1) | 77.4 (41.4–113.3) | — | 40.5 (20.8–60.2) | 49.4 (35.7–63.0) | |
| 55–74 | 25.7 (18.9–32.5) | 28.3 (17.7–38.9) | 38.6 (28.7–48.5) | 35.1 (20.7–49.4) | — | 30.1 (21.8–38.5) | 27.5 (21.7–33.3) | |
| 75–99 | 13.5 (8.9–18.1) | 6.6 (3.0–10.2) | 19.9 (8.5–31.4) | 13.3 (5.2–21.3) | — | 8.0 (3.6–12.4) | 12.2 (8.8–15.6) | |
| Regional | All ages | 21.1 (15.9–26.4) | 14.9 (12.3–17.5) | 18.2 (15.4–21.0) | 13.6 (10.7–16.4) | 17.7 (11.7–23.6) | 15.4 (10.8–20.0) | 16.2 (15.1–17.3) |
| 15–54 | 25.4 (8.0–42.9) | 23.0 (14.5–31.5) | 30.5 (19.8–41.2) | 20.7 (11.7–29.8) | 18.8 (4.2–33.4) | 21.0 (6.8–35.2) | 26.5 (22.5–30.6) | |
| 55–74 | 26.0 (19.2–32.7) | 15.8 (12.4–19.2) | 19.4 (16.1–22.6) | 14.6 (10.9–18.4) | 23.2 (14.6–31.7) | 17.6 (12.5–22.8) | 16.2 (15.0–17.4) | |
| 75–99 | 9.9 (4.9–15.0) | 7.9 (4.8–11.0) | 8.1 (4.2–12.1) | 6.5 (3.0–10.0) | 7.6 (0.7–14.5) | 8.2 (3.6–12.9) | 9.3 (8.1–10.6) | |
| Distant | All ages | 4.0 (2.9–5.2) | 2.8 (2.0–3.6) | 1.8 (1.0–2.5) | 2.0 (0.9–3.2) | 2.6 (1.6–3.7) | 1.6 (0.7–2.4) | 1.0 (0.8–1.2) |
| 15–54 | 8.2 (4.1–12.3) | 5.1 (2.2–8.1) | 3.7 (0.4–7.0) | 3.1 (0.0–7.1) | 5.1 (1.5–8.8) | 4.8 (0.5–9.0) | 2.1 (1.1–3.1) | |
| 55–74 | 4.0 (2.5–5.5) | 3.0 (1.9–4.0) | 1.9 (1.0–2.7) | 2.1 (0.6–3.6) | 2.8 (1.2–4.3) | 0.8 (0.0–1.5) | 0.9 (0.7–1.2) | |
| 75–99 | 1.5 (0.6–2.4) | 0.9 (0.1–1.6) | 0.3 (0.0–0.9) | 1.0 (0.0–2.1) | 0.8 (0.0–1.6) | 0.6 (0.0–1.3) | 0.4 (0.2–0.5) | |
NS net survival, CI confidence interval, SEER Surveillance, Epidemiology, and End Results.
aNS estimates were only presented for stage categories with at least 30 cases.
bOnly includes the following cancer registries: Australia–New South Wales; Canada–Alberta, Manitoba, Newfoundland and Labrador, Nova Scotia, Prince Edward Island, and Saskatchewan; United Kingdom–England, Northern Ireland, and Wales.
cIreland, cases diagnosed in 2012–2013.
Fig. 1. Age-standardised 1- and 3-year net survival (all ages combined) with 95% confidence interval among cases diagnosed with pancreatic cancer by country, 2012–2014.
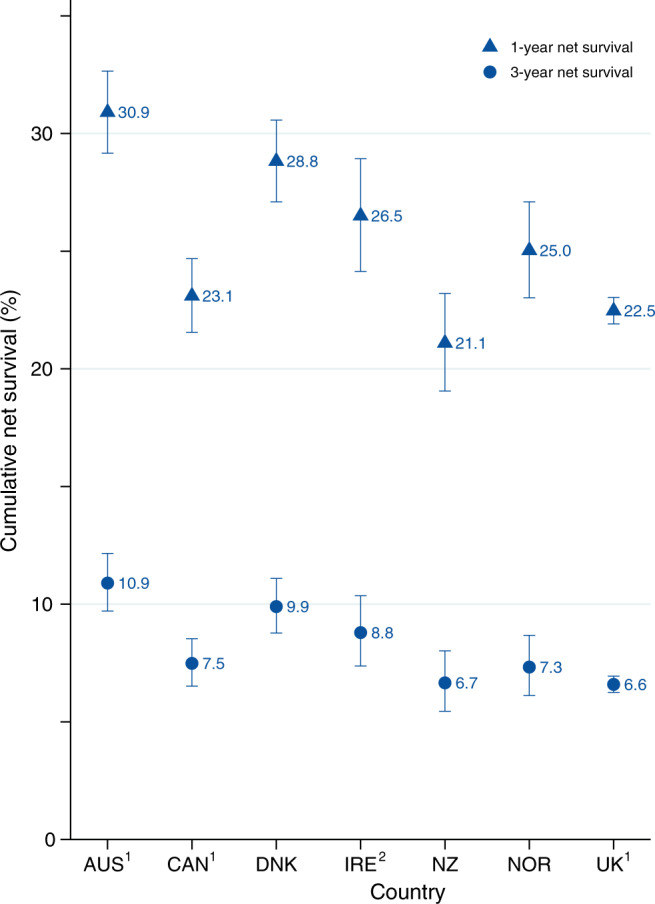
AUS Australia, CAN Canada, DNK Denmark, IRE Ireland, NZ New Zealand, NOR Norway, UK United Kingdom. 1Includes the following cancer registries: AUS–New South Wales; CAN–Alberta, Manitoba, Newfoundland and Labrador, Nova Scotia, Prince Edward Island, and Saskatchewan; UK–England, Northern Ireland, and Wales. 2Ireland, cases diagnosed in 2012–2013.
NS among patients with pancreatic cancers according to stage
Figure 2 shows the age-standardised NS categorised by stage at diagnosis. As expected, survival was higher for localised and regional stage than distant stage across all 7 countries with 1-year NS varying between 43.0% in Canada and 58.9% in Denmark for localised and 9.0% in the UK and 18.7% in Australia for the distant stage. At 3 years after diagnosis, international variation in NS was less evident for all stage categories, for example ranging from 1.0% in the UK to 4.0% in Australia for the distant stage. There was no marked difference in stage-specific survival estimates with and without stage imputation for each country (Supplementary Information Fig. 5).
Fig. 2. Age-standardised 1- and 3-year net survival (all ages combined) with 95% confidence interval among cases diagnosed with pancreatic cancer by SEER stage and country, 2012–2014.

SEER refers to both SEER stage and TNM-derived SEER stage. 1Only includes the following cancer registries: AUS–New South Wales; CAN–Alberta, Manitoba, Newfoundland and Labrador, Nova Scotia, Prince Edward Island, and Saskatchewan; UK–England, Northern Ireland, and Wales. 2Ireland cases diagnosed in 2012–2013.
NS among patients with pancreatic cancers according to stage and age
Figure 3 illustrates stage-specific NS by age. Age at diagnosis modified NS by stage especially for 1-year NS, where survival decreased as age increased across all stage categories. For example, 1-year NS for distant stage ranged between 15.7% in the UK and 33.8% in Australia for patients aged 15–54 years, 9.4% in the UK and 19.8% in Australia for patients aged 55–74 years, and 2.5% in Norway and 7.1% in Australia for patients aged 75–99 years (Table 2). On the other hand, the role of age diminished for longer-term survival, with for example 3-year NS for the distant stage being similar across age groups. In addition, we only observed minor cross-country differences in 3-year age-specific NS for patients with distant stage.
Fig. 3. Age-specific 1-year and 3-year net survival among pancreatic cancer cases by stage and country, 2012–2014.

a 1-year net survival with 95% confidence interval. b 3-year net survival with 95% confidence interval. 1Only includes the following cancer registries: AUS–New South Wales; CAN–Alberta, Manitoba, Newfoundland and Labrador, Nova Scotia, Prince Edward Island, and Saskatchewan; UK–England, Northern Ireland, and Wales. 2Ireland cases diagnosed in 2012–2013.
NS among patients with pancreatic cancers by jurisdictions
The 1-year NS (all ages) for Canadian cancer registries ranged between 17.2% in Nova Scotia and 25.5% in Manitoba (Supplementary Information Table 5). One-year NS for distant stage ranged between 7.5% in Nova Scotia and 13.5% in both Alberta and Saskatchewan. In the UK, Wales (22.7%) and England (22.6%) had the highest 1-year NS (Supplementary Information Table 6). The 1-year NS for the distant stage in the UK ranged between 7.7% in Northern Ireland and 9.0% in England.
Discussion
Pancreatic cancer ranks the tenth most common cancer (excluding non-melanoma skin cancer) among high-income countries [1] and is mostly diagnosed at an older age (median age ranging between 71 and 74 years). Our findings illustrate very low 1- and 3-year survival for pancreatic cancer with almost no difference in 3-year NS between countries. About two-thirds (64%) of pancreatic cancer cases presented with the advanced (metastatic) disease with survival ranging from 9 and 19% at 1 year and <5% at 3 years after diagnosis. The largest differences in survival by country were observed at 1 year after diagnosis; however, there were no marked differences in the 3-year NS between countries, particularly among older age and distant stage.
There are several challenges to diagnosing pancreatic cancer early contributing to a large proportion of cases presenting with advanced disease. The non-specific symptoms associated with pancreatic cancer, lack of clinically practical diagnostic examination, and difficulty of most imaging modalities to accurately detect lesions <3 cm are just a few of the factors contributing to the complexity of early diagnosis [4]. Population-based screening is not recommended since the expected benefit do not outweigh the potential harms [4, 17]. Early detection screening is available for high-risk individuals such as individuals with a history of familial pancreatic cancer [18]. Reports from multiple prospective studies on pancreatic cancer screening showed variable detection rates likely due to differences in the screening tools used and definitions of outcome [19].
Survival differences across age groups remained evident for all stage categories. For those with distant stage, we report that the youngest age group (15–54 years at diagnosis) had 1-year survival estimates ranging between 15.7 and 34.0%, whereas the survival estimates for those aged 75–99 years ranged between 2.5 and 7.1%. Our findings are consistent with other studies documenting that younger patients with advanced pancreatic cancer have higher survival than elderly patients [20], possibly due to fewer comorbidities in the younger age group [21] and disparities in pancreatic cancer treatment by age [22]. However, the influence of these factors in 3-year survival is limited particularly among patients with advanced disease. Our findings showed survival advantage was no longer observed three years after diagnosis with similar survival experienced by all age groups for individuals diagnosed with a distant stage across countries.
Pancreatic cancer survival has improved in the past two decades, which may be linked to progress in clinical management and the introduction of new treatments for pancreatic cancer. For instance, in the last decade, FOLFIRINOX therapy (a combination of oxaliplatin, irinotecan, fluorouracil, and leucovorin) has increasingly been recommended as first-line chemotherapy for metastatic pancreatic cancer [23, 24], although it continues to be arguable whether the preferred first-line regimen is FOLFIRINOX or gemcitabine/nab-paclitaxel [7, 23, 25]. In general, FOLFIRINOX is reserved for patients younger than 76 years with good performance status [23]. This may potentially contribute to the differences in 1-year survival by age found in our study and previous studies. Additionally, preoperative chemoradiotherapy has been shown to significantly increase survival for a subgroup of patients, in particular patients with borderline resectable pancreatic cancer [26].
Factors such as centralisation of pancreatic surgery, particularly in high-volume centres [1, 10], and increased access to treatment [27] may also contribute to the survival improvements observed in this study. Of interest was our findings of a high 3-year survival following diagnosis of localised disease in Denmark compared to other countries. Pancreatic cancer surgery in Denmark has been significantly centralised in the past two decades, with 12 surgical units in 2001 reduced to just 4 units by 2018 [28]. Australia has also been consolidating pancreatic surgery and improving referral networks extensively after the publication of the recommendations for optimal care pathway for pancreatic cancer in Australia, which was endorsed by Australian cancer societies and health organisations [29]. This may partly contribute to the slightly higher NS in Australia compared to other countries in the study.
Furthermore, differences in the clinical management of pancreatic cancer between countries may contribute to the observed variation in survival across countries [30]. The larger survival differences between countries for localised and regional diseases compared to distant diseases may be indicative of the limited options for pancreatic cancer therapeutic interventions for advanced disease. Studies that assess differences in treatments and estimate the potential impact of optimising treatments are needed to increase survival across countries.
Further assessment of the 1-year NS conditional on surviving 3 months after diagnosis showed increased survival (Supplementary information Table 7). Additionally, the survival gap previously observed between countries markedly narrowed after conditioning to 3 months. There are several factors driving the differences in survival between countries as previously mentioned, which plays a critical role in the survival gap between countries within these early months after diagnosis.
Differences in case ascertainment approaches used by cancer registries and differences in the quality of the stage at diagnosis information may further contribute to observed variations in survival by stage between countries. Registrations errors and differences in completeness of cancer registration and missed cases, such as the proportion of death certificate only (DCO) cases, may also impact survival estimates and variation between countries since these cases may be different from non-DCO cases. In our study, the overall proportion of DCO was 3.6% with percent ranging between <1 and 6% by country. Although registration errors as well as tracebacks may result in delayed diagnosis and will likely impact survival estimates, their effect is going to be minimal in countries with long-established cancer registration systems (e.g. SurvMark-2 countries) [31, 32]. Thus, survival differences observed between SurvMark-2 registries and countries are unlikely related to differences in registration practices.
We have mitigated the influence of registration practices to improve comparisons across countries by including long-established cancer registries with high-quality cancer data. Cancer registries included in SURVMARK-2 strictly adhere to the International Association of Cancer Registries standards. Data from these registries were evaluated on three dimensions of quality for inclusion: (1) comparability of the cancer datasets and the standards and definitions used for case registrations; (2) the degree of completeness based on multiple indicators such as historical data, the proportion of MV cases, mortality-to-incidence ratio, and death certificate methods; and (3) accuracy of the recorded data examining the consistency of recorded data and proportion on microscopically verified (MV) tumours and DCO [33]. Extensive data cleaning and processing were conducted on all cancer registry data prior to analysis to ensure the highest possible data quality.
We have also excluded neuroendocrine pancreatic cancer (5% of the total study population) since it has different aetiology arising from the endocrine cells of the pancreas, whereas the majority of pancreatic cancer arises from exocrine cells [34]. Neuroendocrine pancreatic cancers generally have higher survival than non-neuroendocrine pancreatic cancers [34, 35], and for which differences in behaviour definition between countries may impact survival estimates and comparability. Other rare types such as blastomas and sarcomas were not excluded in the study; however, these tumour types encompassed only <0.01% of the study population and will likely not impact the survival estimates and overall conclusion reported in our study. Furthermore, the proportion of histologically confirmed or MV tumours by country ranged between 45.3% in New Zealand and 80.1% in Denmark (Supplementary Information Fig. 6). The proportion of non-MV tumours may indicate the percentage of tumours possibly diagnosed through imaging and were assumed to be adenocarcinomas.
Several factors should be considered when interpreting survival estimates by stage across countries presented in this study. In ICBP SURVMARK-2, the completeness of stage at diagnosis for pancreatic cancers varied between jurisdictions. After combining all available stage data, 7 cancer registries (out of 21) with >50% of cases with missing stage were excluded based on this criterion. As a result, the survival estimates reported in the study for Australia, Canada, and the UK may not represent the nationwide survival estimates and may only be applicable to jurisdictions included in the analysis. Thus, the findings should be interpreted with caution.
For consistency and comparability, stage data were harmonised by converting TNM stage information to the SEER classification. Here misclassification may have potentially occurred, however, we have previously reported that this is likely to be minimal [16]. Additionally, imputation of the stage was performed for all cases with missing stage. We also had to assume “MX” to be M0, and “NX” was assumed to be N0. While this approach of dealing with “MX” has been taken in TNM 8th ed., assuming “NX” to signify N0 may cause an underestimation of survival for patients within this category. Coding practices and scrutiny in completing stage information may differ between countries. In our study the proportion of TX varied across countries where TNM staging was available (i.e. Canada, Denmark, Ireland, and the UK), ranging between 4% in Canada and 41% in the UK (these are cases with missing/unknown stage).
Sensitivity analysis was performed by omitting the variable for survival time in the model to evaluate a scenario where missing cases may not be missing at random. There was no notable difference observed in the resulting stage distributions and in NS estimates. Stratifying the data by stage and age often resulted in small sample sizes for some countries and survival estimates with wide confidence intervals, which should be interpreted with caution.
In conclusion, this study has highlighted the importance of stage in pancreatic cancer survival that is further modified by age. Our study demonstrated survival differences across age groups were evident for all stage categories at 1 year after pancreatic cancer diagnosis; however, this survival advantage diminished at 3 years, particularly in the distant stage. Our findings also revealed minor differences in survival between countries, particularly among distant-stage cases and regardless of age. Although pancreatic cancer survival has slightly increased in the past decade, it remains fatal and this study reinforces the need for breakthroughs in early diagnosis and treatment to improve prognosis.
Disclaimer
Where authors are identified as personnel of the International Agency for Research on Cancer/World Health Organisation, the authors alone are responsible for the views expressed in this article and they do not necessarily represent the decisions, policy or views of the International Agency for Research on Cancer/World Health Organisation.
Supplementary information
Acknowledgements
The authors would like to thank the ICBP management team of Cancer Research UK for managing the programme, the ICBP SURVMARK-2 Local Leads for advice to understand the data, for their contributions to the study protocol, and interpretation of the results, as well as, the ICBP Clinical Committees for their advice. We are grateful to the ICBP SurvMark-2 Academic Reference Group for providing independent peer review and advice for the study protocol and analysis plan development. Finally, we thank the ICBP Program Board for their oversight and direction. A complete list of all investigators can be found in Supplementary Information Table 8. ICBP is funded by the Canadian Partnership Against Cancer; Cancer Council Victoria; Cancer Institute New South Wales; Cancer Research UK; Danish Cancer Society; National Cancer Registry Ireland; The Cancer Society of New Zealand; NHS England; Norwegian Cancer Society; Public Health Agency Northern Ireland on behalf of the Northern Ireland Cancer Registry; DG Health and Social Care, Scottish Government; Western Australia Department of Health; Public Health Wales NHS Trust.
Author contributions
Conceptualisation: CJC, IS, FB, and MA; data curation: MA, AB, and JF; formal analysis and visualisation: CJC and MR; funding acquisition: IS, FB, and MA; roles/writing—original draft: CJC; writing—review and editing: all authors.
Data availability
This study is based on cancer registry data provided by registries participating in ICBP SURVMARK-2 project. Data are owned by cancer registries and authors are not permitted to share these data externally except in aggregate form, e.g. publication. Any data request should be directed to each corresponding cancer registry.
Competing interests
The authors declare no competing interests.
Ethics approval and consent to participate
The study was approved by the IARC Ethics Committee, and where needed approval was also given by local (or national) ethical committees. This study was conducted according to the guidelines of the Declaration of Helsinki and used secondary cancer data from the cancer registries, thus not requiring individual re-consenting for the purpose.
Footnotes
Publisher’s note Springer Nature remains neutral with regard to jurisdictional claims in published maps and institutional affiliations.
Supplementary information
The online version contains supplementary material available at 10.1038/s41416-022-01752-3.
References
- 1.International Agency for Research on Cancer. Global Cancer Observatory. http://gco.iarc.fr/ (2020).
- 2.Arnold M, Abnet CC, Neale RE, Vignat J, Giovannucci EL, McGlynn KA, et al. Global burden of 5 major types of gastrointestinal cancer. Gastroenterology. 2020;159:335.e5–49.e5. doi: 10.1053/j.gastro.2020.02.068. [DOI] [PMC free article] [PubMed] [Google Scholar]
- 3.Global Burden of Disease Study (GBD) Pancreatic Cancer Collaborators. The global, regional, and national burden of pancreatic cancer and its attributable risk factors in 195 countries and territories, 1990–2017: a systematic analysis for the Global Burden of Disease Study 2017. Lancet Gastroenterol Hepatol. 2019;4:934–47. doi: 10.1016/S2468-1253(19)30347-4. [DOI] [PMC free article] [PubMed] [Google Scholar]
- 4.McGuigan A, Kelly P, Turkington RC, Jones C, Coleman HG, McCain RS, et al. Pancreatic cancer: A review of clinical diagnosis, epidemiology, treatment and outcomes. World J Gastroenterol. 2018;24:4846–61. doi: 10.3748/wjg.v24.i43.4846. [DOI] [PMC free article] [PubMed] [Google Scholar]
- 5.Arnold M, Rutherford MJ, Bardot A, Ferlay J, Andersson TM, Myklebust TA, et al. Progress in cancer survival, mortality, and incidence in seven high-income countries 1995–2014 (ICBP SURVMARK-2): a population-based study. Lancet Oncol. 2019;20:1493–505. doi: 10.1016/S1470-2045(19)30456-5. [DOI] [PMC free article] [PubMed] [Google Scholar]
- 6.Allemani C, Matsuda T, Di Carlo V, Harewood R, Matz M, Niksic M, et al. Global surveillance of trends in cancer survival 2000–14 (CONCORD-3): analysis of individual records for 37 513 025 patients diagnosed with one of 18 cancers from 322 population-based registries in 71 countries. Lancet. 2018;391:1023–75. doi: 10.1016/S0140-6736(17)33326-3. [DOI] [PMC free article] [PubMed] [Google Scholar]
- 7.Conroy T, Hammel P, Hebbar M, Ben Abdelghani M, Wei AC, Raoul JL, et al. FOLFIRINOX or gemcitabine as adjuvant therapy for pancreatic cancer. N. Engl J Med. 2018;379:2395–406. doi: 10.1056/NEJMoa1809775. [DOI] [PubMed] [Google Scholar]
- 8.Jang JY, Han Y, Lee H, Kim SW, Kwon W, Lee KH, et al. Oncological benefits of neoadjuvant chemoradiation with gemcitabine versus upfront surgery in patients with borderline resectable pancreatic cancer: a prospective, randomized, open-label, multicenter phase 2/3 trial. Ann Surg. 2018;268:215–22. doi: 10.1097/SLA.0000000000002705. [DOI] [PubMed] [Google Scholar]
- 9.Latenstein AEJ, van der Geest LGM, Bonsing BA, Groot Koerkamp B, Haj Mohammad N, de Hingh I, et al. Nationwide trends in incidence, treatment and survival of pancreatic ductal adenocarcinoma. Eur J Cancer. 2020;125:83–93. doi: 10.1016/j.ejca.2019.11.002. [DOI] [PubMed] [Google Scholar]
- 10.Ahola R, Sand J, Laukkarinen J. Centralization of pancreatic surgery improves results: review. Scand J Surg. 2020;109:4–10. doi: 10.1177/1457496919900411. [DOI] [PubMed] [Google Scholar]
- 11.Latenstein AEJ, Mackay TM, van der Geest LGM, van Eijck CHJ, de Meijer VE, Stommel MWJ, et al. Effect of centralization and regionalization of pancreatic surgery on resection rates and survival. Br J Surg. 2021;108:826–33. doi: 10.1093/bjs/znaa146. [DOI] [PubMed] [Google Scholar]
- 12.Gooiker GA, Lemmens VE, Besselink MG, Busch OR, Bonsing BA, Molenaar IQ, et al. Impact of centralization of pancreatic cancer surgery on resection rates and survival. Br J Surg. 2014;101:1000–5. doi: 10.1002/bjs.9468. [DOI] [PubMed] [Google Scholar]
- 13.Huang L, Jansen L, Balavarca Y, Babaei M, van der Geest L, Lemmens V, et al. Stratified survival of resected and overall pancreatic cancer patients in Europe and the USA in the early twenty-first century: a large, international population-based study. BMC Med. 2018;16:125. doi: 10.1186/s12916-018-1120-9. [DOI] [PMC free article] [PubMed] [Google Scholar]
- 14.Madley-Dowd P, Hughes R, Tilling K, Heron J. The proportion of missing data should not be used to guide decisions on multiple imputation. J Clin Epidemiol. 2019;110:63–73. doi: 10.1016/j.jclinepi.2019.02.016. [DOI] [PMC free article] [PubMed] [Google Scholar]
- 15.Ro C, Chai W, Yu VE, Yu R. Pancreatic neuroendocrine tumors: biology, diagnosis,and treatment. Chin J Cancer. 2013;32:312–24. doi: 10.5732/cjc.012.10295. [DOI] [PMC free article] [PubMed] [Google Scholar]
- 16.Cabasag CJ, Arnold M, Piñeros M, Morgan E, Brierley J, Hofferkamp J, et al. Population-based cancer staging for oesophageal, gastric, and pancreatic cancer 2012–2014: International Cancer Benchmarking Partnership SurvMark-2. Int J Cancer. 2021 doi: 10.1002/ijc.33679. [DOI] [PubMed] [Google Scholar]
- 17.US Preventive Services Task Force. Screening for Pancreatic Cancer: US Preventive Services Task Force Reaffirmation Recommendation Statement. JAMA. 2019;322:438–44. doi: 10.1001/jama.2019.10232. [DOI] [PubMed] [Google Scholar]
- 18.Klein AP. Identifying people at a high risk of developing pancreatic cancer. Nat Rev Cancer. 2013;13:66–74. doi: 10.1038/nrc3420. [DOI] [PMC free article] [PubMed] [Google Scholar]
- 19.Del Chiaro M, Segersvard R, Lohr M, Verbeke C. Early detection and prevention of pancreatic cancer: is it really possible today? World J Gastroenterol. 2014;20:12118–31. doi: 10.3748/wjg.v20.i34.12118. [DOI] [PMC free article] [PubMed] [Google Scholar]
- 20.Tas F, Sen F, Keskin S, Kilic L, Yildiz I. Prognostic factors in metastatic pancreatic cancer: older patients are associated with reduced overall survival. Mol Clin Oncol. 2013;1:788–92. doi: 10.3892/mco.2013.131. [DOI] [PMC free article] [PubMed] [Google Scholar]
- 21.He J, Edil BH, Cameron JL, Schulick RD, Hruban RH, Herman JM, et al. Young patients undergoing resection of pancreatic cancer fare better than their older counterparts. J Gastrointest Surg. 2013;17:339–44. doi: 10.1007/s11605-012-2066-4. [DOI] [PMC free article] [PubMed] [Google Scholar]
- 22.Amin S, Lucas AL, Frucht H. Evidence for treatment and survival disparities by age in pancreatic adenocarcinoma: a population-based analysis. Pancreas. 2013;42:249–53. doi: 10.1097/MPA.0b013e31825f3af4. [DOI] [PMC free article] [PubMed] [Google Scholar]
- 23.Conroy T, Desseigne F, Ychou M, Bouche O, Guimbaud R, Becouarn Y, et al. FOLFIRINOX versus gemcitabine for metastatic pancreatic cancer. N. Engl J Med. 2011;364:1817–25. doi: 10.1056/NEJMoa1011923. [DOI] [PubMed] [Google Scholar]
- 24.Williet N, Saint A, Pointet AL, Tougeron D, Pernot S, Pozet A, et al. Folfirinox versus gemcitabine/nab-paclitaxel as first-line therapy in patients with metastatic pancreatic cancer: a comparative propensity score study. Ther Adv Gastroenterol. 2019;12:1756284819878660. doi: 10.1177/1756284819878660. [DOI] [PMC free article] [PubMed] [Google Scholar]
- 25.Latenstein AEJ, Mackay TM, Creemers GJ, van Eijck CHJ, de Groot JWB, Haj Mohammad N, et al. Implementation of contemporary chemotherapy for patients with metastatic pancreatic ductal adenocarcinoma: a population-based analysis. Acta Oncol. 10.1080/0284186X.2020.1725241 (2020). [DOI] [PubMed]
- 26.Versteijne E, Suker M, Groothuis K, Akkermans-Vogelaar JM, Besselink MG, Bonsing BA, et al. Preoperative chemoradiotherapy versus immediate surgery for resectable and borderline resectable pancreatic cancer: results of the Dutch randomized phase III PREOPANC trial. J Clin Oncol. 2020;38:1763–73. doi: 10.1200/JCO.19.02274. [DOI] [PMC free article] [PubMed] [Google Scholar]
- 27.Makar M, Worple E, Dove J, Hunsinger M, Arora T, Oxenberg J, et al. Disparities in care: impact of socioeconomic factors on pancreatic surgery: exploring the National Cancer Database. Am Surg. 2019;85:327–34. doi: 10.1177/000313481908500420. [DOI] [PubMed] [Google Scholar]
- 28.Wennervaldt K, Kejs AM, Lipczak H, Bartels P, Borre M, Fristrup CW, et al. Regional variation in surgery for pancreatic cancer in Denmark 2011–2015. Dan Med J. 2018;65:A5503. [PubMed]
- 29.Cancer Council. Optimal care pathway for people with pancreatic cancer. https://www.cancer.org.au/ocp (2021).
- 30.Reames BN, Blair AB, Krell RW, Groot VP, Gemenetzis G, Padussis JC, et al. Management of locally advanced pancreatic cancer: results of an international survey of current practice. Ann Surg. 2019 doi: 10.1097/SLA.0000000000003568. [DOI] [PubMed] [Google Scholar]
- 31.Andersson TM, Rutherford MJ, Myklebust TA, Moller B, Soerjomataram I, Arnold M, et al. Exploring the impact of cancer registry completeness on international cancer survival differences: a simulation study. Br J Cancer. 2021;124:1026–32. doi: 10.1038/s41416-020-01196-7. [DOI] [PMC free article] [PubMed] [Google Scholar]
- 32.Rutherford MJ, Moller H, Lambert PC. A comprehensive assessment of the impact of errors in the cancer registration process on 1- and 5-year relative survival estimates. Br J Cancer. 2013;108:691–8. doi: 10.1038/bjc.2013.12. [DOI] [PMC free article] [PubMed] [Google Scholar]
- 33.Bray F, Ferlay J. Chapter 5: Data comparability and quality. In: Bray F, et al. editors. CI5: cancer incidence in five continents, volume XI. Lyon: International Agency for Research on Cancer; 2017. p. 101–19.
- 34.Yadav S, Sharma P, Zakalik D. Comparison of demographics, tumor characteristics, and survival between pancreatic adenocarcinomas and pancreatic neuroendocrine tumors: a population-based study. Am J Clin Oncol. 2018;41:485–91. doi: 10.1097/COC.0000000000000305. [DOI] [PubMed] [Google Scholar]
- 35.Genus TSE, Bouvier C, Wong KF, Srirajaskanthan R, Rous BA, Talbot DC, et al. Impact of neuroendocrine morphology on cancer outcomes and stage at diagnosis: a UK nationwide cohort study 2013–2015. Br J Cancer. 2019;121:966–72. doi: 10.1038/s41416-019-0606-3. [DOI] [PMC free article] [PubMed] [Google Scholar]
Associated Data
This section collects any data citations, data availability statements, or supplementary materials included in this article.
Supplementary Materials
Data Availability Statement
This study is based on cancer registry data provided by registries participating in ICBP SURVMARK-2 project. Data are owned by cancer registries and authors are not permitted to share these data externally except in aggregate form, e.g. publication. Any data request should be directed to each corresponding cancer registry.