



Abstract
Hepatic cysts (HC) are sac-like structures mainly filled with liquid and showing a distinct membrane. They are usually found incidentally through imaging. A wide spectrum of imaging patterns may be observed for common and uncommon, neoplastic and non-neoplastic diseases. While simple hepatic cysts occur frequently and do not require any treatment or follow-up, non-typical cysts should be carefully analysed to avoid misdiagnosing a lesion that would require appropriate management. Therefore, adequate knowledge of all the relevant imaging patterns is critical to secure an accurate diagnosis. The aim of this review is to describe the imaging features of the different types of hepatic cysts.
Keywords: Hepatic, Cysts, Ultrasonography, Computed tomography, Magnetic resonance imaging
Key points
Cystic liver lesions are common lesions dominated by simple hepatic cysts.
Aetiologies of hepatic cysts are varied: developmental, infectious, neoplastic.
Atypical characteristics of hepatic cysts should always be searched for.
Atypical features are: thick wall, septa or solid portion, enhancement, non-fluid signal.
The clinical context must always be considered.
Background
Hepatic cysts are frequent (2.5% to 18% in the general population), mostly incidental and asymptomatic lesions [1–3]. They are well-defined fluid-filled lesions, with or without epithelial lining. Depending on the lesion, the cystic component may be composed of different types of fluid, including bilious, serous, mucinous, necrotic, haemorrhagic, proteinaceous or mixed fluid [4, 5]. Some of them may be diagnosed non-invasively on the basis of specific imaging features [5]. Radiologists should both know and recognise non-typical benign features—i.e. wall thickness, presence of septa, tissular component, enhancement, and signal intensity on MRI [7, 9]—and systematically take the clinical context into consideration.
The aim of this article is to describe and illustrate some of the most frequent cystic hepatic lesions, with a special emphasis on typical radiological features, which allow a non-invasive diagnosis. Even though the extra-hepatic bile ducts abnormalities, rare tumours sometimes cystic (hepatocellular carcinoma, mucinous cholangiocarcinoma, etc.) and post-traumatic lesions will not be addressed in this review, they are listed in Table 1.
Table 1.
Other cystic lesions that could be evocated as differential diagnosis
| Post-traumatic lesions (biloma, hematoma, seroma) |
| Pseudocyst following acute pancreatitis |
| Epidermoid cyst |
| Endometrial cyst |
| Cystic hepatocellular carcinoma |
| Undifferentiated embryonal sarcoma |
| Mucinous cholangiocarcinoma |
| Mesenchymal Hamartoma |
A summary of the imaging patterns for each cystic disease is presented in Table 2. Finally, Fig. 1 shows a diagnostic algorithm.
Table 2.
Summary of the imaging patterns for each cystic disease
| Disease | US patterns | CT patterns | MRI patterns |
|---|---|---|---|
| Simple hepatic cyst |
Anechoic Homogeneous Smooth margins Thin wall No mural nodule nor septation |
Hypoattenuation near water Smooth margins Thin wall No mural nodule nor septation No enhancement |
HypoT1, hyperT2 Smooth margins Thin wall No mural nodule nor septation No enhancement |
| Haemorrhagic cyst |
Anechoic/hyperechoic Heterogeneous Non-enhancing septas “Fern leaf” aspect Possibly painful during US exam |
Higher attenuation than water Hyperattenuation Fluid–fluid level No enhancement |
Blood signal according to the stage of the bleeding Heterogeneous No enhancement |
| Infected cyst |
Anechoic/hyperechoic Thick wall |
Higher attenuation than water Thick enhancing wall Fluid–fluid level Gas bubbles |
Heterogeneous intensity Thick enhancing wall Possibly restricted water diffusion (when large) |
| Bile duct hamartoma |
Small and multiple Hyperechoic Comet-tail artefacts “Snow storm” aspect |
Small and multiple Hypoattenuation Irregular shape No enhancement |
Small and multiple HypoT1, hyperT2 “Starry sky” aspect No communication with the biliary tract |
| Caroli syndrome |
Diffuse fusiform dilatation of the biliary tract “Central dot” sign Hepatic dysmorphia |
Same as US Better visibility of the “central dot” sign Intrahepatic lithiasis |
Same as CT Assessment of communication with the biliary tract |
| Caroli disease |
Diffuse aneurysmal dilatation of the biliary tract “Central dot” sign |
Same as US Better visibility of the “central dot” sign Intrahepatic lithiasis |
Same as CT Assessment of communication with the biliary tract |
| Polycystic liver disease |
Multiple simple hepatic cyst Compression |
Multiple simple hepatic cyst Compression |
Multiple simple hepatic cyst Compression |
| Peribiliary cyst |
Multiple small peri-portal cysts “String of pearls” aspect |
Multiple small peri-portal cysts “String of pearls” aspect |
Not communicating with the biliary tract (MRCP and use of hepatobiliary MRI contrast agent may help) |
| Hepatic lymphatic malformation |
Multilocular Enhancing thin septas on ECUS |
Multilocular Enhancing thin septas and wall |
Possibly varying signal on T1 and T2 Dilated lymph duct on lymphoMR |
| Ciliated hepatic foregut duplication cyst |
Solitary and subcapsular Mostly in the IV segment Hypoechoic Possibly heterogeneous, fluid–fluid level |
Solitary and subcapsular Mostly in the IV segment Hyperattenuation/hypoattenuation higher than simple fluid Fluid–fluid level No enhancement |
Solitary and subcapsular Mostly in the IV segment HyperT2 and hyperT1 Fluid–fluid level No enhancement |
| Mucinous cystic neoplasm of the liver |
Solitary and large Anechoic Multilocular Irregular margins Septas and thick wall |
Solitary and large Hypoattenuation Multilocular Enhancing septas and (thick) wall Mural nodule (invasive type) Rare calcification (invasive type) |
Solitary and large Varying signal on T1 and T2 Multilocular Enhancing septas and wall Fluid–fluid level/protein rich fluid Haemorrhagic fluid / mural nodule (invasive type) |
| Intraductal papillary neoplasm of the bile duct | Mostly intraluminal hypo or hyperechoic mass with upstream duct dilatation | Intraductal heterogeneous mass enhancing at arterial phase, non-increasing on portal and delayed phase |
HyperT2 and hypoT1 heterogeneous Same enhancement as CT Connection with the biliary tract on MRCP Possibly restriction of diffusion |
| Cystic metastasis |
Non-purely anechoic With thick wall, mural nodule, septas |
Various type Hypoattenuation with complex patterns: thick wall, septas, enhancement, mural nodule |
Various type HyperT2 with complex patterns: thick wall, septas, enhancement, mural nodule |
| Pyogenic abscess |
Heterogeneous Anechoic/hypoechoic/hyperechoic |
Hypoattenuation “Double target” sign “Honeycomb” pattern and “Cluster” sign Gas bubbles |
HyperT2, hypoT1 Same patterns as CT Central restriction of diffusion (large abscess) |
| Hydatid cyst (first stages/patterns depend on the stage) |
Anechoic with possibly mobile internal echos and hyperechoic parts Irregular margins |
Hypoattenuation Irregular margins Wall calcifications Internal septas, thick wall |
HyperT2 HypoT2 wall and septas Heterogeneous signal Typical “wheel-spoke” pattern for CE2 |
| Hepatic alveolar echinococcosis |
Hypoechoic/hyperechoic/anechoic Heterogeneous Irregular margins |
Hypoattenuation Heterogeneous Irregular margins Central calcifications May deform the hepatic capsule No enhancement |
HyperT2, hypo to intermediate T1 HypoT2 and hypoT1 for fibrotic part Multivesicular aspect |
Fig. 1.

Simple algorithms helping to delineate diagnosis according to the number of cysts
Ductal abnormalities
Ductal plate malformations correspond to a group of congenital cystic liver lesions, which can affect both the intra- and/or the extrahepatic biliary ducts. They result from insufficient remodelling and resorption of cylindrical ductal plates [8]. Figure 2 emphasises the stage of ductal plate malformation according to the development of the bile duct, from the centre to the periphery.
Fig. 2.

Schematic figure (axial section of a liver) showing the different types of ductal plate malformation. The size of the affected ducts is closely correlated to the ductal development phase
Simple hepatic cyst
Aetiopathogenesis
Simple hepatic cysts (SHC) (also known as bile duct cysts or biliary cysts) are congenital parts of the ductal tree detached from the main biliary system, which dilated to become cystic lesion [9]. There is no consensus on their actual origin. They are thought by some authors to result from the dilatation of the bile duct hamartoma (cf. section) [4], and they do not communicate with the biliary tract. In the literature, their prevalence is reported to range from 2.5 to 18%, occurring more frequently in women, with an incidence that increases with age [5, 10, 11].
SHCs are benign lesions, which are usually asymptomatic. Cystic serous fluid is continually produced by the cuboidal biliary epithelium [10]. A very large cyst can cause abdominal pain or early satiety by compression. Complications, which may include haemorrhage or infection, are rare and may result in the lesion becoming a “complex cyst”.
Imaging
A SHC is a well-circumscribed unilocular lesion with a thin imperceptible wall, which may be lobulated; it is anechoic on ultrasonography (US) with increased through-transmission. A SHC is hypoattenuating on computed tomography (CT) images (0–20 HU) and appears as hypointense on T1 and strongly hyperintense on T2 images with magnetic resonance imaging (MRI). It does not have internal nodule and does not show enhancement after the administration of intra-venous contrast agents (whether with US, CT or MRI) (Figs. 3 and 4). It can be bi- or multi-lobar (fused cysts) (Fig. 6). The typical features on each imaging modality are sufficient findings allowing a confident diagnosis.
Fig. 3.

Incidentally found simple hepatic cyst in an asymptomatic 64-year-old male. a Ultrasonography shows a round homogeneous anechoic cystic hepatic lesion, well-circumscribed and without any mural nodule or vegetation. The arrows show an increased through transmission, confirming the cystic nature of the lesion. b T2-weighted magnetic resonance imaging shows a highly hyperintense round lesion. c and d Computed tomography without and with contrast on portal venous phase shows a round homogeneous non-enhancing hypoattenuating lesion (3 Hounsfield Units)
Fig. 4.

Very large simple hepatic cyst in a symptomatic 64-year-old female with abdominal pain. a Axial and (b) coronal computed tomography on portal venous phase shows a very large simple hepatic cyst. The cyst had grown progressively for a certain number of years and was eventually treated by laparoscopic fenestration, resulting in pain relief
Fig. 6.

Bilobulated haemorrhagic hepatic cyst in a 73-year-old female. a Coronal non-enhanced computed tomography shows a bilobulated cyst with focal hyperattenuation in the inferior part (arrow); b coronal T2-weighted magnetic resonance imaging shows heterogeneous hypointensity inside the inferior part of the cyst (arrow). c Contrast-enhanced ultrasonography confirms the non-enhancement of the cystic part of the lesion (arrowhead)
“Complex cyst”
Complications of SHCs are rare. However, they need to be recognised, since they change the features of the cyst and could therefore lead to misdiagnosis. This is especially the case of tumoural cysts [11].
Haemorrhage: these cysts can increase in size. They have a heterogeneous content with septations seen as echoic intralesional materials (Fig. 5) (pain can occur during ultrasound examination). On CT, their attenuation is higher than that of simple fluid and, on MRI, the signal produced is that generated by blood flow according to the stage of the bleeding (Figs. 6 and 7). A fluid–fluid level can be observed (Fig. 6). The inner septa are mobile but do not enhance. A pseudo-capsule in the form of a thin peripheral rim enhancement is depicted and should not be mistaken for tumoural tissue.
Infections: they are exceptional, except in the case of polycystic disease. A thick wall with heterogeneous enhancement, a fluid–fluid level and some gas bubbles inside the cyst can be seen. It can be difficult to differentiate these cysts from abscesses, unless a prior examination demonstrated the presence of SHCs.
Rupture: rupture also occurs very rarely and a typical sign suggesting rupture is a “floating wall” inside the cyst. In case of a subcapsular cyst, a rupture can be associated with perihepatic fluid (Fig. 8).
Large symptomatic SHC: even though very large SHCs are usually asymptomatic, they could cause pain or duodenogastric compression. The treatment may be surgical (cyst fenestration) or radiological by sclerotherapy. Due to the difficulty in attributing symptoms to the cyst, a diagnostic test can be carried out through a simple aspiration.
Fig. 5.

Subacute haemorrhage in a simple hepatic cyst in a 70-year-old male. Ultrasonography shows a spontaneous mobile area of hyperechogenicity inside the cyst, appearing as a “fern leaf”
Fig. 7.

Haemorrhagic cyst in a 55-year-old male patient. a Axial T1 fat-sat-weighted magnetic resonance imaging shows hyperintense lesion and (b) axial T2-weighted magnetic resonance imaging shows a heterogeneous hyperintensity; c and d axial T1-fat-sat-weighted imaging without and with subtraction shows no enhancement after gadolinium-chelate injection
Fig. 8.

Rupture of a hepatic cyst in a 89-year-old male with severe abdominal pain. Axial computed tomography on portal venous phase demonstrates a floating wall (arrow) associated with pericystic and peri-hepatic fluid collection
Bile duct hamartoma
Aetiopathogenesis
Bile duct hamartomas (BH) (also known as von Meyenburg complexes) are benign lesions caused by failure of the small interlobular bile ducts to involute at the late phase of embryogenesis [12–14]. BHs are asymptomatic and disconnected bile duct lesions with only limited dilation, lined by biliary epithelium. The prevalence based on autopsy series is around 5.6% in adults [13]. BHs can be observed in healthy livers or in association with other ductal plate abnormalities [13]. As of 2016, 35 cases of cholangiocarcinoma associated with BH have been reported in the literature, without other associated ductal plate malformation [13].
Imaging
BHs are commonly subcapsular or located at the periphery of portal tracts [12]. US images show multiple small (< 1.5 cm) intra-hepatic cysts, which are mostly hyperechoic due to their small size and to a fibrous stroma (Fig. 9a), with comet-tail artefacts [4, 13]. The pattern they produce has been described as a “snowstorm” [14]. They are poorly visible on CT, round or irregular in shape, with strict fluid attenuation and no enhancement (Fig. 9c). MRI allows a better detection with a strongly T2-weighted sequence [13] resulting in a “starry sky” appearance [15] (Fig. 9d). Magnetic resonance cholangiopancreatography (MRCP) sequences confirm the lack of communication with the biliary tract (Fig. 9b). In some cases, a thin regular persistent enhanced rim can be seen due to the compressed surrounding liver parenchyma [4]. The typical features on each imaging modality are sufficient to reach a conclusive diagnosis. It may be difficult to discriminate between bile duct hamartomas and simple hepatic cysts when there are only few bile duct hamartomas in the liver parenchyma. The main differentiating patterns include the size of the lesion (small) and their disposition (mostly peripheral). However, from a clinical standpoint, setting them apart is not critical, because both are benign lesions.
Fig. 9.

Bile duct hamartomas in a 52-year-old female. a Multiple hyperechoic round nodules (arrows) at ultrasonography, displaying a “snowstorm” pattern. b Coronal magnetic resonance cholangiopancreatography shows several small hyperintense nodules, which do not communicate with the biliary tract (arrows). c Axial computed tomography on portal venous phase shows bilobar small round-shaped hypoattenuating nodules, which can be better detected with an axial magnetic resonance cholangiopancreatography sequence (d)
Caroli syndrome and disease
These are both extremely rare congenital ductal plate development abnormalities (prevalence of less than one in 1,000,000 inhabitants) [16]. Caroli disease (CD) occurs less frequently than Caroli syndrome (CS). CS must be differentiated from CD. Their pathophysiology is different. CD results from the abnormal development of large bile ducts, whereas CS affects both the central and smaller peripheral bile ducts. CS combines cystic biliary dilatation (congenital intrahepatic ductal dilatation) and the features of congenital hepatic fibrosis, whereas CD is characterised solely by biliary dilatation. The origin of CD is unclear: it is thought to be usually nonhereditary, and it is rarely transmitted in an autosomal dominant mode. CS is transmitted in an autosomal recessive mode. While CD is assumed to result from a partial or complete interruption at an early phase of ductal plate remodelling, in CS, the abnormalities occur both at an early and at a late phase and involve peripheral bile ducts [8, 15]. Follow-up is mandatory for CS and CD due to the increased risk of cholangiocarcinoma [17]. In addition, the cysts and biliary tract can contain stones, resulting from the stagnation of bile.
Caroli disease
Aetiopathogenis
The lack of periportal biliary epithelium regression during embryogenesis creates the aneurysmal dilatation of the large intra-hepatic bile ducts [8, 15]. The liver parenchyma is normal. Frequent symptoms include abdominal pain, jaundice, and/or cholangitis.
Imaging
The biliary tract is abnormal and there are focal dilated bile ducts, without stenosis (Fig. 10). The cystic dilatations are connected to the biliary tract and have thin walls with a “central dot sign,” corresponding to a residual portal vein and arterial branch [15]. The Doppler or contrast-enhanced CT/MRI images confirm its vascular origin [10].
Fig. 10.

Caroli disease in a 24-year-old male. a Axial magnetic resonance imaging in T2 and (b) in T1 on portal venous phase show both fusiform (arrows) and connected round (arrowheads) dilatations, better depicted on magnetic resonance cholangiopancreatography images (c). There is no associated sign of fibrosis
MRCP is the modality of choice for assessing these lesions. Cystic hepatic lesions communicate with the biliary tract (Fig. 10). The use of hepatobiliary MRI contrast agents can be useful to confirm the communication between the biliary tracts and cysts [15]. There is no liver atrophy (Fig. 10).
Caroli syndrome
Aetiopathogenesis
This syndrome combines bile duct dilatations and congenital hepatic fibrosis. CS could be associated with the autosomal recessive polycystic kidney disease (PKHD1 mutation) [18]. The symptoms are due to the consequences of liver fibrosis. Follow-up is required not only to prevent the complications induced by hepatic fibrosis but also because of the increased risk of cholangiocarcinoma (about 7%) [17].
Imaging
The features are similar to those of CD, with cysts communicating with the dilated bile ducts, and with the specific “central dot sign” (Fig. 11). They are usually smaller in CS than in CD (< 3 cm), with diffuse fusiform dilatation of the biliary tract [10].
Fig. 11.

Caroli syndrome in a 7-year-old female, at ultrasonography. Several round anechoic cysts (stars) with thin wall, increased through-transmission, connected to the dilated fusiform biliary tract (arrows), some of which show the highly specific “central dot sign” (arrowhead)
The associated hepatic fibrosis may lead to specific dysmorphia (hypertrophy of the left and caudate lobes, normal size or hypertrophy of segment IV and hypotrophy of the right lobe [19]) and to features of portal hypertension (portosystemic collateral vessels, splenomegaly and ascites) (Fig. 12).
Fig. 12.

Caroli syndrome in a 53-year-old female. a Axial magnetic resonance imaging on portal venous phase shows peripheric fusiform dilated bile duct, hyperintense on axial T2-weighted magnetic resonance imaging (b), with the specific “central dot sign” (arrows). Note the presence of spleno-renal shunts due to portal hypertension
Polycystic liver disease
Aetiopathogenesis
Polycystic liver disease (PLD) may involve the liver only (autosomal dominant polycystic liver disease (ADPLD): ≈ 1:100,000), or the liver and the kidney, in a dominant (autosomal dominant polycystic kidney disease (ADPKD): ≈ 1:600–1,000) or recessive form (autosomal recessive polycystic kidney disease (ARPKD)) ≈ 1:20,000) [20]. The number of cysts required for diagnosis has not been clearly defined. The international PLD registry steering committee suggests that at least 10 simple hepatic cysts should be present for a diagnosis to be made [21]. As with SHCs, complications include organ compression (including biliary and hepatic vessels), haemorrhage, infection (Fig. 13) or rupture. The detection of an infected cyst among multiple ones might be difficult, but 18-Fluorine-fluorodeoxyglucose positron emission tomography (18-F-FDG PET) imaging may provide helpful guidance (Fig. 14).
Fig. 13.

Infected simple hepatic cysts in a 77-year-old male with autosomal dominant polycystic liver disease. a Axial non-enhanced computed tomography shows two cysts under pressure (arrow), slightly more attenuating than the non-infected cysts (arrowhead); b with a thick enhanced wall on the portal venous phase (arrowhead)
Fig. 14.

Infected cyst in a 65-year-old male patient with autosomal dominant polycystic liver disease. a Axial non-enhanced computed tomography depicts one more attenuating cyst among multiple simple cysts (cross); b 18-F-FDG PET imaging shows the increased metabolism of that cyst (SUV at 5,1)
Imaging
Cysts, which are similar to SHCs, are spread diffusely throughout the liver (Fig. 15). They may coalesce then showing a linear calcification between them. They frequently lead to hepatomegaly and to vascular compression with venous collaterals [22].
Fig. 15.

Autosomal dominant polycystic kidney disease in a 38-year-old male patient. a Axial computed tomography on portal venous phase and b axial T2-weighted magnetic resonance imaging show several simple hepatic cysts and also numerous kidney cysts (arrows), with fluid signal (hypodense/hyperintense on T2)
Other cystic lesions
Peribiliary cyst
Aetiopathogenesis
Peribiliary cysts, which are small serous cysts caused by obstructed extramural hilum peribiliary glands, must not be confused with biliary dilatations. The aetiopathogenesis of these cysts and their exact prevalence are unknown. They are mostly found in cirrhotic liver (50% in autopsy studies [23]), in ADPKD or ADPLD [24] and can be solitary (10%). They can sometimes cause compression and cholangitis. A classification of the cysts has been proposed according to their location: type I including intrahepatic biliary tract, type II extrahepatic biliary tract and type III intrahepatic and extrahepatic biliary tract (25).
Imaging
Peribiliary cysts are characterised by multiple, usually small (from 1 to 55 mm [24]), simple cystic lesions, appearing as a “string of pearls” around the hilar portal veins (Fig. 16). They are predominantly located in the left lobe due to the preponderance of the peribiliary gland [10]. While they do not communicate with the biliary tract, they can communicate with one another, thereby mimicking biliary dilatations. MRCP is helpful to differentiate them from biliary dilatations (Fig. 16) and hepatobiliary MRI contrast agent can be used to prove the absence of biliary communication [10]. On rare occasions, peribiliary cysts can be confused with dilated lymphatic vessels [25].
Fig. 16.

Peribiliary cyst in a 69-year-old cirrhotic male. a Ultrasonography shows multiple periportal (arrowhead) cysts (arrows). b The portal vessels are clearly visible (arrowhead) on axial portal venous phase magnetic resonance imaging, showing the periportal location of the cysts. c and d Axial T2-weighted magnetic resonance imaging and magnetic resonance cholangiopancreatography images show multiple small cysts along thin, non-dilated bile ducts
Hepatic lymphatic malformation
Aetiopathogenesis
Hepatic lymphatic malformations (HLM) are extremely rare (8 cases reported in the literature up to 2010 [26]). They consist of benign cystic dilatations of the liver’s lymphatic spaces, commonly associated with systemic lymphangiomatosis [6, 27]. These cysts are lined with endothelial cells and filled with lymph [27]. Three subtypes of HLM are described in the literature: capillary (super-microcystic), cavernous (microcystic), or cystic (macrocystic) [6, 27]. Through immunohistochemistry, D2-40 has been reported to be a highly specific antibody for the identification of the lymphatic endothelium when making a diagnosis during histological analysis [
Imaging
They can be unilocular, but are more often multilocular, with septa and wall, which may enhance inconsistently. Confusion can occur with cystadenomas, cystadenocarcinomas or sclerosing haemangiomas [26, 29], but MRI can be usefully relied upon to avoid such a likelihood. The hepatic lymphatic malformations produce varying signals in T1- and T2-weighted sequences, depending on the quantity of fat and fluid components [30]. Lympho-MR sequences can show dilated lymph duct surrounding the lesion, thereby supporting the diagnosis of HLM [25, 28]. Finally, hepatic lymphatic malformations can spontaneously disappear (Fig. 17).
Fig. 17.

Spontaneous disappearance of a cystic lesion in a 5-year-old boy between 2017 and 2018, which led to the diagnosis of this lesion as a most likely liver lymphatic malformation. a Ultrasonography shows biloculated homogeneous cyst (arrow), which vanished one year later (star). It displayed fluid signal (arrows) on axial T2-weighted (b) and T1-weighted magnetic resonance imaging in 2017 (c). The main differential diagnosis of this lesion would be two fused simple hepatic cysts or mesenchymal hamartoma
Ciliated hepatic foregut duplication cyst
Aetiopathogenesis
Ciliated hepatic foregut duplication cyst (CHFC) is a very rare (about 100 cases reported in the literature up to 2012 [31]) and usually incidental finding. It seems to be caused by a congenital malformation from the embryonic foregut [31]. It comprises four layers: an inner pseudo-stratified columnar epithelial lining, a subepithelial loose connective tissue, smooth muscle and a fibrous capsule [32]. Abdominal discomfort may be due to its subcapsular localisation [33].
The diagnosis can only be made by histology or through fine needle aspiration showing ciliated pseudostratified tall columnar epithelial cells suspended in a mucoid background with immunohistochemical stains [34]. Complete surgical excision is recommended [32] due to the risk of malignancy, especially if the cyst is larger than 5 cm [35, 36].
Imaging
A small (< 4 cm) solitary subcapsular cyst in segment IV is very suggestive of CHFC. However, it has also been described in segment V or VIII [32, 33, 36]. Cysts are non-enhancing, without septa, partition or internal nodule.
Its contents are usually fatty or protein-rich, which may lead to the creation of a fluid–fluid layer [36]. On US, CHFC are hypoechoic, but usually not completely anechoic; on CT, they can be spontaneously hyperattenuating. On MRI, cysts are hyperintense on T2-weighted images, but the signal intensity is nonetheless not as high as that of simple hepatic cysts. On T1 images, the signal is usually spontaneously hyperintense. CHFCs do not demonstrate any contrast enhancement (Fig. 18) [37].
Fig. 18.

Ciliated hepatic foregut duplication cyst in a 15-year-old male. a Axial non-enhanced computed tomography shows a subcapsular nodule of the fourth segment with spontaneous attenuation value of around 50 Hounsfield Units. b On axial T1-weighted magnetic resonance imaging, it is spontaneously hyperintense. c It displays a high level of hyperintensity on axial T2-weighted magnetic resonance imaging. d Axial T1-weighted magnetic resonance imaging on portal venous phase shows neither contrast enhancement nor wall thickening
However, classical signs can be missed when the component of the cyst varies.
The differential diagnosis includes: haemorrhagic cyst, mucinous cystic neoplasm of the liver, metastasis of melanoma, dysplastic nodule (on cirrhosis liver), epidermoid and endometrial cyst. Some imaging patterns can help to accurately identify the different lesions. The haemorrhagic cyst is frequently larger, more heterogeneous and may show a peripheral hypointense T2 wall. The mucinous cystic neoplasm may show enhanced inner septa and a thick enhanced wall. The metastases of melanoma are most of the time less hyperintense on T2 and may show a slight enhancement. The dysplastic nodule is not hyperintense on T2. The epidermoid cyst is very rare and may be differentiated by fine needle aspiration. The endometrial cyst usually has sub-capsular topography.
Cystic tumours
Mucinous cystic neoplasm of the liver
Aetiopathogenesis
Mucinous cystic neoplasms of the liver (MCN-L), previously known as biliary cystadenoma and cystadenocarcinoma, are rare cystic neoplasms (3–5% of hepatic cysts [9]) without biliary communication. MCN-L are composed of cuboidal to columnar epithelial cells, which variably produce mucin and which are associated with ovarian-type subepithelial stroma. They are subdivided into non-invasive and invasive types [38] and frequently occur in women. The diagnosis can be hinted at by the intralesional assay of specific tumour markers (TAG-72) [39].
Treatment requires surgery, since imaging cannot differentiate non-invasive from invasive types with certainty [9].
Imaging
They are frequently large (1.5–35 cm) solitary multilocular cystic lesions, mostly located close to the hepatic hilum in segment IV, with well-circumscribed irregular margins and septations. Internal septa can be calcified [3]. Septations arising from the internal cyst wall without external indentation seem to be a specific sign that can be relied upon to differentiate MCN-L from SHC [7].
On US, they appear as large unilocular anechoic lesions, with thickened and irregular walls and internal septations [40]. Contrast-enhanced ultrasonography (CEUS) can confirm the enhancement of inner septa.
On CT, they appear as a solitary hypoattenuating lesion with septations, a thick wall, rarely with calcification [40]. The attenuation of the cyst varies, depending on the nature of the component.
On MRI, the signal intensity of the lesion may vary depending on the fluid content within each stall (e.g. protein rich), which is very specific [40]. A fluid–fluid level can be seen when there is haemorrhagic content. The capsule and the septa are enhanced with contrast administration (Fig. 19).
Fig. 19.

Typical non-invasive mucinous cystic neoplasm of the liver in a 59-year-old female. a Axial T2-weighted magnetic resonance imaging shows a solitary hyperintense cystic lesion, with hypointense septa (arrows). b Axial T1-weighted magnetic resonance imaging on portal venous phase depicts the enhancement of the capsule and septa (arrows)
Haemorrhagic fluid, solid mural nodule and calcification are most commonly associated with invasive lesions, mural nodules in particular being highly indicative of malignancy [4] (Fig. 20).
Fig. 20.

Invasive mucinous cystic neoplasm of the liver in a 50-year-old female. a Axial non-enhanced computed tomography shows a hypoattenuating lesion with a thick heterogeneous enhancing wall on portal venous phase (b), better seen on T1-weighted magnetic resonance imaging on portal venous phase (d) (arrows). Note the presence of cystic portions on axial T2-weighted sequence (c), in very intense hypersignal T2 (arrows)
It is difficult to carry out a differential diagnosis with mucinous metastases. Of course, the existence of older imaging is crucial, and the context and history of primary mucinous tumour are important elements to consider. The appearance and evolution under treatment are part of the diagnosis in this case. The presence of septa and mural nodule is atypical for mucinous metastases.
MCN should not be confused with an abscess. Unlike the abscess, the solid part of the lesion and the parietal thickening are asymmetric, with thin-walled and thickened parts. The fluid content of the cystic portion is pure fluid (frank hyperintensity on T2-weighted MRI), and no peripheral oedema is observed (hypoattenuated on CT, hyperintense on MRI).
Intraductal papillary neoplasm of the bile duct
Aetiopathogenesis
Intraductal papillary neoplasm of the bile duct (IPNB) is a rare premalignant neoplasm of the bile duct (10% of all bile duct tumours [41]). However, 40% can contain malignant component [41] and the risk of malignant transformation is high. Lesions must be treated by surgical resection whenever possible [41–43].
Imaging
The appearance of the lesions depends on the quantity of mucin produced by the tumours [44]. They mainly appear as an intraluminal cystic mass within the bile duct, with upstream duct dilatation (Fig. 21). If there is an increase in the production of mucin, lesions can appear only as focal or diffuse bile duct dilatations, without any visible solid part. The aneurysmal dilatation of a branch of the biliary tree is considered a characteristic sign of IPNB by some authors [45]. An obvious intracystic solid mass is suggestive of a malignant transformation [44]. An intra-luminal mass may appear hypo- or hyperechoic on US, and highly enhanced on CEUS, CT and MRI during the arterial phase (Fig. 21). CEUS is very sensitive for the detection of cystic walls or nodule enhancement [42]. In contrast to intraductal cholangiocarcinoma, enhancement does not increase in the portal and delayed phases [44]. Diffusion may be restricted, but it is not indistinguishable from that of cholangiocarcinoma.
Fig. 21.

Intraductal papillary neoplasm of the bile duct in a 67-year-old female. a Axial T2-weighted magnetic resonance imaging displays intraductal heterogeneous cystic and tissular mass (star) with dilated bile duct in contact (arrows). The cystic part of the mass is better seen at magnetic resonance cholangiopancreatography (b), and so are the upstream biliary dilatation (arrows) and the connection to the biliary tree (arrowhead). c and d Axial T1-weighted non-enhanced magnetic resonance imaging on arterial phase shows a highly enhanced tissular part
Secondary cystic lesion: cystic metastasis
Aetiopathogenesis
Cystic metastases occur less frequently than solid metastases and purely cystic metastatic tumours without prior treatment are extremely rare. The cystic part of the metastases can be due to spontaneous necrosis, especially in the case of hyperenhancing metastases (neuroendocrine tumours, malignant melanomas, sarcomas or gastrointestinal stromal tumours (GIST)), or it can arise secondary to a systemic or locoregional treatment [3]. There are exceptional cases of cystic liver metastases from squamous cell carcinoma [46]. Mucin production (mucinous colorectal or ovarian adenocarcinoma) can also lead to cystic features.
Imaging
They can be multilocular or unilocular, and present thick walls, irregular contours or mural nodules (Figs. 22, 23, 24, 25). Irregular thick septa are possible (Fig. 25). Since the fluid component results from mucin, necrosis or haemorrhage [3], the attenuation on CT and the signal on MRI are different from pure fluid. US may be useful to distinguish truly fluid cystic masses from cystic metastases, especially when they are small. CEUS can reveal fine peripheral arterial enhancement with early washout (Fig. 22). The clinical setting has to be considered.
Fig. 22.

Cystic metastasis from malignant melanoma in a 72-year-old female. a, b Axial computed tomography on arterial and portal venous phases shows unique hypoattenuating (20 Hounsfield Units) nodule of the right liver lobe, too small to be characterised. c Contrast-enhanced ultrasonography displays an enhanced wall as a “rim” (arrows)
Fig. 23.

Metastatic pancreatic neuroendocrine tumour in a 60-year-old male. a Axial computed tomography on portal venous phase shows a lobulated hypodense cystic nodule in segment V with enhanced mural nodule and septa (arrow), very hyperintense on T2-weighted magnetic resonance imaging (b). A second cystic subcapsular nodule is visible in segment VI
Fig. 24.

Pure cystic metastasis of a neuroendocrine tumour in a 69-year-old female. The hyperintensity on axial T2-weighted magnetic resonance imaging (a) is marked and there is no enhancement on arterial (arrow) or portal venous (arrow-head) phase (b, c)
Fig. 25.

Cystic metastasis of a mucinous tumour of the rectum in a 72-year-old male. The hyperintensity on axial T2-weighted magnetic resonance imaging a is marked but the multiple tiny septa (arrows) incompletely enhanced on portal venous phase (b) are sufficient to reach a conclusive diagnosis in this the context
Infectious cystic lesions
Pyogenic abscess
Aetiopathogenesis
Frequent organisms of pyogenic abscesses are Escherichia coli, Klebsiella pneumoniae, Enterococcus, and Streptococcus [47]. Hyper-virulent strains of Klebsiella pneumoniae have been responsible for severe emerging diseases for the past two decades, particularly in Southeast Asia. Some of them are responsible for bacteremia combined with multiple abscesses (monomicrobial liver abscesses, endophthalmitis, brain abscesses) [48].
The differential diagnosis of pyogenic abscess is the amoebaean abscess.
Imaging
Abscesses are rarely purely cystic and their appearance varies according to the pathologic stage. Before they turn into cystic abscesses, they display a pre-suppurative phase. Then, they appear as multiple cystic nodules (honeycomb pattern) which coalesce in a unique large irregularly shaped cystic cavity (cluster sign), surrounded by hypoattenuating inflammatory parenchyma (Fig. 26). The cluster sign is a feature indicative of pyogenic abscess [47]. The cystic central part appears on US as a large heterogeneous cystic mass, with mixed anechoic, hypoechoic and hyperechoic parts (Fig. 27). On CT and MRI, a rim and septa enhancement has been reported and the “double target” characteristic sign may be observed. This sign is a hypoattenuating central area of pus surrounded by an inner hyperattenuating ring (granulation tissue) and an outer hypoattenuating zone (inflammatory oedema) [3]. Gas may be present (Fig. 27). The central restriction of diffusion due to pus may be seen in larger abscesses.
Fig. 26.
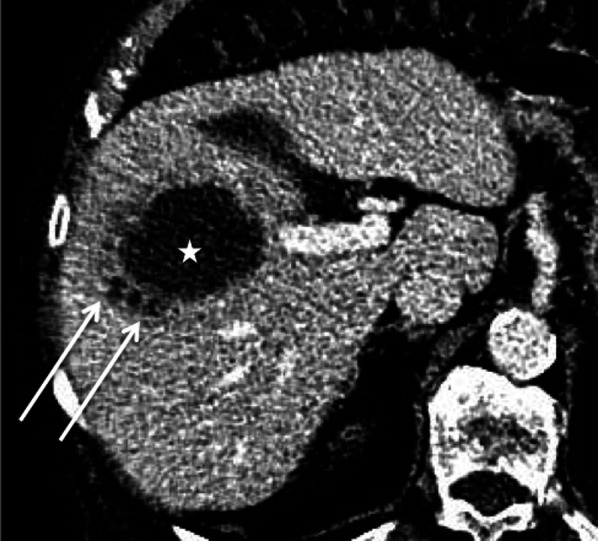
Escherichia Coli abscess in an 89-year-old male. Axial computed tomography on portal venous phase shows three small hypoattenuating areas (arrows) forming the “cluster sign” and a large central hypoattenuating cavity (star)
Fig. 27.

Hepatic pyogenic abscesses in a 49-year-old male. a Ultrasonography shows a large heterogeneous hypoechoic lesion, with anechoic parts (star) and increased through transmission (arrows) confirming its cystic nature. b and c Axial computed tomography on portal venous phase displays multiple abscesses appearing as cystic masses, with a specific sign: the double target (arrows). Note the bubble of gas in one of them (arrow-head)
The appearance of abscesses can vary due to their pathogenesis: while cholangitic abscesses are mostly multiple small cystic nodules, abscesses by hematogenous dissemination are mostly larger and less numerous, and abscesses by contiguous spread are commonly solitary [49].
The thrombotic occlusion of the portal vein or of its branches, or the hepatic veins, is an additional feature supporting the diagnosis of pyogenic abscess [50].
Hydatid cyst
Aetiopathogenesis
Hydatid cysts are caused by Echinococcus granulosis infection [3]. They consist of three layers: the outer pericyst, which corresponds to compressed and fibrosed liver tissue; the endocyst, an inner germinal layer; and the ectocyst, a thin, translucent interleaved membrane [51]. The cysts are mainly asymptomatic, but they can become complicated (biliary fistula, compression, rupture) (Fig. 28) [51].
Fig. 28.

Complicated hydatid cyst in a 50-year-old female. Imaging displays a cyst very close to the biliary tract with lobulated margins, showing a loss of intralesional pressure, most probably resulting from a complication of the biliary connection (not found on magnetic resonance cholangiopancreatography). a Axial T2-weighted magnetic resonance imaging. b Coronal 3D magnetic resonance cholangiopancreatography. c and d Axial T1-fat-sat-weighted imaging without and with contrast on portal venous phase
Imaging
Their characteristic appearance varies, depending on the stage of the disease. On US, both the World Health Organization (WHO) and the Gharbi classification systems are used.
The WHO classification system contains seven categories, which depend on the stage of the disease. The first category is called cystic lesion (CL). These are unilocular anechoic lesions, which appear as simple hepatic cysts. CE1 (cystic echinococcosis 1) corresponds to an active stage: it appears as a uniform anechoic cyst with internal echoes (“hydatid sand”) on US, which may only be seen after patient repositioning. A peripheral hypointense capsule is visible on MRI. CE2 (active stage) (Fig. 29) is as a well-defined multicystic mass with septa. Half of the cases demonstrate calcification of the cyst wall [51, 52], which can be better seen on CT. It displays a multivesicular “honeycomb” appearance due to daughter cysts surrounding a larger “mother” cyst. On CT, the attenuation of the mother cyst is usually higher than that of the daughter cysts due to debris (hydatid sand and detached cysts wall); the signal intensity of the mother cyst is, respectively, higher and lower on T1- and T2-weighted MRI (Fig. 29). T2-weighted MRI sequences are more sensitive than CT to detect and characterise the cystic mass as a typical wheel-spoke pattern (Fig. 29). T2 images show septa and low signal intensity due to the presence of calcifications and to the fibrotic component. They have a different signal on T1-weighed images due to the cyst fluid, which varies according to the amount of proteinaceous debris [3]. Diffusion is not restricted [52]. CE3 is a transitional stage. CE3A is a unique cyst with detached laminated membranes described as the “water lily sign”[51–53]. CE3B shows daughter cysts within a solid matrix. CE4 corresponds to an inactive stage. There are no more daughter cysts. It produces both hypoechoic and hyperechoic signal, whose pattern resembles a ball of wool [53]. (inactive/degenerative stage), is partially or completely calcified.
Fig. 29.

cyst echinococcosis 2, in a 50-year-old male. a Axial non-enhanced computed tomography shows a heterogeneous mass with a cystic part (arrow) and calcification of the wall (arrowhead). b On axial computed tomography on portal venous phase no enhancement of the cystic component is observed. c The cystic part and the differentiation between the daughter (arrow) and the mother (star) cysts are better evaluated on axial T2-weighted magnetic resonance imaging. d Coronal 3D magnetic resonance cholangiopancreatography excludes biliary fistula from the possible diagnosis
Hepatic alveolar echinococcosis
Aetiopathogenesis
This is a rare parasitic infection due to Echinococcus multilocularis. In contrast to the hydatid cyst, a fibrous capsule does not usually demarcate the outer margin. It is a chronic and latent disease, which is usually detected incidentally [52]. When it is symptomatic, it causes compression symptoms. The treatment is medical and surgical. The prognosis is usually poor, sometimes leading to liver transplantation.
Imaging
Hepatic alveolar echinococcosis (HEA) lesions present irregular margins, with a mixed component of solid and cystic parts. Calcifications frequently occur. The lack of enhancement is very helpful to reach a diagnosis.
On US, HEA lesions appear as a large heterogeneous mass, with areas of hyper- and hypoechogenicity (Fig. 30), hyperechoic spots (corresponding to calcifications), and a central cystic anechoic cavity (due to necrosis) [52]. More rarely they appear as multiple hyperechoic nodules with calcification and a cystic part. CT is helpful to identify the calcification. The lesions, which are hypoattenuating, heterogeneous, with irregular margins and calcification, may attract the surrounding parenchyma and distort the hepatic capsule. Usually, no contrast enhancement is observed. In the late phase, the fibrotic component may display mild enhancement. The use of MRI prior to surgery is crucial, because it helps to assess the diagnosis, demonstrating the multivesicular structure of the lesion, and allowing vascular or biliary tree involvement to be assessed [52]. The signal intensity of the cystic part ranges from low to intermediate on T1-weighted images and is high on T2-weighted images; the fibrous part demonstrates low signal intensity both on the T1- and the T2-weighted images (Fig. 30).
Fig. 30.

Hepatic alveolar echinococcosis in a 40-year-old male. a Ultrasonography shows multiple round hyperechoic nodules (arrows) with cystic anechoic parts (arrowhead). b On Axial T2-weighted magnetic resonance imaging, the lesions appear as multivesicular cystic masses (arrows) with a fibrous component (arrowhead). c and d On axial non-enhanced T1-fat-sat-weighted magnetic resonance imaging, the fibrous part is enhancing on late phase (arrow)
Therapeutic efficacy in HAE is essentially evaluated on the basis of repeated 18-F-FDG PET CT [54].
Conclusion
Cystic liver lesions encompass a wide and varied spectrum of features. To characterise them, a particular attention should be paid to wall thickness, to the presence of enhanced septa or solid components, to the fluid signal on MRI and to the clinical context. Since cystic liver lesions may be malignant, all non-SHCs should be investigated to make a conclusive diagnosis.
Acknowledgements
We thank all the radiology team of University Hospital of Angers, who participated in the collection of cases.
Abbreviations
- 18-F-FDG PET
18-Fluorine-fluorodeoxyglucose positron emission tomography
- ADPKD
Autosomal dominant polycystic kidney disease
- ADPLD
Autosomal dominant polycystic liver disease
- BH
Bile duct hamartomas
- CA19-9
Carbohydrate antigen 19-9
- CD
Caroli disease
- CE
Cystic echinococcosis
- CE1
Cystic echinococcosis 1
- CE2
Cystic echinococcosis 2
- CE3
Cystic echinococcosis 3
- CE4
Cystic echinococcosis 4
- CE5
Cystic echinococcosis 5
- CEA
Carcinoembryonic antigen
- CEUS
Contrast-enhanced ultrasonography
- CHF
Congenital hepatic fibrosis
- CHFC
Ciliated hepatic foregut duplication cysts
- CL
Cystic lesion
- CS
Caroli syndrome
- CT
Computed tomography
- GIST
Gastrointestinal stromal tumour
- HC
Hepatic cysts
- HEA
Hepatic alveolar echinococcosis
- HLM
Hepatic lymphatic malformation
- HU
Hounsfield units
- IPNB
Intraductal papillary neoplasms of the bile duct
- MCN-L
Mucinous cystic neoplasms of the liver
- MRCP
Magnetic resonance cholangiopancreatography
- MRI
Magnetic resonance imaging
- PLD
Polycystic liver disease
- SHC
Simple hepatic cysts
- TAG-72
Tumour-associated glycoprotein 72
- US
Ultrasonography
- WHO
World health organization
Author contributions
MC wrote the manuscript. AP and CA were major contributors in revising the manuscript. MR revised the manuscript. MC, AP and CA identified and collected most of the images. PB, JL, DK, MR and VL provided cases. All authors read and approved the final manuscript.
Funding
The authors declare that they have received no funding.
Declarations
Ethics approval and consent to participate
Not applicable.
Consent for publication
Not applicable.
Availability of data and material
Not applicable.
Competing interests
The authors declare that they have no competing interests.
Footnotes
Publisher's Note
Springer Nature remains neutral with regard to jurisdictional claims in published maps and institutional affiliations.
References
- 1.Kaltenbach TE-M, Engler P, Kratzer W, et al. Prevalence of benign focal liver lesions: ultrasound investigation of 45,319 hospital patients. Abdom Radiol (NY) 2016;41(1):25–32. doi: 10.1007/s00261-015-0605-7. [DOI] [PMC free article] [PubMed] [Google Scholar]
- 2.Mortelé KJ, Ros PR. Cystic focal liver lesions in the adult: differential CT and MR imaging features. Radiographics. 2001;21(4):895–910. doi: 10.1148/radiographics.21.4.g01jl16895. [DOI] [PubMed] [Google Scholar]
- 3.Qian LJ, Zhu J, Zhuang ZG, Xia Q, Liu Q, Xu JR. Spectrum of multilocular cystic hepatic lesions: CT and MR imaging findings with pathologic correlation. Radiographics. 2013;33(5):1419–1433. doi: 10.1148/rg.335125063. [DOI] [PubMed] [Google Scholar]
- 4.Borhani AA, Wiant A, Heller MT. Cystic hepatic lesions: a review and an algorithmic approach. AJR Am J Roentgenol. 2014;203(6):1192–1204. doi: 10.2214/AJR.13.12386. [DOI] [PubMed] [Google Scholar]
- 5.Singh Y, Winick AB, Tabbara SO. Multiloculated cystic liver lesions: radiologic-pathologic differential diagnosis. Radiographics. 1997;17(1):219–224. doi: 10.1148/radiographics.17.1.9017811. [DOI] [PubMed] [Google Scholar]
- 6.Gonidec S, Guibal A, Pilleul F. Lymphangiome hépatique isolé de l’adulte: aspects IRM. J Radiol. 2011;92(7–8):729–731. doi: 10.1016/j.jradio.2010.08.003. [DOI] [PubMed] [Google Scholar]
- 7.Kovacs MD, Sheafor DH, Burchett PF, Picard MM, Hardie AD. Differentiating biliary cystadenomas from benign hepatic cysts: Preliminary analysis of new predictive imaging features. Clin Imaging. 2018;49:44–47. doi: 10.1016/j.clinimag.2017.10.022. [DOI] [PubMed] [Google Scholar]
- 8.Desmet VJ. Pathogenesis of ductal plate abnormalities. Mayo Clin Proc. 1998;73(1):80–89. doi: 10.1016/S0025-6196(11)63624-0. [DOI] [PubMed] [Google Scholar]
- 9.Mavilia MG, Pakala T, Molina M, Wu GY. Differentiating Cystic liver lesions: a review of imaging modalities, diagnosis and management. J Clin Transl Hepatol. 2018;6(2):1–9. doi: 10.14218/JCTH.2017.00069. [DOI] [PMC free article] [PubMed] [Google Scholar]
- 10.Vilgrain V, Régent D (2010) Imagerie de l’abdomen. Lavoisier. (Imagerie Médicale)
- 11.Kohno S, Arizono S, Isoda H, Yoshizawa A, Togashi K. Imaging findings of hemorrhagic hepatic cysts with enhancing mural nodules. Abdom Radiol (NY) 2019;44(4):1205–1212. doi: 10.1007/s00261-019-01898-4. [DOI] [PubMed] [Google Scholar]
- 12.Torbenson MS. Hamartomas and malformations of the liver. Semin Diagn Pathol. 2019;36(1):39–47. doi: 10.1053/j.semdp.2018.11.005. [DOI] [PubMed] [Google Scholar]
- 13.Pech L, Favelier S, Falcoz MT, Loffroy R, Krause D, Cercueil JP. Imaging of Von Meyenburg complexes. Diagn Interv Imaging. 2016;97(4):401–409. doi: 10.1016/j.diii.2015.05.012. [DOI] [PubMed] [Google Scholar]
- 14.Nasr D, Bidot M-L, Roche M, et al. Maladie des complexes de von Meyenburg (micro-hamartomes biliaires) découverte lors d’une chirurgie laparoscopique: à propos de deux observations. Ann Chir. 2006;131(8):468–470. doi: 10.1016/j.anchir.2006.03.009. [DOI] [PubMed] [Google Scholar]
- 15.Mamone G, Carollo V, Cortis K, Aquilina S, Liotta R, Miraglia R. Magnetic resonance imaging of fibropolycystic liver disease: the spectrum of ductal plate malformations. Abdom Radiol (NY) 2019;44(6):2156–2171. doi: 10.1007/s00261-019-01966-9. [DOI] [PubMed] [Google Scholar]
- 16.Correia PC, Morgado B. Caroli’s disease as a cause of chronic epigastric abdominal pain: two case reports and a brief review of the literature. Cureus. 2017 doi: 10.7759/cureus.1701. [DOI] [PMC free article] [PubMed] [Google Scholar]
- 17.Fahrner R, Dennler SG, Inderbitzin D. Risk of malignancy in caroli disease and syndrome: a systematic review. World J Gastroenterol. 2020;26(31):4718–4728. doi: 10.3748/wjg.v26.i31.4718. [DOI] [PMC free article] [PubMed] [Google Scholar]
- 18.Alsomali MI, Yearsley MM, Levin DM, Chen W. Diagnosis of congenital hepatic fibrosis in adulthood. Am J Clin Pathol. 2020;153(1):119–125. doi: 10.1093/ajcp/aqz140. [DOI] [PubMed] [Google Scholar]
- 19.Mamone G, Cortis K, Sarah A, Caruso S, Miraglia R. Hepatic morphology abnormalities: beyond cirrhosis. Abdom Radiol (NY) 2018;43(7):1612–1626. doi: 10.1007/s00261-017-1351-9. [DOI] [PubMed] [Google Scholar]
- 20.Santos-Laso A, Izquierdo-Sánchez L, Lee-Law P, et al. New advances in polycystic liver diseases. Semin Liver Dis. 2017;37(01):045–55. doi: 10.1055/s-0036-1597817. [DOI] [PubMed] [Google Scholar]
- 21.van Aerts RMM, van de Laarschot LFM, Banales JM, Drenth JPH. Clinical management of polycystic liver disease. J Hepatol. 2018;68(4):827–837. doi: 10.1016/j.jhep.2017.11.024. [DOI] [PubMed] [Google Scholar]
- 22.Barbier L, Ronot M, Aussilhou B, et al. Polycystic liver disease: hepatic venous outflow obstruction lesions of the noncystic parenchyma have major consequences. Hepatology. 2018;68(2):652–662. doi: 10.1002/hep.29582. [DOI] [PubMed] [Google Scholar]
- 23.Lim J, Nissen NN, McPhaul C, Annamalai A, Klein AS, Sundaram V. Peribiliary hepatic cysts presenting as hilar cholangiocarcinoma in a patient with end-stage liver disease. J Surg Case Rep. 2016 doi: 10.1093/jscr/rjw130. [DOI] [PMC free article] [PubMed] [Google Scholar]
- 24.Bazerbachi F, Haffar S, Sugihara T, et al. Peribiliary cysts: a systematic review and proposal of a classification framework. BMJ Open Gastroenterol. 2018;5(1):e000204. doi: 10.1136/bmjgast-2018-000204. [DOI] [PMC free article] [PubMed] [Google Scholar]
- 25.Arrivé L, Monnier-Cholley L, Cazzagon N, Wendum D, Chambenois E, El Mouhadi S. Non-contrast MR lymphography of the lymphatic system of the liver. Eur Radiol. 2019;29(11):5879–5888. doi: 10.1007/s00330-019-06151-6. [DOI] [PubMed] [Google Scholar]
- 26.Matsumoto T, Ojima H, Akishima-Fukasawa Y, et al. Solitary hepatic lymphangioma: report of a case. Surg Today. 2010;40(9):883–889. doi: 10.1007/s00595-010-4255-7. [DOI] [PubMed] [Google Scholar]
- 27.Lee HH, Lee SY. Case report of solitary giant hepatic lymphangioma. Korean J Hepatobiliary Pancreat Surg. 2016;20(2):71. doi: 10.14701/kjhbps.2016.20.2.71. [DOI] [PMC free article] [PubMed] [Google Scholar]
- 28.Nakano T, Hara Y, Shirokawa M, et al. Hemorrhagic giant cystic lymphangioma of the liver in an adult female. J Surg Case Rep. 2015 doi: 10.1093/jscr/rjv033. [DOI] [PMC free article] [PubMed] [Google Scholar]
- 29.Sugo H, Sekine Y, Miyano S, et al. Hepatic sclerosing hemangioma with predominance of the sclerosed area mimicking a biliary cystadenocarcinoma. Case Rep Hepatol. 2018;4(2018):1–6. doi: 10.1155/2018/7353170. [DOI] [PMC free article] [PubMed] [Google Scholar]
- 30.Stunell H, Ridgway PF, Torreggiani WC, Crotty P, Conlon KC. Hepatic lymphangioma: a rare cause of abdominal pain in a 30-year-old female. Ir J Med Sci. 2009;178(1):93–96. doi: 10.1007/s11845-007-0094-y. [DOI] [PubMed] [Google Scholar]
- 31.Ambe C, Gonzalez-Cuyar L, Farooqui S, Hanna N, Cunningham SC. Ciliated hepatic foregut cyst: 103 cases in the world literature. Open J Pathol. 2012;02(03):45–49. doi: 10.4236/ojpathology.2012.23010. [DOI] [Google Scholar]
- 32.Bishop KC, Perrino CM, Ruzinova MB, Brunt EM. Ciliated hepatic foregut cyst: a report of 6 cases and a review of the English literature. Diagn Pathol. 2015 doi: 10.1186/s13000-015-0321-1. [DOI] [PMC free article] [PubMed] [Google Scholar]
- 33.de la Serna S, García-Botella A, Fernández-Aceñero M-J, Esteban F, Diez-Valladares L-I. Quiste ciliado hepático, diagnóstico diferencial de lesiones hepáticas del segmento iv. Cir Esp. 2016;94(9):545–547. doi: 10.1016/j.ciresp.2016.04.006. [DOI] [PubMed] [Google Scholar]
- 34.Sharma S, Corn A, Kohli V, Wright HI, Sebastian A, Jabbour N. Ciliated hepatic foregut cyst: an increasingly diagnosed condition. Dig Dis Sci. 2008;53(10):2818–2821. doi: 10.1007/s10620-008-0203-4. [DOI] [PubMed] [Google Scholar]
- 35.Wilson JM, Groeschl R, George B, et al. Ciliated hepatic cyst leading to squamous cell carcinoma of the liver – a case report and review of the literature. Int J Surg Case Rep. 2013;4(11):972–975. doi: 10.1016/j.ijscr.2013.07.030. [DOI] [PMC free article] [PubMed] [Google Scholar]
- 36.Ansari-Gilani K, Modaresi Esfeh J. Ciliated hepatic foregut cyst: report of three cases and review of imaging features. Gastroenterol Rep. 2015 doi: 10.1093/gastro/gov028. [DOI] [PMC free article] [PubMed] [Google Scholar]
- 37.Boumoud M, Daghfous A, Maghrebi H, et al. Imaging features of ciliated hepatic foregut cyst. Diagn Interv Imaging. 2015;96(3):301–303. doi: 10.1016/j.diii.2013.07.001. [DOI] [PubMed] [Google Scholar]
- 38.WHO Classification of Tumours Editorial Board (2019) Digestive system tumours 5th Edition. International agency for research on cancer
- 39.Fuks D, Voitot H, Paradis V, Belghiti J, Vilgrain V, Farges O. Intracystic concentrations of tumour markers for the diagnosis of cystic liver lesions: tumour markers for diagnosing cystic liver lesions. Br J Surg. 2014;101(4):408–416. doi: 10.1002/bjs.9414. [DOI] [PubMed] [Google Scholar]
- 40.Averbukh LD, Wu DC, Cho WC, Wu GY. Biliary mucinous cystadenoma: a review of the literature. J Clin Transl Hepatol. 2019;7:1–5. doi: 10.14218/JCTH.2019.00017. [DOI] [PMC free article] [PubMed] [Google Scholar]
- 41.Tominaga K, Kamimura K, Sakamaki A, Terai S. Intraductal papillary neoplasm of the bile duct: a rare liver tumor complicated by malignancy. Hepatology. 2017;66(5):1695–1697. doi: 10.1002/hep.29266. [DOI] [PubMed] [Google Scholar]
- 42.Hasebe T, Sawada K, Hayashi H, et al. Long-term growth of intrahepatic papillary neoplasms: a case report. World J Gastroenterol. 2019;25(36):5569–5577. doi: 10.3748/wjg.v25.i36.5569. [DOI] [PMC free article] [PubMed] [Google Scholar]
- 43.Kunovsky L, Kala Z, Svaton R, et al. Mucinous cystic neoplasm of the liver or intraductal papillary mucinous neoplasm of the bile duct? a case report and a review of literature. Ann Hepatol. 2018;17(3):519–524. doi: 10.5604/01.3001.0011.7397. [DOI] [PubMed] [Google Scholar]
- 44.Chatterjee A, Lopes Vendrami C, Nikolaidis P, et al. Uncommon intraluminal tumors of the gallbladder and biliary tract: spectrum of imaging appearances. Radiographics. 2019;39(2):388–412. doi: 10.1148/rg.2019180164. [DOI] [PubMed] [Google Scholar]
- 45.Lim JH, Yoon K-H, Kim SH, et al. Intraductal papillary mucinous tumor of the bile ducts. Radiographics. 2004;24(1):53–66. doi: 10.1148/rg.241035002. [DOI] [PubMed] [Google Scholar]
- 46.Liu Q, Wang J, Sun C, Xu J. The diagnosis and management of rare cystic liver metastases from nasopharyngeal carcinoma: a case report. Medicine (Baltimore) 2018;97(26):e11257. doi: 10.1097/MD.0000000000011257. [DOI] [PMC free article] [PubMed] [Google Scholar]
- 47.Joshi G, Crawford KA, Hanna TN, Herr KD, Dahiya N, Menias CO. US of right upper quadrant pain in the emergency department: diagnosing beyond gallbladder and biliary disease. Radiographics. 2018;38(3):766–793. doi: 10.1148/rg.2018170149. [DOI] [PubMed] [Google Scholar]
- 48.Rossi G, Lafont E, Gasperini L, et al. Abcès hépatiques. Rev Médecine Interne. 2016;37(12):827–833. doi: 10.1016/j.revmed.2016.08.009. [DOI] [PubMed] [Google Scholar]
- 49.Bächler P, Baladron MJ, Menias C, et al. Multimodality imaging of liver infections: differential diagnosis and potential pitfalls. Radiographics. 2016;36(4):1001–1023. doi: 10.1148/rg.2016150196. [DOI] [PubMed] [Google Scholar]
- 50.Syed MA, Kim TK, Jang H-J. Portal and hepatic vein thrombosis in liver abscess: CT findings. Eur J Radiol. 2007;61(3):513–519. doi: 10.1016/j.ejrad.2006.11.022. [DOI] [PubMed] [Google Scholar]
- 51.Mortelé KJ, Segatto E, Ros PR. The infected liver: radiologic-pathologic correlation. Radiographics. 2004;24(4):937–955. doi: 10.1148/rg.244035719. [DOI] [PubMed] [Google Scholar]
- 52.Kantarci M, Bayraktutan U, Karabulut N, et al. Alveolar echinococcosis: spectrum of findings at cross-sectional imaging. Radiographics. 2012;32(7):2053–2070. doi: 10.1148/rg.327125708. [DOI] [PubMed] [Google Scholar]
- 53.Mirabile E, Solomon N, Fields PJ, Macpherson CNL. Progress towards international adoption of the World Health Organization ultrasound classification of cystic echinococcosis. Acta Trop. 2019;189:6–9. doi: 10.1016/j.actatropica.2018.09.024. [DOI] [PubMed] [Google Scholar]
- 54.Azizi A, Blagosklonov O, Lounis A, et al. Alveolar echinococcosis: correlation between hepatic MRI findings and FDG-PET/CT metabolic activity. Abdom Imaging. 2015;40(1):56–63. doi: 10.1007/s00261-014-0183-0. [DOI] [PubMed] [Google Scholar]