

Abstract
Sex bias exists in the development and progression of non-reproductive organ cancers, but the underlying mechanisms are enigmatic. Studies so far have focused largely on sexual dimorphisms in cancer biology and socioeconomic factors. Here, we establish a role for CD8+ T cell-dependent anti-tumor immunity in mediating sex differences in tumor aggressiveness, which is driven by the gonadal androgen but not sex chromosomes. A male bias exists in the frequency of intratumoral antigen-experienced Tcf7/TCF1+ progenitor exhausted CD8+ T cells that are devoid of effector program and require intrinsic androgen receptor (AR) function. Mechanistically, we identify a novel sex-specific regulon in progenitor exhausted CD8+ T cells and a pertinent contribution from AR as a direct transcriptional trans-activator of Tcf7/TCF1. The T cell intrinsic function of AR in promoting CD8+ T cell exhaustion in vivo was established using multiple approaches including loss-of-function studies with CD8-specific Ar knockout mice. Moreover, ablation of the androgen-AR axis rewires the tumor microenvironment to favor effector T cell differentiation and potentiates the efficacy of anti-PD-1 immune checkpoint blockade. Collectively, our findings highlight androgen-mediated promotion of CD8+ T cell dysfunction in cancer and imply broader opportunities for therapeutic development from understanding sex disparities in health and disease.
One Sentence Summary
Cell intrinsic AR signaling contributes to the male-biased susceptibility of CD8+ T cells to their functional exhaustion in the tumor microenvironment.
Introduction
Sex – as organized by the unequal composition and effects of sex chromosomes and gonadal hormones – is a biological variable with significant influence on immune function (1). However, the mechanisms underlying the sex-biased incidence and mortality of various cancers arising in non-reproductive organs remain elusive (2). While males are more prone to develop cancer in nearly every organ type, bladder cancer typifies this phenomenon with a striking 3- to 4-fold male-biased incidence globally that cannot be fully explained by established risk factors such as smoking, exposure to occupational hazards and urinary tract infections (3, 4).
The contribution of CD8+ T cell immunity to sex differences in tumor development and progression remains unclear. CD8+ T cells have an enormous potential to eliminate malignant cells based on their recognition of antigens distinct from those of normal cells by abundance or molecular structure. However, they often become exhausted in the tumor microenvironment upon persistent antigen stimulation, which is characterized by progressive loss of effector and proliferative potential, sustained expression of immune checkpoint receptors (e.g., PD-1, TIM3, LAG3) and a distinct transcriptional and epigenetic landscape (5, 6). Importantly, exhausted CD8+ T cells are phenotypically heterogeneous with varying degrees of functional defects (7–14). Defined by their relatively stem-like genetic profile with low to no expression of immune checkpoint receptors, CD8+ progenitor exhausted (PE) T cells have the potential to proliferate and give rise to effector-like CD8+ T cells, particularly in response to anti-PD-1 therapy (14–19). By contrast, terminally exhausted CD8+ T cells demonstrate high cytotoxic function, but they produce little or no effector cytokines upon re-stimulation, lack durability and are subject to rapid cell death mediated clearance (7, 8).
The tumor microenvironment contains cellular and molecular entities including immunosuppressive myeloid cells (20), CD4+ Foxp3+ regulatory T cells (21), inhibitory cytokines (e.g., IL-10/TGF-β) (22), immune checkpoint receptors and ligands (e.g., PD-1 and PD-L1) (23), and metabolic challenges (e.g., local nutrient competition) (24), that collectively promote T cell dysfunction. Pertinent contributions by sex hormones in T cell programming in the tumor microenvironment are poorly understood. Here, we describe sex differences in CD8+ T cell-mediated anti-tumor immunity and elucidate an underlying androgen-dependent mechanism of T cell exhaustion.
Results
CD8+ T cell immunity mediates sex differences in multiple pre-clinical cancer models
Upon ad libitum exposure to N-butyl-N-(4-hydroxybutyl) nitrosamine (BBN), a chemical carcinogen similar to those present in tobacco, mice reproducibly develop bladder cancer with similar histopathology and molecular aberrations as human bladder cancer (25, 26). The BBN model recapitulates the male-biased development and mortality of bladder cancer (27) even though its DNA mutation rates have been shown to be comparable between sexes (28), which suggests that males may have an increased cancer risk beyond carcinogen exposure and consequent transformation of the affected cells. Given the known immunogenicity of bladder cancer, we sought to address the contribution of adaptive immunity to sex bias. Consistent with earlier reports (25, 27), wild type (WT) females survived longer after BBN exposure (Fig. 1A). However, BBN-induced carcinogenesis was similar in kinetics between male and female mice that are deficient of T cells (Tcrb/Tcrd−/−) (Fig. 1A).
Fig 1. CD8+ T cell immunity mediates sex differences in murine bladder cancer aggression.

(A) BBN-induced carcinogenesis model. Mice were exposed ad libitum to 0.1% BBN in drinking water for the first 14 weeks to induce bladder cancer formation and then monitored for a total of 302 days. Percent survival, genotype/sex of each experimental group, and p values from the log rank test are shown. N = 13-20 mice per group. (B) MB49 tumor growth in mice with indicated genotypes. (C) Antibody-mediated depletion of CD4+ and/or CD8+ cells in mice challenged with MB49. (D) RT-PCR for qualitative detection of Actb and Y chromosome-encoded Sry gene transcripts from MB49 cells. DNA extracted from tails of male and female mice are included as controls. (E) Diagram representation of Four Core Genotype (FCG) mouse model. BKL171 was generated from a BBN-induced bladder tumor of a XXM FCG mouse. (F) BKL171 tumor growth in mice with indicated genotypes after subcutaneous implantation. Mean tumor area (mm2) ± SEM are reported, with statistical significance determined using the repeated measures two-way ANOVA. n = 4-10 mice per group. M, male; F, female; Ab, antibody; ns, not significant. *p ≤ 0.05, **p ≤ 0.01, ***p ≤ 0.001. p-values in A and F were corrected for multiple testing using the Bonferroni procedure.
Male-biased tumor burden has also been previously reported with the transplantable syngeneic bladder cancer cell line MB49 (29). We evaluated the pertinent role of adaptive immunity by comparing MB49 growth in male and female WT mice, as well as mice with a deficiency of T cells (Tcrb/Tcrd−/−), B cells (Ighm−/−) or both (Rag2−/−). We found that MB49 grew more aggressively in male versus female WT mice (Fig. 1B). However, sex differences in MB49 growth were eliminated in Rag2 and Tcrb/Tcrd, but not Ighm, knockout (KO) mice, suggesting that the sexual dimorphism is driven by endogenous anti-tumor T cell immunity (Fig. 1B). To evaluate the relative contributions from CD4+ and CD8+ T cells, we challenged WT mice with MB49 after CD4+ and/or CD8+ T cell antibody-mediated depletion. We found that tumor growth was comparable in male and female mice in the absence of CD8+, but not CD4+, T cells (Fig. 1C). While MB49 was generated through in vitro carcinogenesis of male mouse urothelial cells (30), enhanced immune responses in female mice are not due to H-Y minor histocompatibility antigens, as MB49 has lost the Y chromosome (31) and therefore lacks Sry (Fig. 1D), a gene involved in the male gonadogenesis located on the Y chromosome. Further, we utilized the Four Core Genotype model, which includes wild type XX females and XY males, as well as sex-reversed XX males (due to transgenic autosome expression of Sry) and XY females (due to Sry knockout) (27), to generate a BBN-induced bladder cancer cell line “BKL171” from an XX male (Fig. 1E). A clear male-biased tumor growth was also seen with BKL171 that was similarly dependent on T cell immunity, demonstrating that the sex-biased tumor growth is not the consequence of an alloresponse to Y chromosome-derived antigens by females (Fig. 1F).
We hypothesized that fundamental sex differences exist in the effector function of CD8+ tumor-infiltrating lymphocytes (TILs). Since immune phenotypes often correlate with the magnitude of tumor burden, we focused our analysis on Days 9 to 11 post tumor implantation, which coincided with the time of bifurcation in tumor growth curves for males and females (Fig. 1B) and would identify a sex-specific driver – not passenger – phenotype. We observed that the number and frequency of tumor-infiltrating (fig. S1, A to C) and peripheral (fig. S1, D to F) CD45+, CD4+ and CD8+ T cells are comparable between sexes. However, compared to female mice, male mice had an approximately two-fold lower frequency of polyfunctional CD8+ T cells that could produce interferon gamma (IFNγ), tumor necrosis factor alpha (TNFα) and granzyme B (GZMB) in Day 9 tumors, but not in spleens (Fig. 2A). Further, to directly compare the male and female T cells in their anti-tumor immunity, we isolated tumor-reactive CD8+ T cells from the draining lymph nodes of WT mice and adoptively transferred them into MB49-bearing Tcrb/Tcrd KO recipient mice (Fig. 2B). We observed inferiority of CD8+ TILs in controlling tumor growth in male versus female mice, particularly with the use of male donor T cells. Collectively, our findings using multiple murine cancer models highlight a previously unappreciated role for sex differences in T cell immunity that mediates male-biased tumor burden.
Fig 2. Superior effector function of tumor-infiltrating T cells in female mice underlies sex-biased cancer outcomes.

(A) Flow cytometric analysis of IFNγ, TNFα and GZMB expression in CD8+ T cells from the spleens and tumors (TILs) of male and female mice 9 days post subcutaneous MB49 challenge. Cells were stimulated ex vivo with 50 ng/mL PMA, 1 μg/mL Ionomycin and 1X Brefeldin A for 2 hours. Statistical significance was determined using Student’s t test. (B) Impact of donor and recipient sex on the adoptive transfer therapy of T cells. MB49 tumor growth in Tcrb/Tcrd KO mice post adoptive transfer on Day -1 with 5 x 10⁵ CD8+ T cells, which were prepared separately from the draining lymph nodes of Day 14 MB49 tumor in WT mice. Mean tumor area (mm2) ± SEM are reported, with statistical significance determined using the repeated measures two-way ANOVA. n = 4-10 mice per group. *p ≤ 0.05, **p ≤ 0.01, ***p ≤ 0.001.
Sex differences in CD8+ T cell dynamics at single-cell resolution in the tumor microenvironment
To better understand sex differences in CD8+ TILs, we performed single-cell RNA sequencing (scRNA-seq) on 26,698 CD8+ T cells that were FACS-sorted from Day 10 MB49 tumors (9,955 from female and 16,743 from male; n = 3 mice per sex). The shared nearest neighbor modularity optimization-based clustering algorithm resolved 11 major clusters of cells at various stages of CD8+ T cell differentiation (Fig. 3A, fig. S2, A and B, and table S1). Clusters 1, 2, 7 and 9 showed a male-biased frequency, comprising 43.4% of all cells in males in comparison to 25.0% in females (Fig. 3B). Consistent with the active anti-tumor immune response in this model, all but cell clusters 2 and 7 showed signs of activation via the T cell receptor (TCR), as marked by the expression of costimulatory receptors (Cd28, Icos, Il2ra), inhibitory surface receptors (Pdcd1, Havcr2, Lag3, Ctla4) and effector molecules (Ifng, Gzma, Gzmb). Clusters 2 and 7 were instead enriched for Tcf7, Sell, Bcl2, and ribosome products, which are suggestive of stem-like properties (14, 32). Clusters 3, 5 and 9 were distinguished by the expression of genes associated with active cell proliferation (Top2a, Mki67, histones, tubulins and mitochondrial maintenance (MCM) complex) and type I interferon (IFN) signaling, respectively. Tox was not enriched in any clusters at this time point, consistent with a lack of CD8+ T cell terminal differentiation in the early phase of tumor growth (33, 34). Notably, clusters 1 and 9 showed a striking sex difference in their gene expression pattern (Fig. 3C). They showed a male-biased expression of Tcf7, Sell, Bcl2 and Jun transcripts. By comparison, in females, these same clusters were enriched for costimulatory receptors (Icos and Tnfrsf9), inhibitory surface receptors (Pdcd1, Havcr2, Lag3 and Ctla4), effector molecules (Gzma and Gzmb), transcription factors (Hif1a and Id2), chemokines/cytokines (Ccl3, Ccl4 and Csf1) and migratory receptors (Ccr2 and Cxcr6).
Fig 3. Sex differences in CD8+ T cell immunity at single-cell resolution in the tumor microenvironment.

(A) Uniform Manifold Approximation and Projection (UMAP) of 26,698 CD8+ TIL (3 female mice – 9,955; 3 male mice – 16,743) scRNA-seq profiles, colored by cluster. Cells were sorted by FACS from Day 10 MB49 tumors. 9,955 cells are shown here for each sex for the purpose of easier visualization. Enclosed clusters 1, 2, 7 and 9 show male-biased frequencies as outlined in (B). (C) Summary of key CD8+ T cell genes that show sex-biased expression level in each cell cluster. Genes with Bonferroni-adjusted p-values ≤ 0.05 from the sex-based differential expression analyses using Wilcoxon rank-sum test were considered male (blue) or female (purple) biased depending on the directionality of their average log fold change. (D) Enrichment pattern of published PE and effector-like CD8+ T cell signatures (7). (E) Ontogeny inference. Slingshot algorithm was applied to order single cells in clusters 1, 2, 6, 7, 9 and 10 in pseudotime. Tcf7, Cd44, Gzmb, Prf1, Havcr2 and Pdcd1 expression levels in these clusters are indicated. (F) Quantification of pseudotime trajectories of male and female Tcf7+ CD8+ TILs from E. Statistical significance was determined using Wilcoxon rank-sum test. ****p ≤ 0.0001.
Tcf7+ clusters 2 and 7 were enriched for a known signature of PE versus effector-like CD8+ T cells (Fig. 3D) (7, 14). They were not naïve as evidenced by high expression of Cd44 and Cd69 (fig. S2B). Given that TCF1/Tcf7 plays a critical role in orchestrating a PE fate while antagonizing an effector program at the early stage of CD8+ T cell differentiation (35), we postulated that the male-biased Tcf7 gene expression in clusters 1 and 9 indicates an inflection at the stage male and female CD8+ T cells diverge to adopt a PE versus effector-like fate, respectively. To infer their ontogeny, we used the Slingshot algorithm to order single cells in clusters 1, 2, 6, 7, 9 and 10 in pseudotime (Fig. 3E) (36). This analysis revealed distinct trajectories of CD8+ TIL differentiation by sexes, in which male CD8+ T cells were more likely to be found in earlier pseudotime with Tcf7 expression (Fig. 3F). Consistently, male CD8+ T cells had a tendency to retain Tcf7 expression and were less efficient in acquiring Gzmb expression over the pseudotime trajectory (fig. S2C). These observations suggest that male and female CD8+ T cells are favored to adopt a PE versus effector fate, respectively.
Male bias in CD8+ progenitor exhausted T cell frequency in the tumor microenvironment
We next used high-dimensional spectral flow cytometry to validate and further investigate sex differences in CD8+ TIL fate before (Day 7), during (Day 10) and after (Day 13) the sex-based bifurcation in MB49 growth. By performing single-cell analyses with 26 key T cell markers and dimensional reduction with UMAP, we identified 16 major clusters of cells at various stages of CD8+ T cell differentiation (Fig. 4, A and B, fig. S3, A and B). On Day 7, the tumors were highly enriched with TCF1+BCL2+SLAMF6+CD62L+ cells in cluster 1, which are consistent with primed T cells that have just migrated into the tumor. By Days 10 and 13, there was a gradual accumulation of activated T cells in response to cognate tumor antigen recognition. Importantly, only cluster 2, which expressed TCF1, BCL2 and SLAMF6, showed the male-biased frequency that was most prominent on Day 7 but consistent throughout all examined time points (fig. S3A). The expression profile of cluster 2 from spectral flow cytometry closely resembled CD8+ PE T cells from the scRNA-seq analyses with the exception of Sell, which may result from the shedding of CD62L from the cell surface upon encountering cognate tumor antigen (37). By exclusively focusing on TCF1 and TOX expression in the CD44+CD62L− subset, we observed the male-biased frequency of TCF1+ cells, which later manifested as TOX+ cells (fig. S3C). Similarly, we noted a higher proportion of PE-associated protein expression in male versus female MC38 colon cancer and B16-F10 melanoma, both of which demonstrated a significant male-biased tumor growth (fig. S3, D and E). Using UCell, a robust single-cell gene signature scoring method (38), we also developed a protein-level PE signature based on markers that are collectively known to be more positively (TCF1, SLAMF6, BCL2, CD44, CD69) or negatively (CD62L, PD-1, LAG3, TIM3, CTLA4, TOX) expressed in PE cells compared to other CD8+ T cell phenotypes. The PE signature identified cluster 2 as the primary PE population (fig. S3F) and, consistent with our scRNA-seq results (Fig. 3, A to D), demonstrated a higher CD8+ PE TIL frequency in male versus female tumors (Fig. 4C). Of note, PD-1 is expressed at low levels in the cluster 2 PE cell population compared to activated CD8+ T cells. Overall, we conclude that the male tumor microenvironment favors the differentiation of CD8+TCF1+ PE T cells.
Fig 4. Male-biased CD8+ progenitor exhausted T cell frequency in the tumor microenvironment.

(A) UMAP of CD8+ TILs from MB49 tumors as assessed by spectral flow cytometry at indicated time points, colored by cluster. Enclosed cluster 2 shows a male-biased frequency as indicated. (B) Indicated protein expression on UMAP. (C) Percentage of the CD8+ TILs at indicated or all combined time points using the PE score, which was generated by UCell (38) based on protein-level expression of (TCF1, SLAMF6, BCL2, CD44, CD69) or (CD62L, PD-1, LAG3, TIM3, CTLA4, TOX) that are positively and negatively associated with PE cells, respectively. (D) MB49 growth in Rag2 KO mice that were adoptively transferred with 1.75 x 10³ TIM3−SLAMF6+CD8+ T cells from Day 12 MB49 tumors of WT mice. Tumor weights from Day 14 are reported. (E) Flow cytometric analysis of TIM3 and TCF1 expression in donor TILs. Statistical significance for % PE cells was determined by Wilcoxon rank-sum test. Remaining statistical significance was determined by Student’s t test. *p ≤ 0.05, **p ≤ 0.01, ***p ≤ 0.001. p-values in D and E were corrected for multiple testing using the Bonferroni procedure.
An important question is whether these CD44+CD62L−TCF1+CD8+ T cells indeed have the progenitor capacity to continue to differentiate within the tumor microenvironment. To address this question, we utilized an adoptive transfer model, in which we tracked the fate of these cells in Rag2 KO mice using SLAMF6 as a cell surface surrogate for TCF1 expression (7, 35) (Fig. 4D). Consistent with the literature, SLAMF6 expression in CD44+CD62L−TIM3−CD8+ T cells correlated well with TCF1 (fig. S3G). Similarly, we were able to detect a male-biased frequency of PE cells based on SLAMF6 and TIM3 expression alone (fig. S3H). Donor SLAMF6+TIM3−CD8+ TILs gave rise to TCF1−TIM3+ bona fide exhausted T cells that failed to respond to re-stimulation with PMA/ionomycin (fig. S3I), indicating a clear precursor-product relationship. Importantly, tumor control was worse in males after either male or female cells were adoptively transferred, and the frequency of these terminally exhausted T cells was higher in male versus female recipient tumors (Fig. 4, D and E). These findings suggest that a male-biased formation of CD8+ PE TILs eventually leads to more functionally exhausted T cells in male mice and contributes to poorer control of tumors in male versus female host. We sought to extend our analyses and assess whether a male bias in CD8+ T cell exhaustion was also present in human cancer. Following the same T cell state annotations as previously published, we observed a male-biased frequency of terminally exhausted CD8+ TILs in both BCC (39) (“CD8_Ex”; fig. S4A) and treatment-naïve NSCLC (40) (“CD8_C6-Layn”; fig. S4B).
Roles of androgen in mediating sex bias in T cell exhaustion
We used the Four Core Genotype mouse model to determine whether male-biased CD8+ T cell exhaustion is driven by sex chromosomes or sex hormones. We found that MB49 grew most aggressively in mice with high levels of testosterone regardless of sex chromosome compositions, suggesting that pertinent sex-specific differences in CD8+ T cell immunity are regulated by androgen (Fig. 5A). We next performed a series of surgical, genetic and pharmacological experiments to evaluate how disrupting the androgen-AR axis would affect tumor growth and intratumoral CD8+ T cell dynamics. First, we castrated male mice to decrease the levels of circulating testosterone. We observed that tumors grew less aggressively in male mice at three weeks post-surgical castration, a timepoint where testosterone levels were found to be the same as those in female mice (Fig. 5B). Principal component analyses (PCA) of spectral flow cytometry performed on CD8+ TILs in sham male, castrated male and sham female mice demonstrated that CD8+ T cells were distinct across groups, with the castrated male mice having an intermediate phenotype between those from sham male and female mice (Fig. 5C). Importantly, castrated male mice showed the decreased frequency of CD8+ PE T cells, to the level comparable to sham female mice (Fig. 5D). Further, we confirmed that enhanced tumor control in castrated mice was entirely dependent on intact CD8+ T cell immunity (Fig. 5E).
Fig 5. T cell intrinsic AR signaling contributes to male bias in tumor growth and accumulation of CD8+ progenitor exhausted T cells.
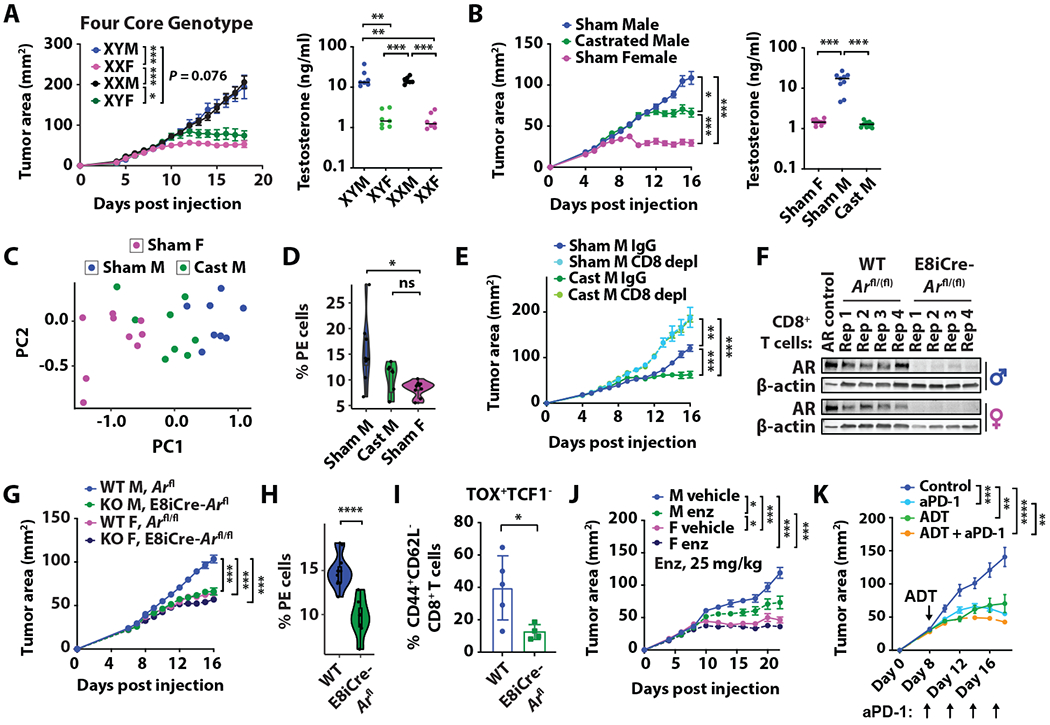
MB49 growth and circulating free testosterone levels in (A) Four Core Genotype or (B) WT mice three weeks post sham or surgical castration (cast). (C) PCA of spectral flow cytometry data on CD8+ TILs and (D) percentage of CD8+ PE T cells from B. (E) MB49 growth in castrated WT mice after intraperitoneal injection with IgG control or anti-mouse CD8 antibodies. depl, Depletion. (F) Immunoblot of AR and β-actin in stimulated CD8+ T cells from Arfl/(fl) control or E8iCre-Arfl/(fl) mouse spleens. LNCaP lysates were used as the positive AR control. Rep, replicate. (G) MB49 growth in Arfl/(fl) or E8iCre-Arfl/(fl) mice. (H-I) Percentage of male PE (H) and terminally exhausted (I) CD8+ T cells from G. (J) MB49 growth in WT mice after daily treatment of vehicle or enzalutamide (enz) starting on Day 5. (K) MB49 growth in WT mice with or without castration (ADT, androgen deprivation therapy) and anti-PD-1 antibodies at the indicated time points. For tumor growths, mean area (mm2) ± SEM are reported, with statistical significance determined using the repeated measures two-way ANOVA. n = 6–11 mice per group. Remaining statistical significance was determined by Student’s t test. *p ≤ 0.05, **p ≤ 0.01, ***p ≤ 0.001, ****p ≤ 0.0001. p-values in A, B, D, E, G, J and K were corrected for multiple testing using the Bonferroni procedure.
Second, we crossed E8i-Cre mice with Ar floxed mice to generate CD8+ T cell-specific AR KO mice. We confirmed that AR was expressed by CD8+ T cells in WT mice (Fig. 5F). Loss of CD8+ T cell intrinsic AR signaling resulted in greater tumor protection, to a similar extent as found in females (Fig. 5G). Consistent with differences observed between male and female CD8+ TILs, the frequencies of CD8+ PE (Fig. 5H) and TCF1−TOX+ exhausted (Fig. 5I) T cells were significantly reduced in the AR KO mice. Third, in vivo delivery of enzalutamide, an AR inhibitor, resulted in a partial protection against tumor growth in male mice (Fig. 5J). Collectively, all three strategies to block AR signaling in vivo highlight the critical role of androgen in driving the PE and ultimately exhausted phenotype of intratumoral CD8+ T cells and its consequence on tumor control. Interestingly, the anti-tumor efficacy of anti-PD-1 antibodies was greater with concurrent castration, even when the latter was performed well after initial tumor inoculation (Fig. 5K), which suggests that less T cell exhaustion from decreased androgen signaling sensitizes the host to a more effective immune checkpoint therapy.
Androgen signaling in CD8+ progenitor exhausted T cells
We so far demonstrated that there was a male-biased accumulation of PE CD8+ T cells that is driven by androgen and AR signaling. The next set of logical questions to address is if AR and its responsive genes are dynamically regulated during CD8+ T cell differentiation, and if so, whether AR and its target genes are preferentially expressed by PE cells. To this end, we analyzed CD8+ T cell transcriptomic data of our own as well as those that are publicly available. Upon analyzing scRNA-seq profiles of CD8+ TILs from MB49 (Fig. 6A) and lymphocytic choriomeningitis virus-specific CD8+ T cells (Fig. 6B) (35), we found that the Hallmark Androgen Response – but not Hallmark Early or Late Estrogen Response – from Molecular Signatures Database (MSigDB) was uniquely enriched in clusters with expression profiles that reflect the Tcf7+ PE state (table S2). Dbi, Myl12a, Sat1 and Tmem50a, which all belong to the androgen responsive gene set, were expressed higher in the PE versus effector-like subset (Fig. 6C). Further, androgen responsive genes had greater chromatin accessibility in progenitor versus terminally exhausted T cells (7) (Fig. 6D). Notably, we identified a negative correlation between CD8+ T cell intrinsic androgen and type I IFN gene signatures, the latter of which has been shown to repress TCF1 activity and inhibit the formation of CD8+ PE T cells (32, 41), in MB49 tumors, as well as human bladder cancer (BLCA) (42), basal cell carcinoma (BCC) (39) and non-small cell lung cancer (NSCLC) (40) (fig. S5). To address the mechanism underlying unique enrichment of androgen signaling in the PE subset, we investigated AR expression in CD8+ TILs in BBN-derived bladder tumors by multiplexed immunofluorescence imaging (Fig. 6E). We observed that AR was uniquely expressed in the TCF1+TIM3− subset of tumor-infiltrating CD8+ T cells (Fig. 6F). Similarly, Tcf7 mRNA levels in CD8+ TILs coincided with SLAMF6 protein expression and showed a male bias in the CD44+CD62L−PD-1+SLAMF6+ subset (Fig. 6G). We also observed that Ar mRNA levels decreased upon T cell activation, measuring highest in CD44+CD62L+ central memory cells and lowest in terminal exhausted CD44+CD62L−PD-1+SLAMF6− T cells (Fig. 6G). By comparison, Havcr2 mRNA (encoding TIM3) increased with T cell activation and exhaustion, while Isg15 (IFN responsive gene) decreased (Fig. 6G). Overall, our findings highlight the unique expression of AR and its signaling in CD8+ PE T cells.
Fig 6. AR signaling in CD8+ progenitor exhausted T cells.
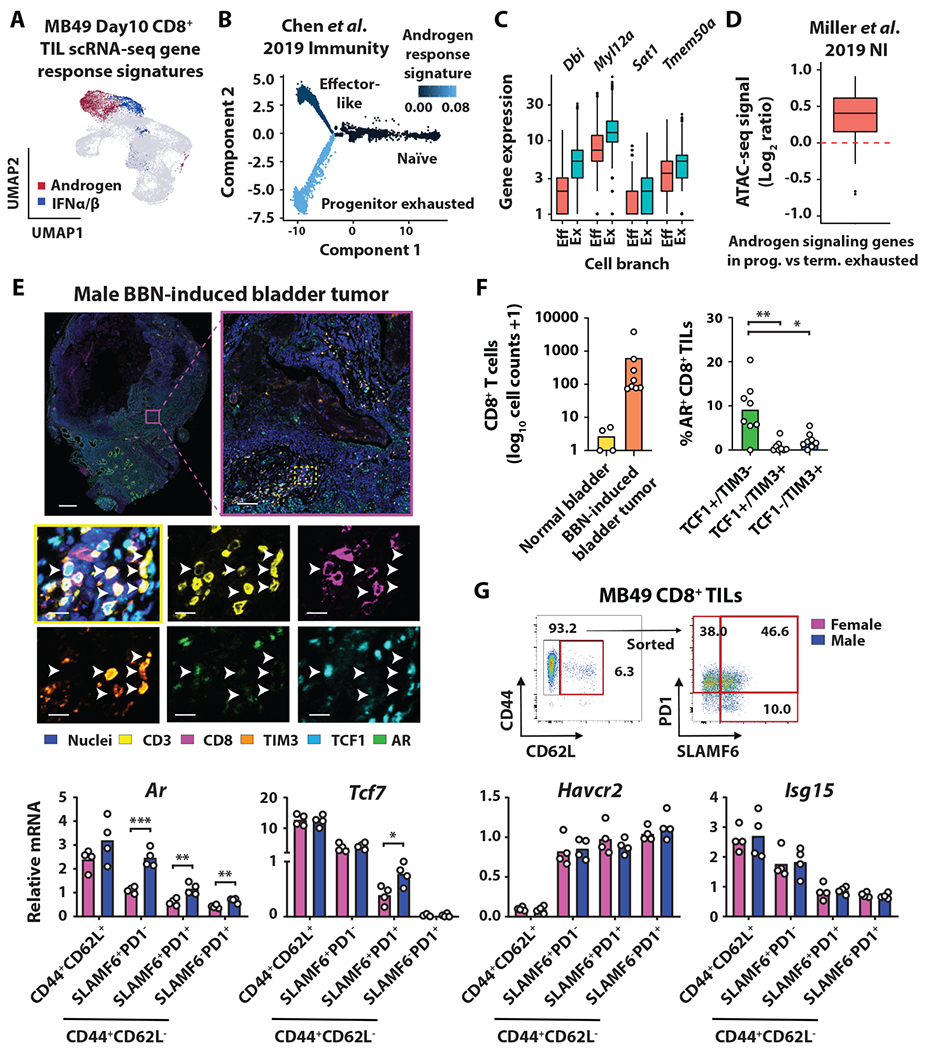
(A) Enrichment of androgen response (red) and type I IFN (blue) signatures in CD8+ TILs from Day 10 MB49 tumors. (B and C) Pseudotime analysis of lymphocytic choriomeningitis virus specific CD8+ T cells (35), as colored by the relative enrichment of androgen response signature. Boxplots indicate expression of androgen-responsive genes in effector-like (“Eff”) and progenitor exhausted (“Ex”) cells. (D) Log2-transformed ratio of ATAC-seq signals for androgen-responsive genes in progenitor (SLAMF6+TIM3−) over terminally (SLAMF6−TIM3+) exhausted CD8+ T cells (7). (E) Multiplexed immunofluorescent analysis of nuclei, CD3, CD8, TIM3, TCF1 and AR in BBN-induced bladder tumors collected from male mice at the time of sacrifice for morbidity. Scale bar, 1000 μm (top left), 100 μm (top right), 15 μm (bottom). (F) Quantification of CD8+ T cells in normal bladder versus tumor (left) and frequency of AR-expressing CD8+ T cell in the indicated cell subsets (right). (G) qPCR analysis of FACS-sorted CD8+ T cell subsets (red box) from Day 14 MB49 tumors. Statistical significance was determined by Student’s t test. *p ≤ 0.05, **p ≤ 0.01, ***p ≤ 0.001. p-values in F (right) were corrected for multiple testing using the Bonferroni procedure.
Androgen modulation of TCF1/Tcf7 centered transcriptional network
Given that a lack of androgen or AR in CD8+ T cells leads to a decreased proportion of CD8+ PE T cells, we hypothesized that AR regulates Tcf7 and the associated T cell exhaustion program. We applied IRIS3, a server we developed for cell-type-specific regulon inference from scRNA-seq data (43), to identify sex-specific transcriptional regulators of the Tcf7 gene module in CD8+ PE TILs using our scRNA-seq data (Fig. 7A). Among 10 identified transcription factors, Smarca5, Zbtb17, Zfp281, Zfp148 and Maz were uniquely seen in males, E2f6 and E2f3 in females, and Sp1, Sp2 and Sp3 in both sexes (Fig. 7B). All but Smarca5 (negative) and E2f6 (not significant) showed a positive correlation with Tcf7 expression across various stages of CD8+ PE TIL differentiation (Fig. 7C). Notably, all male-biased or shared transcription factors except Sp3 and Maz have confirmed androgen response elements (AREs) by chromatin immunoprecipitation (ChIP) (44) (Fig. 7B). How exactly these transcription factors mediate the immunological basis of sex bias warrants further investigation.
Fig 7. AR modulation of Tcf7 and its transcriptional network.
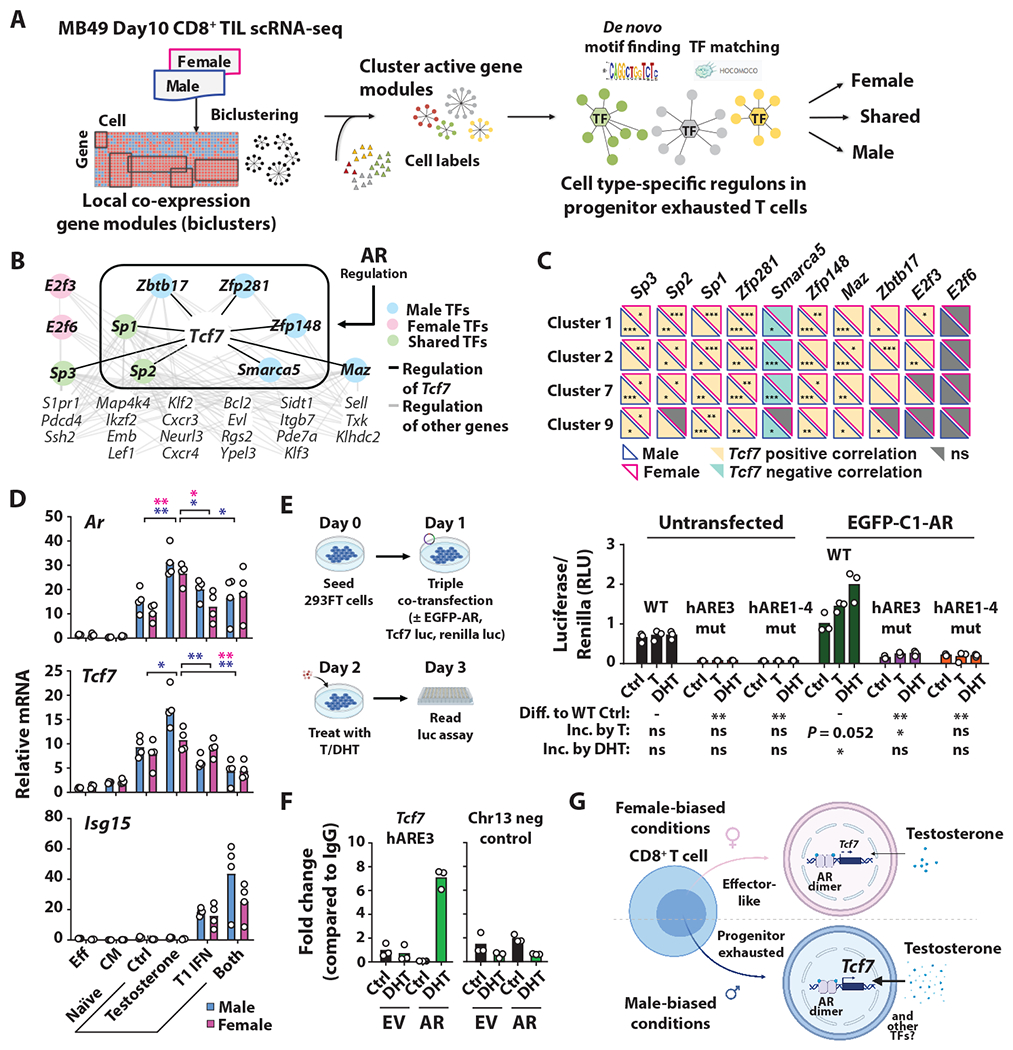
(A) Workflow of Integrated Cell-type-specific Regulon Inference Server from single-cell RNA-Seq (IRIS3). See methods for details. (B) Sex differences in Tcf7 centered regulon in the CD8+ PE TILs. Enclosed transcription factors have AREs within their respective promoters. (C) Correlation in expression between indicated transcription factors and Tcf7 in male-biased scRNA-seq clusters. (D) qPCR analysis of indicated genes in effector memory (“EFF”), central memory (“CM”) or naïve CD8+ T cells. Naïve CD8+ T cells were stimulated with testosterone, type I IFN or both for 6 hours. Blue, Male; Pink, Female. (E) Luciferase reporter assay. Renilla and Red Firefly luciferase activity, the latter of which was regulated by a 1 kb long WT or mutant Tcf7 promoter sequence lacking putative AREs (fig. S6A), were simultaneously measured in control or EGFP-C1-AR overexpressing HEK293FT post 24h stimulation with 500 ng/mL testosterone (T) or 50 nM DHT. (F) AR ChIP-qPCR of EV- and AR-Jurkats post 24h of 100 nM DHT stimulation compared to vehicle control. (G) Schematic representation of sex differences CD8+ T cell fate in the tumor microenvironment. Statistical significance was determined by Student’s t test. *p ≤ 0.05, **p ≤ 0.01, ***p ≤ 0.001.
In agreement with IRIS3 findings, acute testosterone exposure significantly increased Tcf7 in male CD8+ T cells, which was in turn blunted by type I IFN (Fig. 7D). The effect of testosterone between sexes was not secondary to a lack of androgen signaling in female cells given the induction of Ar expression (Fig. 7D). Interestingly, AR motif scanning identified 4 and 5 putative AREs within one kilobase of the promoter immediately upstream of the human and mouse Tcf7 transcriptional start sites, respectively (fig. S6A). We utilized a luciferase reporter assay to address if AR could directly regulate human Tcf7 transcription. Here, HEK293FT cells were co-transfected with an AR-expression vector and luciferase reporter plasmids whose expression was driven entirely by one kilobase WT or mutant Tcf7 promoter sequences lacking the putative AREs (Fig. 7E). We observed that testosterone and DHT stimulated Tcf7 promoter activity in an AR dependent manner (Fig. 7E). WT, but not promoter regions lacking either hARE3 or all AREs (hARE1–4), showed transcriptional activity in response to androgen (Fig. 7E, fig. S6, B and C). This conclusion was substantiated using a stable AR-overexpressing Jurkat cell line, a system frequently used to uncover new T cell biology (45) (fig. S7A). AR-overexpressing Jurkat cells showed decreased proliferation in response to prolonged testosterone or DHT stimulation, consistent with its proposed role in driving exhaustion (fig. S7B). Further, we performed ChIP-qPCR and found a near seven-fold increase in AR binding to the Tcf7 promoter at the hARE3 site compared to control only in the presence of androgen (Fig. 7F). Collectively, our findings highlight AR as a novel T cell intrinsic regulator of CD8+ T cell exhaustion, and it does so by transactivating Tcf7 and a sex-specific Tcf7-centered regulon in CD8+ PE T cells (Fig. 7G).
Discussion
Despite a clearly documented male bias in the incidence and mortality of various types of cancer, underlying biological mechanisms remain incompletely understood. The sporadic mechanistic studies on sexual dimorphisms in cancer have been largely focused on cancer genetics (46–50), epigenetics (27), and innate immunity (51). Whether there is a fundamental difference between male and female in the adaptive arm of immune surveillance such as CD8+ T cells is largely unknown. Here, we have gained new insights into the roles of AR in regulating CD8+ T cells in the tumor microenvironment. We have done so using multiple in vivo genetic models including the sex-reversed Four Core Genotype mice and CD8+ T cell-specific AR KO mice, coupled with single-cell transcriptomic analysis of tumor-infiltrating CD8+ T cells, high dimensional flow cytometry and other assays. Our work highlights critical sex differences in CD8+ T cell-mediated anti-tumor immunity. We show that AR directly regulates Tcf7, a critical transcription factor involved in the early fate decisions of activated CD8+ T cells, and its signaling mediates a sex-biased formation of the TCF1+CD8+ PE subset and impaired control of tumor growth. Given the increasing recognition of immune evasion in oncogenesis and the central roles of CD8+ T cells in mediating anti-cancer immunity, our findings raise the possibility that AR-mediated predisposition for CD8+ T cell exhaustion interferes with the elimination of nascent immunogenic malignant cells and contributes to a male bias in both cancer incidence and mortality.
The PD-1LowTCF1+CD8+ PE subset analyzed in this study lacks expression of TIM3 and other checkpoint receptors, which have been previously referred to as a “memory-precursor-like” subset (14). They are presumably at an earlier phase of differentiation compared to CD8+ PE TILs with greater checkpoint receptor expression but are not naïve given their high Cd44 and Cd69 expression. Varying levels of PD-1 expression in CD8+ PE T cells may be a consequence of different experimental tumor models and inconsistent timings of sample collections and analyses. It has been previously shown that the PD-1LowTCF1+CD8+ PE subset contains tumor-antigen specificity with the capacity to sustain long-lasting immunity, especially in response to immune checkpoint blockade (14). Their male-biased frequency, which was regulated by cell-intrinsic AR signaling, is consistent with the notion that men benefit more from immune checkpoint blockade (52, 53). However, as the male-biased predisposition for exhaustion extends beyond the initial level of PE T cell formation, one could also posit that men may experience a worse outcome in some settings. Indeed, our finding that androgen deprivation therapy (ADT) potentiated the efficacy of anti-PD-1 immune checkpoint blockade is more consistent with the latter possibility. Undoubtedly, further molecular studies are needed to clarify the roles of the androgen-AR axis in CD8+ T cell differentiation along the exhaustion trajectory, particularly with regards to mechanisms underlying dynamic AR expression and its downstream function, and the general utility of ADT in enhancing responsiveness of immune checkpoint blockers. During the review process of our current work, another study of patients with metastatic castration-resistant prostate cancer with varying response rates to enzalutamide and pembrolizumab was published, which showed evidence of an inhibitory role for T cell-intrinsic AR signaling in checkpoint blockade efficacy via direct suppression of IFNG (54). Despite the fundamental differences in approach and proposed underlying AR-driven mechanism, the two studies complement each other and suggest future research directions for the field on AR as a critical regulator of tumor immunity.
Androgens have been implicated in the development of bladder (25, 55) and other types of malignancies (56). While androgen is considered immunosuppressive for its inhibition of T cell intrathymic development, tissue-specific infiltration and effector differentiation (57–62), its impact on intratumoral CD8+ T cell differentiation and exhaustion has not been previously uncovered. We show for the first time that androgen signaling directly regulates Tcf7 and steers CD8+ TILs to exhaustion in a T cell-intrinsic fashion. It is striking that loss of AR in CD8+ T cells alone rendered male mice equally protected against cancer as female mice. Interestingly, we observed that type I IFN signaling is enriched in the PE subset and antagonizes androgen activity in regulating Tcf7. In light of a well-established female bias in the IFN response at baseline and upon active inflammation (63), a sex-specific balance of androgen and type I IFN signaling may underlie sexual dimorphism in cancer immunity. Regulation of AR signaling, its molecular targets, and its interaction with type I IFN in CD8+ TILs warrant further investigation.
Finally, while our study focused on CD8+ T cell immunity, sex differences in the unique developmental program of CD4+ T cells, effector CD4+ T cells in particular, may also be a fruitful area of investigation, since they have been shown to mediate a critical cytotoxic role in human bladder cancer (42). Similarly, more studies are needed in the areas of innate immunity (1) and B cell responses (64) to further understand the immunological basis of sex bias in cancer so that non-sex neutral therapeutic approaches may be discovered to improve precision medicine and cancer outcomes.
Materials and Methods
Study design
The aim of this study was to uncover the role of CD8+ T cells in mediating sex differences in tumor progression and highlight a pertinent contribution of androgen receptor (AR) signaling in a CD8+ T cell differentiation program within the tumor microenvironment. We utilized a multi-omics approach to investigate CD8+ T cell immunity in several preclinical tumor models, and used surgical, genetic and pharmacological perturbation of AR signaling. All experiments used randomly assigned mice without investigator blinding. All data points and n values reflect biological replicates, unless indicated otherwise in scRNA-seq analyses. Raw data are available in table S4.
Mice
C57BL/6 (WT; Stock number 000664), C57BL/6 Rag2−/− (008449), Tcrb/Tcrd−/− (002122), Ighm−/− (002288), Four Core Genotype (FCG) (27) (010905) and E8I-Cre (008766) mice were obtained from Jackson Labs. Arflox/flox mice were a gift from the laboratory of Dr. Xue Sean Li from Cedars-Sinai and were bred with the E8I-Cre mice to knockout AR within CD8+ T cells. FCG model involves manipulation of the Sry gene to create the following four “core” genotypes that can be used to investigate the contribution of sex chromosome complement and gonadal hormones to a given phenotype: XX (“XXF”), XY− (“XYF”), XXSry (“XXM”) and XY−Sry (“XYM”) (65). 5-12 weeks old mice, maintained in a specific pathogen-free environment, were used for experiments. Experimental protocols that involved FCG mice were approved by the Institutional Animal Care and Use Committee (IACUC) at Boston Children’s Hospital. All remaining experiments were conducted under IACUC protocols approved by the Medical University of South Carolina and the Ohio State University.
Tumor model
To induce bladder carcinogenesis, male and female WT and Tcrb/Tcrd knockout or FCG C57BL/6 mice were fed ad libitum with 0.1% BBN (TCI America) water for 14 weeks and then switched to normal water. All mice were monitored daily for morbidity (i.e. palpable tumor/abdominal swelling, hunched posture and urine staining around the perineum). If mice survived the 40-weeks-long regimen, they were considered as censored from the Kaplan-Meier survival curve analysis. BKL171 was derived from the bladder tumor of an XXM FCG mouse at the end of a 40-weeks-long BBN regimen.
MB49 (a gift from C. Voelkel-Johnson from the Medical University of South Carolina) and BKL171 mouse urothelial carcinoma cells were cultured in Dulbecco’s Modified Eagle’s Medium with 10% heat-inactivated fetal bovine serum and 1% penicillin/streptomycin. 5 x 10⁵ tumor cells were resuspended in 100 μL ice cold PBS for subcutaneous injection into the right flank of a mouse. For antibody-mediated T cell depletion experiments, mice were injected intraperitoneally with 200 μg of anti-mouse CD4 (Clone GK1.5, BioXCell) and/or CD8 depleting antibodies (Clone 53-6.7, BioXCell), followed by 100 μg thereafter on the indicated days. For experiments involving enzalutamide, mice were treated daily with either vehicle control or enzalutamide (25 mg/kg) in 1% carboxymethylcellulose with 0.1% Tween 80 and 2.5% DMSO through oral gavage starting on Day 5 post MB49 subcutaneous injection. For experiments involving PD-1 blockade, mice were treated with anti-PD-1 antibody (Clone 29F.1A12, 100 μg) as indicated. Tumor surface area (width x length mm2) was measured using an electronic caliper starting 4-8 days post implantation.
Castration
To evaluate the contribution of androgen levels to tumor cell growth, male mice underwent surgical castration. Conditions described below, with the exception of gonadal removal, were also applied to both male and female mice to serve as sham controls. Briefly, aseptic techniques were used for all surgeries and mice were maintained under a sterile field. Mice were anesthetized with isoflurane, placed on a heating pad, given an ophthalmic lubricant to prevent corneal drying, and administered standard formula buprenorphine. Pain relief was also provided through use of Motrin-supplemented water for 72 hours. Two to three mm bilateral incisions were made in the scrotum and the dartos fascia dissected to reveal the testes. After mobilization of the testes from the scrotum, the spermatic cord was cauterized and the scrotum closed using surgical tissue glue (Vetbond tissue adhesive, 3M). Mice were monitored daily for 3 days post-op and 2-3 times a week thereafter. Castration was performed three weeks before (Fig. 5, B and E) or 8 days (Fig. 5K) after the mice were subcutaneously injected with the MB49 cell line.
Testosterone levels
Circulating free testosterone levels were analyzed in FCG and C57BL/6 mice at 7 and 10 weeks old, respectively. For FCG mice, blood was collected via submandibular vein using 1.5 mL Eppendorf tubes coated with EDTA. Plasma testosterone concentration was determined using a testosterone ELISA kit from Enzo Life Sciences (ADI-901-065) according to the manufacturer’s recommendations. Blood was also collected via submandibular vein for C57BL/6 mice. Here, one mL K3EDTA-coated MiniCollect (Greiner Bio-one, 450474) tubes were used to collect the blood and an ELISA kit from R&D Systems (KGE010) was used to measure testosterone levels according to manufacturer’s recommendations.
Multispectral immunofluorescence
At the terminal timepoint for male BBN-induced bladder cancer specimens described in the ‘Tumor models’ section, tumor-containing bladders were removed, alongside untreated normal bladder, fixed in 10% neutral buffered formalin (NBF, ThermoScientific, 5701) for 24 hours, transferred to 70% ethanol, and submitted to the Comparative Pathology and Mouse Phenotyping core at OSU for paraffin embedding. For multispectral immunofluorescence staining, four- to five-micron sections were deparaffinized with xylene and rehydrated with graded alcohol incubations. Pressurized antigen retrieval (Leica, AR9640) was performed at 125°C for 1 min (Cuisinart, 574532315), followed by depressurization for 20 min and an additional 30 min for cooling. Slides were then incubated in a series of permeabilization and blocking steps that consisted of 0.1% Tween 20 (RPI, P20370) in 1x TBS (BioRad, 1706435) for 20 min, 0.3% Triton X100 (RPI, 111036) and 5% goat serum (Millipore, S26-LITER) in 1x TBS for 60 min, and 3% hydrogen peroxide (H2O2, Fisher, H325-100) for 8 min. Primary antibodies were incubated in an antibody diluent/block (Akoya, ARD1001EA) for 60 min in the following order, TIM3 (Cell Signaling, 83882) at 1:500 followed by Opal620 (Akoya, FP1495001KT) at 1:200 for 10 min, CD8 (Cell Signaling, 98941) at 1:500 followed by Opal480 (Akoya, FP1500001KT) at 1:250 for 6 min, AR (Abcam, ab108341) at 1:200 followed by Opal570 (Akoya, FP1488001KT) at 1:200 for 10 min, TCF1 (Cell Signaling, 2203) at 1:500 followed by Opal690 (Akoya, FP1497001KT) at 1:200 for 10 min, and CD3 (Epredia, RM-9107) at 1:500 followed by Opal520 (Akoya, FP1487001KT) at 1:250 for 6 min. Anti-rabbit HRP-conjugated secondary antibodies (Leica, PV6119) were used to attach the fluorophores to the tissue. Fluorophores were incubated on each slide using an amplification buffer (Akoya, FP1498) for the indicated times and concentrations. Use of the pressurized antigen retrieval method described above, as well as an incubation step with 3% H2O2 for 5 min, was used to strip antibodies and quench any remaining peroxidase activity, respectively, between each set of primary, secondary, and fluorophore incubations. An unstained slide was included to detect autofluorescence of each fluorophore, and a set of six slides were used as drop out controls to ensure proper stripping occurred between each fluorophore conjugation. Finally, spectral DAPI (Akoya, SKU FP1490) was applied according to manufacturer’s recommendations and slides coverslipped using SlowFade Gold antifade mounting media (Invitrogen, S36937).
The multispectral images were captured at 20X magnification using the Vectra Polaris imaging system. Briefly, an imaging protocol for each fluorophore was created to obtain the best signal below the saturation limit for whole slide scanning. In addition, the autofluorescence signal was captured for each fluorophore. This imaging protocol was used to scan all slides in the study. Images were normalized and signal-to-noise ratios were tested for each fluorophore. Whole tissue section images were annotated and imported into the inForm software (Akoya, V2.5) for further analyses. First, images were annotated for biomarkers and fluorophores. The autofluorescence signal was isolated and the multiplexed fluorescence signals were unmixed. The inForm software allows development of machine learning-based segmentation of tissues categories and segmentation of cells. Unmixed image sections were sampled to make the training set for image processing and phenotyping algorithms. This training set was used to develop a pipeline for segmenting cells and phenotyping each biomarker. The algorithms were applied to all images for batch analyses. The resulting data was further analyzed using the phenoptr package (Akoya, V0.3.1) and R (V4.1.2)-programming to identify and quantify marker combination as shown in Fig. 6, E and F.
Flow cytometry
Mouse spleens and tumors were mechanically disrupted, with the latter additionally subjected to digestion with 1 mg/mL Collagenase D (Roche) for 30 min at 37°C while shaken at 125 rpm. Excess volume of ice-cold PBS with 2% bovine serum albumin was used to inactivate the enzymatic activity. Red Blood Cell Lysis Buffer (BioLegend) was utilized on tissues before they were passed through 70 μm filters to prepare single cell suspensions. For cytokine production experiments, cells were re-stimulated by 50 ng/mL PMA (Sigma), 1 μg/mL Ionomycin (Sigma) and 1X Brefeldin A (BioLegend) in a 48-well plate for 2 hours at 37°C. For in vitro cultures, purified CD8+ T cells were left untreated or stimulated with 50 ng/mL testosterone (Sigma) and/or 50 U/mL mouse IFN alpha A (PBL Assay Science). Cells were stained at 4°C with eFluor506 fixable viability dye for 10 minutes (Invitrogen), followed by extracellular surface markers and FcR block concurrently for 30 minutes. All intracellular staining was performed using the Foxp3 transcription factor staining kit (Invitrogen) according to the manufacturer’s instructions. All samples were acquired on LSRFortessa or Cytek Aurora high-dimensional flow cytometers. All fluorochrome-conjugated antibodies are listed in table S3, in addition to the following cytokines TNFα (MP6-XT22) and IFNγ (XMG1.2).
Conventional flow cytometry data were analyzed on FlowJo. For spectral flow cytometry data, live CD45+CD11b−NK1.1−CD4−CD8+CD3+ singlets were gated using OMIQ and subsequently imported into R (V4.1.1) for all further analyses. To facilitate visualization of marker expression patterns, we mapped cells to a two-dimensional embedding using the UMAP algorithm (66). We then used PCA to visualize similarity among samples. We implemented the standard FlowSOM workflow (67) to cluster cells based on all markers simultaneously using the R package FlowSOM (V2.1.24). The number of clusters used in the meta-clustering of cells was chosen based on elbow criterion. We utilized the UCell package (V1.1.0) (38) to derive PE signature scores based on high (TCF1, SLAMF6, BCL2, CD44, CD69) and low (CD62L, PD-1, LAG3, TIM3, CTLA4, TOX) expression.
Adoptive Transfer
CD8+ T cells were isolated by MACS (Miltenyi Biotec) from draining inguinal lymph nodes of MB49 bearing male and female mice 14 days post implantation (Fig. 2B). Alternatively, they were isolated by FACS from Day 12 MB49 TILs in male and female mice based on TIM3−SLAMF6+ surface expression (Fig. 4D). Donor cells were intravenously administered into immunodeficient mice (Tcrb/Tcrd KO in Fig. 2B; Rag2 KO in Fig. 4D). Recipient mice were injected with MB49 tumors at indicated time points and monitored for tumor growth.
Single-cell RNA sequencing
Six-week-old WT male and female C57BL/6 mice were inoculated subcutaneously with 5 x 105 MB49 tumor cells. On Day 10 post inoculation, single cell suspensions were prepared from the tumors after mechanical disruption and enzymatic digestion with 1 mg/mL Type IV Collagenase (Roche). Live tumor-infiltrating CD8+ T cells (CD3+ CD8+ CD4−) were sorted on a BD FACSAria Ilu Cell Sorter and immediately processed for scRNA-seq. Experimental procedures for scRNA-seq followed established techniques using the Chromium Single Cell 3’ Library V3 Kit (10x Genomics). Briefly, FACS-sorted CD8+ T cells were loaded onto a 10X Genomics Chip A and emulsified with 3’ Single Cell GEM beads using a Chromium™ Controller. Libraries were constructed from the barcoded cDNAs (Translational Science Laboratory at the Medical University of South Carolina) and sequenced for approximately 300 million reads/sample on a NovaSeq S4 flow cell (Illumina) at the VANTAGE facility (Vanderbilt University Medical Center).
scRNA-seq data analysis
Using the Cell Ranger software, we converted BCL files into FASTQ files, trimmed adapters and primer sequences, mapped reads to the mm10 reference genome, and quantified expression levels. In this step, to eliminate low-quality and dying cells, we filtered out cells with counts less than 200 and those with >5% mitochondrial counts. Then, we used the Seurat software (68) for the downstream analysis, based on the count data obtained from Cell Ranger. Specifically, we normalized counts using the LogNormalize approach, visualized cells in a low-dimensional space using the UMAP algorithm, and determined cell clusters using the Louvain graph clustering algorithm. This process resulted in identification of 11 cell clusters. Then, we identified cell type markers conserved between males and females for each cell cluster and also the genes that are differentially expressed (DE) between males and females using a Wilcoxon Rank Sum test, and adjusted DE p values for multiple testing using the Bonferroni correction. For the pseudotime analysis, we used the Slingshot software (69) with the Seurat-processed data for the cell clusters 1, 2, 6, 7, 9, and 10. Gene set enrichment analyses were implemented using the hypergeometric test with the Kyoto Encyclopedia of Genes and Genomes (KEGG) gene sets obtained from the MSigDB (https://www.gsea-msigdb.org/gsea/msigdb/index.jsp). For the sex-biased gene expression heatmap, we first checked DE between males and females for each gene based on Bonferroni-adjusted p-values and visualized directions of sex bias based on corresponding log fold changes. For the relative cluster enrichment heatmap, we first checked whether each corresponds to a marker conserved between males and females based on Bonferroni-adjusted p-values, and visualized directions of enrichment based on corresponding log fold changes.
Secondary analysis of single-cell RNA-seq data
We implemented secondary analyses of single-cell RNA-seq data obtained from previously published research. For Guo et al. (40), we downloaded the count data from the GEO database with the accession number GSE99254 and selected only the cells corresponding to the CD8+ T cells from tumors. For Yost et al. (39), we downloaded the count data for BCC from the GEO database with the accession number GSE123813, and we selected only the cells corresponding to CD8+ T cells and pre-treatment. Then, for both datasets, we used the Seurat analysis workflow described in “Single-cell RNA-seq data analysis”. For Chen et al. (35), we downloaded the count data from the GEO database with the accession number GSE131535. Then, we used the Monocle 2 analysis workflow described in “Single-cell RNA-seq data analysis”. For Oh et al. (42), we downloaded the count data from the GEO database with the accession number GSE149652 and further selected the cells corresponding to CD8+ T cells from Anti-PD-L1-treated human bladder cancer. Then, for each of males and females, we calculated Pearson correlation coefficients between genes annotated for “HALLMARK_ANDROGEN_RESPONSE” and those annotated for “HALLMARK_INTERFERON_ALPHA_RESPONSE” gene sets in the mSigDB database (70).
Secondary analysis of bulk ATAC-seq data
We implemented the secondary analysis of bulk ATAC-seq data obtained from Miller et al. (7). Specifically, we downloaded the peak calling results from the GEO database with the accession number GSE122713, where reads were mapped using Bowtie2 (71) and peak calling was performed using MACS2 (72). We annotated these peaks using HOMER (73) and extracted the counts corresponding to promoter regions (annotated as “promoter-TSS”) of the genes annotated for the “HALLMARK_ANDROGEN_RESPONSE” gene set in the mSigDB database (70). Finally, we calculated the log2-transformed ratios of Slamf6+Tim3−GP33 Tetramer+CD44+PD-1+ CD8+ T cells over Slamf6−Tim3+GP33 Tetramer+CD44+PD-1+CD8+ T cells from LCMV-infected mice.
RNA Isolation and qPCR analysis
RNA was extracted from FACS/MACS-isolated CD8+ T cells and reverse-transcribed using RNeasy Micro Kit (Qiagen) and SuperScript™ IV VILO™ Master Mix with ezDNase™ Enzyme (ThermoFisher Scientific), respectively. Quantitative PCR was performed with the following primers:
Ar: forward, 5’-TCCAAGACCTATCGAGGAGCG-3’
reverse, 5’-GTGGGCTTGAGGAGAACCAT-3’
Tcf7: forward, 5’-CCACTCTACGAACATTTCAGCA-3’
reverse, 5’-ACTGGGCCAGCTCACAGTA-3’
Havcr2: forward, 5’-TCAGGTCTTACCCTCAACTGTG-3’
reverse, 5’-GGCATTCTTACCAACCTCAAACA-3’
Isg15: forward, 5’-GGTGTCCGTGACTAACTCCAT-3’
reverse, 5’-CTGTACCACTAGCATCACTGTG-3’
β-actin: forward, 5’-AGCTGAGAGGGAAATCGTGC-3
reverse, 5’-TCCAGGGAGGAAGAGGATGC-3’
Sry (Set 1): forward, 5’-TTGTCTAGAGAGCATGGAGGGCCATGTCAA-3’
reverse, 5’-CCACTCCTCTGTGACACTTTAGCCCTCCGA-3’
Sry (Set 2): forward, 5’-TGGGACTGGTGACAATTGTC-3’
reverse, 5’-GAGTACAGGTGTGCAGCTCT-3’
De novo AR motif prediction in Tcf7 promoter
AR motifs were predicted from human (Chr 5: 3971-4970, NCBI seq: NG_030367.1) and mouse (Chr 11: 52283015-52284014, NCBI seq: NC_000077.6) Tcf7 promoter sequences located within one kilobase (kb) upstream from the transcriptional start sites. The following AREs, AGAACAnnnAGTACT and AGAACAnnnAGTGCT (74), were scanned via Motif Alignment and Search Tool (MAST) at a positional p value of < 0.005 (75).
Luciferase reporter assays
WT or mutated human Tcf7 promoter sequence of one kb upstream from its transcriptional start site was cloned into the pMCS-Red Firefly Luciferase vector (Thermo Fisher). Mutants lacked individual (“Mut 1-4”) or all putative AR binding sites. Briefly, 40,000 HEK293FT cells were grown on a 96 well plate at 80% confluence. Cells were transfected with 200 ng of pEGFP-C1-human AR (a gift from Michael Mancini, Addgene plasmid #28235) (76) and indicated Tcf7 luciferase reporter plasmids using Lipofectamine 2000 (Thermo Fisher) on Day 0 in triplicates. Renilla luciferase gene expression was used to ensure transfection efficiency (Thermo Fisher). Twenty four hours after transfection, cells were treated with 500 ng/ml testosterone or 50 nM DHT for another 24 hours. Cells were then harvested and luciferase activity was analyzed by using Dual-Luciferase Reporter Assay System (Promega).
Generation of AR-expressing Jurkat cells
AR lentiviral expression plasmid (a gift from Karl-Henning Kalland, Addgene #85128) (77) was clonally selected alongside empty vector control (a gift from Jan Rehwinkel, Addgene #120848) and maxi-prepped (Qiagen) from bacterial streaked ampicillin containing agar plates (Invitrogen). Lentivirus was generated using HEK239FT cells and virus-containing media was filtered (Sigma, SE1M003M00) and concentrated (Takara, 631231) before being used to infect the Jurkat cell line (ATCC, TIB-152) in the presence of 1 μg/ml polybrene (Sigma). After 48 hours, infected cells were selected using 4 μg blasticidin (Gibco) for 10 days.
Western analysis
All cells were lysed using RIPA (Thermo Fisher) buffer plus protease and phosphatase inhibitors (Thermo Fisher). Equal amounts of protein were separated on SDS polyacrylamide gels (BioRad) and transferred to PVDF membranes (Millipore). Antibodies used for immunoblot analyses were against AR (Abcam, ab108341) and β-actin (Abcam, ab8226). Secondary antibodies included anti-rabbit DyLight800 IgG (Cell Signaling, 5151) and anti-mouse DyLight680 IgG (Cell Signaling, 5470).
To collect enough protein lysate for immunoblot analyses, spleens from WT ARfl/(fl) and E8iCre-ARfl/(fl) mice were mechanically homogenized, incubated with a red cell lysis buffer (Biolend, 420302) and passed through 70 micron filters. CD8+ T cells were isolated using a mouse CD8 isolation kit (Stemcell, 19853) according to manufacturer’s recommendations. Splenocytes were then stimulated using plate-bound 5 μg/mL CD3 (BioLegend, 100359) and 2 μg/mL CD28 (BioLegend, 102121) plus 40 ng/mL IL2 (NIH) for 72 hours. Afterwards, cells were washed and expanded in the presence of 40 ng/mL IL2 for another 72 hours before they were pelleted and lysed for immunoblot analyses.
Proliferation assay
Empty vector and androgen receptor-expressing Jurkat cells were seeded into six well plates (Gibco) at 2 x 10⁵ cells per well and treated with 100 nM testosterone (Sigma) or DHT (Millipore), alongside methanol vehicle control (Thermo Fisher). Every three days, cells were counted using the BioRad TC20 automated cell counter, passaged, and re-stimulated with the same androgen concentrations over a time course of 3, 6, and 9 days.
ChIP-qPCR
Empty vector and androgen receptor-expressing Jurkat cells were treated with 100 nM testosterone, 100 nM DHT or methanol vehicle control for 24 hours before being subjected to chromatin immunoprecipitation (IP) similar to previously published methods (78). Briefly, 1 x 10⁷ cells were fixed with formaldehyde, quenched with glycine, washed, and sonicated using the Covaris E220 Evolution sonicator (peak power: 140, duty factor: 5, cycles/burst: 200, average power: 7) for 16 min. Cleared nuclear extracts were incubated with either AR (Abcam, ab108341) or species-matched IgG (Cell Signaling, 3900) pre-coupled magnetic protein A beads (Thermo Fisher) and rotated overnight at 4°C. Beads were washed with low salt (0.1% SDS, 1% Triton X-100, 2 mM EDTA, 150 mM NaCl, 20 mM Tris-HCl, pH 8.0), high salt (0.1% SDS, 1% Triton X-100, 2 mM EDTA, 500 mM NaCl, 20 mM Tris-HCl, pH 8.0), LiCl (0.25 M LiCl, 1% NP-40, 1% DOC, 1 mM EDTA, 10 mM Tris-HCl, pH 8.0) and TE (Invitrogen) wash buffers before protein and DNA were eluted with freshly prepared sodium bicarbonate buffer (1% SDS, 100 mM NaHCO3) at 55°C. Samples were then incubated with proteinase K (Thermo Fisher) overnight at 55°C and DNA was purified using a PCR cleanup column (Qiagen) according to manufacturer’s recommendations.
Quantitative PCR was performed using the IQ SYBR Green Supermix (BioRad) and amplification was conducted using the StepOnePlus Real-Time PCR System (Applied Biosystems) with the following primers:
hDNase NC2-chr13: forward, 5’-GGCACATACCCATTTGTCCCAACA-3’
reverse, 5’-GACAAAGGTGTCAAGAACACACAATGGG-3’
hTcf7 hAR_3: forward, 5’-GTACGAGCACAGCCTCAAG-3’
reverse, 5’-GCCGTGGTGTGAACTGTAT-3’
Percent input DNA was normalized to the corresponding species-matched IgG controls.
Integrated cell-type-specific Regulon Inference Server 3 (IRIS3) Analysis
In order to computationally identify potential transcription factors (TFs) that regulate Tcf7 expression in CD8+ TILs from male and female mice, we applied IRIS3 (43), an integrated web server for cell-type-specific regulon (CTSR) prediction, on our scRNA-seq data. Briefly, IRIS3 workflow includes five steps: (i) cell cluster prediction, (ii) functional co-expressed gene module detection, (iii) cell cluster active gene module determination, (iv) de novo motif finding, and (v) TF matching and CTSR determination. We reasoned that CTSRs could build reliable constructions of global transcriptional regulatory networks encoded in a specific cell type and provide insight into underlying regulatory mechanisms. Specifically, the male and female datasets were analyzed separately via IRIS3, with the “bicluster overlap rate” parameter at 0.6 and all other parameters as default. We directly used the cell cluster labels determined in the previous step to ensure the consistency. For each predicted CTSR, we considered all significantly matched TFs in the motif comparison result (using TOMTOM (79)) and HOCOMOCO database (80) as potential regulators, rather than only the top TF described in the IRIS3 tutorial. For the progenitor T cell cluster, genes among CTSRs were then merged based on the corresponding TF. Male-specific, female-specific and shared TFs were determined by comparing the corresponding TFs in male and female data. Gene regulatory networks were constructed to indicate the predicted TF-gene regulatory relations via Cytoscape (81).
Statistical analysis
Tumor growth was analyzed by a repeated measures two-way ANOVA. Overall survival was visualized using Kaplan-Meier curves and analyzed using a log-rank test. Statistical significance of analyses pertinent to scRNA-seq data was determined using Wilcoxon rank-sum test. Primary method of statistical analysis for other outcomes was a two-sided independent-sample t-test. For all statistical testing, p values < 0.05 were considered significant, and they were adjusted for multiple testing using Bonferroni correction as appropriate.
Supplementary Material
Fig S1. T cell numbers are comparable between male and female MB49-bearing mice. CD45+, CD3+CD8+ and CD3+CD4+ immune cell frequency and absolute number – as assessed by flow cytometry – in Day 9 MB49 tumors (A to C) or spleens (D to F) are indicated in left and right y axes of each graph, respectively. Box height represents the mean of all shown biological replicates. Blue, male; Pink, female.
Fig S2. Characterization of CD8+ TILs from Day 10 MB49 tumors by single-cell RNA sequencing analysis. (A) Heatmap of key CD8+ T cell gene expression for each cell cluster. These genes show significant sex-biased expression as indicated in Fig. 3C. Genes with Bonferroni-adjusted p-values ≤ 0.05 from the differential expression analyses using Wilcoxon rank-sum test were considered enriched (red) or depleted (blue) depending on the directionality of their average log fold change. White color indicates no cluster specific gene enrichment. (B) Expression of indicated genes in individual cells. (C) Expression of Tcf7 (left) and Gzmb (right) in clusters 1, 2, 6, 7, 9 and 10 across pseudotime in males (solid) versus females (dotted).
Fig S3. Characterization of CD8+ progenitor exhausted T cells from male versus female tumors. (A) Cluster frequencies (lines) in males (blue) and females (pink), along with 95% confidence intervals (vertical bars). See Fig. 4A. (B) Heatmap of relative protein expression of markers in (A). Blue, low expression; Red, high expression. (C) Flow cytometric analysis of TCF1 and TOX expression in male and female CD44+CD62L−CD8+ T cells at indicated time points. (D) MC38 and B16 tumor growth in WT mice. Mean tumor area (mm2) ± SEM are reported, with statistical significance determined using the repeated measures two-way ANOVA. (E) Frequency of indicated PE CD8+ T cells in MC38 and B16-F10 tumors. Blue, male; Pink, female. (F) Enrichment analysis of the PE signature in minimum spanning tree (MST) based clusters from the spectral flow cytometry data. Dotted line represents the 75th percentile of PE scores across all cells. (G) Representative flow plot of SLAMF6 and TCF1 co-expression in CD44+CD62L−TIM3−/+CD8+ TILs. (H) Percentage of SLAMF6+TIM3− TILs in MB49 tumors. (I) Representative plots of flow cytometric analysis of IFNγ and TNFα expression in donor TILs post ex vivo stimulation with 50 ng/mL PMA, 1 µg/mL Ionomycin and 1X Brefeldin A for 2 hours. See Fig. 4D. Statistical significance for C, E and H was determined by Student’s t test. *p ≤ 0.05, **p ≤ 0.01, ****p ≤ 0.0001.
Fig S4. Male-biased CD8+ T cell exhaustion in human cancer. UMAP of CD8+ TILs from (A) basal cell carcinoma (BCC) prior to immunotherapy (39) or (B) treatment-naïve non-small cell lung cancer (NSCLC) (40). T cell differentiation states were annotated the same way as published and stratified based on patients’ sex. Solid black lines enclose exhausted clusters that show male-biased frequency. (A) Act, activated; Eff, effector; Ex, exhausted; Ex_act, exhausted/activated; Mem, memory. (B) C1-LEF1 = naïve, [C2-CD28, C4-GZMK, C5-ZNF683] = intermediate between naïve and effector, C3-CX3CR1 = effector, C6-LAYN = exhausted, C7-SLC4A10 = mucosal-associated invariant T (MAIT) cells. Stacked bar charts show frequency of indicated clusters in women and men.
Fig S5. AR signaling in CD8+ progenitor exhausted T cells. Correlation between androgen and type I IFN signatures in MB49 CD8+ TILs, as well as human bladder cancer (BLCA) (42), basal cell carcinoma (BCC) (39), and non-small cell lung cancer (NSCLC) (40), in females and males.
Fig S6. Direct regulation of Tcf7 by Androgen Receptor. (A) List of AREs in human and mouse Tcf7 promoter. Conserved AR binding motif was scanned through 1 kb upstream of Tcf7 transcriptional start site via Motif Alignment and Search Tool (MAST) at a positional p value < 0.005. (B and C) Experimental analysis of predicted AREs. Red Firefly luciferase activity, as regulated by a 1 kb long human WT or mutant Tcf7 promoter sequence lacking putative AREs, was measured in EGFP-C1-AR overexpressing HEK293FT cells post 24 h stimulation with 500 ng/mL testosterone or vehicle control. EGFP was assessed by flow cytometry to ensure comparable transfection efficiency. Statistical significance was determined by Student’s t test. *p ≤ 0.05, **p ≤ 0.01, ***p ≤ 0.001, ****p ≤ 0.0001, ns = not significant.
Fig S7. Generation of AR overexpressing Jurkats. (A) qPCR/western blot analysis of AR expression in HEK293FT, LNCaP and WT, empty vector (EV) or AR-overexpressing (AR) Jurkats. β-actin served as a loading control. (B) Proliferation of EV- and AR-Jurkats over 9 days during stimulation with vehicle control, 100 nM testosterone (T) or 100 nM dihydrotestosterone (DHT) at Days 0, 3 and 6. n = 5 biological replicates. Data are mean ± SEM. Statistical significance was determined by Student’s t test. **p ≤ 0.01, ****p ≤ 0.0001.
Table S1. Seurat_list_markers. Gene markers for 11 clusters of CD8+ T cells from Day 10 MB49 tumors.
Table S2. pvalue_hormone_IFN_by_sex. p values based on the enrichment of the following signatures in 11 clusters of CD8+ T cells from Day 10 MB49 tumors: 1) HALLMARK ANDROGEN RESPONSE, 2) HALLMARK ESTROGEN RESPONSE EARLY, 3) HALLMARK ESTROGEN RESPONSE LATE and 4) HALLMARK INTERFERON ALPHA RESPONSE.
Table S3. T cell exhaustion panel. List of antibodies for spectral flow cytometry.
Table S4. Raw data
Acknowledgments
We thank Cynthia Timmers and Marty Romeo from the Translational Science Laboratory at the Medical University of South Carolina for their assistance with the single-cell RNA-sequencing efforts. We also thank Kevin Weller from the Immune Monitoring and Discovery Platform (IMDP) of the Pelotonia Institute for Immuno-Oncology for technical support. Dr. Patrick Collins contributed to our ChIP methodology. Dr. Gang Xin and Dr. Mark Rubinstein provided helpful discussion of the results. Donna Bucci provided administrative support. We are grateful to Dr. Chelsea Bolyard and Dr. Eugene Oltz for their critical reading and editing of the manuscript.
The discovery that androgen preferentially drives PE CD8+ T cells and a T cell exhaustion program in cancer was initially reported by us in a preprint in bioRxiv (82).
Funding
This work was supported by National Institutes of Health grants: R01 DK110477, U01 DK131377, and R21 CA249701 (X.L.); and P01 CA186866, R01 CA213290, R01 CA188419 and R01 AI077283 (Z.L.). D.Y.O. was supported by NIH K08AI139375, a Young Investigator Award from the Prostate Cancer Foundation, and the Damon Runyon Clinical Investigator Award. H. Kwon was supported by Doctoral Foreign Study Award from Canadian Institutes of Health Research (201810DFS-422133-63414) and Graduate Fellowship from the Hollings Cancer Center in Charleston, SC, USA. J.M. Schafer was supported by the Ohio State University Comprehensive Cancer Center’s Tumor Immunology T32 (2T32CA09223-16A1) postdoctoral fellowship award.
Competing Interests
Z.L. serves as a member of scientific advisory boards for Heat Biologics, Alphamab, Hengenix and Ikonisys. D.Y.O. has received research support from Roche/Genentech and Merck and has served as a paid consultant for Maze Therapeutics. L.F. has received research support from Roche/Genentech, AbbVie, Bavarian Nordic, Bristol Myers Squibb, Janssen, and Merck. The other authors declare no competing interests.
Footnotes
Data and materials availability
Single-cell RNA sequencing data have been deposited to the National Center for Biotechnology Information Gene Expression Omnibus (GSE 200294). https://github.com/BMEngineeR/Sex-bias-in-cancer-ScienceImmunology-2022 includes all codes used in this manuscript. All other data are available in the main text or Supplementary Materials. All mice are either commercially available or available under a material transfer agreement (MTA). Requests for reagents should be directed to the corresponding author (Z.L.).
References
- 1.Klein SL, Flanagan KL, Sex differences in immune responses. Nat Rev Immunol 16, 626–638 (2016). [DOI] [PubMed] [Google Scholar]
- 2.Clocchiatti A, Cora E, Zhang Y, Dotto GP, Sexual dimorphism in cancer. Nat Rev Cancer 16, 330–339 (2016). [DOI] [PubMed] [Google Scholar]
- 3.Bray F et al. Global cancer statistics 2018: GLOBOCAN estimates of incidence and mortality worldwide for 36 cancers in 185 countries. CA Cancer J Clin 68, 394–424 (2018). [DOI] [PubMed] [Google Scholar]
- 4.Hartge P et al. Unexplained excess risk of bladder cancer in men. J Natl Cancer Inst 82, 1636–1640 (1990). [DOI] [PubMed] [Google Scholar]
- 5.Thommen DS, Schumacher TN, T Cell Dysfunction in Cancer. Cancer Cell 33, 547–562 (2018). [DOI] [PMC free article] [PubMed] [Google Scholar]
- 6.Wherry EJ, T cell exhaustion. Nat Immunol 12, 492–499 (2011). [DOI] [PubMed] [Google Scholar]
- 7.Miller BC et al. Subsets of exhausted CD8(+) T cells differentially mediate tumor control and respond to checkpoint blockade. Nat Immunol 20, 326–336 (2019). [DOI] [PMC free article] [PubMed] [Google Scholar]
- 8.Paley MA et al. Progenitor and terminal subsets of CD8+ T cells cooperate to contain chronic viral infection. Science 338, 1220–1225 (2012). [DOI] [PMC free article] [PubMed] [Google Scholar]
- 9.Utzschneider DT et al. T Cell Factor 1-Expressing Memory-like CD8(+) T Cells Sustain the Immune Response to Chronic Viral Infections. Immunity 45, 415–427 (2016). [DOI] [PubMed] [Google Scholar]
- 10.Ahmadzadeh M et al. Tumor antigen-specific CD8 T cells infiltrating the tumor express high levels of PD-1 and are functionally impaired. Blood 114, 1537–1544 (2009). [DOI] [PMC free article] [PubMed] [Google Scholar]
- 11.He R et al. Follicular CXCR5- expressing CD8(+) T cells curtail chronic viral infection. Nature 537, 412–428 (2016). [DOI] [PubMed] [Google Scholar]
- 12.Blackburn SD, Shin H, Freeman GJ, Wherry EJ, Selective expansion of a subset of exhausted CD8 T cells by alphaPD-L1 blockade. Proc Natl Acad Sci U S A 105, 15016–15021 (2008). [DOI] [PMC free article] [PubMed] [Google Scholar]
- 13.Brummelman J et al. High-dimensional single cell analysis identifies stem-like cytotoxic CD8(+) T cells infiltrating human tumors. J Exp Med 215, 2520–2535 (2018). [DOI] [PMC free article] [PubMed] [Google Scholar]
- 14.Kurtulus S et al. Checkpoint Blockade Immunotherapy Induces Dynamic Changes in PD-1(−)CD8(+) Tumor-Infiltrating T Cells. Immunity 50, 181–194 e186 (2019). [DOI] [PMC free article] [PubMed] [Google Scholar]
- 15.Sade-Feldman M et al. Defining T Cell States Associated with Response to Checkpoint Immunotherapy in Melanoma. Cell 175, 998–1013 e1020 (2018). [DOI] [PMC free article] [PubMed] [Google Scholar]
- 16.Im SJ et al. Defining CD8+ T cells that provide the proliferative burst after PD-1 therapy. Nature 537, 417–421 (2016). [DOI] [PMC free article] [PubMed] [Google Scholar]
- 17.Thommen DS et al. A transcriptionally and functionally distinct PD-1(+) CD8(+) T cell pool with predictive potential in non-small-cell lung cancer treated with PD-1 blockade. Nat Med 24, 994–1004 (2018). [DOI] [PMC free article] [PubMed] [Google Scholar]
- 18.Siddiqui I et al. Intratumoral Tcf1(+)PD-1(+)CD8(+) T Cells with Stem-like Properties Promote Tumor Control in Response to Vaccination and Checkpoint Blockade Immunotherapy. Immunity 50, 195–211 e110 (2019). [DOI] [PubMed] [Google Scholar]
- 19.Jansen CS et al. An intra-tumoral niche maintains and differentiates stem-like CD8 T cells. Nature 576, 465–470 (2019). [DOI] [PMC free article] [PubMed] [Google Scholar]
- 20.Gabrilovich DI, Ostrand-Rosenberg S, Bronte V, Coordinated regulation of myeloid cells by tumours. Nat Rev Immunol 12, 253–268 (2012). [DOI] [PMC free article] [PubMed] [Google Scholar]
- 21.Sawant DV et al. Adaptive plasticity of IL-10(+) and IL-35(+) Treg cells cooperatively promotes tumor T cell exhaustion. Nat Immunol 20, 724–735 (2019). [DOI] [PMC free article] [PubMed] [Google Scholar]
- 22.Yi JS, Cox MA, Zajac AJ, T-cell exhaustion: characteristics, causes and conversion. Immunology 129, 474–481 (2010). [DOI] [PMC free article] [PubMed] [Google Scholar]
- 23.Okazaki T, Chikuma S, Iwai Y, Fagarasan S, Honjo T, A rheostat for immune responses: the unique properties of PD-1 and their advantages for clinical application. Nat Immunol 14, 1212–1218 (2013). [DOI] [PubMed] [Google Scholar]
- 24.Le Bourgeois T et al. Targeting T Cell Metabolism for Improvement of Cancer Immunotherapy. Front Oncol 8, 237 (2018). [DOI] [PMC free article] [PubMed] [Google Scholar]
- 25.Bertram JS, Craig AW, Specific induction of bladder cancer in mice by butyl-(4-hydroxybutyl)-nitrosamine and the effects of hormonal modifications on the sex difference in response. Eur J Cancer 8, 587–594 (1972). [DOI] [PubMed] [Google Scholar]
- 26.Fantini D et al. A Carcinogen-induced mouse model recapitulates the molecular alterations of human muscle invasive bladder cancer. Oncogene 37, 1911–1925 (2018). [DOI] [PMC free article] [PubMed] [Google Scholar]
- 27.Kaneko S, Li X, X chromosome protects against bladder cancer in females via a KDM6A-dependent epigenetic mechanism. Sci Adv 4, eaar5598 (2018). [DOI] [PMC free article] [PubMed] [Google Scholar]
- 28.He Z, Kosinska W, Zhao ZL, Wu XR, Guttenplan JB, Tissue-specific mutagenesis by N-butyl-N-(4-hydroxybutyl)nitrosamine as the basis for urothelial carcinogenesis. Mutat Res 742, 92–95 (2012). [DOI] [PubMed] [Google Scholar]
- 29.White-Gilbertson S, Davis M, Voelkel-Johnson C, Kasman LM, Sex differences in the MB49 syngeneic, murine model of bladder cancer. Bladder (San Franc) 3, (2016). [DOI] [PMC free article] [PubMed] [Google Scholar]
- 30.Summerhayes IC, Franks LM, Effects of donor age on neoplastic transformation of adult mouse bladder epithelium in vitro. J Natl Cancer Inst 62, 1017–1023 (1979). [PubMed] [Google Scholar]
- 31.Fabris VT et al. Cytogenetic characterization of the murine bladder cancer model MB49 and the derived invasive line MB49-I. Cancer Genet 205, 168–176 (2012). [DOI] [PubMed] [Google Scholar]
- 32.Wu T et al. The TCF1-Bcl6 axis counteracts type I interferon to repress exhaustion and maintain T cell stemness. Sci Immunol 1, (2016). [DOI] [PMC free article] [PubMed] [Google Scholar]
- 33.Scott AC et al. TOX is a critical regulator of tumour-specific T cell differentiation. Nature 571, 270–274 (2019). [DOI] [PMC free article] [PubMed] [Google Scholar]
- 34.Khan O et al. TOX transcriptionally and epigenetically programs CD8(+) T cell exhaustion. Nature 571, 211–218 (2019). [DOI] [PMC free article] [PubMed] [Google Scholar]
- 35.Chen Z et al. TCF-1-Centered Transcriptional Network Drives an Effector versus Exhausted CD8 T Cell-Fate Decision. Immunity 51, 840–855 e845 (2019). [DOI] [PMC free article] [PubMed] [Google Scholar]
- 36.Qiu X et al. Single-cell mRNA quantification and differential analysis with Census. Nat Methods 14, 309–315 (2017). [DOI] [PMC free article] [PubMed] [Google Scholar]
- 37.Yang S, Liu F, Wang QJ, Rosenberg SA, Morgan RA, The shedding of CD62L (L-selectin) regulates the acquisition of lytic activity in human tumor reactive T lymphocytes. PLoS One 6, e22560 (2011). [DOI] [PMC free article] [PubMed] [Google Scholar]
- 38.Andreatta M, Carmona SJ, UCell: Robust and scalable single-cell gene signature scoring. Comput Struct Biotechnol J 19, 3796–3798 (2021). [DOI] [PMC free article] [PubMed] [Google Scholar]
- 39.Yost KE et al. Clonal replacement of tumor-specific T cells following PD-1 blockade. Nat Med 25, 1251–1259 (2019). [DOI] [PMC free article] [PubMed] [Google Scholar]
- 40.Guo X et al. Global characterization of T cells in non-small-cell lung cancer by single-cell sequencing. Nat Med 24, 978–985 (2018). [DOI] [PubMed] [Google Scholar]
- 41.LaFleur MW et al. PTPN2 regulates the generation of exhausted CD8(+) T cell subpopulations and restrains tumor immunity. Nat Immunol 20, 1335–1347 (2019). [DOI] [PMC free article] [PubMed] [Google Scholar]
- 42.Oh DY et al. Intratumoral CD4(+) T Cells Mediate Anti-tumor Cytotoxicity in Human Bladder Cancer. Cell 181, 1612–1625 e1613 (2020). [DOI] [PMC free article] [PubMed] [Google Scholar]
- 43.Ma A et al. IRIS3: integrated cell-type-specific regulon inference server from single-cell RNA-Seq. Nucleic Acids Res 48, W275–W286 (2020). [DOI] [PMC free article] [PubMed] [Google Scholar]
- 44.Chen Z et al. Agonist and antagonist switch DNA motifs recognized by human androgen receptor in prostate cancer. EMBO J 34, 502–516 (2015). [DOI] [PMC free article] [PubMed] [Google Scholar]
- 45.Abraham RT, Weiss A, Jurkat T cells and development of the T-cell receptor signalling paradigm. Nat Rev Immunol 4, 301–308 (2004). [DOI] [PubMed] [Google Scholar]
- 46.Li CH, Haider S, Shiah YJ, Thai K, Boutros PC, Sex Differences in Cancer Driver Genes and Biomarkers. Cancer Res 78, 5527–5537 (2018). [DOI] [PubMed] [Google Scholar]
- 47.Yuan Y et al. Comprehensive Characterization of Molecular Differences in Cancer between Male and Female Patients. Cancer Cell 29, 711–722 (2016). [DOI] [PMC free article] [PubMed] [Google Scholar]
- 48.Li Z, Tuteja G, Schug J, Kaestner KH, Foxa1 and Foxa2 are essential for sexual dimorphism in liver cancer. Cell 148, 72–83 (2012). [DOI] [PMC free article] [PubMed] [Google Scholar]
- 49.Robertson AG et al. Comprehensive Molecular Characterization of Muscle-Invasive Bladder Cancer. Cell 171, 540–556 e525 (2017). [DOI] [PMC free article] [PubMed] [Google Scholar]
- 50.Dunford A et al. Tumor-suppressor genes that escape from X-inactivation contribute to cancer sex bias. Nat Genet 49, 10–16 (2017). [DOI] [PMC free article] [PubMed] [Google Scholar]
- 51.Naugler WE et al. Gender disparity in liver cancer due to sex differences in MyD88-dependent IL-6 production. Science 317, 121–124 (2007). [DOI] [PubMed] [Google Scholar]
- 52.Conforti F et al. Cancer immunotherapy efficacy and patients’ sex: a systematic review and meta-analysis. Lancet Oncol 19, 737–746 (2018). [DOI] [PubMed] [Google Scholar]
- 53.Kwon H, Lin CY, Chung D, Li X, Li Z, Sex as a predictor of response to cancer immunotherapy. Lancet Oncol 19, e379 (2018). [DOI] [PubMed] [Google Scholar]
- 54.Guan X et al. Androgen receptor activity in T cells limits checkpoint blockade efficacy. Nature, (2022). [DOI] [PMC free article] [PubMed] [Google Scholar]
- 55.Morales EE et al. Finasteride Reduces Risk of Bladder Cancer in a Large Prospective Screening Study. Eur Urol 69, 407–410 (2016). [DOI] [PubMed] [Google Scholar]
- 56.Watts EL et al. Prospective analyses of testosterone and sex hormone-binding globulin with the risk of 19 types of cancer in men and postmenopausal women in UK Biobank. Int J Cancer 149, 573–584 (2021). [DOI] [PubMed] [Google Scholar]
- 57.Roden AC et al. Augmentation of T cell levels and responses induced by androgen deprivation. J Immunol 173, 6098–6108 (2004). [DOI] [PubMed] [Google Scholar]
- 58.Kissick HT et al. Androgens alter T-cell immunity by inhibiting T-helper 1 differentiation. Proc Natl Acad Sci U S A 111, 9887–9892 (2014). [DOI] [PMC free article] [PubMed] [Google Scholar]
- 59.Mercader M et al. T cell infiltration of the prostate induced by androgen withdrawal in patients with prostate cancer. Proc Natl Acad Sci U S A 98, 14565–14570 (2001). [DOI] [PMC free article] [PubMed] [Google Scholar]
- 60.Arredouani MS et al. Androgen ablation augments human HLA2.1-restricted T cell responses to PSA self-antigen in transgenic mice. Prostate 70, 1002–1011 (2010). [DOI] [PMC free article] [PubMed] [Google Scholar]
- 61.Sutherland JS et al. Activation of thymic regeneration in mice and humans following androgen blockade. J Immunol 175, 2741–2753 (2005). [DOI] [PubMed] [Google Scholar]
- 62.Radojevic K et al. Neonatal castration affects intrathymic kinetics of T-cell differentiation and the spleen T-cell level. J Endocrinol 192, 669–682 (2007). [DOI] [PubMed] [Google Scholar]
- 63.Gal-Oz ST et al. ImmGen report: sexual dimorphism in the immune system transcriptome. Nat Commun 10, 4295 (2019). [DOI] [PMC free article] [PubMed] [Google Scholar]
- 64.Zhao R et al. A GPR174-CCL21 module imparts sexual dimorphism to humoral immunity. Nature 577, 416–420 (2020). [DOI] [PubMed] [Google Scholar]
- 65.Arnold AP, Mouse models for evaluating sex chromosome effects that cause sex differences in non-gonadal tissues. J Neuroendocrinol 21, 377–386 (2009). [DOI] [PMC free article] [PubMed] [Google Scholar]
- 66.McInnes L, Healy J, Melville J, UMAP: Uniform Manifold Approximation and Projection for Dimension Reduction. arXiv e-prints. 2018. [Google Scholar]
- 67.Van Gassen S et al. FlowSOM: Using self-organizing maps for visualization and interpretation of cytometry data. Cytometry A 87, 636–645 (2015). [DOI] [PubMed] [Google Scholar]
- 68.Butler A, Hoffman P, Smibert P, Papalexi E, Satija R, Integrating single-cell transcriptomic data across different conditions, technologies, and species. Nat Biotechnol 36, 411–420 (2018). [DOI] [PMC free article] [PubMed] [Google Scholar]
- 69.Street K et al. Slingshot: cell lineage and pseudotime inference for single-cell transcriptomics. BMC Genomics 19, 477 (2018). [DOI] [PMC free article] [PubMed] [Google Scholar]
- 70.Subramanian A et al. Gene set enrichment analysis: a knowledge-based approach for interpreting genome-wide expression profiles. Proc Natl Acad Sci U S A 102, 15545–15550 (2005). [DOI] [PMC free article] [PubMed] [Google Scholar]
- 71.Langmead B, Salzberg SL, Fast gapped-read alignment with Bowtie 2. Nat Methods 9, 357–359 (2012). [DOI] [PMC free article] [PubMed] [Google Scholar]
- 72.Zhang Y et al. Model-based analysis of ChIP-Seq (MACS). Genome Biol 9, R137 (2008). [DOI] [PMC free article] [PubMed] [Google Scholar]
- 73.Heinz S et al. Simple combinations of lineage-determining transcription factors prime cis-regulatory elements required for macrophage and B cell identities. Mol Cell 38, 576–589 (2010). [DOI] [PMC free article] [PubMed] [Google Scholar]
- 74.Rao A, Cramer SD, Identification of a polymorphism in the ARE 1 region of the PSA promoter. Proc. Am. Assoc. Cancer Res 40, (1999). [Google Scholar]
- 75.Bailey TL, DREME: motif discovery in transcription factor ChIP-seq data. Bioinformatics 27, 1653–1659 (2011). [DOI] [PMC free article] [PubMed] [Google Scholar]
- 76.Stenoien DL et al. Polyglutamine-expanded androgen receptors form aggregates that sequester heat shock proteins, proteasome components and SRC-1, and are suppressed by the HDJ-2 chaperone. Hum Mol Genet 8, 731–741 (1999). [DOI] [PubMed] [Google Scholar]
- 77.Olsen JR et al. Context dependent regulatory patterns of the androgen receptor and androgen receptor target genes. BMC Cancer 16, 377 (2016). [DOI] [PMC free article] [PubMed] [Google Scholar]
- 78.Collins PL et al. DNA double-strand breaks induce H2Ax phosphorylation domains in a contact-dependent manner. Nat Commun 11, 3158 (2020). [DOI] [PMC free article] [PubMed] [Google Scholar]
- 79.Gupta S, Stamatoyannopoulos JA, Bailey TL, Noble WS, Quantifying similarity between motifs. Genome Biol 8, R24 (2007). [DOI] [PMC free article] [PubMed] [Google Scholar]
- 80.Kulakovskiy IV et al. HOCOMOCO: towards a complete collection of transcription factor binding models for human and mouse via large-scale ChIP-Seq analysis. Nucleic Acids Res 46, D252–D259 (2018). [DOI] [PMC free article] [PubMed] [Google Scholar]
- 81.Shannon P et al. Cytoscape: a software environment for integrated models of biomolecular interaction networks. Genome Res 13, 2498–2504 (2003). [DOI] [PMC free article] [PubMed] [Google Scholar]
- 82.Kwon H et al. Distinct CD8+ T Cell Programming in the Tumor Microenvironment Contributes to Sex Bias in Bladder Cancer Outcome. bioRxiv, 2020.2004.2013.039735 (2020). [Google Scholar]
Associated Data
This section collects any data citations, data availability statements, or supplementary materials included in this article.
Supplementary Materials
Fig S1. T cell numbers are comparable between male and female MB49-bearing mice. CD45+, CD3+CD8+ and CD3+CD4+ immune cell frequency and absolute number – as assessed by flow cytometry – in Day 9 MB49 tumors (A to C) or spleens (D to F) are indicated in left and right y axes of each graph, respectively. Box height represents the mean of all shown biological replicates. Blue, male; Pink, female.
Fig S2. Characterization of CD8+ TILs from Day 10 MB49 tumors by single-cell RNA sequencing analysis. (A) Heatmap of key CD8+ T cell gene expression for each cell cluster. These genes show significant sex-biased expression as indicated in Fig. 3C. Genes with Bonferroni-adjusted p-values ≤ 0.05 from the differential expression analyses using Wilcoxon rank-sum test were considered enriched (red) or depleted (blue) depending on the directionality of their average log fold change. White color indicates no cluster specific gene enrichment. (B) Expression of indicated genes in individual cells. (C) Expression of Tcf7 (left) and Gzmb (right) in clusters 1, 2, 6, 7, 9 and 10 across pseudotime in males (solid) versus females (dotted).
Fig S3. Characterization of CD8+ progenitor exhausted T cells from male versus female tumors. (A) Cluster frequencies (lines) in males (blue) and females (pink), along with 95% confidence intervals (vertical bars). See Fig. 4A. (B) Heatmap of relative protein expression of markers in (A). Blue, low expression; Red, high expression. (C) Flow cytometric analysis of TCF1 and TOX expression in male and female CD44+CD62L−CD8+ T cells at indicated time points. (D) MC38 and B16 tumor growth in WT mice. Mean tumor area (mm2) ± SEM are reported, with statistical significance determined using the repeated measures two-way ANOVA. (E) Frequency of indicated PE CD8+ T cells in MC38 and B16-F10 tumors. Blue, male; Pink, female. (F) Enrichment analysis of the PE signature in minimum spanning tree (MST) based clusters from the spectral flow cytometry data. Dotted line represents the 75th percentile of PE scores across all cells. (G) Representative flow plot of SLAMF6 and TCF1 co-expression in CD44+CD62L−TIM3−/+CD8+ TILs. (H) Percentage of SLAMF6+TIM3− TILs in MB49 tumors. (I) Representative plots of flow cytometric analysis of IFNγ and TNFα expression in donor TILs post ex vivo stimulation with 50 ng/mL PMA, 1 µg/mL Ionomycin and 1X Brefeldin A for 2 hours. See Fig. 4D. Statistical significance for C, E and H was determined by Student’s t test. *p ≤ 0.05, **p ≤ 0.01, ****p ≤ 0.0001.
Fig S4. Male-biased CD8+ T cell exhaustion in human cancer. UMAP of CD8+ TILs from (A) basal cell carcinoma (BCC) prior to immunotherapy (39) or (B) treatment-naïve non-small cell lung cancer (NSCLC) (40). T cell differentiation states were annotated the same way as published and stratified based on patients’ sex. Solid black lines enclose exhausted clusters that show male-biased frequency. (A) Act, activated; Eff, effector; Ex, exhausted; Ex_act, exhausted/activated; Mem, memory. (B) C1-LEF1 = naïve, [C2-CD28, C4-GZMK, C5-ZNF683] = intermediate between naïve and effector, C3-CX3CR1 = effector, C6-LAYN = exhausted, C7-SLC4A10 = mucosal-associated invariant T (MAIT) cells. Stacked bar charts show frequency of indicated clusters in women and men.
Fig S5. AR signaling in CD8+ progenitor exhausted T cells. Correlation between androgen and type I IFN signatures in MB49 CD8+ TILs, as well as human bladder cancer (BLCA) (42), basal cell carcinoma (BCC) (39), and non-small cell lung cancer (NSCLC) (40), in females and males.
Fig S6. Direct regulation of Tcf7 by Androgen Receptor. (A) List of AREs in human and mouse Tcf7 promoter. Conserved AR binding motif was scanned through 1 kb upstream of Tcf7 transcriptional start site via Motif Alignment and Search Tool (MAST) at a positional p value < 0.005. (B and C) Experimental analysis of predicted AREs. Red Firefly luciferase activity, as regulated by a 1 kb long human WT or mutant Tcf7 promoter sequence lacking putative AREs, was measured in EGFP-C1-AR overexpressing HEK293FT cells post 24 h stimulation with 500 ng/mL testosterone or vehicle control. EGFP was assessed by flow cytometry to ensure comparable transfection efficiency. Statistical significance was determined by Student’s t test. *p ≤ 0.05, **p ≤ 0.01, ***p ≤ 0.001, ****p ≤ 0.0001, ns = not significant.
Fig S7. Generation of AR overexpressing Jurkats. (A) qPCR/western blot analysis of AR expression in HEK293FT, LNCaP and WT, empty vector (EV) or AR-overexpressing (AR) Jurkats. β-actin served as a loading control. (B) Proliferation of EV- and AR-Jurkats over 9 days during stimulation with vehicle control, 100 nM testosterone (T) or 100 nM dihydrotestosterone (DHT) at Days 0, 3 and 6. n = 5 biological replicates. Data are mean ± SEM. Statistical significance was determined by Student’s t test. **p ≤ 0.01, ****p ≤ 0.0001.
Table S1. Seurat_list_markers. Gene markers for 11 clusters of CD8+ T cells from Day 10 MB49 tumors.
Table S2. pvalue_hormone_IFN_by_sex. p values based on the enrichment of the following signatures in 11 clusters of CD8+ T cells from Day 10 MB49 tumors: 1) HALLMARK ANDROGEN RESPONSE, 2) HALLMARK ESTROGEN RESPONSE EARLY, 3) HALLMARK ESTROGEN RESPONSE LATE and 4) HALLMARK INTERFERON ALPHA RESPONSE.
Table S3. T cell exhaustion panel. List of antibodies for spectral flow cytometry.
Table S4. Raw data