

Abstract
Rigorously comparing gene expression and chromatin accessibility in the same single cells could illuminate the logic of how coupling or decoupling of these mechanisms regulates fate commitment. Here, we present MIRA: Probabilistic Multimodal Models for Integrated Regulatory Analysis, a comprehensive methodology that systematically contrasts transcription and accessibility to infer the regulatory circuitry driving cells along cell state trajectories. MIRA leverages topic modeling of cell states and regulatory potential modeling of individual gene loci. MIRA thereby represents cell states in an efficient and interpretable latent space, infers high fidelity cell state trees, determines key regulators of fate decisions at branch points, and exposes the variable influence of local accessibility on transcription at distinct loci. Applied to epidermal differentiation and embryonic brain development from two different multimodal platforms, MIRA revealed that early developmental genes were tightly regulated by local chromatin landscape whereas terminal fate genes were titrated without requiring extensive chromatin remodeling.
Editor summary:
MIRA facilitates accurate inference of cell state trees and regulatory mechanisms driving cell fate decisions using single-cell multimodal data profiling gene expression and chromatin accessibility.
Profiling both expression and chromatin accessibility in the same single cells1–5 opens an unprecedented opportunity to understand the interaction of transcriptional and epigenetic mechanisms driving cells along developmental continuums. While many computational methods analyze expression and accessibility separately, several recent algorithms have adopted joint analysis where the cells are projected onto a shared latent space based on both data modalities, which better captures the biological structure of the data6–11. However, the field lacks tools that go beyond visualization and clustering to rigorously contrast transcription and accessibility in each single cell to illuminate the complex regulatory circuitry driving developmental fate decisions.
Integrated analysis of global transcriptional and accessibility states across developmental trajectories would enable discovery of key regulators controlling fate decisions at lineage branch points. At the gene level, examining the dynamics of transcription versus chromatin accessibility proximal to the gene locus may reveal how these mechanisms interact to regulate distinct gene modules. Certain genes may be regulated by cis-regulatory elements that are simultaneously activated as they become accessible, whereas others may be regulated by elements whose accessibility and activation are decoupled12,13. Determining the logic of which genes are regulated by each of these distinct mechanisms may provide insight into the patterns of pathways that demand tight spatiotemporal regulation versus signal responsivity.
Here, we present MIRA: Probabilistic Multimodal Models for Integrated Regulatory Analysis, a comprehensive methodology that systematically contrasts transcription and accessibility to determine the regulatory circuitry driving cells along developmental continuums. MIRA leverages topic modeling of cell states and regulatory potential (RP) modeling of individual gene loci. MIRA thereby represents cell states in an efficient and interpretable latent space, infers high fidelity cell state trees, determines key regulators of fate decisions at branch points, and exposes the variable influence of local accessibility on transcription at distinct loci. We applied MIRA to an epidermal maintenance differentiation3 and brain developmental system14 assayed by multimodal single cell RNA-sequencing (scRNA-seq) and Assay for Transposase-Accessible Chromatin-sequencing (scATAC-seq) data from two different platforms (SHARE-seq and 10x Genomics). In each system, MIRA constructed a high fidelity developmental trajectory and determined the regulatory factors driving key fate decisions at trajectory branch points. Furthermore, MIRA distinguished early developmental genes that were tightly spatiotemporally regulated by local chromatin landscape from terminal fate genes that were permitted to remain accessible while titrated by factors with minimal impact on local chromatin, revealing how variable regulatory circuitry coordinates fate commitment and terminal identity.
Results
MIRA leverages topic modeling and RP modeling to reveal the circuitry regulating developmental trajectories
MIRA leverages topic modeling and RP modeling of expression and chromatin accessibility in single cells to determine the regulatory mechanisms driving key fate decisions within cell state trajectories (Fig. 1a–b, Methods). Probabilistic topic modeling has been employed in natural language understanding to elucidate the abstract topics that shape the meaning of a given collection of text15. Recently, topic modeling has been applied to scRNA-seq and scATAC-seq separately to describe either transcriptional or epigenetic cell states16,17 as “thematic” groups of co-regulated genes or cis-regulatory elements, respectively.
Fig. 1 |. Schematic of MIRA’s cell-level topic and gene-level RP models for integrated analysis of single cell multimodal transcription and accessibility data.

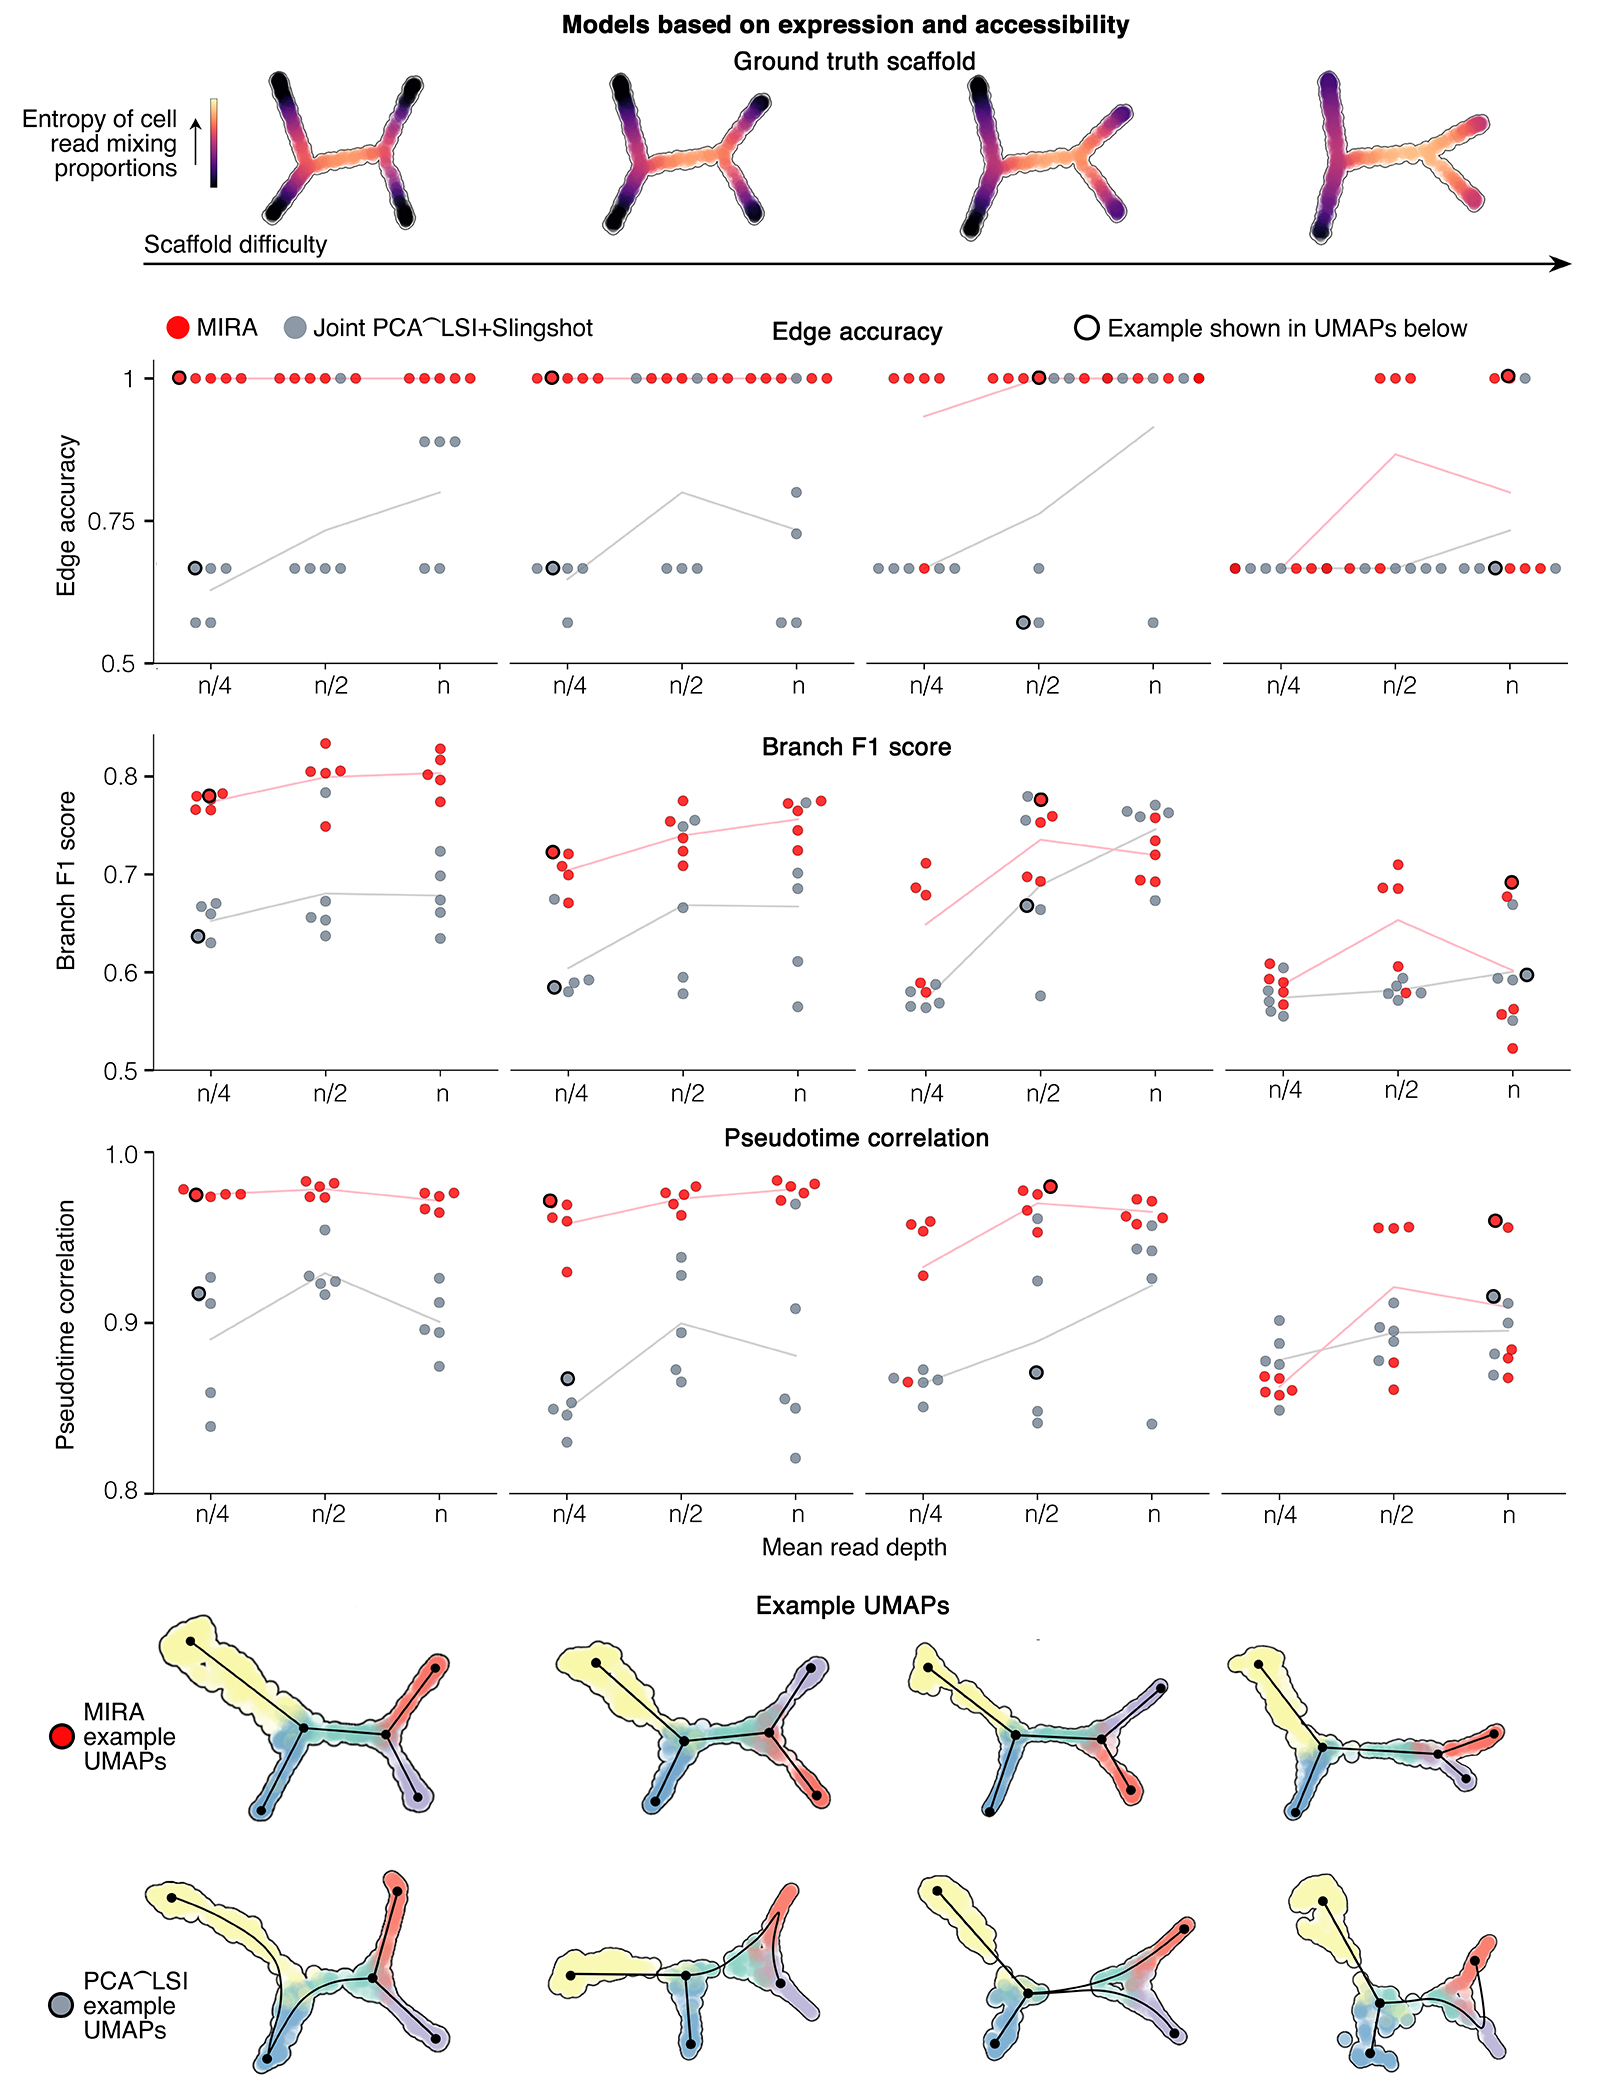
a, Schematic of MIRA’s variational autoencoder18 approach to modeling the transcription and chromatin accessibility topics defining each cell’s identity. The joint representation output can be leveraged for visualization and clustering, construction of high fidelity cell state trajectories, and rigorous topic analysis to determine regulators driving key fate decisions at trajectory branch points. b, MIRA’s RP model integrates transcriptional and chromatin accessibility data at each gene locus to determine how regulatory elements surrounding each gene influence its expression. MIRA quantifies the regulatory influence of local chromatin state to distinguish genes primarily regulated by local chromatin remodeling (LITE genes) versus those more heavily influenced by non-local signals (NITE genes) reflected in the genome-wide accessibility topics with minimal impact on local chromatin landscape. MIRA furthermore predicts key regulators at each locus by examining transcription factor motif or occupancy (from ChIP-seq) enrichment within elements predicted to highly influence transcription at that locus. c, Benchmarking results comparing MIRA joint cell state trajectory inference to standard methodology of Seurat principal component analysis (PCA)+Slingshot on expression data only, Seurat latent semantic indexing (LSI)+Slingshot on accessibility data only, or joint model combining Seurat PCA on expression data and LSI on accessibility data followed by Slingshot. Overall score is the geometric mean of edge accuracy, branch F1 score, and pseudotime correlation metrics. Performance was tested on four different ground truth scaffolds, which are computationally synthesized by mixing reads from distinct populations of single cells. Scaffold difficulty increases from left to right, where more difficult scaffolds contain cell states where mixture components are more similar (increased entropy), making them more difficult to distinguish. Line plots indicate performance in each of the four scaffold difficulties with trials (5 replicates each) for three different mean read depths (lower read depth further increases the difficulty of solving the topology). scRNA-seq mean read depth n=4000; scATAC-seq mean read depth n=14000. d, Example UMAPs for the least difficult scaffold. Black edges show cell state parsing. Cells colored by ground truth branch assignment.
MIRA’s topic model uses a variational autoencoder18 approach, intersecting deep learning with probabilistic graphical models, to learn expression and accessibility topics defining each cell’s identity (Extended Data Fig. 1a). MIRA accounts for the distinct statistical properties of each modality by using different generative distributions for overdispersed scRNA-seq counts and sparse scATAC-seq data. A sparsity constraint over cells’ topic compositions is employed to ensure cells’ topics are coherent and interpretable19. MIRA’s hyperparameter tuning scheme finds the appropriate number of topics needed to comprehensively yet non-redundantly describe each dataset.
MIRA next combines the expression and accessibility topics into a joint representation used to calculate a k-nearest neighbors (KNN) graph. The KNN graph is then leveraged to construct a cell state tree using a new method we developed to define the branch points between trajectories where the probabilities of differentiating into one terminal state diverges from another (Extended Data Fig. 1b–c). A benchmarking comparison of MIRA’s cell state tree construction demonstrated consistently better performance than standard alternatives (Fig. 1c–d, Extended Data Fig. 2–4, Supplementary Fig. 1). MIRA then contrasts the emergence of expression and accessibility topics mapped on this cell state tree to elucidate the key regulators driving fate decisions at the inferred branch points.
Next, MIRA leverages RP modeling20,21 to integrate transcription and accessibility at the resolution of individual gene loci to determine how regulatory elements surrounding each gene influence its expression (Fig. 1b). While correlation between chromatin accessibility and expression is confounded by coordinated genome-wide changes ascribed to cell state, genomic proximity suggests a mechanistic regulatory relationship between cis-regulatory elements and transcription. Thus, the perceived influence of cis-regulatory elements is modeled to decay exponentially with genomic distance upstream or downstream of a transcriptional start site (TSS) at independent rates learned by MIRA from the multimodal data. Each gene’s RP is scored as the sum of the contribution of individual regulatory elements. MIRA predicts key regulators at each locus by examining transcription factor motif enrichment or occupancy (if provided chromatin immunoprecipitation-sequencing (ChIP-seq) data) within elements predicted to highly influence transcription at that locus by probabilistic in silico deletion (pISD).
Furthermore, MIRA quantifies the regulatory influence of local chromatin accessibility on gene expression by comparing the local RP model with a second, expanded model augmented with knowledge of genome-wide accessibility states encoded by MIRA’s accessibility topics. Genes whose transcription is sufficiently predicted by the RP model based on local accessibility alone (±600 kilobases from the TSS) are defined as local chromatin accessibility-influenced transcriptional expression (LITE) genes. Genes whose expression is significantly better described by the model with genome-wide scope are defined as non-local chromatin accessibility-influenced transcriptional expression (NITE) genes.
While LITE genes appear tightly regulated by local chromatin accessibility, the transcription of NITE genes appears to be titrated without requiring extensive local chromatin remodeling. MIRA defines the extent to which the LITE model over- or under-estimates expression in each cell as “chromatin differential”, highlighting cells where transcription is decoupled from shifts in local chromatin accessibility. MIRA examines chromatin differential across cell state continuums to reveal how variable circuitry regulates fate commitment and terminal identity.
MIRA topic modeling determined regulators driving key fate decisions in hair follicle differentiation
Applied to hair follicle maintenance differentiation assayed by SHARE-seq3, MIRA’s joint topic representation constructed a state space map whose latent structure mimicked the follicle’s true spatial layout22,23 (Fig. 2a, Extended Data Fig. 5). MIRA’s inferred cell state tree reconstructed the ancestral hierarchy of follicular lineages, with outer root sheath cells leading to early matrix progenitors, which subsequently branched into descendant inner root sheath (IRS) followed by medulla and cortex lineages (Fig. 2b). Accurate lineage trees are a crucial prerequisite to determining the factors directing cell fate decisions at trajectory branch points.
Fig. 2 |. MIRA topic modeling determined regulatory factors driving key fate decisions in hair follicle differentiation.
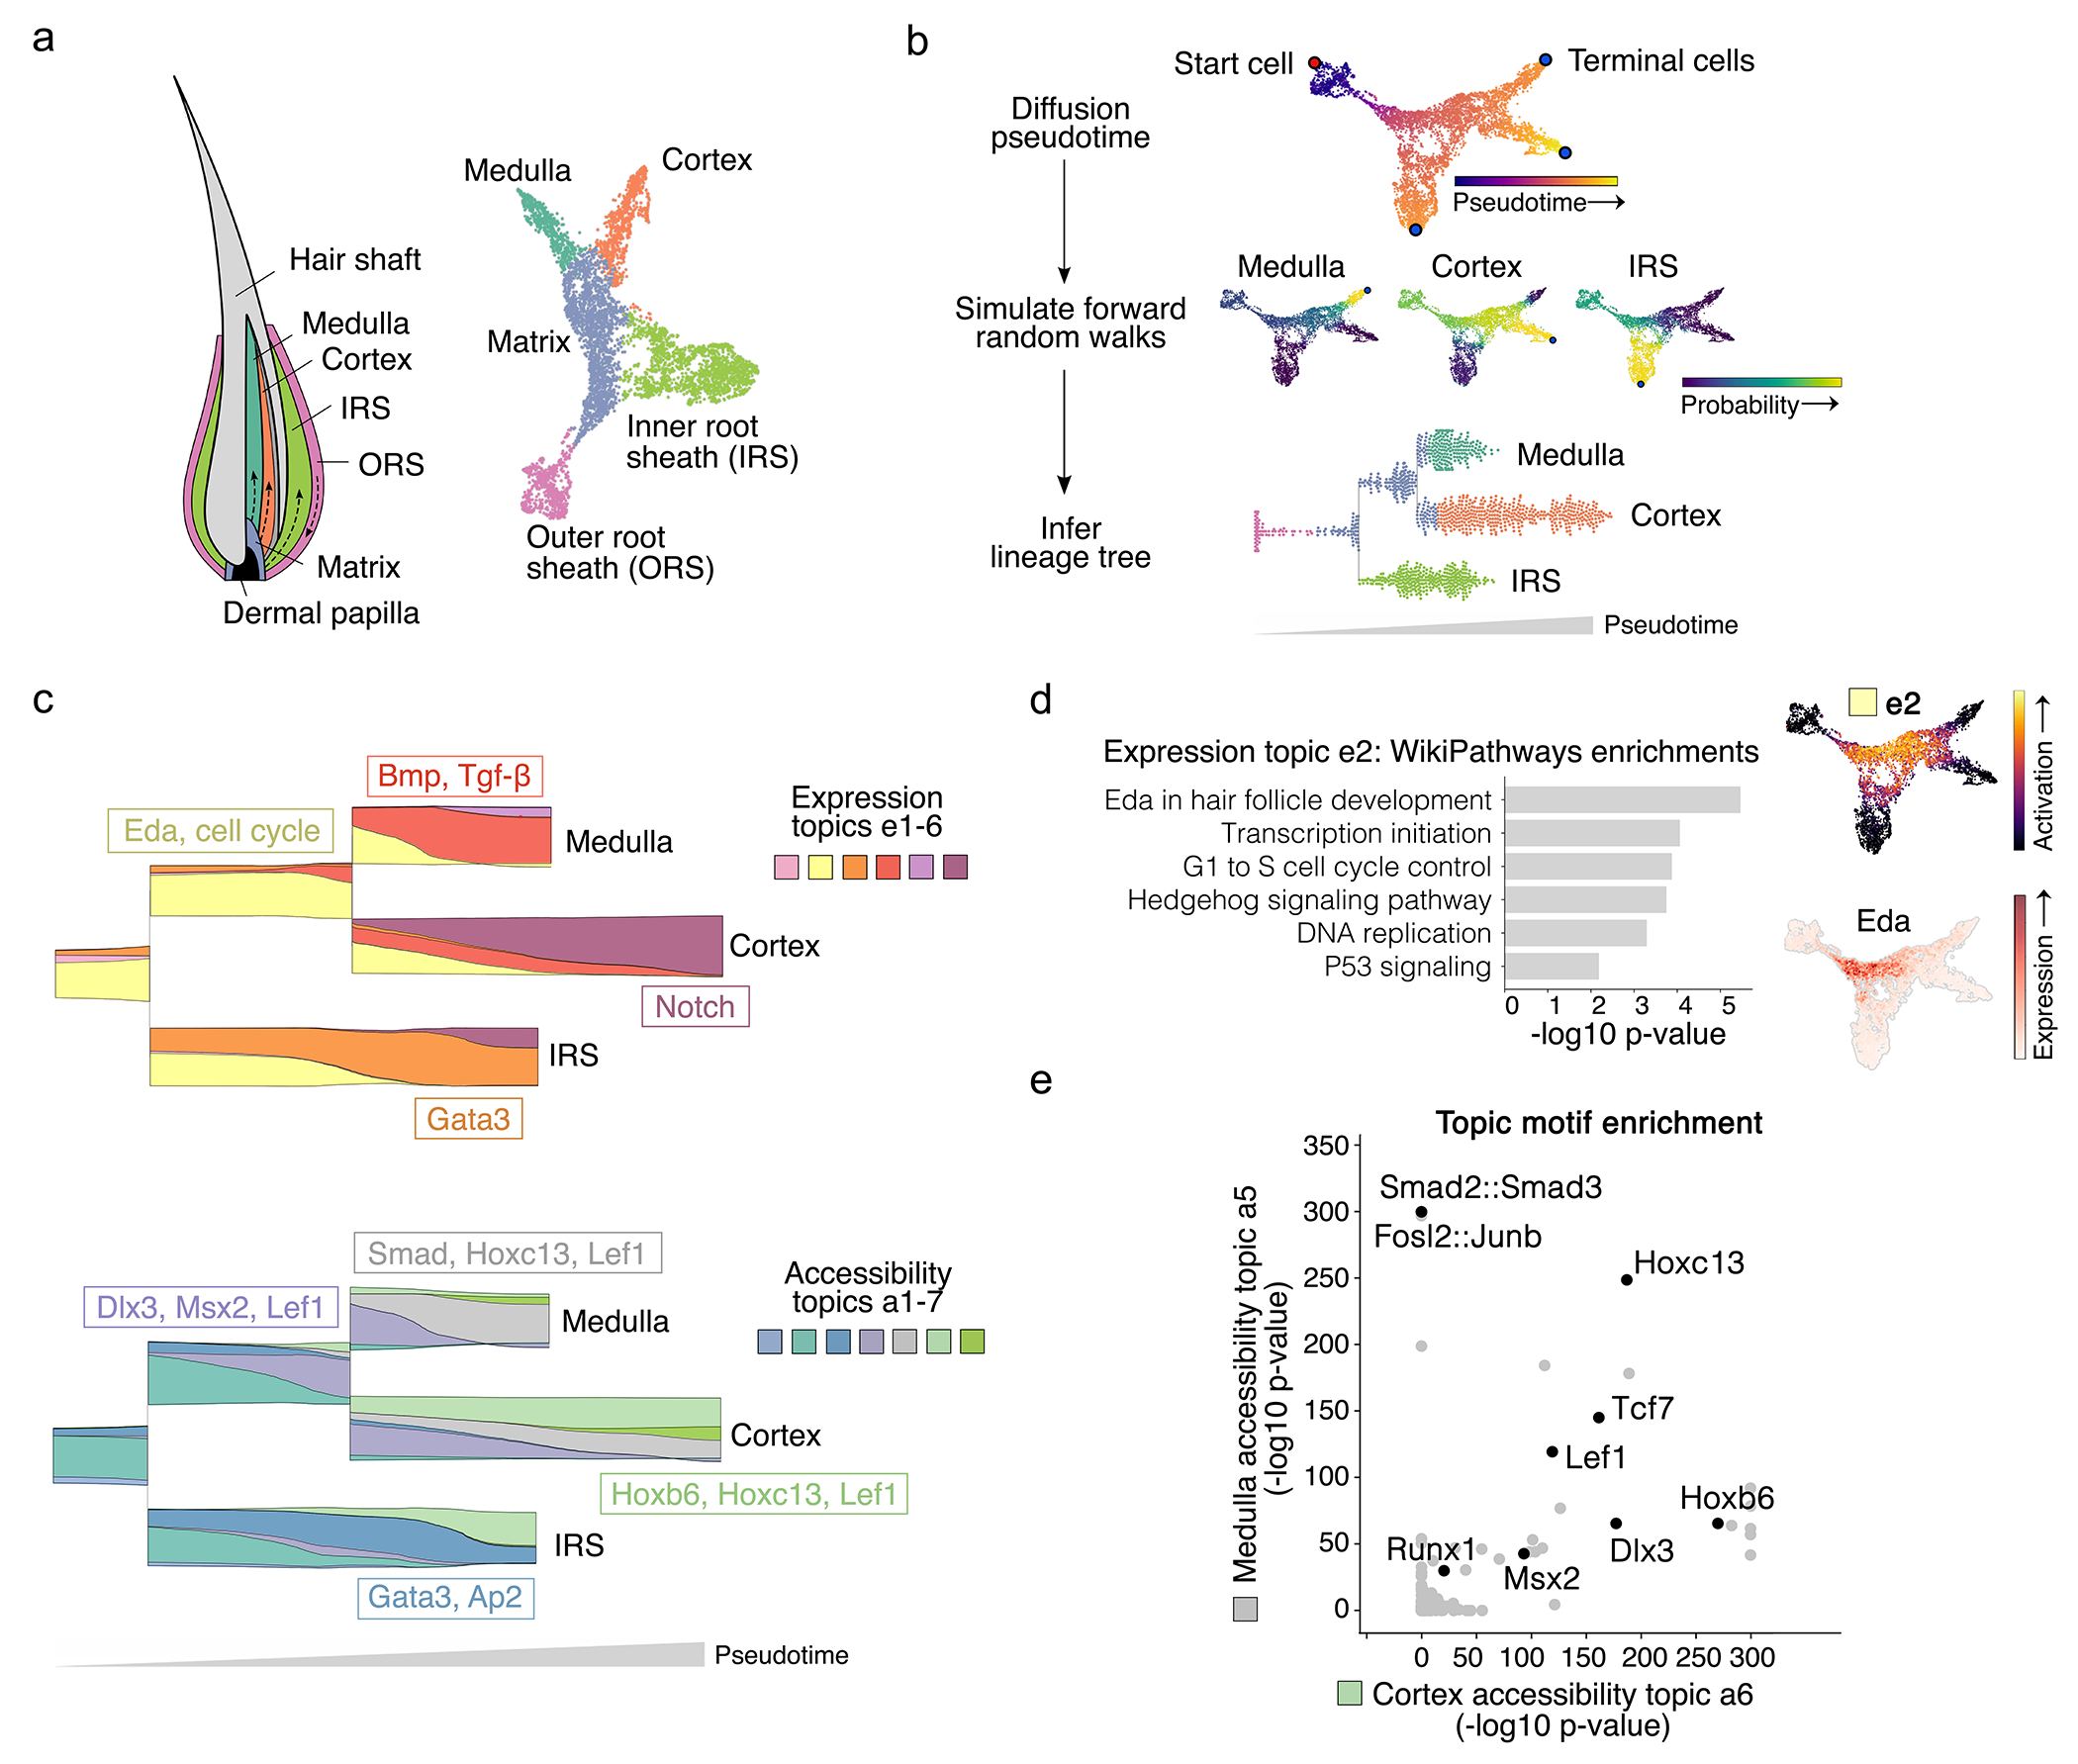
a, MIRA’s joint topic representation constructed a UMAP (right) whose structure mimicked the true spatial layout22 (left) of the progenitor matrix cells and descendant medulla, cortex, and IRS lineages in the hair follicle. Colors indicate cell types defined by fine Leiden clustering followed by agglomeration of clusters based on known marker gene expression. b, (top) Diffusion pseudotime through joint KNN graph representing differentiation progress. Terminal cells were identified using stationary states from a forward Markov chain model of differentiation. (middle) Each cell’s probability of reaching each terminal state. (bottom) Parsed bifurcating tree structure of cell state probabilities visualized as stream graph. Each point is an individual cell arranged as a swarm plot (arranged such that points do not overlap, resulting in larger spread where there are more points). Cells are colored by clusters in 2a, indicating that bifurcation points closely correspond to changes in cell identity as separately defined by markers for each cell type. c, Stream graph of window-averaged cell-topic compositions as cells progress through differentiation starting from matrix cell state (see Extended Data Fig. 6a for stream graph including outer root sheath (ORS); topics that comprise ≥3% of the total at any point are shown). Representative genes activated in expression topics and motifs enriched in accessibility topics are depicted in boxes corresponding with the color of the source topic. Accessibility topic a4 described a transitory accessibility state at the branch point between the medulla and cortex lineages without a corresponding expression topic, suggesting global chromatin remodeling in progenitor matrix cells preceded transcriptional alterations specifying each downstream lineage. d, (left) Gene set enrichment for progenitor matrix cell expression topic e2. (right) Expression topic e2 activation or Eda expression on UMAP of joint topic representation. e, Comparison of motif enrichment in top peaks of medulla versus cortex accessibility topics (a5 and a6, respectively).
MIRA contrasts the flow of expression and accessibility topics across the inferred cell state tree using stream graphs24 to expose the regulatory modules driving cell fates along distinct paths (Fig. 2c; Extended Data Fig. 6a–b, Supplementary Table 1–2). Stream graphs enable high-dimensional, multimodal comparisons along continuums. Expression topic e2 captured the transcriptional state governing progenitor matrix cells, including cell proliferation25 and Eda and Shh signaling22,26 (Fig. 2d). Thereafter, expression topic e6 described cortex specification corresponding with activation of Notch-associated factors27. Conversely, expression topic e4 characterized medulla specification, containing Bmp/Tgf-β-associated factors22 aligned with enrichment of Smad5/Smad2/3 motifs in medulla-specific accessibility topic a5 (Fig. 2e, Extended Data Fig. 6c). Comparison with cortex-specific accessibility topic a6 showed both lineages were enriched for motifs bound by canonical hair shaft regulators Lef1 and Hoxc22, with expression implicating the influence of Hoxc13 (Extended Data Fig. 7a).
Contrasting modalities, Wnt-driven accessibility topic a4 described a transitory accessibility state at the branch point between the medulla and cortex lineages without a corresponding expression topic (Fig. 2c, Extended Data Fig. 7b–c). Cell-level chromatin remodeling in progenitor matrix cells thus preceded transcriptional alterations specifying each downstream lineage.
MIRA RP modeling distinguished LITE versus NITE genes in the hair follicle
While most genes in the hair follicle exhibited LITE regulation with local accessibility increasing synchronously with transcription, expression diverged from that predicted by the LITE model for genes such as Krt23 (Fig. 3a–d, Extended Data Fig. 7d–e). Although local chromatin accessibility was poorly predictive of Krt23 expression, its transcription was lineage-specific and closely aligned with activation of accessibility topic a5, encoding a medulla genome-wide pattern of accessibility. Consistently, Krt23 expression was more closely predicted by the NITE model which includes these genome-wide accessibility states as features (Fig. 3e). LITE genes are thus tightly regulated by local chromatin remodeling, whereas NITE genes are titrated without requiring extensive local chromatin remodeling, decoupling transcription from local accessibility (Fig. 3f).
Fig. 3 |. MIRA RP modeling identified genes for which changes in expression were insufficiently explained by local chromatin accessibility.

a, LITE gene Braf or b, NITE gene Krt23 expression or local-only RP model predictions (LITE model) on joint representation UMAP. c, LITE gene Braf or d, NITE gene Krt23 locus’s chromatin accessibility fragments across pseudotime (moving downwards) in trajectories from ORS to matrix to cortex (top) or medulla (bottom). Colored bars on the right indicate the identity of cells (colored by clusters in 2a) within each bin reflected by each row of accessibility fragments. Line plots across pseudotime depict the indicated gene’s observed expression (red) and LITE model prediction of expression (black), which is informed by the local accessibility reflected in the fragment plot. While the observed expression and LITE model prediction align for LITE gene Braf, they diverge for NITE gene Krt23. e, Joint representation UMAP colored by (left) Krt23 NITE model prediction or (right) medulla accessibility topic a5 capturing a genome-wide chromatin state. NITE model predictions were more closely aligned with Krt23 expression shown in 3b. f, Proposed mechanism of LITE versus NITE regulation. In LITE regulation, expression is tightly regulated by chromatin remodeling. In NITE regulation, binding of an additional factor is required to enact transcription. g, LITE gene Braf or h, NITE gene Krt23 LITE versus NITE model predictions (cells colored by gene expression) and “chromatin differential” (relative prediction of LITE versus NITE models). In chromatin differential plots, red indicates LITE model overestimates expression while blue indicates LITE model under-estimates expression relative to NITE model.
MIRA’s “chromatin differential” mapped the extent to which local accessibility was decoupled from transcription across the developmental trajectory (Fig. 3g–h). Although Krt23 local accessibility increased at the branch point between the medulla and cortex lineages and remained elevated in both, it was ultimately only highly expressed in the medulla, causing high chromatin differential that over-estimated its expression in the cortex. Krt23’s lineage-specific expression despite accessibility in both lineages suggests its activation requires addition of a factor that does not primarily impact transcription via remodeling local accessibility.
MIRA analysis of NITE regulation elucidated hair follicle fate commitment mechanism
At the cell level, gene expression in terminally-differentiated medulla and cortex cells exhibited significantly more NITE regulation than gene expression earlier in hair follicle differentiation (p<0.05, Wilcoxon) (Fig. 4a, Extended Data Fig. 7f). Often, accessibility of terminally-expressed genes increased before fate commitment and was maintained in both subsequent lineages, but expression activated in a lineage-specific manner only after the branch point between medulla and cortex (Fig. 4b–c, Extended Data Fig. 7g). We used chromatin differential at the branch point to identify genes with these “branch-primed” dynamics. While priming suggests the inevitability of expression, these genes indicate subsequent expression at primed loci can be conditional, a pattern detected as strong NITE regulation.
Fig. 4 |. Gene-level and cell-level analysis of NITE gene regulation in the hair follicle elucidated regulatory mechanisms of fate commitment.

a, NITE regulation score of each cell. b, Stream graph contrasting expression versus LITE model prediction (which represents local accessibility) of NITE gene Rnaset2b. When the lines diverge, this indicates that observed expression or local accessibility is changing in a way that is not coordinated with the other, drawing attention to genes whose expression is regulated by mechanisms not solely determined by local chromatin accessibility. c, (left) Regulatory classifications of medulla or cortex terminally expressed genes based on expression and local chromatin accessibility at the branch point between medulla and cortex lineages. Classifications colored green or orange by whether the genes were significantly upregulated in the medulla or cortex cells, respectively. The High Expression-High Accessibility group is composed of medulla- or cortex-specific genes that are already highly expressed and accessible at the branch. The Low Expression-High Accessibility group, referred to as “branch-primed genes”, are medulla- or cortex-specific genes that are more accessible at the branch than would be expected based on their expression at the branch. They subsequently increase in expression levels after the branch in one of the two lineages. The Low Expression-Low Accessibility group, referred to as “terminal genes”, are medulla- or cortex-specific genes that are not yet expressed nor accessible at the branch. Only after the cells have committed to one of the two fates do these genes become expressed and accessible in that lineage. (right) Example of each classification. d, Interaction between gene-level regulation and cell-level topics. (top) Expression of branch-primed cortex genes increased after branch, correlating with expression topic e6. (bottom) LITE model prediction (local chromatin accessibility) of branch-primed genes increased before cortex commitment, correlating with accessibility topic a4. e, Driver transcription factor analysis of branch-primed medulla versus cortex genes. f, Model for regulation of fate commitment in hair follicle depending on activation of distinct signaling pathways. Accessibility topic a4 opens chromatin around branch-primed genes at branch point between lineages. Depending on signal, branch-primed lineage-specific genes are expressed, enforcing lineage commitment.
Cell-level topic modeling also supported the pattern of primed accessibility preceding fate commitment. For example, the dynamics of genes ultimately expressed in the cortex whose accessibility was primed at the preceding branch point were described by cortex-specific expression topic e6 and branch-spanning accessibility topic a4 (Fig. 4d). As previously noted, accessibility topic a4 described a cell-wide change in chromatin state that did not correspond with a synchronous change in expression topic influence.
Branch-primed genes that were subsequently conditionally expressed in medulla or cortex appeared to respond to a regulator of medulla or cortex fate commitment. MIRA pISD implicated Notch effector Rbpj as a top regulator of branch-primed cortex genes and Bmp/Tgf-β-induced Smad5/Smad2/3 as regulators of branch-primed medulla genes (Fig. 4e, Extended Data Fig. 7h), consistent with expression of genes associated with these factors’ induction (Extended Data Fig. 6b). Thus, MIRA determined that cells at the branch point have a chromatin state permissible to multiple fates, described by transitory accessibility topic a4, ultimately driven to medulla or cortex through the subsequent addition of a fate-defining signal, namely Bmp/Tgf-β or Notch22,27,28 (Fig. 4f).
Overall, leveraging MIRA to systematically contrast expression and accessibility at single cell and locus resolution in the hair follicle revealed the fate commitment mechanism regulating the medulla and cortex lineages.
MIRA captured two distinct spatiotemporal axes of differentiation in the interfollicular epidermis
We next applied MIRA to a separate system in the same dataset3, the interfollicular epidermis (IFE). Two spatial axes of differentiation specify the IFE, one controlling the differentiation of basal stem cells into increasingly superficial epidermal layers (epidermal stratification axis) and another controlling basal cell invagination and follicular formation (follicular axis)29 (Fig. 5a). The latent structure of MIRA’s joint topic representation again mimicked the spatial layout of this differentiation system, reconstructing the two axes of differentiation (Fig. 5b, Extended Data Fig. 8–9).
Fig. 5 |. MIRA joint representation reconstructed complex multi-axis differentiation in the IFE.

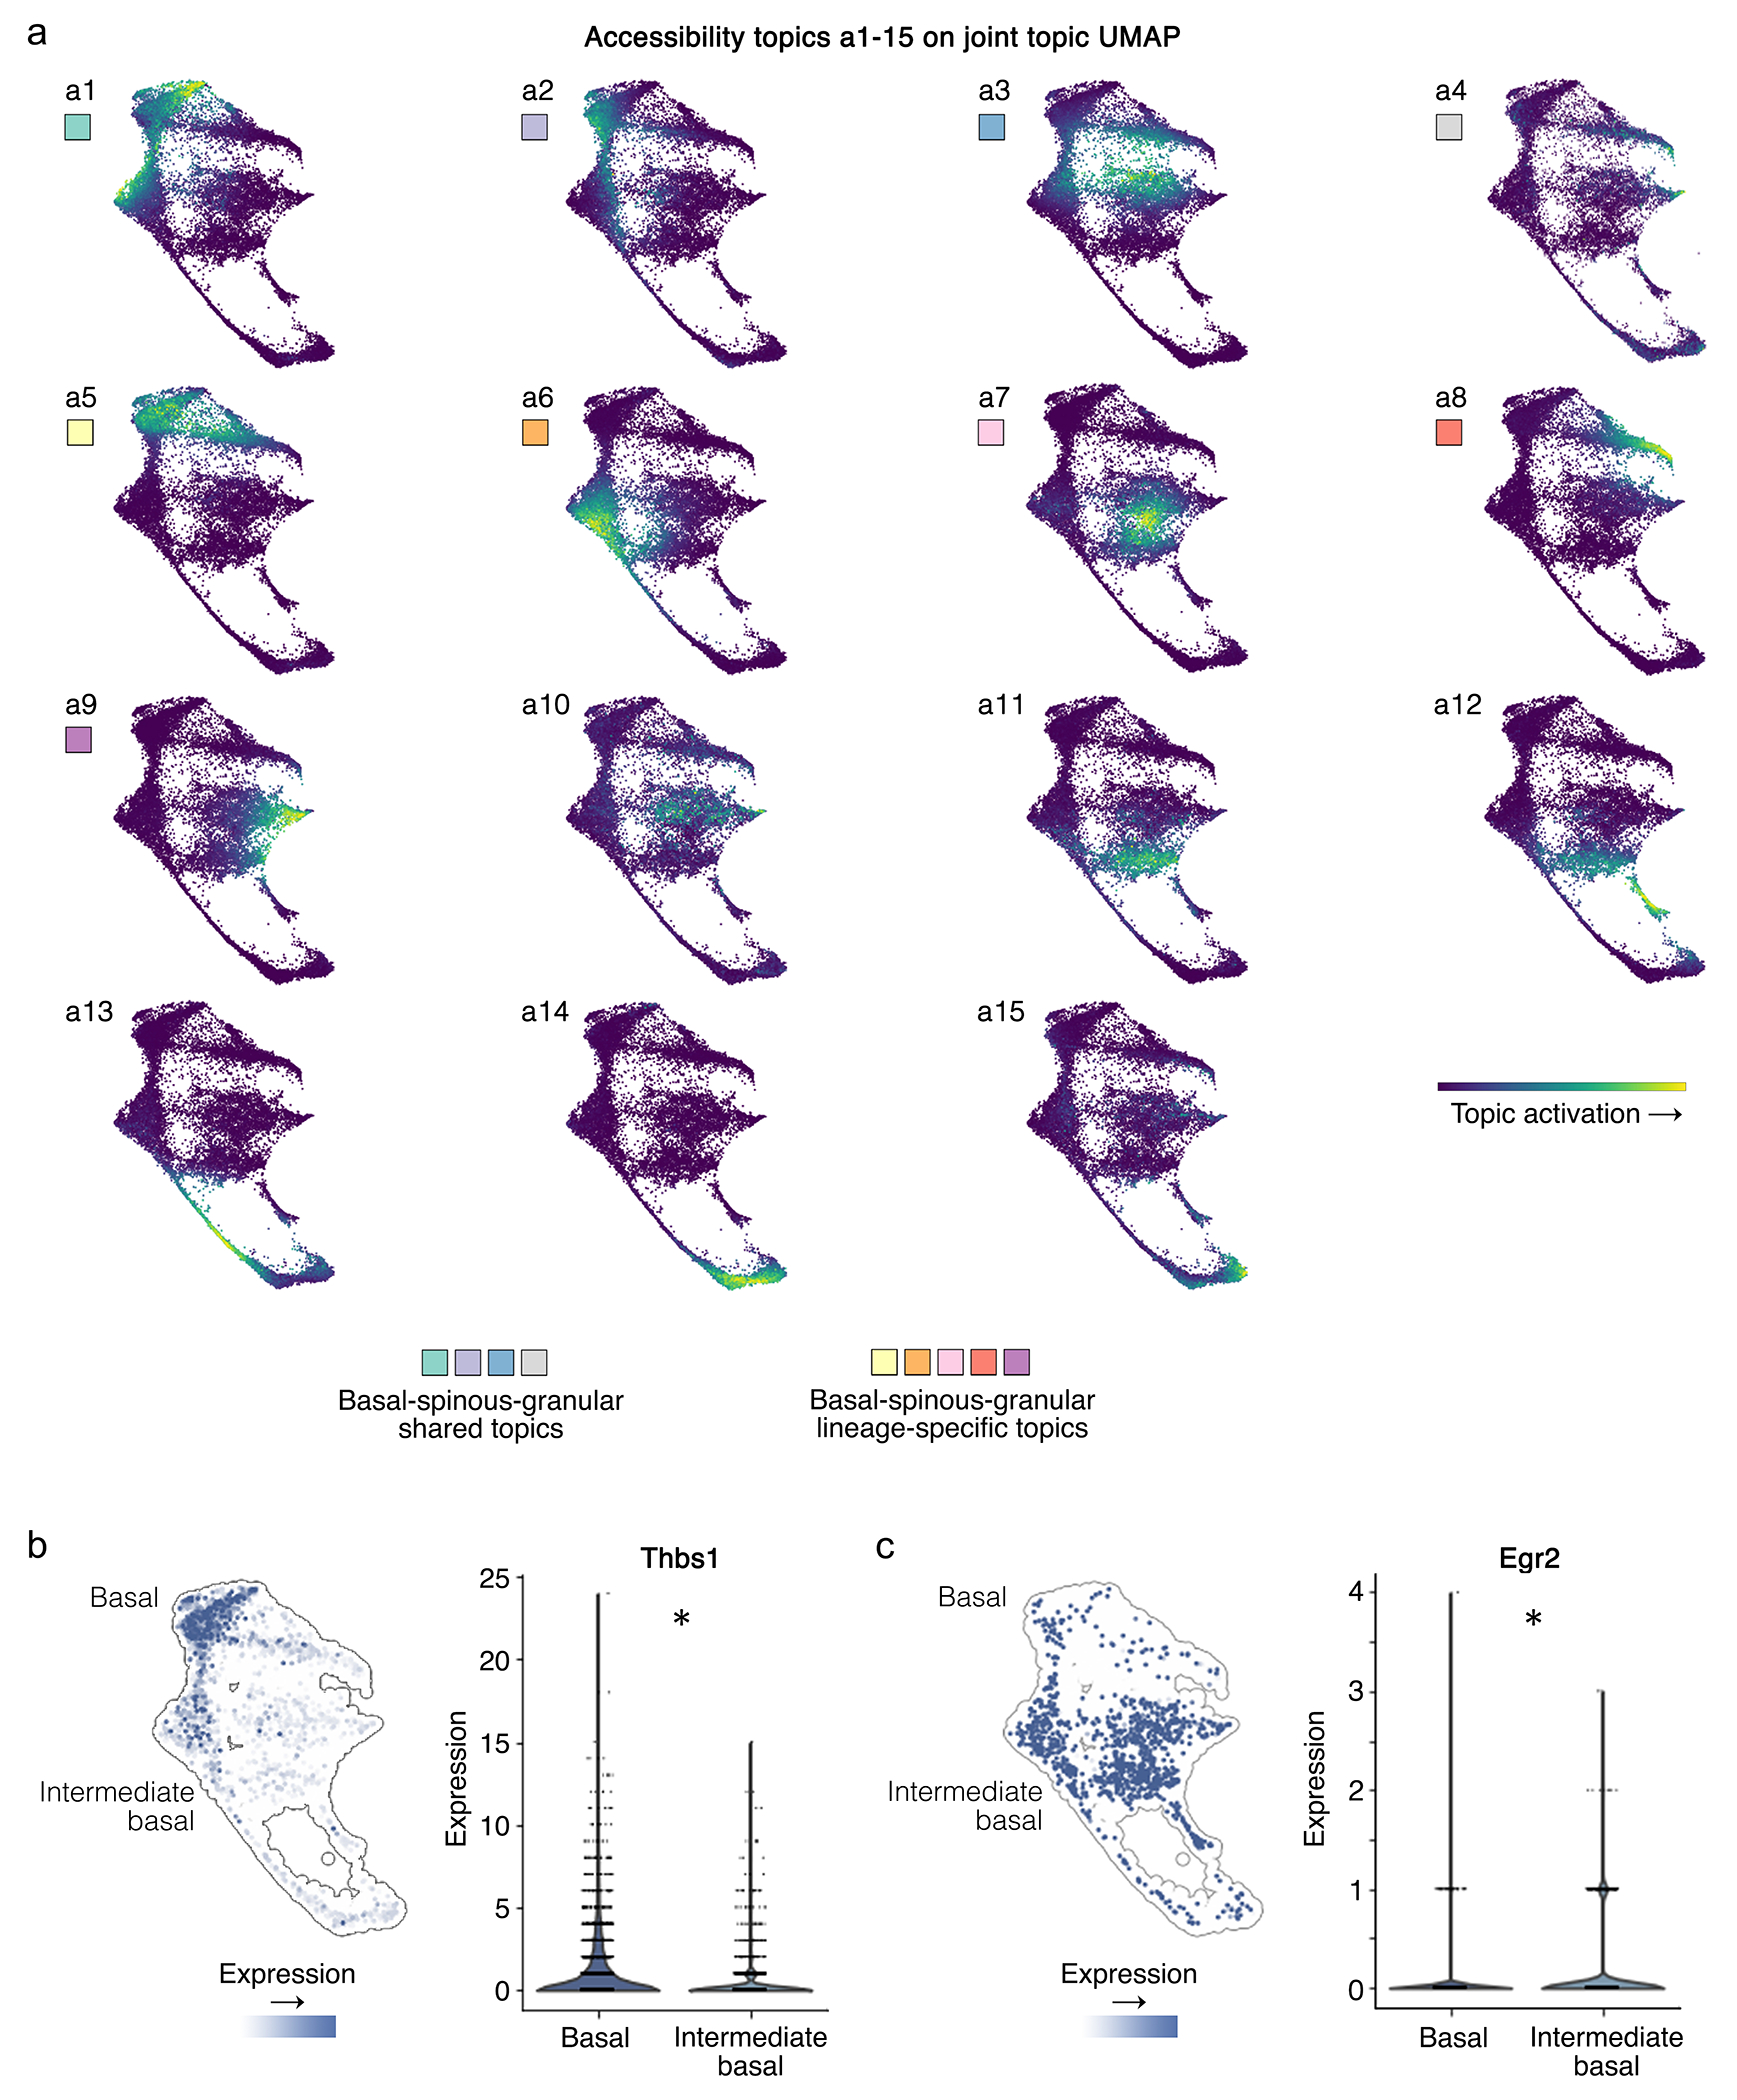
a, Anatomical model of mouse keratinocyte differentiation along epidermal and follicular axes. b, UMAP calculated from MIRA joint expression and accessibility topic representation. Dotted lines show constructed cell state structure resulting from two axes of differentiation. c, UMAP calculated from MIRA expression topics alone. d, UMAP calculated from MIRA accessibility topics alone. e, Activation of intermediate granular expression topic e8 on joint representation UMAP. f, Gene Ontology (GO) enrichment of top genes from intermediate granular expression topic e8. g, Two separate terminal states were identified from the Markov chain model of differentiation starting from basal cells labeled “Start state”. h, Stream graph of accessibility topic compositions of basal-spinous-granular (top) and intermediate basal-spinous-granular (bottom) lineages. Top enriched factors shown in boxes with color indicating source topics. i, NITE regulation score of each cell in the IFE.
Furthermore, unlike prior reported analysis of this dataset3 that did not jointly model expression and accessibility, MIRA identified two distinct basal-spinous-granular trajectories. One trajectory, labeled “intermediate”, was more transcriptionally and epigenetically similar to upper hair follicle structures, suggesting these cells were spatially proximal to the hair follicle and subject to more pro-follicular regulation. These “intermediate” basal cells showed activation of Egr2 expression and motifs, previously implicated in epidermal proliferation and wound healing30 (Extended Data Fig. 9b–c). By contrast, basal cells distant from the hair follicle showed stronger expression of Thbs1, consistent with prior work29 that identified two distinct populations of basal cells with Thbs1 marking those distant from the hair follicle. Each of these two distinct basal cell niches produced their own columns of epidermal strata, which was captured by MIRA joint modeling.
Notably, the UMAP projection based only on expression obfuscated these distinct trajectories (Fig. 5c). RNA features were sufficient to distinguish the multi-stage transitions governing each basal-spinous-granular transformation but could not detect the lineage histories of each population. The accessibility-only representation, however, successfully aligned cells along lineages according to their distinct epigenetic characteristics (Fig. 5d). Projected together, the joint representation preserved the structure of the accessibility mode while integrating information of shared transcriptional identity from expression topics (Fig. 5b). In particular, expression topic e13 established cells with granular identities and captured co-upregulation of hallmark genes29 marking epidermal terminal differentiation (Fig. 5e–f).
The cell state tree inferred from the joint topic representation revealed both the shared and lineage-specific regulators shaping the spatial programs of the two basal-spinous-granular trajectories (Fig. 5g–h; Extended Data Fig. 10a, Supplementary Table 3–4). Visualizing state changes through accessibility topics identified the shared regulatory influence of Hes on basal cells, followed by Pou2f3 on spinous cells and terminating in Grhl and C/ebp23,31 on granular cells in both trajectories. By contrast, lineage-specific accessibility topics distinguished the influence of Klf4 motifs23 in “intermediate” spinous and granular cells, as opposed to Gata3 influence32 in granular cells arising from Thbs1+ basal cells more distant from the hair follicle.
We observed that expression in terminal populations was significantly enriched for NITE regulation, especially in terminal genes differentially-expressed between lineages (p<0.05, Wilcoxon) (Fig. 5i, Extended Data Fig. 10b–d). Again, terminal fate chromatin accessibility appeared to specify the available cell states, while transcription ultimately depended on additional spatial or signaling queues. Overall, MIRA elucidated the shared and lineage-specific mechanisms of differentiation along two parallel trajectories with distinct spatial regulation within the IFE.
MIRA elucidated regulators driving key fate decisions in embryonic brain development
We next applied MIRA to an E18 mouse embryonic brain dataset including cortex, hippocampus, and ventricular zone (assayed on a different platform, 10x Genomics Multiome)14 to determine the key factors driving astrocyte, excitatory neuron, and inhibitory neuron fates, the balance of which is critical for normal brain development. MIRA topic modeling constructed a joint representation with Pax6+ radial glia-like cells located centrally between the astrocyte, excitatory neuron, and inhibitory neuron branches (Fig. 6a–b). Pax6 marks both dorsal progenitors that give rise to astrocytes and excitatory neurons and the anatomically juxtaposed ventral progenitors in the lateral ganglionic eminence that give rise to inhibitory neurons33,34. Both of these progenitor populations were present within the 10x Genomics dataset and co-located within the joint representation due to their shared transcriptional state (see Supplementary Fig. 2 for further discussion). MIRA topic analysis revealed the regulators driving the fate decision between astrocytes and excitatory neurons and furthermore identified regulators that contribute to the rise of excitatory versus inhibitory neurons from anatomically separated progenitors with a similar transcriptional state (Fig. 6c, Supplementary Fig. 3–5).
Fig. 6 |. MIRA elucidated regulatory factors driving fate decisions in key developmental trajectories in the developing brain.

a, Expression of marker genes for progenitor Pax6+ cells and terminal states of astrocytes, excitatory neurons, or inhibitory neurons. b, MIRA joint representation UMAP colored by inferred cell states. Mixed progenitor cells include both excitatory and inhibitory progenitors, which are transcriptionally similar. (See Supplementary Fig. 2). c, Stream graphs of expression and accessibility topic activation across cell state trajectory. Pathways activated in expression topics and motifs enriched in accessibility topics are indicated by topic color. d, Motif score of Rbpj and Neurog2 on joint representation UMAP. e, Motif score of Rbpj and Neurog2 in the indicated cell states (*p<0.05, two-sided Wilcoxon rank-sum compared to progenitors (including mixed progenitors), Benjamini-Hochberg-corrected; Rbpj: astrocyte vs. progenitors p=3e-26, excitatory vs. progenitors p=3e-97; Neurog2: astrocyte vs. progenitors p=3e-39, excitatory vs. progenitors p=5e-98; all adjusted p-values~0). f, Activation level of Ascl1 versus Neurod1 motif scores in each single cell along cell state trajectory. g, GO terms enriched in top 500 genes with NITE regulation where local chromatin accessibility state is insufficient to predict expression. h, Correlation of LITE versus NITE model predictions of expression of example genes with LITE versus NITE regulation.
MIRA analysis revealed that astrocytes were defined by accessibility topic a1, which was significantly enriched for Rbpj motifs associated with Notch signaling (Fig. 6c–e, Supplementary Table 5–6). Rbpj motifs were also enriched in Pax6+ progenitors, but significantly depleted from the excitatory neuron branch. Conversely, early excitatory accessibility topic a6 was significantly enriched for Neurog2 and Neurod1 motifs. These findings are consistent with prior developmental studies indicating that Notch signaling maintains progenitor multipotency and specification towards astrocytes while Neurog2 and Neurod1 commit cells to the excitatory neuron fate35–37.
We then investigated how anatomically separated progenitors with a shared transcriptional state differentially give rise to excitatory versus inhibitory neurons. The major expression topic e3 defining both trajectories was enriched for cell cycle genes, likely reflecting the expansion of progenitors prior to commitment to their terminal neuron fates38 (Supplementary Fig. 5, Supplementary Table 5). Subsequent inactivation of cell cycle topic e3 aligned with activation of accessibility topic a2, which was enriched for motifs of Ascl1, a pioneering transcription factor in neural progenitors known to promote cell cycle exit and differentiation38 (Fig. 6c and f; Supplementary Fig. 5, Supplementary Table 6). Ascl1 motifs were also enriched in the early inhibitory accessibility topic a4, consistent with Ascl1’s key role in inhibitory neuron differentiation37.
In the alternative trajectory towards the excitatory fate, early excitatory accessibility topic a6 demonstrated depletion of Ascl1 motifs coordinated with increased Neurod1 motifs (Fig. 6c and f, Supplementary Table 6). Ascl1 and Neurod1 belong to separate subgroups of basic helix-loop-helix transcription factors39; and Neurod1 promotes differentiation of induced pluripotent stem cells into excitatory neurons, while Ascl1 specifies inhibitory neurons37.
MIRA topics contrasted the temporal progression of specification initiated by inhibitory-driving Ascl1 or excitatory-driving Neurod1. The inhibitory trajectory activated inhibitory maturation-driving Bdnf signaling40, culminating in the activation of GABA synapse components that define the terminal inhibitory fate (topic e13) (Fig. 6c; Supplementary Fig. 5, Supplementary Table 5–6). Consistently, aligned terminal inhibitory accessibility topic a10 was enriched for Egr1 motifs, a downstream Bdnf effector that directly activates GABAergic neurotransmission genes41.
The diverging excitatory branch first activated mitochondrial components important for supporting neuronal metabolic demands42 (topic e14) followed by terminal activation of glutamatergic synapse machinery, including glutamate transporters which uniquely distinguish excitatory neurons (topic e20) (Fig. 6c; Supplementary Fig. 5, Supplementary Table 5). Aligned terminal excitatory accessibility topic a13 was enriched for Mef2 motifs attributable to Mef2c given its expression in the excitatory branch, consistent with its known role in maintaining the excitatory/inhibitory balance by promoting excitatory differentiation43 (Fig. 6c; Extended Data Fig. 10e, Supplementary Table 6).
In summary, contrasting expression and accessibility topics on MIRA’s joint representation identified regulators driving key cell fate decisions in the developing brain and demonstrated the temporal progression of specification into inhibitory or excitatory neuronal fates.
MIRA revealed LITE and NITE genes in the embryonic brain
To determine LITE and NITE genes in the embryonic brain, we trained MIRA RP models for the genes defining each expression and accessibility topic (Fig. 6g–h). Notable LITE genes included those encoding fate-driving transcription factors with tight spatiotemporal regulation such as progenitor gene Pax6 and excitatory-promoting Mef2c. Conversely, NITE genes were enriched for cell cycle machinery as well as neuronal differentiation gene batteries composed of neurotransmitter and ion channel genes. Local chromatin landscape has been previously reported to have limited contribution to the activation of cell cycle genes3, consistent with NITE regulation. This may reflect a requirement for titration of genes governing each cell cycle stage that would be incompatible with the time needed to remodel the local chromatin landscape. Similarly, synaptic maintenance and plasticity may require fast-response regulation of neurotransmitter and ion channel genes, reflected as NITE regulation.
Analogously to the hair follicle and IFE, expression topics describing progenitors were significantly enriched for LITE regulation, whereas after commitment to the excitatory or inhibitory fate, topics were significantly enriched for NITE regulation (p<0.05, Wilcoxon) (Extended Data Fig. 10f). Progenitor and early inhibitory regulator Ascl1 is known to be a pioneering transcription factor that remodels the chromatin landscape to regulate its targets38,44. By contrast, terminal inhibitory regulator Egr1 was previously reported to have non-pioneer-like properties45. Notably, targets predicted by MIRA pISD to be downstream of Ascl1 demonstrated significantly stronger LITE regulation than predicted Egr1 targets, potentially reflective of local chromatin remodeling by pioneering Ascl1 driving their expression (p<0.05, Wilcoxon) (Extended Data Fig. 10g).
Discussion
In sum, MIRA leverages cell-level topic modeling and gene-level RP modeling to rigorously contrast the spatiotemporal dynamics of single cell transcription versus chromatin accessibility to reveal how these mechanisms interact to orchestrate key fate decisions in developmental trajectories. MIRA demonstrated the power of topic modeling of expression and accessibility data to infer high fidelity cell state trees that consistently outperformed standard alternatives in benchmarking. Mapping expression and accessibility topics onto MIRA’s joint cell state tree illuminated the key regulators driving fate decisions at pivotal trajectory branch points.
MIRA contrasted the dynamics of transcription and local chromatin accessibility to define the chromatin differential at each gene locus, revealing discrete gene modules regulated by primarily LITE or NITE mechanisms. Intriguingly, in all three systems that we tested from the skin3 and brain14 datasets, earlier-expressed genes were enriched for LITE regulation. LITE regulation of earlier-expressed genes may reflect the importance of strict regulation requiring extensive chromatin remodeling for their expression followed by strong silencing in fates where their aberrant expression would have devastating consequences. Conversely, gene batteries important for maintaining terminal cell function were less reliant on local chromatin remodeling for their regulation, suggesting larger influence by mechanisms such as cell signaling that allow titration of transcription to fulfill fluctuating cell needs.
Among NITE-regulated genes, we also noted genes with primed accessibility at trajectory branch points that showed subsequent lineage-specific activation in response to a fate-defining force such as signaling, presumably via binding or activation of a factor with minimal impact on local accessibility. In these cases, accessibility appeared to reflect a plastic cell identity encoding the available transcriptional states of the cell where ultimate transcription ensued in response to the cell’s spatial or signaling niche. Future work is warranted to further determine the logic of when cells employ LITE versus NITE mechanisms to regulate distinct cellular processes.
Of note, as with all approaches that model trajectories from single cell data, proper interpretation of the results requires an understanding of the biological system and the underlying model assumptions and limitations46. Trajectories inferred from single cell data do not necessarily reflect the clonal hierarchy of cells captured in traditional lineage tracing experiments47. For example, cells that are transcriptionally and epigenetically similar or following convergent developmental paths are assumed by the model to be nearby within the trajectory, even if they originate from disparate anatomical locations. Experimental approaches that retain the information of cells’ anatomical origins will be important to avoid co-location of cells that appear similar by the multimodal measurements presented to the model although they arise from different locations, as noted in the embryonic brain dataset analysis. Additionally, increased resolution of the data with more cells and more detected genes or accessible peaks may also reveal previously undetected cell states that will improve the accuracy and resolution of cell state tree inference. Finally, basic biological knowledge of the system of interest will ensure that the origin point of the trajectory is properly defined so that the directionality reflects the true biological progression through cell states. Future advances in experimental approaches and data resolution will thus further enhance the analyses made possible by MIRA.
In conclusion, MIRA leverages principled probabilistic cell-level topic modeling and gene-level RP modeling to precisely contrast the spatiotemporal dynamics of transcription and local chromatin accessibility at high resolution. MIRA thereby exposes the key regulators driving fate decisions at trajectory branch points and reveals the distinct circuitry regulating fate commitment versus terminal identity. MIRA thus represents a useful computational tool for deeply integrated analysis of the rapidly expanding wealth of multimodal data in the single cell field. Moving beyond visualization, MIRA enables rigorous interrogation of the transcriptional and epigenetic mechanisms interacting to drive dynamic biological systems.
Methods
Complete methods, including further details for the methods summarized below, are available in Supplementary Notes.
MIRA input data
The input data for MIRA is expression (raw gene count) and accessibility (binary peak count) matrices from multimodal RNA-sequencing (scRNA-seq) and Assay for Transposase-Accessible Chromatin-sequencing (scATAC-seq) in the same single cells.
MIRA topic model
Model architecture
The MIRA topic model is a generative probabilistic model where the cell’s observed features (transcript counts or accessible genomic intervals) are explained by hidden latent variables. Like Latent Dirichlet Allocation (LDA)1, we assume that the latent variables describing a cell’s state are sparse and compositional. As such, only a few latent variables are active in defining each cell state, and latent variables relate linearly to changes in the cell’s observed attributes. This constrains the model such that the latent variables decompose expression and accessibility into coherent, interpretable patterns of covarying features. Each latent variable thereby describes a “topic” of coregulated genes or co-accessible genomic loci and suggests that the genes and loci influenced by that topic share some underlying facet of regulation.
MIRA uses a variational autoencoding neural network2 (Extended Data Fig. 1) to discover latent topics from expression or accessibility data. From the input data (described above), the topic model learns a mapping from the data distribution to a latent representation for cells where is the unit interval [0,1] and where:
For matrices , let the notation indicate the matrix row indexed by and indicate the matrix column indexed by . We specify a sampling procedure such that is Dirichlet-distributed with a hierarchical prior controlling the pseudocounts allotted to each topic:
where is the initial pseudocounts allotted to the Dirichlet distribution and is the random variable controlling the sparsity of . The hyperprior enables data-driven tuning of topic sparsity to fit different patterns and modalities.
The latent representation of each cell represents the composition of topics that describe the expression or accessibility observations measured from that cell. We adapt the generative process used to model those measurements as a function of to account for the distinct statistical properties of each modality3,4. We denote the gene expression data matrix as , and specify a model such that each observation is independently drawn from the following generative process:
where is the predicted composition of expression across all genes in each cell and is the matrix linking gene expression to the influence of topics; and is the effective read depth of cell is a global variable determining the overdispersion of the negative binomial distribution for each gene across all cells.
For chromatin accessibility data, we model observations of accessibility across all regions given a cell using the multinomial distribution:
where is the predicted composition of accessibility across all regions in each cell; is the matrix linking accessibility to the influence of topics; and is the observed number of accessible peaks in cell . Thus, accessibility in a cell is generated by independent samples from the categorical distribution over regions.
In the generative process, the matrix encodes the linear associations between cell-level topics and features in expression or accessibility space. To find the features most strongly associated with a topic, MIRA calculates the normalized activation of a gene j (or congruently peak k) given topic t, scaling the value of the matrix using the learned batch normalization function’s feature-specific variance and bias parameters:
The top features most strongly associated with a topic are given by the top activation scores.
MIRA uses Enrichr5 to find overlaps between the top genes from expression topics and precompiled ontologies. MIRA annotates accessibility topics based on enrichment of predicted transcription factor (TF) binding sites in the top peaks versus the remaining peaks using the Fisher exact test6.
Stochastic variational inference
Given the observations from cells, or as , MIRA finds topics ; batch normalization parameters and ; dispersions (only for expression data); as well as cell-level latent representations , such that the probability of observing the data is maximized given those parameters and conditioned on the latent space:
The integral for the marginal likelihood of the model is intractable, so MIRA employs the variational autoencoder approach2, which approximates the distribution using the variational distribution , to estimate the likelihood via Bayes rule. Parameter values are learned by maximizing the ELBO objective, a lower bound on the marginal likelihood, implemented by Pyro. The variational distribution conditioned on the observations , is represented by an encoder neural network with weights :
For observations from cell , the encoder outputs and , which parameterize a logistic-normal distribution from which samples for are drawn using the “reparameterization trick”. MIRA reparametrizes the Dirichlet prior using normal distributions, as implemented by ProdLDA7, enabling Pyro to find unbiased Monte Carlo estimates of the ELBO expectation’s gradient2.
Joint representation
The topic composition of cell is given by the expected value of the variational approximation of the posterior of , denoted :
where is the variational distribution parameterized by the encoder neural network conditioned on the observed features of cell and mean is given by the output layer of the network. MIRA projects the -dimensional simplex space topic compositions for each cell to -dimensional real space using the isometric log-ratio transformation (ILR)8:
for
and
where is the geometric mean of the composition of , and is a Gram-Schmidt orthonormalized basis matrix derived from an arbitrary hierarchical relationship between topic compositions9. Transformation to -dimensional space by the matrix aligns topic activations along an orthogonal basis. To create a joint representation encoding information from both modalities, MIRA concatenates the isometric log-ratio transformed vectors for expression and accessibility topics into one vector representing the multimodal cell state, :
Using the Manhattan distance between cells in the joint space, MIRA constructs a k-nearest neighbors (KNN) graph where edges represent cells with similar transcriptional and accessibility states. Assuming transitions between topics capture major biological state changes, those changes would be aligned along the axes in orthonormal ILR-transformed space. The joint KNN graph may be used for clustering by the Leiden algorithm10 and low-dimensional visualization using UMAP11.
Pseudotime trajectory inference
Transport map construction
A transport map, or Markov chain model where is the unit interval [0,1], describes the transition probabilities between states as cells progress through some stochastic sequence of state changes (e.g., differentiation), where each state is represented by the measurements from a single cell:
Here, is the probability of transitioning from cell ’s state to cell ’s state after an arbitrary discrete time step. MIRA uses the Palantir algorithm12 to transform the undirected joint KNN graph describing cells in similar multimodal states into a directed transport map representing the stochastic transformation process starting from a chosen origin cell, cell . Palantir also assigns a pseudotime to each cell based on the shortest path distance between origin cell and cell in the joint KNN graph. MIRA then finds stationary states in the Markov chain representing trajectory terminal states and again uses Palantir to assign to each cell a probability of reaching each trajectory’s terminal state following a random walk through the transport map. We denote the probability of reaching the terminal state from cell following a random walk through the joint space derived transport map as , where is the multimodal state representation of cell .
Cell state tree inference
MIRA extends the Palantir algorithm to find trajectories and branch points in bifurcating tree processes using Palantir’s terminal fate probabilities. First, a trajectory (commonly referred to as “lineage” in differentiation studies) is defined as the set of all cells for which the probability of reaching that trajectory’s terminal state is greater than or equal to the probability of reaching that terminus from the origin state :
The branch time between two trajectories with terminal states and is defined by:
First, all cells in trajectories and are merged into a combined set of cells, , then MIRA calculates , the log fold change of the ratios between the probability of reaching trajectory terminus versus trajectory terminus at cell relative to the probability at the start cell . The branch time between two trajectories is taken to be the pseudotime of the first cell where exceeds some threshold
To construct a bifurcating tree using these definitions, MIRA starts with all terminal states as disconnected leaves. MIRA first finds the branch times between all trajectories, and the trajectories with the latest branch point are merged to create a new super-trajectory, where each cell’s probability of reaching the terminus of the super-trajectory is . A node is added upstream connecting these trajectories’ terminal states with a branch point, and all cells in the trajectories with a pseudotime greater than the branch time are assigned to the appropriate child of the branch node depending on which trajectory they have more affinity to, determined by sign(). Then, MIRA recomputes branch times between the trajectories to account for the super-trajectory and again merges the last-branching trajectories. This process is repeated until all trajectories have been connected to the root node and all cells have been assigned to a node.
MIRA regulatory potential (RP) model
Model architecture
The MIRA RP model relates changes in local accessible chromatin to gene expression by learning upstream and downstream distances of perceived regulatory influence that maximize the probability of observing the expression data given the accessibility state in the same single cells. MIRA models the generative process of sampling expression counts for gene in cell given the accessibility state of the cell as:
For each cell and gene , the function takes as arguments: the genomic interval sets which filters peaks based on strand-oriented positional relationships upstream (), downstream (), or proximal () to the gene transcription start site (TSS); the accessibility state of each locus in a cell; non-negative and parameters that scale the relative effects of upstream (), downstream (), or proximal () accessibility (, respectively; the distances from the TSS of gene to the loci in the specified genomic interval set; and the decay rate parameters and .
The accessibility of each region in is weighted by its distance from the TSS in terms of the learned decay rate parameter , and the effects of all loci are summed together to summarize the cis-regulatory effect on gene expression. The accessibility state of loci in cell is taken to be the predicted compositional distribution given by the chromatin accessibility topic model, to reduce noise and normalize for differences in read depth of ATAC observations between cells. The upstream and downstream region sets encompass regions between 1.5 and 600 kilobases from the TSS; the proximal region is within 1.5 kilobases from the TSS. Regions within 1.5 kilobases of other genes are masked.
The and parameters affect the respective downstream () and upstream () decay rates of local chromatin accessibility’s influence on gene expression. The value of the parameter is the estimated distance, in kilobases, over which the influence of accessible sites on gene expression is halved, . The prior distribution reflects a priori information about the likely ranges of regulatory influence13,14, placing the mean decay distance at 15 kilobases and penalizing extreme ranges which suggest spurious long-range correlations. The model relates the cis-regulatory relationship to the observed expression data following the same generative statistical method as the expression topic model, with learned mean and bias parameters and , and dispersion parameter .
MIRA finds parameter values that maximize the probability of the observed expression given the accessibility state :
while adjusting for technical variation and noise between both assays to learn regulatory distances describing a gene’s the cis-regulatory relationship with local chromatin. MIRA employs variation inference to learn point estimates for each parameter (which are given delta distribution priors), taking gradient steps to maximize the ELBO objective using the Frozen-batch L-BFGS15 algorithm.
NITE model architecture
The RP model discussed above is defined as the local chromatin accessibility-influenced transcriptional expression (LITE) model. The LITE model learns a cis-regulatory relationship relating expression to local chromatin accessibility. The non-local chromatin accessibility-influenced transcriptional expression (NITE) model augments the LITE model with additional knowledge of cell-wide chromatin state through the incorporation of the MIRA latent accessibility topics as features. The specification of the NITE model follows the LITE model (see Regulatory Potential Modeling: Model architecture section) except for the inclusion of coefficients describing the relationship between cell-wide chromatin topics and expression:
For a given gene, MIRA first trains a LITE model, then seeds the variational distribution of the NITE model with the point estimates from the LITE model. Except for dispersion parameter , which is fixed to the value found by the LITE model, MIRA learns new values for each NITE model parameter using the same training process as the LITE model.
LITE vs. NITE regulation test
To test the ability for local chromatin to predict expression of a gene, we perform a likelihood ratio test16 between the LITE and NITE models, where the null hypothesis is that the LITE model, based only on local chromatin features, is sufficient to predict expression:
Here, is the likelihood of the expression predictions of model , the LITE or NITE model for that gene, given the observations of the expression of gene across all cells, where . The LITE and NITE models parameterize a negative binomial distribution of expression given the accessibility state of the cell. Thus, for model :
If the expression predictions of the NITE model parameters are more likely given the observed data than the LITE model predictions, this increases the test statistic. The test statistic is not directly comparable between genes due to differences induced by count variability, so we normalize all genes’ test statistics to remove this effect:
Due to properties of expression counts and the negative binomial distribution, both the LITE and NITE models predict zero counts for a gene with high probability. Thus, cells with no reads observed for a given gene are not as informative to the test, and genes which have a smaller fraction of zero counts have larger test statistics. To account for this, MIRA scales the test statistic for each gene based on the number of nonzero counts relative to the median nonzero counts across all genes tested to yield a comparable NITE score for each gene.
Cell NITE score
The cell NITE score is calculated similarly to gene NITE score, except the test is performed on rows of the expression matrix instead of columns:
Chromatin differential
The chromatin differential in cell for gene is given by:
which is the log-ratio of the compositional prediction of expression given by the LITE and NITE models.
Extended Data
Extended Data Fig. 1. Overview of MIRA topic model architecture.

a, The MIRA topic model uses a variational autoencoder (VAE) approach to learn stochastic mappings between observations in X-space, gene-counts or peak-counts in a cell, which are high-dimensional and noisy, and a simpler latent Z-space or topic space, which exists on the simplex basis with a Dirichlet prior. (bottom right) The generative model relates the observations X to the estimated composition ρ over features (genes or peaks), sampling a negative binomial distribution for RNA counts and a multinomial distribution for ATAC peaks. (top right) The composition over features is given by the topic matrix β encoding topic-feature associations and the latent topics Z of a cell, which are sampled from the distribution qϕ(Z|X), the variational approximation of pϑ(Z|X). (top left) The distribution of Z is parameterized by μ and σ2, outputs from the encoder neural network given the X-space observations as inputs. (bottom left) The encoder neural network for RNA data performs deviance residual featurization of counts which are passed through feed-forward layers. The ATAC data encoder passes binarized peak accessibility features through a deep averaging network. (Illustration adapted from Kingma and Welling, Foundations and Trends in Machine Learning, 2019). b, Ratio of probability of medulla fate commitment versus cortex commitment of each cell in the hair follicle, arranged by pseudotime. MIRA defines branch points between cell states where probabilities of differentiating into one terminal state diverges from another. c, MIRA joint representation UMAP colored by ratio of probability of medulla fate commitment within the ORS, matrix, medulla, and cortex populations. Differentiation in the hair follicle proceeds from ORS to progenitor matrix cells, which then specify into the medulla or cortex fate. (IRS cells indicated in black are not included in this trajectory).
Extended Data Fig. 2. MIRA outperforms standard methodology for resolving cell state trajectories using expression data alone.

Benchmarking results comparing MIRA to standard methodology of Seurat PCA+Slingshot in the indicated metrics of cell state trajectory inference using expression data alone. Top row shows ground truth scaffolds, which are computationally synthesized by mixing reads from distinct populations of single cells from a 10x Genomics dataset14 of peripheral blood mononuclear cells (PBMCs). Scaffold difficulty increases from left to right, where more difficult scaffolds contain cell states where mixture components are more similar (increased entropy), making them more difficult to distinguish by the tested lineage inference methodologies. Line plots indicate MIRA (red) versus Seurat PCA+Slingshot (blue) performance in each of the four scaffold difficulties with trials for three different mean read depths (lower read depth further increases the difficulty of solving the topology). For each trial, 5 replicates were tested for each modeling approach. Edge accuracy measures the accuracy of the inferred edges compared to ground truth (dynverse’s edge flip score48). Branch F1 score48 measures the precision and recall of the inferred branches compared to ground truth. Pseudotime correlation48 measures the correlation between inferred versus ground truth pseudotime for each cell. The bottom rows show example UMAPs for MIRA or Seurat PCA+Slingshot for each scaffold difficulty with black edges showing cell state parsing from each algorithm. Cells colored by ground truth branch assignment where blue cells are the origin state. In the line plots above, black outlines indicate the points for the models shown in the example UMAPs.
Extended Data Fig. 3. MIRA outperforms standard methodology for resolving cell state trajectories using accessibility data alone.

Benchmarking results comparing MIRA to standard methodology of Seurat LSI+Slingshot in the indicated metrics of cell state trajectory inference using accessibility data alone. Top row shows ground truth scaffolds with scaffold difficulty increasing from left to right. No models solved the topology of the most difficult scaffold using accessibility alone so metric comparisons are shown for the other three scaffolds. See Extended Data Fig. 3 for description of metrics.
Extended Data Fig. 4. MIRA outperforms standard methodology for resolving cell state trajectories using both expression and accessibility data jointly.
Benchmarking results comparing MIRA joint representation to standard methodology of joint representation combining Seurat PCA of expression data and Seurat LSI of accessibility data followed by Slingshot. See Extended Data Fig. 3 for description of metrics. For expression data, mean read depth n=4000; for accessibility data, mean read depth n=14000.
Extended Data Fig. 5. MIRA topics describing hair follicle cells were sparse and nonredundant.

a, UMAP based on standard methodology versus MIRA topic modeling for expression or accessibility. Standard PCA-based representation of expression shows matrix population as shifted away from its predecessor ORS and descendant IRS, medulla, and cortex cells. However, MIRA topic modeling of expression appropriately represents matrix cells as an intermediate population between the aforementioned lineages. Standard LSI-based representation of accessibility shows ORS cells interjected between matrix and its descendant IRS and shows medulla situated between two separate cortex populations. Conversely, MIRA topic modeling of accessibility appropriately represents matrix cells as continuous with its descendant IRS and better separates medulla and cortex into two distinct branches. b, MIRA joint topic representation of expression and accessibility. In (a-b), colors demonstrate expression of marker genes of indicated lineages. c, MIRA expression topics e1-6 and d, MIRA accessibility topics a1-7 on joint representation UMAP. In (c-d), colored boxes correspond to topic colors as on stream graphs in Fig. 2c and Extended Data Fig. 7a.
Extended Data Fig. 6. MIRA topics described gene modules activated in each lineage.

a, Stream graph of window-averaged cell-topic compositions starting from ORS cell state, progressing rightward through pseudotime (to facilitate visualization of all lineages concurrently, pseudotime scale is not log-transformed, unlike other presented stream graphs). b, MIRA joint topic representation colored by expression of genes highly activated in each of the indicated topics, which described the activated gene modules in each lineage. c, MIRA joint topic representation colored by indicated motif scores.
Extended Data Fig. 7. Terminal medulla and cortex cells showed significantly higher NITE regulation compared to cells earlier in hair follicle differentiation.

a, MIRA joint topic representation colored by expression of Hoxc genes, indicating that Hoxc motifs activated in both the medulla and cortex accessibility topics (a5 and a6, respectively) were most attributable to Hoxc13 based on its expression in these lineages. b, Correlation matrix between expression and accessibility topics. While some topics had a clear one-to-one correlation between modalities (e.g. expression topic e1 with accessibility topic a1), others did not strongly correlate with a single topic from the opposing modality (e.g. branch accessibility topic a4). c, Comparison of motif enrichment in top peaks of preceding matrix versus subsequent branch accessibility topics (a2 and a4, respectively). While most motifs were shared between these topics, accessibility of Wnt signaling-related motifs uniquely arose at the branch. d, Distribution of NITE scores among genes expressed in the hair follicle. Scores of example LITE gene Braf and NITE gene Krt23 are indicated by arrows. e, LITE gene Braf as shown in Fig. 3c but extended to include further downstream region. As described in Fig. 3c, plot shows chromatin accessibility fragments across pseudotime (moving downwards) in trajectories from ORS to matrix to cortex or medulla. Colored bars on the right indicate the identity of cells (colored by clusters in Fig. 2a) within each bin reflected by each row of accessibility fragments. Line plots across pseudotime depict the indicated gene’s observed expression (red) and LITE model prediction of expression (black), which is informed by the local accessibility reflected in the fragment plot. f, Medulla and cortex cells showed significantly more NITE regulation than other cells in the hair follicle (data are presented as mean values +/− standard deviation; rest n=4565, cortex/medulla n=1607; *p<0.05 (1.4e-13), two-sided Wilcoxon rank-sum). g, Genes ultimately expressed in medulla or cortex that were primed at the branch were defined as those with a NITE regulation score above the indicated thresholds that had positive chromatin differential at the branch, indicating that expression was overestimated based on local chromatin accessibility. Branch-primed genes must also be upregulated in the downstream lineage relative to matrix cells. h, Driver transcription factor analysis of non-primed medulla versus cortex genes.
Extended Data Fig. 8. MIRA expression topics describing IFE cells captured shared and lineage-specific states.

a, Expression of marker genes of indicated lineages on MIRA expression, accessibility, and joint topic UMAPs. b, MIRA expression topics e1-13 on joint representation UMAP.
Extended Data Fig. 9. MIRA accessibility topics describing IFE cells captured shared and lineage-specific states.
a, MIRA accessibility topics a1-15 on joint representation UMAP. Colored boxes correspond to topics indicated in Fig. 5h, which are shared or lineage-specific within the basal-spinous-granular or intermediate basal-spinous-granular differentiation trajectories as annotated in Fig. 5a–b. b, Thbs1 and c, Egr2 expression distinguished basal cells distant from the hair follicle from those within the intermediate basal-spinous-granular trajectory near the hair follicle (*p<0.05, two-sided Wilcoxon rank-sum, Benjamini-Hochberg corrected).
Extended Data Fig. 10. Terminal granular cells were enriched for NITE regulation.

a, Stream graph of expression topic compositions of basal-spinous-granular (top) and intermediate basal-spinous-granular (bottom) lineages. b, Terminal IFE granular cells showed significantly more NITE regulation than cells earlier in the differentiation trajectory (basal and spinous cells) (data are presented as mean values +/− standard deviation; basal and spinous n=10850, granular n=1596; *p<0.05 (1.5e-15), two-sided Wilcoxon rank-sum). c, Genes upregulated in granular cells that were differentially-expressed between granular populations had significantly higher NITE scores than other genes (data are presented as mean values +/− standard deviation; rest n=4641, terminal and differentially-expressed granular genes n=241; *p<0.05 (0.041), two-sided Wilcoxon rank-sum). d, Examples of terminally upregulated, differentially-expressed granular genes’ local chromatin accessibility (LITE model prediction) and expression. Despite accessibility increasing in both lineages, expression only increased in one lineage. e, Mef2c was more highly expressed in excitatory neurons, indicating that Mef2 motifs enriched in the terminal excitatory neuron topic were likely attributable to Mef2c. f, Stream graphs of expression topics across cells state trajectory colored by NITE versus LITE regulation of the top genes in each topic. Topics describing earlier states tended towards LITE regulation with the notable exception of topic e3, which is composed of cell cycle genes that have been previously described to be regulated with minimal influence of local chromatin accessibility state3. Topics describing terminal states tended more towards NITE regulation, including the major terminal excitatory and inhibitory neuron topics that are composed of neurotransmitter genes. Overall, expression topics describing the excitatory and inhibitory progenitor states (labeled mixed progenitor) were significantly enriched for LITE regulation, whereas after commitment to either the excitatory or inhibitory fate, topics were significantly enriched for NITE regulation (*p<0.05, two-sided Wilcoxon rank-sum, Benjamini-Hochberg corrected). g, Genes predicted by MIRA pISD modeling to be regulated by pioneer transcription factor Ascl1 showed significantly more LITE regulation compared to genes predicted to be regulated by non-pioneer-like Egr1 (data are presented as mean values +/− standard deviation; n=200; *p<0.05 (0.0464), two-sided Wilcoxon rank-sum).
Supplementary Material
Supplementary Table 1 (T1): Gene set enrichments of each MIRA expression topic in the hair follicle dataset. Indicated p-values by one-sided Fisher Exact test; adjusted p-values are Enrichr z-scores corrected for multiple comparisons.
Supplementary Table 2 (T2): Motif enrichments of each MIRA accessibility topic in the hair follicle dataset.
Supplementary Table 3 (T3): Gene set enrichments of each MIRA expression topic in the IFE dataset. Indicated p-values by one-sided Fisher Exact test; adjusted p-values are Enrichr z-scores corrected for multiple comparisons.
Supplementary Table 4 (T4): Motif enrichments of each MIRA accessibility topic in the IFE dataset.
Supplementary Table 5 (T5): Gene set enrichments of each MIRA expression topic in the embryonic brain dataset. Indicated p-values by one-sided Fisher Exact test; adjusted p-values are Enrichr z-scores corrected for multiple comparisons.
Supplementary Table 6 (T6): Motif enrichments of each MIRA accessibility topic in the embryonic brain dataset.
Acknowledgements
We thank the X. Shirley Liu Lab members, Matthew Oser, and Kai Wucherpfennig for helpful scientific discussions. This work was supported by the National Institutes of Health (NIH) grant U24 CA237617 to CAM. CVT was supported by NIH T32GM007748.
Competing interests
MB is a consultant to and receives sponsored research support from Novartis. MB serves on the SAB of H3 Biomedicine, Kronos Bio, and GV20 Oncotherapy. XSL conducted the work while being on the faculty at DFCI, and is currently a board member and CEO of GV20 Therapeutics.
Footnotes
The remaining authors declare no competing interests.
Code availability
MIRA is available as a Python package at https://github.com/cistrome/MIRA. Frankencell, a Python program we developed to generate synthetic differentiation trajectories for benchmarking, is available at https://github.com/AllenWLynch/frankencell-dynverse.
Reporting Summary
Further information on research design is available in the Nature Research Reporting Summary linked to this article.
Data availability
The authors of the SHARE-seq skin study3 provide the RNA-seq count matrix at https://www.ncbi.nlm.nih.gov/geo/query/acc.cgi?acc=GSM4156608 and the ATAC-seq peak count matrix at https://www.ncbi.nlm.nih.gov/geo/query/acc.cgi?acc=GSM4156597. 10x Genomics provides the brain dataset14 RNA-seq count matrix and ATAC-seq peak count matrix at https://www.10xgenomics.com/resources/datasets/fresh-embryonic-e-18-mouse-brain-5-k-1-standard-2-0-0. RNA-seq and ATAC-seq count matrices used for the benchmarking study may be found at https://www.10xgenomics.com/resources/datasets/pbmc-from-a-healthy-donor-granulocytes-removed-through-cell-sorting-10-k-1-standard-2-0-0.
References
- 1.Chen S, Lake BB & Zhang K High-throughput sequencing of the transcriptome and chromatin accessibility in the same cell. Nat. Biotechnol 37, 1452–1457 (2019). [DOI] [PMC free article] [PubMed] [Google Scholar]
- 2.Cao J et al. Joint profiling of chromatin accessibility and gene expression in thousands of single cells. Science 361, 1380–1385 (2018). [DOI] [PMC free article] [PubMed] [Google Scholar]
- 3.Ma S et al. Chromatin Potential Identified by Shared Single-Cell Profiling of RNA and Chromatin. Cell 183, 1103–1116.e20 (2020). [DOI] [PMC free article] [PubMed] [Google Scholar]
- 4.Zhu C et al. An ultra high-throughput method for single-cell joint analysis of open chromatin and transcriptome. Nat. Struct. Mol. Biol 26, 1063–1070 (2019). [DOI] [PMC free article] [PubMed] [Google Scholar]
- 5.Duren Z, Chen X, Xin J, Wang Y & Wong WH Time course regulatory analysis based on paired expression and chromatin accessibility data. Genome Res. 30, 622–634 (2020). [DOI] [PMC free article] [PubMed] [Google Scholar]
- 6.Gayoso A et al. A Python library for probabilistic analysis of single-cell omics data. Nat. Biotechnol 40, 163–166 (2022). [DOI] [PubMed] [Google Scholar]
- 7.Gong B, Zhou Y & Purdom E Cobolt: Joint analysis of multimodal single-cell sequencing data. Genome Biol 22, 351 (2021). [DOI] [PMC free article] [PubMed] [Google Scholar]
- 8.Minoura K, Abe K, Nam H, Nishikawa H & Shimamura T A mixture-of-experts deep generative model for integrated analysis of single-cell multiomics data. Cell Reports Methods 1, (2021). [DOI] [PMC free article] [PubMed] [Google Scholar]
- 9.Chen H, Ryu J, Vinyard M, Lerer A & Pinello L SIMBA: SIngle-cell eMBedding Along with features. bioRxiv 2021.10.17.464750 (2021) doi: 10.1101/2021.10.17.464750. [DOI] [PMC free article] [PubMed] [Google Scholar]
- 10.Lin Y et al. scJoint integrates atlas-scale single-cell RNA-seq and ATAC-seq data with transfer learning. Nat. Biotechnol 40, 703–710 (2022). [DOI] [PMC free article] [PubMed] [Google Scholar]
- 11.Duren Z et al. Integrative analysis of single-cell genomics data by coupled nonnegative matrix factorizations. Proc. Natl. Acad. Sci. U. S. A 115, 7723–7728 (2018). [DOI] [PMC free article] [PubMed] [Google Scholar]
- 12.Lara-Astiaso D et al. Chromatin state dynamics during blood formation. Science (2014) doi: 10.1126/science.1256271. [DOI] [PMC free article] [PubMed] [Google Scholar]
- 13.Rada-Iglesias A et al. A unique chromatin signature uncovers early developmental enhancers in humans. Nature 470, 279–283 (2011). [DOI] [PMC free article] [PubMed] [Google Scholar]
- 14.Datasets - 10x Genomics. https://support.10xgenomics.com/single-cell-multiome-atac-gex/datasets.
- 15.Blei DM Probabilistic topic models. Commun. ACM 55, 77–84 (2012). [Google Scholar]
- 16.Zhao Y, Cai H, Zhang Z, Tang J & Li Y Learning interpretable cellular and gene signature embeddings from single-cell transcriptomic data. Nat. Commun 12, 5261 (2021). [DOI] [PMC free article] [PubMed] [Google Scholar]
- 17.Bravo González-Blas C et al. cisTopic: cis-regulatory topic modeling on single-cell ATAC-seq data. Nat. Methods 16, 397–400 (2019). [DOI] [PMC free article] [PubMed] [Google Scholar]
- 18.Kingma DP & Welling M Auto-Encoding Variational Bayes. arXiv [stat.ML] (2013). [Google Scholar]
- 19.Blei DM Latent Dirichlet Allocation. J. Mach. Learn. Res 3, 993–1022 (2003). [Google Scholar]
- 20.Wang S et al. Target analysis by integration of transcriptome and ChIP-seq data with BETA. Nat. Protoc 8, 2502–2515 (2013). [DOI] [PMC free article] [PubMed] [Google Scholar]
- 21.Qin Q et al. Lisa: inferring transcriptional regulators through integrative modeling of public chromatin accessibility and ChIP-seq data. Genome Biol. 21, 32 (2020). [DOI] [PMC free article] [PubMed] [Google Scholar]
- 22.Schneider MR, Schmidt-Ullrich R & Paus R The hair follicle as a dynamic miniorgan. Curr. Biol 19, R132–42 (2009). [DOI] [PubMed] [Google Scholar]
- 23.Blanpain C & Fuchs E Epidermal homeostasis: a balancing act of stem cells in the skin. Nat. Rev. Mol. Cell Biol 10, 207–217 (2009). [DOI] [PMC free article] [PubMed] [Google Scholar]
- 24.Byron L & Wattenberg M. Stacked Graphs – Geometry & Aesthetics. IEEE Trans. Vis. Comput. Graph 14, 1245–1252 (2008). [DOI] [PubMed] [Google Scholar]
- 25.Soma T, Ogo M, Suzuki J, Takahashi T & Hibino T Analysis of Apoptotic Cell Death in Human Hair Follicles In Vivo andIn Vitro. J. Invest. Dermatol 111, 948–954 (1998). [DOI] [PubMed] [Google Scholar]
- 26.Cui C-Y et al. Ectodysplasin regulates the lymphotoxin-beta pathway for hair differentiation. Proc. Natl. Acad. Sci. U. S. A 103, 9142–9147 (2006). [DOI] [PMC free article] [PubMed] [Google Scholar]
- 27.Pan Y et al. gamma-secretase functions through Notch signaling to maintain skin appendages but is not required for their patterning or initial morphogenesis. Dev. Cell 7, 731–743 (2004). [DOI] [PubMed] [Google Scholar]
- 28.Genander M et al. BMP signaling and its pSMAD1/5 target genes differentially regulate hair follicle stem cell lineages. Cell Stem Cell 15, 619–633 (2014). [DOI] [PMC free article] [PubMed] [Google Scholar]
- 29.Joost S et al. Single-Cell Transcriptomics Reveals that Differentiation and Spatial Signatures Shape Epidermal and Hair Follicle Heterogeneity. Cell Syst 3, 221–237.e9 (2016). [DOI] [PMC free article] [PubMed] [Google Scholar]
- 30.Grose R, Harris BS, Cooper L, Topilko P & Martin P Immediate early genes krox-24 and krox-20 are rapidly up-regulated after wounding in the embryonic and adult mouse. Dev. Dyn 223, 371–378 (2002). [DOI] [PubMed] [Google Scholar]
- 31.Hildesheim J et al. The hSkn-1a POU transcription factor enhances epidermal stratification by promoting keratinocyte proliferation. J. Cell Sci 114, 1913–1923 (2001). [DOI] [PubMed] [Google Scholar]
- 32.Zeitvogel J et al. GATA3 regulates FLG and FLG2 expression in human primary keratinocytes. Sci. Rep 7, 1–11 (2017). [DOI] [PMC free article] [PubMed] [Google Scholar]
- 33.Hernández-Miranda LR, Parnavelas JG & Chiara F Molecules and mechanisms involved in the generation and migration of cortical interneurons. ASN Neuro 2, e00031 (2010). [DOI] [PMC free article] [PubMed] [Google Scholar]
- 34.La Manno G et al. Molecular architecture of the developing mouse brain. Nature 596, 92–96 (2021). [DOI] [PubMed] [Google Scholar]
- 35.Di Bella DJ et al. Molecular logic of cellular diversification in the mouse cerebral cortex. Nature 595, 554–559 (2021). [DOI] [PMC free article] [PubMed] [Google Scholar]
- 36.Esther L-B et al. Notch Signaling in the Astroglial Phenotype: Relevance to Glutamatergic Transmission. GABA And Glutamate: New Developments In Neurotransmission Research 25 (2018). [Google Scholar]
- 37.Yang N et al. Generation of pure GABAergic neurons by transcription factor programming. Nat. Methods 14, 621–628 (2017). [DOI] [PMC free article] [PubMed] [Google Scholar]
- 38.Raposo AASF et al. Ascl1 Coordinately Regulates Gene Expression and the Chromatin Landscape during Neurogenesis. Cell Rep. 10, 1544–1556 (2015). [DOI] [PMC free article] [PubMed] [Google Scholar]
- 39.de Martin X, Sodaei R & Santpere G Mechanisms of Binding Specificity among bHLH Transcription Factors. Int. J. Mol. Sci 22, (2021). [DOI] [PMC free article] [PubMed] [Google Scholar]
- 40.Porcher C, Medina I & Gaiarsa J-L Mechanism of BDNF Modulation in GABAergic Synaptic Transmission in Healthy and Disease Brains. Front. Cell. Neurosci 12, 273 (2018). [DOI] [PMC free article] [PubMed] [Google Scholar]
- 41.Mo J et al. Early growth response 1 (Egr-1) directly regulates GABAA receptor α2, α4, and θ subunits in the hippocampus. J. Neurochem 133, 489–500 (2015). [DOI] [PubMed] [Google Scholar]
- 42.Sheng Z-H & Cai Q Mitochondrial transport in neurons: impact on synaptic homeostasis and neurodegeneration. Nat. Rev. Neurosci 13, 77–93 (2012). [DOI] [PMC free article] [PubMed] [Google Scholar]
- 43.Harrington AJ et al. MEF2C regulates cortical inhibitory and excitatory synapses and behaviors relevant to neurodevelopmental disorders. Elife 5, (2016). [DOI] [PMC free article] [PubMed] [Google Scholar]
- 44.Park NI et al. ASCL1 Reorganizes Chromatin to Direct Neuronal Fate and Suppress Tumorigenicity of Glioblastoma Stem Cells. Cell Stem Cell 21, 411 (2017). [DOI] [PubMed] [Google Scholar]
- 45.Chen C-H et al. Determinants of transcription factor regulatory range. Nat. Commun 11, 2472 (2020). [DOI] [PMC free article] [PubMed] [Google Scholar]
- 46.Tritschler S et al. Concepts and limitations for learning developmental trajectories from single cell genomics. Development 146, (2019). [DOI] [PubMed] [Google Scholar]
- 47.Wagner DE & Klein AM Lineage tracing meets single-cell omics: opportunities and challenges. Nat. Rev. Genet 21, 410–427 (2020). [DOI] [PMC free article] [PubMed] [Google Scholar]
- 48.10x Genomics Datasets. https://www.10xgenomics.com/resources/datasets/pbmc-from-a-healthy-donor-granulocytes-removed-through-cell-sorting-10-k-1-standard-2-0-0.
- 49.Saelens W, Cannoodt R, Todorov H & Saeys Y A comparison of single-cell trajectory inference methods. Nat. Biotechnol 37, 547–554 (2019). [DOI] [PubMed] [Google Scholar]
Methods References
- 1.Blei DM., Ng AY. & Edu JB. Latent Dirichlet Allocation Michael I. Jordan. Journal of Machine Learning Research 3, 993–1022 (2003). [Google Scholar]
- 2.Kingma DP & Welling M Auto-Encoding Variational Bayes. arXiv:1312.6114 (2013).
- 3.Lopez R, Regier J, Cole MB, Jordan MI & Yosef N Deep generative modeling for single-cell transcriptomics. Nature Methods 2018 15:12 15, 1053–1058 (2018). [DOI] [PMC free article] [PubMed] [Google Scholar]
- 4.Choi K, Chen Y, Skelly DA & Churchill GA Bayesian model selection reveals biological origins of zero inflation in single-cell transcriptomics. Genome Biology 21, 1–16 (2020). [DOI] [PMC free article] [PubMed] [Google Scholar]
- 5.Chen EY et al. Enrichr: Interactive and collaborative HTML5 gene list enrichment analysis tool. BMC Bioinformatics 14, 1–14 (2013). [DOI] [PMC free article] [PubMed] [Google Scholar]
- 6.Fisher RA On the Interpretation of χ 2 from Contingency Tables, and the Calculation of P. Journal of the Royal Statistical Society 85, 87 (1922). [Google Scholar]
- 7.Srivastava A & Sutton C Autoencoding Variational Inference For Topic Models. 5th International Conference on Learning Representations, ICLR 2017 - Conference Track Proceedings (2017). [Google Scholar]
- 8.Egozcue JJ, Pawlowsky-Glahn V, Mateu-Figueras G & Barceló-Vidal C Isometric Logratio Transformations for Compositional Data Analysis. Mathematical Geology 35, 279–300 (2003). [Google Scholar]
- 9.Silverman JD, Washburne AD, Mukherjee S & David LA A phylogenetic transform enhances analysis of compositional microbiota data. Elife 6, (2017). [DOI] [PMC free article] [PubMed] [Google Scholar]
- 10.Traag VA, Waltman L & van Eck NJ From Louvain to Leiden: guaranteeing well-connected communities. Scientific Reports 2019 9:1 9, 1–12 (2019). [DOI] [PMC free article] [PubMed] [Google Scholar]
- 11.McInnes L, Healy J & Melville J UMAP: Uniform Manifold Approximation and Projection for Dimension Reduction. (2018).
- 12.Setty M et al. Characterization of cell fate probabilities in single-cell data with Palantir. Nature Biotechnology 2019 37:4 37, 451–460 (2019). [DOI] [PMC free article] [PubMed] [Google Scholar]
- 13.Chen CH et al. Determinants of transcription factor regulatory range. Nature Communications 2020 11:1 11, 1–15 (2020). [DOI] [PMC free article] [PubMed] [Google Scholar]
- 14.Avsec Ž et al. Effective gene expression prediction from sequence by integrating long-range interactions. Nature Methods 2021 18:10 18, 1196–1203 (2021). [DOI] [PMC free article] [PubMed] [Google Scholar]
- 15.Yadav A, Goldstein T & Jacobs D Making L-BFGS Work with Industrial-Strength Nets. BMVC (2020). [Google Scholar]
- 16.Pearson ES & Naymon J On the Use and Interpretation of Certain Test Criteria for Purposes of Statistical Inference. Biometrika 20, 275–240 (1928). [Google Scholar]
Associated Data
This section collects any data citations, data availability statements, or supplementary materials included in this article.
Supplementary Materials
Supplementary Table 1 (T1): Gene set enrichments of each MIRA expression topic in the hair follicle dataset. Indicated p-values by one-sided Fisher Exact test; adjusted p-values are Enrichr z-scores corrected for multiple comparisons.
Supplementary Table 2 (T2): Motif enrichments of each MIRA accessibility topic in the hair follicle dataset.
Supplementary Table 3 (T3): Gene set enrichments of each MIRA expression topic in the IFE dataset. Indicated p-values by one-sided Fisher Exact test; adjusted p-values are Enrichr z-scores corrected for multiple comparisons.
Supplementary Table 4 (T4): Motif enrichments of each MIRA accessibility topic in the IFE dataset.
Supplementary Table 5 (T5): Gene set enrichments of each MIRA expression topic in the embryonic brain dataset. Indicated p-values by one-sided Fisher Exact test; adjusted p-values are Enrichr z-scores corrected for multiple comparisons.
Supplementary Table 6 (T6): Motif enrichments of each MIRA accessibility topic in the embryonic brain dataset.
Data Availability Statement
The authors of the SHARE-seq skin study3 provide the RNA-seq count matrix at https://www.ncbi.nlm.nih.gov/geo/query/acc.cgi?acc=GSM4156608 and the ATAC-seq peak count matrix at https://www.ncbi.nlm.nih.gov/geo/query/acc.cgi?acc=GSM4156597. 10x Genomics provides the brain dataset14 RNA-seq count matrix and ATAC-seq peak count matrix at https://www.10xgenomics.com/resources/datasets/fresh-embryonic-e-18-mouse-brain-5-k-1-standard-2-0-0. RNA-seq and ATAC-seq count matrices used for the benchmarking study may be found at https://www.10xgenomics.com/resources/datasets/pbmc-from-a-healthy-donor-granulocytes-removed-through-cell-sorting-10-k-1-standard-2-0-0.