

Summary
Using a cohort study design, we analysed 17 diagnoses and 9 interventions (including critical care admission) as a composite measure of severe maternal morbidity for pregnancies recorded over 14 years in Scotland. There were 762,918 pregnancies, of which 7947 (10 in 1000 pregnancies) recorded 9345 severe maternal morbidity events, 2802 episodes of puerperal sepsis being the most common (30%). Severe maternal morbidity incidence increased from 9 in 1000 pregnancies in 2012 to 17 in 1000 pregnancies in 2018, due in part to puerperal sepsis recording. The odds ratio (95%CI) for severe maternal morbidity was higher for: older women, for instance 1.22 (1.13–1.33) for women aged 35–39 years and 1.44 (1.27–1.63) for women aged > 40 years compared with those aged 25–29 years; obese women, for instance 1.13 (1.06–1.21) for BMI 30–40 kg.m‐2 and 1.32 (1.15–1.51) for BMI > 40 kg.m‐2 compared with BMI 18.5–24.9 kg.m‐2; multiple pregnancy, 2.39 (2.09–2.74); and previous caesarean delivery, 1.52 (1.40–1.65). The median (IQR [range]) hospital stay was 3 (2–5 [1–8]) days with severe maternal morbidity and 2 (1–3 [1–5]) days without. Forty‐one women died during pregnancy or up to 42 days after delivery, representing mortality rates per 100,000 pregnancies of about 365 with severe maternal morbidity and 1.6 without. There were 1449 women admitted to critical care, 807 (58%) for mechanical ventilation or support of at least two organs. We recorded an incidence of severe maternal morbidity higher than previously published, possibly because sepsis was coded inaccurately in our databases. Further research may determine the value of this composite measure of severe maternal morbidity.
Keywords: maternal critical care, risk factors, severe maternal morbidity
Introduction
The number of women dying during pregnancy and childbirth in the UK is at an all‐time low [1]. Consequently, enquiries into maternal death have limited power to improve maternal care, whereas measures of severe – but usually non‐lethal – events during pregnancy and the puerperium may continue to inform care in the UK [2, 3, 4]. A composite of individual morbidities is up to 100 times more frequent than maternal death and therefore affords opportunities to intervene to reduce morbidity and mortality [5, 6].
The rate of severe maternal morbidity may be increasing in some high‐income countries, which is associated with modifiable factors such as obesity, and other factors that, whilst not modifiable, might trigger intervention, such as age and previous caesarean delivery [7, 8]. The increasing prevalence of these factors in UK mothers might reverse the historical reductions in mortality and will increase healthcare during pregnancy and childbirth [9].
The UK Obstetric Surveillance System (UKOSS) reports specific conditions or healthcare themes of interest, including morbidities [10]. In contrast, semi‐automated collection of healthcare data may provide the opportunity to monitor rates of maternal morbidities routinely. Linked electronic data resources could help identify women more likely to experience severe maternal morbidity and may improve our understanding of how severe maternal morbidities affect women, children and healthcare services.
Accordingly, we aimed to use routinely collected data sources to generate a composite measure of severe maternal morbidity, report its incidence and the variables associated with its occurrence.
Methods
Using a cohort design, we studied women with a live birth, stillbirth or late second trimester loss (defined as 20 weeks to ‘23 weeks and 6 days’ gestation) from 1 January 2005 to 31 December 2018, using data from the Scottish Morbidity Records, the National Records of Scotland and the Scottish Intensive Care Society Audit Group (please see online Supporting Information, Appendices S1 and S2 for a detailed account of methods) [11, 12, 13, 14].
The primary outcome was any severe maternal morbidity recorded from conception to 42 days postpartum, defined by English Maternal Morbidity Indicator codes for 17 diagnoses, for instance puerperal sepsis or status epilepticus, and nine interventions, for instance repair of bladder or evacuation of haematoma, with corresponding disease (ICD‐10) and procedural (OPCS) codes (online Supporting Information, Table S1) [15]. We added intensive care unit admission as an indicator for severe maternal morbidity and, in combination with other procedural codes related to managing haemorrhage, we consequently excluded the ICD‐10 code for major obstetric haemorrhage (O72), which is substantially overestimated using ICD coding [16]. We report the first event for women who experienced multiple morbidities.
We analysed duration of hospital admission and maternal mortality as well as the duration and level of critical care, mechanical ventilation, renal replacement therapy and cardiovascular support (online Supporting Information, Appendices S1 and S2) [17].
We analysed the associations of severe maternal morbidity with sociodemographic measures, pre‐pregnancy maternal health status, obstetric history and current pregnancy information (online Supporting Information, Appendices S1 and S2). We searched for ICD‐codes recorded in the five years preceding the estimated date of conception to define comorbidities (online Supporting Information, Appendix S1 and Table S2) [18, 19, 20]. As a sensitivity analysis, the comorbidity variable was replaced with a new count which included those comorbidities coded before and during a pregnancy.
We used Stata version 14.1 for analyses (Stata Corp, College Station, TX, USA). We used logistic regression to analyse the associations of severe maternal morbidity with variables present before hospital admission or early in pregnancy (model 1), and variables present later in pregnancy and during delivery (model 2) (online Supporting Information, Appendices S1 and S2). We used robust variance estimation to account for clustering due to multiple pregnancies. We used chi‐squared and Mann–Whitney‐U tests for categorical and continuous variables, respectively. Patient information was pseudonymised and all analyses were conducted within NHS Scotland's safe haven environment. Access to the data was granted following approval by the Public Benefit and Privacy Panel.
Results
We analysed 762,918 pregnancies, during which 9345 severe maternal morbidity events were recorded relating to 7947 pregnancies (10.4 in 1000 pregnancies) (Fig. 1, Tables 1 and 2 and online Supporting Information, Tables S2–S4). One severe maternal morbidity was recorded for 6891 (87%) women, two for 806 (10%) women and three or more for 250 women (3%). Puerperal sepsis or admission to critical care were the most common indicators of severe maternal morbidity (Fig. 2 and online Supporting Information, Figures S1 and S2).
Figure 1.

Cohort flow diagram.
Table 1.
Maternal characteristics and pregnancy outcomes, stratified by whether a severe maternal morbidity was recorded for the pregnancy. Values are median (IQR) or number (proportion).
| Characteristic | Severe maternal morbidity | p value | |
|---|---|---|---|
|
No n = 754,971 |
Yes n = 7947 |
||
| Maternal age; y | 29 (25–34) | 30 (25–34) | < 0.001 |
| < 20 | 42,888 (6%) | 451 (6%) | |
| 20–24 | 132,218 (18%) | 1279 (16%) | |
| 25–29 | 204,106 (27%) | 2013 (25%) | |
| 30–34 | 222,061 (29%) | 2316 (29%) | |
| 35–39 | 126,108 (17%) | 1479 (19%) | |
| > 39 | 27,590 (4%) | 409 (5%) | |
| Mother's region of birth | |||
| British Isles | 645,889 (86%) | 6621 (83%) | < 0.001 |
| Rest of Europe | 45,946 (6%) | 476 (6%) | |
| Middle East or Asia | 29,610 (4%) | 408 (5%) | |
| Africa | 15,443 (2%) | 229 (3%) | |
| North America | 4781 (1%) | 58 (1%) | |
| Missing | 8660 (1%) | 96 (1%) | |
| Oceania | 2662 | 32 | |
| South America | 1980 | 27 | |
| Scottish index of multiple deprivation | |||
| 1 (most deprived) | 104,057 (14%) | 1058 (13%) | |
| 2 | 91,041 (12%) | 982 (12%) | |
| 3 | 81,898 (11%) | 957 (12%) | |
| 4 | 76,649 (10%) | 833 (10%) | |
| 5 | 73,976 (10%) | 775 (10%) | |
| Missing | 935 | 19 | |
| Urban rural indicator | |||
| Large urban area | 309,478 (41%) | 3223 (41%) | 0.014 |
| Other urban area | 235,541 (31%) | 2565 (32%) | |
| Accessible small town | 61,754 (8%) | 658 (8%) | |
| Remote small towns | 25,956 (3%) | 267 (3%) | |
| Accessible rural | 74,770 (10%) | 743 (9%) | |
| Remote rural | 35,093 (5%) | 332 (4%) | |
| Missing | 12,379 (2%) | 159 (2%) | |
| Sole parental registration | |||
| No | 705,309 (93%) | 7303 (92%) | < 0.001 |
| Yes | 37,961 (5%) | 505 (6%) | |
| Missing | 11,701 (2%) | 139 (2%) | |
| Pre‐pregnancy BMI; kg.m−2 | 25.0 (22.1–29.1) | 25.5 (22.3–30.0) | < 0.001 |
| Smoking status | |||
| None | 482,925 (64%) | 5028 (63%) | < 0.001 |
| Current | 135,757 (18%) | 1426 (18%) | |
| Former | 84,042 (11%) | 1011 (13%) | |
| Missing | 52,247 (7%) | 482 (6%) | |
| Diabetes | |||
| No | 659,140 (87%) | 6985 (88%) | < 0.001 |
| Gestational | 12,324 (2%) | 208 (3%) | |
| Pre‐gestational | 4374 (1%) | 106 (1%) | |
| Hypertension before admission | < 0.001 | ||
| No | 733,485 (97%) | 7701 (97%) | |
| Yes | 1782 | 43 | |
| Previous pregnancy loss | < 0.001 | ||
| No | 580,488 (77%) | 6025 (76%) | |
| Yes | 121,799 (16%) | 1220 (15%) | |
| Parity | |||
| 0 | 335,852 (44%) | 3940 (50%) | < 0.001 |
| 1 | 259,267 (34%) | 2260 (28%) | |
| 2 | 101,577 (13%) | 1005 (13%) | |
| > 2 | 53,485 (7%) | 681 (9%) | |
| Missing | 4790 (1%) | 61 (1%) | |
| Previous caesarean section | |||
| None | 662,841 (88%) | 6586 (83%) | < 0.001 |
| One | 73,526 (10%) | 1005 (13%) | |
| Two or more | 15,829 (2%) | 328 (4%) | |
| Missing | 2775 | 28 | |
| Year of delivery | < 0.001 | ||
| 2005 | 51,778 (99.2%) | 442 (0.8%) | |
| 2006 | 52,729 (99.3%) | 364 (0.7%) | |
| 2007 | 55,510 (99.3%) | 403 (0.7%) | |
| 2008 | 57,457 (99.2%) | 458 (0.8%) | |
| 2009 | 56,610 (99.2%) | 467 (0.8%) | |
| 2010 | 56,545 (99.1%) | 512 (0.9%) | |
| 2011 | 56,268 (99.1%) | 503 (0.9%) | |
| 2012 | 55,598 (99.1%) | 506 (0.9%) | |
| 2013 | 53,685 (98.9%) | 591 (1.1%) | |
| 2014 | 54,339 (98.8%) | 636 (1.2%) | |
| 2015 | 52,702 (98.7%) | 718 (1.3%) | |
| 2016 | 52,082 (98.7%) | 705 (1.3%) | |
| 2017 | 50,563 (98.5%) | 794 (1.5%) | |
| 2018 | 49,105 (98.3%) | 848 (1.7%) | |
| Multiple gestation | |||
| No | 741,507 (98%) | 7642 (96%) | < 0.001 |
| Yes | 11,301 (2%) | 270 (3%) | |
| Missing | 2163 | 35 | |
| Estimated gestation (Weeks) | 40 (38–40) | 39 (38–40) | < 0.001 |
| Very preterm (< 28 weeks) | 5152 (1%) | 175 (2%) | |
| Preterm (28 < 37 weeks) | 49,355 (7%) | 1308 (16%) | |
| Term (37 < 41 weeks) | 528,812 (70%) | 4976 (63%) | |
| Overdue (> 41 weeks) | 171,652 (23%) | 1488 (19%) | |
| Mode of delivery | |||
| Unassisted vaginal | 445,102 (59%) | 2695 (34%) | < 0.001 |
| Emergency caesarean section | 118,652 (16%) | 3051 (38%) | |
| Assisted vaginal | 95,597 (13%) | 1034 (13%) | |
| Elective caesarean section | 93,392 (12%) | 1131 (14%) | |
| Missing | 2228 | 36 | |
| Antenatal steroids | |||
| No | 664,385 (88%) | 6527 (82%) | < 0.001 |
| Yes | 26,973 (4%) | 810 (10%) | |
| Missing | 63,613 (8%) | 610 (8%) | |
| Analgesia during pregnancy or labour | |||
| Yes | 651,916 (86%) | 7165 (90%) | < 0.001 |
| No | 33,166 (4%) | 184 (2%) | |
| Missing | 69,889 (9%) | 598 (8%) | |
| Induction of labour | |||
| No | 547,456 (73%) | 5426 (68%) | < 0.001 |
| Yes | 199,574 (26%) | 2409 (30%) | |
| Missing | 7941 (1%) | 112 (1%) | |
| Obstetric admissions before delivery | |||
| 0 | 466,734 (62%) | 4260 (54%) | < 0.001 |
| 1 | 141,192 (19%) | 1598 (20%) | |
| > 1 | 142,400 (19%) | 2011 (25%) | |
| Missing | 4645 (1%) | 78 (1%) | |
| Stay after delivery; days | 2 (1–3) | 3 (2–5) | < 0.001 |
| Maternal death to 42 days | 12 (1.6 per 100,000) | 29 (365 per 100,000) | < 0.001 |
| Outcome of birth | |||
| Live birth | 740,537 (98%) | 7676 (7%) | < 0.001 |
| Stillbirth | 3001 (0.4%) | 138 (2%) | |
| Late second trimester loss | 1232 (0.2%) | 22 (0.3%) | |
| Missing | 10,201 (1%) | 111 (1%) | |
Table 2.
Severe maternal morbidities recorded relative to the day of labour and birth. We tabulated only the first severe maternal morbidity recorded for a woman. The frequency of the morbidities sums to more than the number of pregnancies (n) as a woman may have had multiple different severe maternal morbidity events during a time period. Values are number (proportion) or number.
| Morbidity | Before, during or after labour and birth |
Total n = 7947 |
p value | ||
|---|---|---|---|---|---|
|
Before n = 2839 |
During n = 2226 |
After n = 2882 |
|||
| Sepsis | 728 (26%) | 520 (19%) | 1554 (55%) | 2802 | < 0.001 |
| ICU admission | 389 (27%) | 688 (47%) | 372 (26%) | 1449 | < 0.001 |
| Caesarean dehiscence | 129 (26%) | 178 (36%) | 188 (38%) | 495 | < 0.001 |
| Curettage with anaesthetic | 87 (18%) | 91 (19%) | 307 (63%) | 485 | < 0.001 |
| Eclampsia | 257 (54%) | 146 (30%) | 76 (16%) | 479 | < 0.001 |
| Cardiac event | 173 (38%) | 138 (30%) | 146 (32%) | 457 | < 0.001 |
| Acute abdomen | 279 (69%) | 7 (2%) | 116 (29%) | 402 | < 0.001 |
| Embolism | 205 (56%) | 60 (16%) | 102 (28%) | 367 | < 0.001 |
| Evacuation of haematoma | 121 (36%) | 138 (41%) | 74 (22%) | 333 | < 0.001 |
| Acute renal failure | 160 (51%) | 90 (29%) | 65 (21%) | 315 | < 0.001 |
| Hysterectomy | 107 (43%) | 108 (43%) | 35 (14%) | 250 | < 0.001 |
| Assisted ventilation | 86 (37%) | 105 (45%) | 40 (17%) | 231 | < 0.001 |
| Cystotomy or repair | * | 129 (57%) | * | 227 | < 0.001 |
| Shock | 87 (41%) | 107 (50%) | 18 (8%) | 212 | < 0.001 |
| Uterine rupture | * | 119 (60%) | * | 200 | < 0.001 |
| Anaesthetic complication | 62 (48%) | 63 (48%) | 5 (4%) | 130 | < 0.001 |
| Stroke | 59 (51%) | 16 (14%) | 41 (35%) | 116 | < 0.001 |
| Intestine repair | 41 (43%) | 15 (16%) | 39 (41%) | 95 | < 0.001 |
| Status asthmaticus | 71 (84%) | 8 (9%) | 6 (7%) | 85 | < 0.001 |
| Uterine artery intervention | 25 | 11 | 12 | 48 | < 0.001 |
| Acute psychosis | 17 | 6 | 8 | 31 | < 0.001 |
| Cerebral oedema or coma | 22 | * | * | 31 | < 0.001 |
| DIC | * | 15 | * | 24 | < 0.001 |
| Sickle cell crisis | 19 | * | * | 23 | < 0.001 |
| Cerebral vein thrombosis | * | * | 10 | 20 | < 0.001 |
| Dialysis | 7 | 6 | 6 | 19 | < 0.001 |
| Status epilepticus | 16 | * | * | 19 | < 0.001 |
| Total number of events | 9345 | ||||
Cardiac event, arrest or failure or infarction; DIC, disseminated intravascular coagulopathy.
Output suppressed due to disclosure risk.
Figure 2.
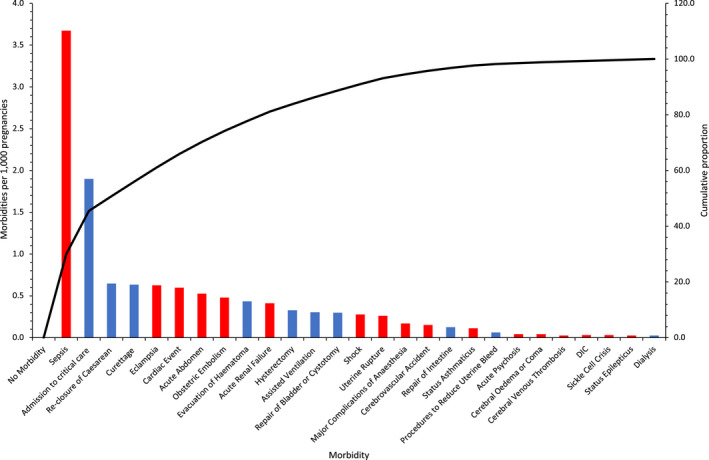
Pareto chart of the rates of 26 severe maternal morbidities per 1000 pregnancies, conditions (red) and procedures (blue). The black line is the cumulative proportion for all severe morbidities. DIC, disseminated intravascular coagulation. [Colour figure can be viewed at wileyonlinelibrary.com]
Severe maternal morbidity increased in the years after 2012 due to puerperal sepsis, from 9 in 1000 pregnancies in 2012 to 17 in 1000 pregnancies in 2018 (online Supporting Information, Figure S3). Severe maternal morbidity was independently associated with maternal age; BMI; pre‐existing morbidity; previous smoking; previous caesarean section; multiple pregnancy; and maternal birth in Africa or the Middle East (model 1, online Supporting Information Table S5; Fig. 3a–c and online Supporting Information, Figures S4–S6).
Figure 3.
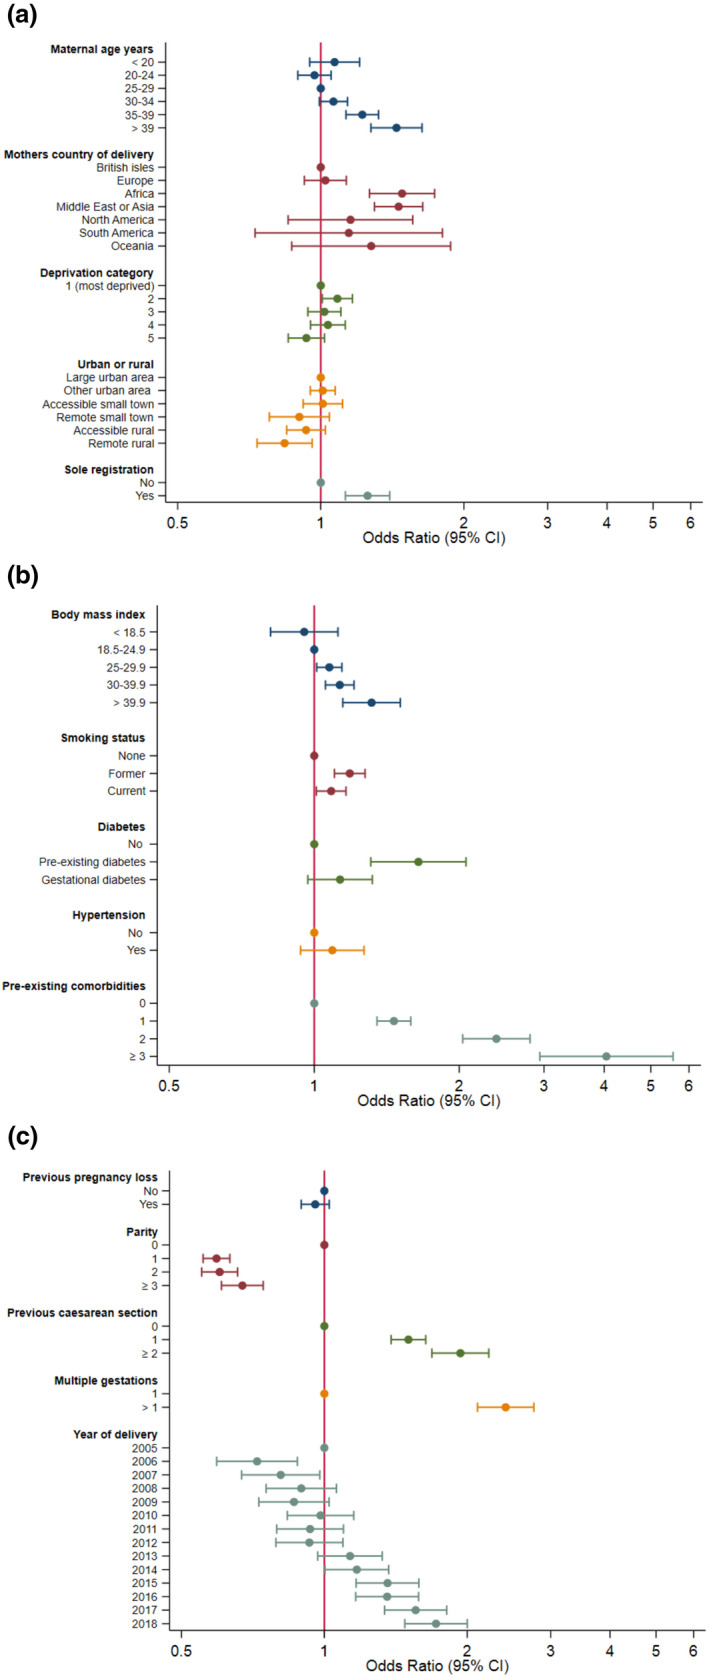
(a–c) Odds ratios (95%CI) of characteristics associated with severe maternal mortality after model 1 multivariable adjustment. Reference categories have an odds ratio of 1. [Colour figure can be viewed at wileyonlinelibrary.com]
Hospital admission during the current pregnancy was associated with severe maternal morbidity, as were antenatal steroids, early or late delivery, induction of labour, assisted delivery (in particular emergency caesarean section) and analgesia (model 2, online Supporting Information, Table S5). The associations in model 2 should be interpreted with caution as they may have been the consequence of morbidity, rather than its cause. The inclusion in the model of comorbidities coded before and during pregnancy had little effect on these associations in sensitivity analyses (online Supporting Information, Tables S6 and S7).
Women with severe maternal morbidity were significantly more likely to require a longer hospital stay following delivery (11.1% vs. 3.0% staying > 7 days, p < 0.001) and have a stillbirth (1.7% vs. 0.4%, p < 0.001) (Table 1). More women with severe morbidity died during pregnancy or up to 42 days postpartum than without, with mortality rates of 36.5 in 10,000 vs. 0.16 in 10,000, p < 0.001.
Online Supporting Information (Table S8) details the care of the 1449 women (0.2%) admitted to intensive care, of whom 807 (56%) were ventilated or had more than one organ supported.
Discussion
We found that severe maternal morbidity was recorded for about 10 in 1000 (1%) pregnant women in Scotland.
A national audit in Scotland reported a lower incidence of severe maternal morbidity of 6 in 1000, the most common of which was post‐partum haemorrhage, a morbidity we excluded [16]. We think that inaccurate coding in our study databases may have overestimated the rate of morbidity. The rate of morbidity in our study would be 6 in 1000 if we excluded puerperal sepsis, the coding of which increased substantially after 2012. Several studies suggest that ICD coding for sepsis is unreliable [21, 22]. The reliability of puerperal sepsis coding could be improved by requiring a simultaneous code for organ dysfunction derived from critical care databases [23].
Other studies have reported similar associations of variables with severe maternal morbidity [3, 8, 24, 25]. The variables associated with morbidity did not necessarily cause morbidity, directly or indirectly, particularly variables recorded during labour and delivery. Such variables are more likely to be the consequence of morbidity, for instance emergency caesarean section. Some studies have used a causal framework and undertaken mediation analyses to better explore causation [25]. Interventions early in pregnancy, such as ensuring ready access to maternity services and pre‐emptive individualised support, might improve maternal and foetal outcomes for women who are older, comorbid, obese, born in non‐European countries or who have had previous caesarean sections.
Women who had a severe morbidity were more than 2000 times more likely to die than women who did not, which is greater than risk ratios of 100–500 reported by other studies [26, 27]. Unsurprisingly, women with morbidity stayed in hospital longer than women without, although the difference was less than in a Canadian study [27]. The disparity could be due to differences in health service organisation, or because of the incorrect coding that we suspect of our study.
The use of multiple databases increased our ability to detect associations with an uncommon outcome and increased the external validity of our study. We included women cared for in obstetric high dependency units, who are usually missed by current national reports of critically ill pregnant women. We think that admissions to obstetric high dependency units might be incorporated as a component of severe maternal morbidity, perhaps in combination with coding for particular conditions or procedures. However, as guidance increasingly supports pre‐emptive admission to critical care for those at higher risk of adverse outcomes, it may be that unplanned critical care admission would be a more suitable morbidity to analyse in the future [28].
There are also limitations to this study. Some variables, such as BMI, were missing many values. We intentionally analysed a composite outcome, which may misrepresent the associations of individual component morbidities with variables, as there is already an established body of research on individual morbidities, for instance post‐partum haemorrhage and maternal sepsis [29, 30, 31, 32, 33].
In conclusion, severe maternal morbidity accompanied 10 in 1000 (1%) pregnancies in Scotland. Morbidity was independently associated with maternal age; BMI; pre‐existing morbidity; previous smoking; previous caesarean section; multiple pregnancy; and maternal birth in Africa or the Middle East. Morbidity was associated with delayed hospital discharge, stillbirths and maternal deaths. Our composite measure of severe maternal morbidity might be tested with other administrative healthcare databases.
Supporting information
Appendix S1. Detailed methods.
Appendix S2. Supplementary methods.
Table S1. Components of severe maternal morbidity derived from Scottish datasets modified from the English Maternal Morbidity Indicator.
Table S2. Prevalence of comorbidities in women for whom severe maternal morbidity was or was not reported, for comorbidities coded in databases during the 5 y before conception only and combined with comorbidities coded during pregnancy.
Table S3. Incidence of severe maternal morbidity.
Table S4. The proportions of severe maternal morbidity that were conditions or interventions.
Table S5. Unadjusted associations of characteristics with severe maternal morbidity and adjusted associations in model 1 and model 2.
Table S6. Associations of 1, 2 or 3 comorbidities with severe maternal morbidity.
Table S7. A sensitivity analysis of Table S5, with comorbidities recorded during pregnancy added to models 1 and 2.
Table S8. Intensive care variables for women with severe maternal morbidity.
Figure S1. A sensitivity plot of Fig. 2, with the addition of admission to critical care – intensive care or high dependency care – as a component of severe maternal morbidity.
Figure S2. A sensitivity plot of Fig. 2 and online Supporting Information (Figure S2), with the addition of admission to obstetric high dependency as a component of severe maternal morbidity.
Figure S3. Annual incidence of severe maternal morbidity 2004–18.
Figure S4. Predicted rate of severe maternal morbidity vs. maternal age.
Figure S5. Predicted rate of severe maternal morbidity vs. maternal body mass index.
Figure S6. Predicted rate of severe maternal morbidity vs. date.
Acknowledgements
FD tragically died in January 2022. This research was supported by grant funding from the Obstetric Anaesthetists' Association. CW was supported in this work by NHS Lothian via Edinburgh Clinical Trials Unit. We thank the eDRIS Team (Public Health Scotland) for its involvement in obtaining approvals, provisioning and linking data and the use of the secure analytical platform within the National Safe Haven. We are grateful to R. Pollock for deriving the cohort and linking the datasets. JM received the Association of Anaesthetists/Anaesthesia funded John Snow Anaesthesia Intercalated Award. No other competing interests declared.
References
- 1. EMBRRACE‐UK . Saving lives, improving mothers' care lessons learned to inform maternity care from the UK and Ireland Confidential Enquiries into Maternal Deaths and Morbidity 2016–18. 2020. https://www.npeu.ox.ac.uk/assets/downloads/mbrrace-uk/reports/maternal-report-2020/MBRRACE-UK_Maternal_Report_Dec_2020_v10_ONLINE_VERSION_1404.pdf (accessed 20/08/ 2021).
- 2. Knight M, Lewis G, Acosta C, Kurinczuk J. Maternal near‐miss case reviews: the UKapproach. British Journal of Obstetrics and Gynaecology 2014; 121: 112–6. [DOI] [PMC free article] [PubMed] [Google Scholar]
- 3. Waterstone M, Bewley S, Wolfe C. Incidence and predictors of severe obstetric morbidity: case‐control study. British Medical Journal 2001; 322: 1089–94. [DOI] [PMC free article] [PubMed] [Google Scholar]
- 4. Rivara F, Fihn S. Severe maternal morbidity and mortality. Journal of the American Medical Association Network Open 2020; 3: e200045. [Google Scholar]
- 5. Geller SE, Rosenberg D, Cox SM, et al. The continuum of maternal morbidity and mortality: factors associated with severity. American Journal of Obstetrics and Gynecology 2004; 191: 939–44. [DOI] [PubMed] [Google Scholar]
- 6. Mengistu T, Turner J, Flatley C, Fox J, Kumar S. Impact of severe maternal morbidity on adverse perinatal outcomes in high‐income countries: systematic review and meta‐analysis protocol. British Medical Journal Open 2019; 9: e027100. [DOI] [PMC free article] [PubMed] [Google Scholar]
- 7. Centers for Disease Control and Prevention . Severe maternal morbidity in the United States. 2019. https://www.cdc.gov/reproductivehealth/maternalinfanthealth/severematernalmorbidity.html (accessed 14/08/2021).
- 8. Lindquist A, Kurinczuk J, Wallace E, Oats J, Knight M. Risk factors for maternal morbidity in Victoria, Australia: a population‐based study. British Medical Journal Open 2015; 5: e007903. [DOI] [PMC free article] [PubMed] [Google Scholar]
- 9. Public Health Scotland . Births in Scottish Hospitals ‐ 24 November 2020 ‐ data and intelligence from Public Health Scotland. 2020. https://beta.isdscotland.org/find-publications-and-data/population-health/births-and-maternity/births-in-scottish-hospitals (accessed 16/08/2021).
- 10. Knight M. The UKobstetric surveillance system. Obstetrics, Gynaecology and Reproductive Medicine 2008; 18: 199–200. [Google Scholar]
- 11. NSS Information and Intelligence . Assessment of SMR01 data 2014–2015 Scotland report. https://www.isdscotland.org/Products-and-Services/Data-Quality/docs/Assessment-of-SMR01-Data-2014-15-report-180508.pdf (accessed 21/08/2021).
- 12. NSS Information and Intelligence . Data quality assurance assessment of SMR02 (maternity inpatient and day case) data; Scotland 2017–2018. https://www.isdscotland.org/Products-and-Services/Data-Quality/docs/20191023-Assessment-of-SMR02-Data-Scotland-2017-2018.pdf (accessed 10/08/2021).
- 13. National Records of Scotland . Quality of data obtained from the registration of births, stillbirths, marriages, civil partnerships and deaths. https://www.nrscotland.gov.uk/files/statistics/vital-events/quality-data-obtained-from-registration-of-ve.pdf (accessed 10/08/2021).
- 14. Scottish Intensive Care Society Audit Group . Annual report: audit of critical care in Scotland 2020. https://www.sicsag.scot.nhs.uk/publications/_docs/2020-08-11-SICSAG-report.pdf?1 (accessed 05/09/2021).
- 15. Nair M, Kurinczuk JJ, Knight M. Establishing a national maternal morbidity outcome indicator in England: a population‐based study using routine hospital data. PLoS One 2016; 11: e0153370. [DOI] [PMC free article] [PubMed] [Google Scholar]
- 16. Healthcare Improvement Scotland . Scottish Confidential Audit of Severe Maternal Morbidity ‐ reducing avoidable harm: 10th annual report. 2014. http://www.healthcareimprovementscotland.org/programmes/reproductive,_maternal__child/programme_resources/scasmm.aspx (accessed 30/07/2021).
- 17. Faculty of Intensive Care Medicine and Intensive Care Society . Guidelines for the provision of intensive care services. 2nd ed. 2019. https://www.ficm.ac.uk/sites/ficm/files/documents/2021-10/gpics-v2.pdf (accessed 30/07/2021). [Google Scholar]
- 18. Charlson ME, Pompei P, Ales KL, MacKenzie CR. A new method of classifying prognostic comorbidity in longitudinal studies: development and validation. Journal of Chronic Diseases 1987; 40: 373–83. [DOI] [PubMed] [Google Scholar]
- 19. Elixhauser A, Steiner C, Harris DR, Coffey RM. Comorbidity measures for use with administrative data. Medical Care 1998; 36: 8–27. [DOI] [PubMed] [Google Scholar]
- 20. Bateman BT, Mhyre JM, Hernandez‐Diaz S, et al. Development of a comorbidity index for use in obstetric patients. Obstetrics and Gynecology 2013; 122: 957–65. [DOI] [PMC free article] [PubMed] [Google Scholar]
- 21. Duke GJ, Moran JL, Santamaria JD, Pilcher DV. Sepsis. Lancet 2020; 396: 1805. [DOI] [PubMed] [Google Scholar]
- 22. Tidswell R, Parker T, Brealey D, Singer M. Sepsis – the broken code how accurately is sepsis being diagnosed? Journal of Infection 2020; 81: e31–e32. [DOI] [PubMed] [Google Scholar]
- 23. Singer M, Deutschman CS, Seymour CW, et al. The third international consensus definitions for sepsis and septic shock (Sepsis‐3). Journal of the American Medical Association 2016; 315: 801–10. [DOI] [PMC free article] [PubMed] [Google Scholar]
- 24. Brace V, Penney G, Hall M. Quantifying severe maternal morbidity: a Scottish population study. British Journal of Obstetrics and Gynaecology 2004; 111: 481–4. [DOI] [PubMed] [Google Scholar]
- 25. Leonard SA, Carmichael SL, Main EK, Lyell DJ, Abrams B. Risk of severe maternal morbidity in relation to prepregnancy body mass index: roles of maternal co‐morbidities and caesarean birth. Paediatric and Perinatal Epidemiology 2020; 34: 460–8. [DOI] [PMC free article] [PubMed] [Google Scholar]
- 26. Ray JG, Park AL, Dzakpasu S, et al. Prevalence of severe maternal morbidity and factors associated with maternal mortality in Ontario, Canada. Journal of the American Medical Association Network Open 2018; 1: e18457. [DOI] [PMC free article] [PubMed] [Google Scholar]
- 27. Dzakpasu S, Deb‐Rinker P, Arbour L, et al. Severe maternal morbidity surveillance. Paediatric and Perinatal Epidemiology 2020; 34: 427–39. [DOI] [PMC free article] [PubMed] [Google Scholar]
- 28. NELA Project Team . The sixth patient report of the National Emergency Laparotomy Audit – full patient report. 2020. https://www.nela.org.uk/downloads/The%20Sixth%20Patient%20Report%20of%20the%20NELA%202020%20-%20FINAL%20November%202020.pdf (accessed 05/09/2021).
- 29. Acosta C, Bhattacharya S, Tuffnell D, Kurinczuk J, Knight M. Maternal sepsis: a Scottish population‐based case–control study. British Journal of Obstetrics and Gynaecology 2012; 119: 474–83. [DOI] [PMC free article] [PubMed] [Google Scholar]
- 30. Balgobin C, Zhang X, Lima F, et al. Risk factors and timing of acute myocardial infarction associated with pregnancy: insights from the national inpatient sample. Journal of the American Heart Association 2020; 9: e016623. [DOI] [PMC free article] [PubMed] [Google Scholar]
- 31. Bartsch E, Medcalf K, Park A, Ray J. Clinical risk factors for pre‐eclampsia determined in early pregnancy: systematic review and meta‐analysis of large cohort studies. British Medical Journal 2016; 353: i1753. [DOI] [PMC free article] [PubMed] [Google Scholar]
- 32. Fitzpatric K, Tuffnell D, Kurinczuk J, Knight M. Incidence, risk factors, management and outcomes of amniotic‐fluid embolism: a population‐based cohort and nested case–control study. British Journal of Obstetrics and Gynaecology 2015; 123: 100–9. [DOI] [PubMed] [Google Scholar]
- 33. James A, Jamison M, Biswas M, Brancazio L, Swamy G, Myers E. Acute myocardial infarction in pregnancy. Circulation 2006; 113: 1564–71. [DOI] [PubMed] [Google Scholar]
Associated Data
This section collects any data citations, data availability statements, or supplementary materials included in this article.
Supplementary Materials
Appendix S1. Detailed methods.
Appendix S2. Supplementary methods.
Table S1. Components of severe maternal morbidity derived from Scottish datasets modified from the English Maternal Morbidity Indicator.
Table S2. Prevalence of comorbidities in women for whom severe maternal morbidity was or was not reported, for comorbidities coded in databases during the 5 y before conception only and combined with comorbidities coded during pregnancy.
Table S3. Incidence of severe maternal morbidity.
Table S4. The proportions of severe maternal morbidity that were conditions or interventions.
Table S5. Unadjusted associations of characteristics with severe maternal morbidity and adjusted associations in model 1 and model 2.
Table S6. Associations of 1, 2 or 3 comorbidities with severe maternal morbidity.
Table S7. A sensitivity analysis of Table S5, with comorbidities recorded during pregnancy added to models 1 and 2.
Table S8. Intensive care variables for women with severe maternal morbidity.
Figure S1. A sensitivity plot of Fig. 2, with the addition of admission to critical care – intensive care or high dependency care – as a component of severe maternal morbidity.
Figure S2. A sensitivity plot of Fig. 2 and online Supporting Information (Figure S2), with the addition of admission to obstetric high dependency as a component of severe maternal morbidity.
Figure S3. Annual incidence of severe maternal morbidity 2004–18.
Figure S4. Predicted rate of severe maternal morbidity vs. maternal age.
Figure S5. Predicted rate of severe maternal morbidity vs. maternal body mass index.
Figure S6. Predicted rate of severe maternal morbidity vs. date.