

Abstract
BACKGROUND:
Pathologic complete response (pCR) to neoadjuvant systemic therapy (NAST) in triple-negative breast cancer (TNBC) is a strong predictor of patient survival. Edema in the peritumoral region (PTR) has been reported to be a negative prognostic factor in TNBC.
PURPOSE:
To determine if quantitative apparent diffusion coefficient (ADC) features from PTRs on reduced field-of-view (rFOV) diffusion-weighted imaging (DWI) predict the response to NAST in TNBC.
STUDY TYPE:
Prospective.
POPULATION/SUBJECTS:
108 patients with biopsy-proven TNBC who underwent NAST and definitive surgery during 2015–2020.
FIELD STRENGTH/SEQUENCE:
3.0 T / rFOV single-shot diffusion-weighted echo-planar imaging sequence (DWI)
ASSESSMENT:
Three scans were acquired longitudinally (pre-treatment, after 2 cycles of NAST, and after 4 cycles of NAST). For each scan, 11 ADC histogram features (minimum, maximum, mean, median, standard deviation, kurtosis, skewness and 10th, 25th, 75th and 90th percentiles) were extracted from tumors and from PTRs of 5 mm, 10 mm, 15 mm, and 20 mm in thickness with inclusion and exclusion of fat dominant pixels.
STATISTICAL TESTS:
ADC features were tested for prediction of pCR, both individually using Mann-Whitney U test and area under the receiver operating characteristic curve (AUC), and in combination in multivariable models with k-fold cross-validation. A p value < 0.05 was considered statistically significant.
RESULTS:
51 patients (47%) had pCR. Maximum ADC from PTR, measured after 2 and 4 cycles of NAST, was significantly lower in pCR patients (2.8 ± 0.69 vs 3.5 ± 0.94 mm2/s). The top-performing feature for prediction of pCR was the maximum ADC from the 5-mm fat-inclusive PTR after cycle 4 of NAST (AUC: 0.74; 95% confidence interval: 0.64, 0.84). Multivariable models of ADC features performed similarly for fat-inclusive and fat-exclusive peritumoral regions, with AUCs ranging from 0.68 to 0.72 for the cycle 2 and cycle 4 scans.
DATA CONCLUSION:
Quantitative apparent diffusion coefficient features from peritumoral regions may serve as early predictors of the response to neoadjuvant systemic therapy in triple-negative breast cancer.
INTRODUCTION
Triple-negative breast cancer (TNBC) accounts for between 10% to 15% of all breast cancers (1,2). Compared to other types of breast cancer, TNBC is more aggressive and more likely to present as high grade and with nodal spread (3). Owing to its lack of receptors, TNBC does not respond to conventional hormone-targeted therapies and is typically treated with neoadjuvant systemic therapy (NAST). Fewer than half of the patients with TNBC have a pathologic complete response (pCR) to NAST, and non-pCR status is a strong predictor of poor clinical outcome (4). Early prediction of the response to NAST is highly desirable as it could lead to improved patient outcome through triage. Patients predicted to have incomplete or no response (“non-pCR”) could be triaged to alternative treatments and patients with high likelihood of pCR could be triaged for de-escalation of their treatment regimens, potentially lessening treatment side effects and cost (5).
In breast cancer, the presence of peritumoral edema is known to correlate with poor outcome, such as lower distant-metastasis-free survival (6) and higher lymph node involvement (7,8). MRI is capable of a multifaceted assessment of the peritumoral region (PTR) because edema manifests as hyperintensity on T2-weighted imaging (9,10), enhancement on dynamic contrast-enhanced MRI (11), and high apparent diffusion coefficient (ADC) on diffusion-weighted imaging (DWI) (7,12). Notably, the presence of peritumoral edema assessed on T2-weighted imaging has been reported to be prognostic of negative outcomes in breast cancer (6,8,13). Peritumoral edema is seen more frequently in TNBC than in other types of breast cancer (6,14,15), although the potential clinical value of peritumoral edema assessed on T2-weighted images of TNBC is currently unclear (6,16,17).
Quantitative imaging biomarkers of the PTR have also shown promise for applications in breast cancer. Radiomic features of the PTR on dynamic contrast-enhanced MRI have shown promise as predictors of sentinel node metastases (18,19) and treatment response (11). ADC metrics from the PTR have been found to correlate with lymphovascular invasion (7,20–22), molecular subtype (23–25), lymph node metastasis (22,25,26), and tumor size and histological grade (22). However, conventional DWI is not recommended for measurements from regions smaller than 2 cm owing to its geometric distortion and relatively low spatial resolution (27). Advanced DWI techniques allow higher spatial resolution and less image distortion and thus have potential to improve assessment of the PTRs by providing better definition of the tumor margins and fine anatomic structures in comparison to conventional DWI (28–30).
Reduced-field-of-view (rFOV) DWI in particular has shown promise for breast cancer assessment as it reduces echo planar imaging artifacts by reducing the echo train length for a given spatial resolution and thereby shortening the total data sampling time. This improves spatial distortion of DWI images for better ADC measurements in tumor and peritumoral regions in comparison to standard field of view DWI. (31,32). A preliminary report in a small group of patients (n = 7) showed that ADC metrics from the PTR by higher-resolution rFOV DWI had promise for assessment of treatment response (30).
Therefore, the aim of this study was to investigate if quantitative ADC features from PTRs, derived from rFOV DWI, can help characterize the peritumoral edema and be predictive of the response to NAST in TNBC.
MATERIALS AND METHODS
Patients
This study enrolled 108 treatment-naïve patients with biopsy-confirmed clinical stage I-III TNBC between December 2015 and September 2020 in our Institutional Review Board-approved and Health Insurance Portability and Accountability Act-compliant prospective clinical trial ARTEMIS (“A Robust TNBC Evaluation FraMework to Improve Survival”; NCT02276443). All patients provided written informed consent. All patients received NAST and underwent an MRI scan at baseline (BL), and after 2 cycles (C2 scan) and 4 cycles (C4 scan) of treatment. The C2 scan was optional. NAST consisted of dose-dense doxorubicin and cyclophosphamide for 4 cycles followed by paclitaxel every 2 weeks for 4 cycles or weekly for a total of 12 doses. The minimum tumor size in all patients at baseline was 1.0 cm. All patients underwent surgery after the completion of NAST. Pathologic findings from surgery were used to classify patients as pCR or non-pCR, with pCR defined as having no residual invasive disease in the breast or the axillary lymph nodes.
MRI Acquisition
All MRI scans were conducted on a GE 3.0-T MR750w whole body scanner (Waukesha, WI) with an 8-channel phased array bilateral breast coil and with the patients in the prone position. Each MRI scan included an axial T2-weighted series, a dynamic contrast-enhanced MRI series, and an axial DWI series. The rFOV DWI series used the Field of view Optimized and Constrained Undistorted Single-Shot pulse sequence (33). This sequence employs a 2D spectral-spatially selective radiofrequency (RF) pulse in the presence of echo-planar shaped gradients for inner volume excitation. Combined with a slice selective refocusing RF pulse, this 2D RF pulse has an added advantage of fat suppression by placing the spatially-shifted fat outside the refocusing slice. A pre-excitation chemical-shift fat suppression pulse was also applied. Compared to conventional DWI, rFOV DWI allows a shorter echo train for a desired resolution, with reduced image blurring and reduced artifacts. Typical scan parameters for the rFOV DWI were as follows: TE/TR = 70/4000 ms, slices = 13-16, slice thickness = 4 mm, slice gap = 0 mm, FOV = 16 x 16 cm, acquisition matrix = 80 x 80, in-plane spatial resolution = 2 x 2 mm, scan duration = 5 minutes, and b-values [signal averages] = 100 [4] and either 800 [16] or 1000 [16] s/mm2. An example image from this series is presented in Figure 1A.
Figure 1.
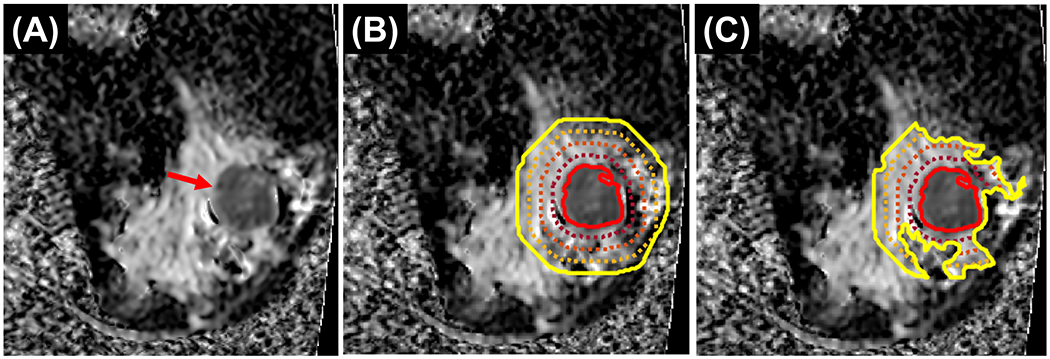
Peritumoral region segmentation in a 48-year-old woman with triple-negative breast cancer of the right breast. A, ADC map showing known 4.8 cm cancer at 9 o’clock position 8 cm from the nipple (red arrow). B, ADC maps with fat-inclusive peritumoral regions. C, ADC maps with fat-exclusive peritumoral regions. The solid red lines in B and C show the tumor boundary; the outer lines show boundaries of different peritumoral region thicknesses: solid yellow line – 20 mm, the inner dashed orange line – 15 mm, dashed red line – 10 mm, and dashed maroon line - 5 mm.
Image Analysis
ADC maps were generated from the acquired rFOV DWI images using a linear solution of a mono-exponential model with the signals from the images at b100 and at a higher b-value (either b800 or b1000; Equation (1)) (34).
| (1) |
where S100 is the signal from the b=100 image, Shigh is the signal from the higher b-value image, and bhigh is the higher b-value.
Tumor segmentation was performed using ImageI, a graphical user interface-based software developed in-house for image analyses. ImageI features importing/exporting Digital Imaging and Communications in Medicine-compatible images and manual and semi-automatic contouring of image regions of interest (35). Two fellowship-trained breast radiologists (RMMM and AHA, with 3 and 5 years of experience, respectively) were blinded to the patient outcome and, in the order of trial enrollment, performed consensus segmentations of the entire tumor across all slices on ADC maps for all scans, excluding regions of necrosis or biopsy clip artifacts. Tumor segmentations were reviewed and finalized by a radiologist with 20 years of experience (GMR). If tumors were not visible on the C2 scan or the C4 scan, the tumor bed was contoured. The tumor volume on rFOV DWI (TVDWI) was calculated as the summed volume of the segmented tumor voxels for each scan. PTRs were automatically generated in ImageI by propagating outwards from the tumor boundaries to thicknesses of 5 mm, 10 mm, 15 mm, and 20 mm (with each of the larger PTRs inclusive of the smaller ones but exclusive of the tumor itself; Figure 1B). Additionally, fat-dominant voxels with low signal intensity on the b100 images were excluded from the PTRs using a histogram-based thresholding tool to create a set of fat-exclusive PTRs (Figure 1C).
For each scan, a set of 11 first-order histogram features were extracted from the ADC map for the tumor and each PTR thickness for fat-inclusive and fat-exclusive PTRs. These histogram features were as follows: minimum, maximum, mean, median, standard deviation, kurtosis, skewness, and 10th, 25th, 75th, and 90th percentiles. Voxels with ADC of 0 or lower were excluded from calculation of these features. Both relative and absolute changes from the baseline scan to the C2 scan and the C4 scan were calculated for PTR ADC features and TVDWI. A total of 495 features were extracted for analysis.
Statistical Analysis
For each ADC feature and TVDWI, differences between pCR and non-pCR patients were tested using the Mann-Whitney U test. Multiple hypothesis testing was accounted for by controlling the false discovery rate (FDR) at 5%. Features with FDR-adjusted Mann-Whitney p values less than 0.05 were considered statistically significant. Univariable analysis was also performed to find the area under the receiver operating characteristic curve (AUC) for predicting pCR status.
TVDWI measurements which reached statistical significance by this criterion were then tested as confounders of the ADC features that reached the level of statistical significance at the same scan. This test was performed with multivariable logistic regression using the “glm” function in R (version 3.6.3, Vienna, Austria) (36).
Due to the limited sample size, all patient samples were used in multivariable analyses by penalized logistic regression with k-fold cross-validation. Feature selection and model building were performed with the packages “caret”, “glmnet”, and “pROC” in R (version 3.6.3, Vienna, Austria) (36) using logistic regression with the elastic net penalty, which is a hybrid of L1 and L2 penalties, which was implemented in “glmnet” R package. L1 and L2 penalty weight tuning was performed through the “caret” R package. Elastic net models balance sparsity and predictive performance, and may select groups of correlated features. Five-fold cross-validation, with random data splitting and 5 repetitions, was used for the BL, C2, and C4 models, respectively. Average AUC and standard error were calculated for each model. PTR and tumor ADC features were considered for fat-inclusive and fat-exclusive regions separately. These evaluations were performed for each of the scan timepoints with relative and absolute changes in ADC features from BL.
To evaluate possible redundancy between ADC features and TVDWI, model feature selection was repeated with TVDWI included in multivariable models. Displacement of ADC features from the model in favor of TVDWI was considered an indication of redundancy between the two.
We assessed the robustness of PTR ADC features with respect to the selected PTR thickness via multivariable models that were fitted using combined fat-inclusive and fat-exclusive ADC features from only the 5-mm PTR. Initially, five-fold cross validation was used to select model features. These 5 mm PTR model features were then fitted to the entire subject population to create a naïve and overfitted model. Then, the AUC performance of these overfitted models was reassessed using the same PTR histogram features but selected instead from the 10-mm, 15-mm, or 20-mm PTR (e.g., 10-mm ADC kurtosis was substituted for 5-mm ADC kurtosis). The aforementioned sensitivity analysis allowed us to evaluate the effect of inter-reader variability, specifically tumor boundary delineation on PTR ADC features and test the potential influence of this variability on model performance.
RESULTS
Fifty one of the 108 patients (47%) had pCR and 57 had non-pCR. Patient characteristics are summarized in Table 1. Not all patients underwent the scheduled MRI scans at all the timepoints. The numbers of baseline, C2, and C4 scans obtained for each patient group are shown in Table 1. The optional C2 scan was acquired in 52 of the 108 patients.
Table 1.
Characteristics of patients with triple negative breast cancer who received neoadjuvant systemic therapy.
| Characteristic | N (%) |
|---|---|
| Number of patients | 108 |
| Median age (range), y | 52 (24-79) |
| T-stage | |
| 1 | 23 (21) |
| 2 | 72 (67) |
| 3 | 10 (9) |
| 4 | 3 (3) |
| N stage | |
| 0 | 67 (62) |
| 1 | 28 (26) |
| 2 | 3 (3) |
| 3 | 10 (9) |
| Tumor histological type | |
| Invasive ductal carcinoma | 95 (88) |
| Invasive lobular carcinoma | 1 (1) |
| Invasive mammary carcinoma | 1 (1) |
| Metaplastic | 9 (9) |
| Apocrine | 2 (1) |
| Type of surgery | |
| Mastectomy | 37 (34) |
| Segmentectomy | 71 (66) |
| Number of scans | |
| Baseline | 108 |
| Cycle 2 | 52 |
| Cycle 4 | 90 |
| Postsurgery pathology findings | |
| pCR | 51 (47) |
| non-pCR | 57 (53) |
Univariable Analysis
By the univariable analysis, 7 PTR ADC features (Table 2) were significantly different between the pCR and the non-pCR groups. ADC features that differed significantly between the pCR and the non-pCR groups were present from each PTR thickness (5, 10, 15, and 20 mm). The top-performing ADC feature was the maximum ADC of the fat-inclusive 5-mm PTR measured at the C4 scan (AUC: 0.74; 95% CI: 0.64, 0.84). The remaining significant features were also from the C4 scan and included maximum ADC from both fat-inclusive and fat-exclusive PTRs and the ADC standard deviation from fat-inclusive PTRs. Neither C2 scan features nor the relative tumor volume change from the baseline scan to the C2 scan were significant by univariate analysis. However, the analysis was likely underpowered owing to the small number of C2 scans (Table 1). No features from the baseline scan and no ADC features from the tumors were significant by the univariable analysis (Supplementary Material).
Table 2:
Top Performing Peritumoral Region Apparent Diffusion Coefficient Features by Univariable Analysis for Prediction of a Pathologic Complete Response
| pCR | non-pCR | |||||
|---|---|---|---|---|---|---|
| Scan | PTR Thickness (mm) | Fat | Feature | AUC (95% CI) Mann Whitney U Test |
ADC (x10−3 mm2/s) |
ADC (x10−3 mm2/s) |
| Cycle 4 | 5 | Excl. | Maximum | 0.72 (0.61, 0.82) P = 0.0348 |
2.7 ± 0.55 | 3.3 ± 0.90 |
| Cycle 4 | 5 | Incl. | Maximum | 0.74 (0.64, 0.84) P = 0.0348 |
2.8 ± 0.69 | 3.5 ± 0.94 |
| Cycle 4 | 5 | Incl. | SD | 0.72 (0.61, 0.82) P = 0.0348 |
0.46 ± 0.09 | 0.53 ± 0.08 |
| Cycle 4 | 15 | Incl. | SD | 0.72 (0.61, 0.83) P = 0.0348 |
0.49 ± 0.09 | 0.57 ± 0.09 |
| Cycle 4 | 20 | Incl. | SD | 0.73 (0.62, 0.83) P = 0.0348 |
0.49 ± 0.09 | 0.57 ± 0.09 |
| Cycle 4 | 10 | Excl. | Maximum | 0.71 (0.61, 0.82) P = 0.0375 |
2.8 ± 0.65 | 3.4 ± 0.93 |
| Cycle 4 | 10 | Incl. | SD | 0.71 (0.61,0.82) P = 0.0375 |
0.49 ± 0.09 | 0.55 ± 0.09 |
AUC = area under the receiver operating characteristic curve, CI = confidence interval, SD = standard deviation
When TVDWI from the C4 scan was considered as a confounder of significant ADC features as predictors, only 4 features remained significant independent of TVDWI: the ADC standard deviations from the fat-inclusive 5, 10, 15, and 20 mm PTRs (Figure 2). When TVDWI alone was considered as a predictor, only TVDWI at C4 was significantly predictive of response (AUC: 0.73; 95% CI: 0.63, 0.84).
Figure 2.

Dot plots and Mann Whitney p-values of the 4 volume-independent peritumoral region (PTR) apparent diffusion coefficient (ADC) features compared using the area under the receiver operating characteristic curve (AUC) between patients with a pathologic complete response (pCR) and without a pCR (“non-pCR”) for both the training and testing sets. A, Cycle 4 fat-inclusive 5-mm ADC standard deviation (SD). B, Cycle 4 fat-inclusive 10-mm ADC SD. C, Cycle 4 fat-inclusive 15-mm ADC SD. D, Cycle 4 fat-inclusive 20-mm ADC SD.
Multivariable Analysis
For all scan timepoints, fat-inclusive models performed similarly in comparison to fat-exclusive models (Table 3). Top performance was seen for models based on ADC features from fat-exclusive PTRs on the C2 scan (AUC: 0.70; standard error: 0.06) and ADC features from fat-exclusive PTRs on the C4 scan (AUC: 0.70; standard error: 0.05). The ADC features selected in all models typically showed good performance in the univariable analysis as well, with 5 of the 7 significant features by the univariable analysis selected as features in the multivariable models (Supplementary Material). Baseline ADC features, regardless of whether they were from fat-inclusive or fat-exclusive PTRs, showed similar yet consistently lower performance in multivariable models (all AUCs were less than 0.67). A few tumor ADC features from C2 and C4 scans were selected by some multivariable models (Supplementary Material).
Table 3.
Multivariable Model Results for Prediction of Pathologic Complete Response: Models Based on Apparent Diffusion Coefficient Features from Fat-inclusive or Fat-exclusive Peritumoral Regions, each with and without inclusion of Segmented Tumor Volume as a Possible Feature
| Scan | Cross-validation | Fat-inclusive | Fat-exclusive |
|---|---|---|---|
| N-folds/N-repeats (patients) | AUC (SE) | AUC (SE) | |
| Baseline | 5/5 (108) | 0.66 (0.05) | 0.64 (0.05) |
|
| |||
| +TVDWI | 0.67 (0.05) | 0.65 (0.04) | |
|
| |||
| Cycle 2 | 5/5 (52) | 0.67 (0.06) | 0.70 (0.05) |
|
| |||
| +TVDWI | 0.69 (0.06) | 0.72 (0.06) | |
|
| |||
| Cycle 4 | 5/5 (90) | 0.69 (0.05) | 0.70 (0.05) |
|
| |||
| +TVDWI | 0.69 (0.05) | 0.69 (0.05) | |
AUC = area under the receiver operating characteristic curve, SE = standard error, TVDWI = tumor volume on diffusion-weighted imaging
Multivariable analysis was repeated with TVDWI included and it was selected as a feature only for the C2 scan fat-inclusive and fat-exclusive PTR models (Supplementary Material). However, only a subset of the ADC features selected in ADC features-only models were displaced from the models when TVDWI was added as a possible model feature. Addition of the TVDWI resulted in minimal change to the AUC performance of these models (Table 3).
Our multivariate models selected between 1 and 32 features. The elastic net model was able to select groups of highly correlated features, thereby maintaining sparsity and optimizing model performance without overfitting.
Robustness of Models by PTR Thickness
As would be expected, multivariable models fitted without cross-validation (i.e. using the entire patient set) using 5-mm PTR ADC features exclusively showed higher AUC (Table 4) in comparison to the predictive performance analyses with cross validation (Table 3). When subjected to sensitivity analysis by substituting 10-, 15-, or 20-mm ADC features into these models, AUC performance remained robust (Table 4).
Table 4.
Robustness of Multivariable Models with Respect to PTR Thickness.
| 5 mm | 10 mm | 15 mm | 20 mm | |
|---|---|---|---|---|
|
|
||||
| Scan | AUC (95% CI) | AUC (95% CI) | AUC (95% CI) | AUC (95% CI) |
| Baseline | 0.66 (0.55, 0.76) | 0.66 (0.55, 0.76) | 0.66 (0.55, 0.76) | 0.66 (0.55, 0.76) |
| Cycle 2 | 0.74 (0.60, 0.87) | 0.72 (0.59, 0.86) | 0.73 (0.59, 0.87) | 0.71 (0.57, 0.86) |
| Cycle 4 | 0.88 (0.81, 0.95) | 0.82 (0.73, 0.91) | 0.76 (0.66, 0.86) | 0.79 (0.70, 0.88) |
Note— For each scan, multivariable models were fit to ADC features from the 5 mm PTR and model performance was assessed with substitution of features from the 10, 15, and 20 mm PTR thicknesses.
AUC = area under the receiver operating characteristic curve, PTR = peritumoral region
DISCUSSION
Our study showed that quantitative apparent diffusion coefficient features from the peritumoral region on reduced-field-of-view diffusion-weighted imaging were able to predict pathologic complete response to neoadjuvant systemic therapy in triple-negative breast cancer. Top biomarker performance was achieved by the maximum ADC from the fat-inclusive 5 mm peritumoral region after 4 cycles of neoadjuvant systemic therapy. ADC features from the tumor and the BL scan did not show good performance. All multivariable models showed similar performance for fat-inclusive and fat-exclusive apparent diffusion coefficient features for predicting pathologic complete response. The addition of tumor volume by diffusion-weighted imaging as a model feature resulted in minimal improvement to AUC performance.
Higher PTR maximum ADC has been previously shown to be indicative of peritumoral edema (7). Previous studies of breast cancer that included all subtypes found that the presence of peritumoral edema, as assessed by T2-weighted imaging, was associated with lower distant-metastasis-free survival (6), with more axillary lymph node metastases (8), with increased aggressiveness (13), and with both poor response and lower recurrence-free survival (17). However, the value of peritumoral edema assessed on T2-weighted imaging as a negative prognostic finding for TNBC is not clear. Bae et al. found a direct correlation between the presence of peritumoral edema on T2-weighted imaging and the absence of pCR in 132 TNBC patients (17). Harada et al. applied a method for scoring edema across the full breast on T2-weighted imaging in 57 TNBC patients and did not find correlation with either pCR or Ki67 proliferation antigen levels (16). Song et al. performed a propensity-matching study of 147 women with distant metastasis and 147 women without distant metastasis and found no correlation between the presence of peritumoral edema on T2-weighted imaging and distant-metastasis-free survival for an analysis of 86 TNBC patients (6). These studies evaluated peritumoral edema on pretreatment MRI based only on visual inspection of T2 weighted images. In contrast, we performed quantitative evaluation of peritumoral edema based on ADC maps from rFOV DWI and at several different timepoints longitudinally during NAST. Our study did not find useful ADC features on the pretreatment scans for prediction of pCR. However, maximum ADC from the PTRs, which is assumed to indicate the presence and extent of peritumoral edema, was significantly higher for non-pCR than pCR after 2 and 4 cycles of NAST.
Our findings of ADC features from PTRs as predictors of response to NAST are in agreement with several studies that report ADC features from PTRs to correlate with negative prognostic factors including molecular subtype (23–25), tumor size and histological grade (22), lymphovascular invasion (7,20–22), and lymph node metastasis (22,25,26). Another study has evaluated ADC metrics from PTRs for assessment of treatment response with rFOV DWI, but in a smaller group of patients with all breast cancer subtypes (n = 7) (30). In that study, ADC features from PTRs and their change during treatment were examined and average ADC across the tumor boundary (from 2 mm inside the tumor boundary to 2 mm outside the tumor boundary) and at a distal PTR (9-11 mm from tumor boundary) correlated with response, consistent with our findings from a much larger cohort of only TNBC (30).
In our study, tumor ADC features were not useful for prediction of pCR by univariable analysis. The poor performance of tumor ADC features is in line with the findings of a previous study. Li et al., in the I-SPY 2 trial, showed that although ADC was useful for prediction of treatment response in some subtypes of breast cancer, it did not show strong predictive value for the TNBC subtype when measured at early timepoints (37).
Several studies have examined quantitative radiomic imaging biomarkers from PTRs of different thicknesses in breast cancers and found that features from each thickness correlated with molecular subtype (24,29); nuclear grade, Ki67 expression, and lymph node metastasis (29); treatment response (30,38); and tumor-infiltrating lymphocytes (30). Our study also found useful features from the different PTR thicknesses we investigated for prediction of NAST response in TNBC patients.
Kettunen et al. used several methods for drawing regions of interest to extract ADC measurements from the PTR and found that ADC metrics from the contouring method that included fatty tissue were most strongly correlated with lymph node metastasis (26). This parallels our univariable analysis findings that fat-inclusive PTR ADC features showed the best performance for predicting pCR. In particular, the ADC standard deviations from large, fat-inclusive PTRs performed well and were independent of the tumor volume. The cause for the correlation is unclear, although one recent study has reported that a greater volume of the tumor-fat interface is predictive of poor response in all-comers of breast cancer (39). Another study has found that tumors with a greater fraction of the tumor-fat interface were more likely to metastasize to axillary lymph nodes (40).
Although the tumor volume measurement by DWI is inferior to that by dynamic contrast-enhanced MRI owing to a lack of perfusion contrast and possible distortion from echo planar imaging, tumor volume measured by rFOV DWI may still serve as an approximate measure of tumor size. We found that the addition of tumor volume by rFOV DWI only marginally improved performance of multivariable models for predicting pCR. This, combined with the observation that tumor volume only displaced a small subset of ADC features from multivariable models, suggests that ADC features from PTRs are informative along with tumor volume for this purpose.
Limitations
First, our pilot study was conducted using only one imaging protocol on a single MRI scanner and in a single institution. Second, we did not directly investigate the inter-reader variability of our tumor segmentation or fat-exclusion methods. In the future, robustness of the peritumoral ADC measurements should be investigated further. It may be informative to perform analyses using clinical subgroups of TNBC; unfortunately, our study did not enroll a sufficient number of patients for subgroup analysis. Finally, cross-validation was used due to limited sample size, and validation in an independent testing set is warranted in a future study.
Conclusions
In conclusion, quantitative apparent diffusion coefficient features by reduced-field-of-view diffusion-weighted imaging from the peritumoral region of triple-negative breast cancers after 2 and 4 cycles of treatment showed value for prediction of pathologic complete response to neoadjuvant systemic therapy. Peritumoral regions with and without fat-dominant voxels showed similar performance for predicting response. Further validation of our findings in a larger population, in a multi-institutional setting, and correlation with long-term patient outcome are warranted.
Supplementary Material
Acknowledgements:
B.C.M. would like to acknowledge partial support from the American Legion Auxiliary Fellowship in Cancer Research. We thank Stephanie P. Deming from the Scientific Publications at The University of Texas MD Anderson Cancer Center for her help in editing and proofreading this document. This research was conducted at the MD Anderson Center for Advanced Biomedical Imaging in-part with equipment support from General Electric Healthcare.
Grant Support:
Supported by the National Institutes of Health/National Cancer Institute (Cancer Center Support Grant P30 CA016672); resources from the Biostatistics Resource Group were used.
Contributor Information
Benjamin C. Musall, Department of Imaging Physics, The University of Texas MD Anderson Cancer Center, Houston, Texas, USA
Beatriz E. Adrada, Department of Breast Imaging, The University of Texas MD Anderson Cancer Center, Houston, Texas, USA
Rosalind P. Candelaria, Department of Breast Imaging, The University of Texas MD Anderson Cancer Center, Houston, Texas, USA
Rania M.M. Mohamed, Department of Breast Imaging, The University of Texas MD Anderson Cancer Center, Houston, Texas, USA
Abeer H. Abdelhafez, Department of Breast Imaging, The University of Texas MD Anderson Cancer Center, Houston, Texas, USA
Jong Bum Son, Department of Imaging Physics, The University of Texas MD Anderson Cancer Center, Houston, Texas, USA
Jia Sun, Department of Biostatistics, The University of Texas MD Anderson Cancer Center, Houston, Texas, USA
Lumarie Santiago, Department of Breast Imaging, The University of Texas MD Anderson Cancer Center, Houston, Texas, USA
Gary J. Whitman, Department of Breast Imaging, The University of Texas MD Anderson Cancer Center, Houston, Texas, USA
Tanya W. Moseley, Department of Breast Imaging, The University of Texas MD Anderson Cancer Center, Houston, Texas, USA
Marion E. Scoggins, Department of Breast Imaging, The University of Texas MD Anderson Cancer Center, Houston, Texas, USA
Hagar S. Mahmoud, Department of Breast Imaging, The University of Texas MD Anderson Cancer Center, Houston, Texas, USA
Jason B. White, Department of Breast Medical Oncology, The University of Texas MD Anderson Cancer Center, Houston, Texas, USA.
Ken-Pin Hwang, Department of Imaging Physics, The University of Texas MD Anderson Cancer Center, Houston, Texas, USA
Nabil A. Elshafeey, Department of Breast Imaging, The University of Texas MD Anderson Cancer Center, Houston, Texas, USA
Medine Boge, Department of Breast Imaging, The University of Texas MD Anderson Cancer Center, Houston, Texas, USA
Shu Zhang, Department of Cancer Systems Imaging, The University of Texas MD Anderson Cancer Center, Houston, Texas, USA
Jennifer K. Litton, Department of Breast Medical Oncology, The University of Texas MD Anderson Cancer Center, Houston, Texas, USA
Vicente Valero, Department of Breast Medical Oncology, The University of Texas MD Anderson Cancer Center, Houston, Texas, USA
Debu Tripathy, Department of Breast Medical Oncology, The University of Texas MD Anderson Cancer Center, Houston, Texas, USA
Alastair M. Thompson, Division of Surgical Oncology, Baylor College of Medicine, Houston, Texas, USA
Clinton Yam, Department of Breast Medical Oncology, The University of Texas MD Anderson Cancer Center, Houston, Texas, USA
Peng Wei, Department of Biostatistics, The University of Texas MD Anderson Cancer Center, Houston, Texas, USA
Stacy L. Moulder, Department of Breast Medical Oncology, The University of Texas MD Anderson Cancer Center, Houston, Texas, USA
Mark D. Pagel, Departments of Cancer Systems Imaging and Imaging Physics, The University of Texas MD Anderson Cancer Center, Houston, Texas, USA
Wei T. Yang, Department of Breast Imaging, The University of Texas MD Anderson Cancer Center, Houston, Texas, USA.
Jingfei Ma, Department of Imaging Physics, The University of Texas MD Anderson Cancer Center, Houston, Texas, USA
Gaiane M. Rauch, Departments of Abdominal Imaging and Breast Imaging, The University of Texas MD Anderson Cancer Center, Houston, Texas, USA
References
- 1.Dent R, Trudeau M, Pritchard KI, et al. Triple-negative breast cancer: clinical features and patterns of recurrence. Clin Cancer Res 2007;13(15):4429–4434. [DOI] [PubMed] [Google Scholar]
- 2.Oakman C, Viale G, Di Leo A. Management of triple negative breast cancer. Breast 2010;19(5):312–321. [DOI] [PubMed] [Google Scholar]
- 3.Anders C, Carey LA. Understanding and treating triple-negative breast cancer. Oncology 2008;22(11):1233–1239. [PMC free article] [PubMed] [Google Scholar]
- 4.Bauer KR, Brown M, Cress RD, Parise CA, Caggiano V. Descriptive analysis of estrogen receptor (ER)-negative, progesterone receptor (PR)-negative, and HER2-negative invasive breast cancer, the so-called triple-negative phenotype: a population-based study from the California Cancer Registry. Cancer 2007;109(9):1721–1728. [DOI] [PubMed] [Google Scholar]
- 5.von Minckwitz G, Untch M, Blohmer JU, et al. Definition and impact of pathologic complete response on prognosis after neoadjuvant chemotherapy in various intrinsic breast cancer subtypes. J Clin Oncol 2012;30(15):1796–1804. [DOI] [PubMed] [Google Scholar]
- 6.Song SE, Shin SU, Moon HG, Ryu HS, Kim K, Moon WK. MR imaging features associated with distant metastasis-free survival of patients with invasive breast cancer: a case-control study. Breast Cancer Res Treat 2017;162(3):559–569. [DOI] [PubMed] [Google Scholar]
- 7.Moradi B, Gity M, Etesam F, Borhani A, Ahmadinejad N, Kazemi MA. Correlation of apparent diffusion coefficient values and peritumoral edema with pathologic biomarkers in patients with breast cancer. Clin Imaging 2020;68:242–248. [DOI] [PubMed] [Google Scholar]
- 8.Ahn HS, Jang M, Kim SM, La Yun B, Lee SH. Usefulness of preoperative breast magnetic resonance imaging with a dedicated axillary sequence for the detection of axillary lymph node metastasis in patients with early ductal breast cancer. Radiol Med 2019;124(12):1220–1228. [DOI] [PubMed] [Google Scholar]
- 9.Uematsu T Focal breast edema associated with malignancy on T2-weighted images of breast MRI: peritumoral edema, prepectoral edema, and subcutaneous edema. Breast Cancer 2015;22(1):66–70. [DOI] [PubMed] [Google Scholar]
- 10.Baltzer PA, Yang F, Dietzel M, et al. Sensitivity and specificity of unilateral edema on T2w-TSE sequences in MR-Mammography considering 974 histologically verified lesions. Breast J 2010;16(3):233–239. [DOI] [PubMed] [Google Scholar]
- 11.Braman NM, Etesami M, Prasanna P, et al. Intratumoral and peritumoral radiomics for the pretreatment prediction of pathological complete response to neoadjuvant chemotherapy based on breast DCE-MRI. Breast Cancer Res 2017;19(1):57. [DOI] [PMC free article] [PubMed] [Google Scholar]
- 12.Yili Z, Xiaoyan H, Hongwen D, et al. The value of diffusion-weighted imaging in assessing the ADC changes of tissues adjacent to breast carcinoma. BMC Cancer 2009;9(1):18. [DOI] [PMC free article] [PubMed] [Google Scholar]
- 13.Panzironi G, Moffa G, Galati F, Marzocca F, Rizzo V, Pediconi F. Peritumoral edema as a biomarker of the aggressiveness of breast cancer: results of a retrospective study on a 3 T scanner. Breast Cancer Res Treat 2020;181(1):53–60. [DOI] [PubMed] [Google Scholar]
- 14.Cheon H, Kim HJ, Kim TH, et al. Invasive breast cancer: prognostic value of peritumoral edema identified at preoperative MR imaging. Radiology 2018;287(1):68–75. [DOI] [PubMed] [Google Scholar]
- 15.Costantini M, Belli P, Distefano D, et al. Magnetic resonance imaging features in triple-negative breast cancer: comparison with luminal and HER2-overexpressing tumors. Clin Breast Cancer 2012;12(5):331–339. [DOI] [PubMed] [Google Scholar]
- 16.Harada TL, Uematsu T, Nakashima K, et al. Is the presence of edema and necrosis on T2WI pretreatment breast MRI the key to predict pCR of triple negative breast cancer? Eur Radiol 2020;30(6):3363–3370. [DOI] [PubMed] [Google Scholar]
- 17.Bae MS, Shin SU, Ryu HS, et al. Pretreatment MR imaging features of triple-negative breast cancer: association with response to neoadjuvant chemotherapy and recurrence-free survival. Radiology 2016;281(2):392–400. [DOI] [PubMed] [Google Scholar]
- 18.Liu C, Ding J, Spuhler K, et al. Preoperative prediction of sentinel lymph node metastasis in breast cancer by radiomic signatures from dynamic contrast-enhanced MRI. J Magn Reson Imaging 2019;49(1):131–140. [DOI] [PMC free article] [PubMed] [Google Scholar]
- 19.Choi EJ, Youk JH, Choi H, Song JS. Dynamic contrast-enhanced and diffusion-weighted MRI of invasive breast cancer for the prediction of sentinel lymph node status. J Magn Reson Imaging 2020;51(2):615–626. [DOI] [PubMed] [Google Scholar]
- 20.Mori N, Mugikura S, Takasawa C, et al. Peritumoral apparent diffusion coefficients for prediction of lymphovascular invasion in clinically node-negative invasive breast cancer. Eur Radiol 2016;26(2):331–339. [DOI] [PubMed] [Google Scholar]
- 21.Igarashi T, Furube H, Ashida H, Ojiri H. Breast MRI for prediction of lymphovascular invasion in breast cancer patients with clinically negative axillary lymph nodes. Eur J Radiol 2018;107:111–118. [DOI] [PubMed] [Google Scholar]
- 22.Okuma H, Sudah M, Kettunen T, et al. Peritumor to tumor apparent diffusion coefficient ratio is associated with biologically more aggressive breast cancer features and correlates with the prognostication tools. PLoS One 2020;15(6):e0235278. [DOI] [PMC free article] [PubMed] [Google Scholar]
- 23.Zhao M, Fu K, Zhang L, et al. Intravoxel incoherent motion magnetic resonance imaging for breast cancer: a comparison with benign lesions and evaluation of heterogeneity in different tumor regions with prognostic factors and molecular classification. Oncol Lett 2018;16(4):5100–5112. [DOI] [PMC free article] [PubMed] [Google Scholar]
- 24.Fan M, He T, Zhang P, et al. Diffusion-weighted imaging features of breast tumours and the surrounding stroma reflect intrinsic heterogeneous characteristics of molecular subtypes in breast cancer. NMR Biomed 2018;31(2):e3869. [DOI] [PubMed] [Google Scholar]
- 25.Kim EJ, Kim SH, Park GE, et al. Histogram analysis of apparent diffusion coefficient at 3.0t: Correlation with prognostic factors and subtypes of invasive ductal carcinoma. J Magn Reson Imaging 2015;42(6):1666–1678. [DOI] [PubMed] [Google Scholar]
- 26.Kettunen T, Okuma H, Auvinen P, et al. Peritumoral ADC values in breast cancer: region of interest selection, associations with hyaluronan intensity, and prognostic significance. Eur Radiol 2020;30(1):38–46. [DOI] [PMC free article] [PubMed] [Google Scholar]
- 27.Padhani AR, Liu G, Koh DM, et al. Diffusion-weighted magnetic resonance imaging as a cancer biomarker: consensus and recommendations. Neoplasia 2009;11(2):102–125. [DOI] [PMC free article] [PubMed] [Google Scholar]
- 28.Barentsz MW, Taviani V, Chang JM, et al. Assessment of tumor morphology on diffusion-weighted (DWI) breast MRI: diagnostic value of reduced field of view DWI. J Magn Reson Imaging 2015;42(6):1656–1665. [DOI] [PMC free article] [PubMed] [Google Scholar]
- 29.Shin HJ, Park JY, Shin KC, et al. Characterization of tumor and adjacent peritumoral stroma in patients with breast cancer using high-resolution diffusion-weighted imaging: correlation with pathologic biomarkers. Eur J Radiol 2016;85(5):1004–1011. [DOI] [PubMed] [Google Scholar]
- 30.McLaughlin RL, Newitt DC, Wilmes LJ, et al. High resolution in vivo characterization of apparent diffusion coefficient at the tumor-stromal boundary of breast carcinomas: a pilot study to assess treatment response using proximity-dependent diffusion-weighted imaging. J Magn Reson Imaging 2014;39(5):1308–1313. [DOI] [PMC free article] [PubMed] [Google Scholar]
- 31.Singer L, Wilmes LJ, Saritas EU, et al. High-resolution diffusion-weighted magnetic resonance imaging in patients with locally advanced breast cancer. Acad Radiol 2012;19(5):526–534. [DOI] [PMC free article] [PubMed] [Google Scholar]
- 32.Park JY, Shin HJ, Shin KC, et al. Comparison of readout segmented echo planar imaging (EPI) and EPI with reduced field-of-view diffusion-weighted imaging at 3T in patients with breast cancer. J Magn Reson Imaging 2015;42(6):1679–1688. [DOI] [PubMed] [Google Scholar]
- 33.Saritas EU, Cunningham CH, Lee JH, Han ET, Nishimura DG. DWI of the spinal cord with reduced FOV single-shot EPI. Magn Reson Med 2008;60(2):468–473. [DOI] [PubMed] [Google Scholar]
- 34.Padhani AR, Liu G, Mu Koh D, et al. Diffusion-weighted magnetic resonance imaging as a cancer biomarker: consensus and recommendations. Neoplasia 2009; 11(2):102–125. [DOI] [PMC free article] [PubMed] [Google Scholar]
- 35.Musall BC. Quantitative DWI as an early imaging biomarker of the response to chemoradiation in esophageal cancer. UT GSBS dissertations and theses (Open Access) 2017. [Google Scholar]
- 36.Team RDC. R: A language and environment for statistical computing. Vienna, Austria: R Foundation for Statistical Computing; 2010. [Google Scholar]
- 37.Li W, Newitt DC, Wilmes LJ, et al. Additive value of diffusion-weighted MRI in the I-SPY 2 TRIAL. J Magn Reson Imaging 2019;50(6):1742–1753. [DOI] [PMC free article] [PubMed] [Google Scholar]
- 38.Braman N, Prasanna P, Whitney J, et al. Association of peritumoral radiomics with tumor biology and pathologic response to preoperative targeted therapy for HER2 (ERBB2)-positive breast cancer. JAMA Netw Open 2019;2(4):e192561. [DOI] [PMC free article] [PubMed] [Google Scholar]
- 39.Cho HH, Park M, Park H, et al. The tumor-fat interface volume of breast cancer on pretreatment MRI is associated with a pathologic response to neoadjuvant chemotherapy. Biology 2020;9(11). [DOI] [PMC free article] [PubMed] [Google Scholar]
- 40.Obeid JP, Stoyanova R, Kwon D, et al. Multiparametric evaluation of preoperative MRI in early stage breast cancer: prognostic impact of peri-tumoral fat. Clin Transl Oncol 2017;19(2):211–218. [DOI] [PubMed] [Google Scholar]
Associated Data
This section collects any data citations, data availability statements, or supplementary materials included in this article.